Infographic Icons
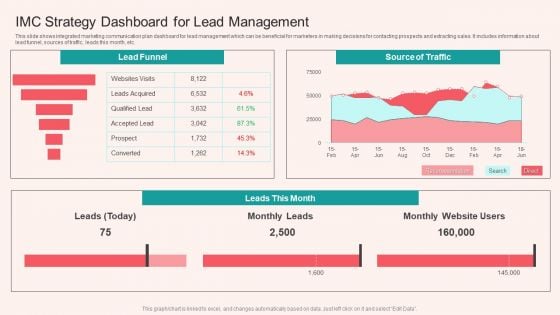
IMC Strategy Dashboard For Lead Management Infographics PDF
This slide shows integrated marketing communication plan dashboard for lead management which can be beneficial for marketers in making decisions for contacting prospects and extracting sales. It includes information about lead funnel, sources of traffic, leads this month, etc. Showcasing this set of slides titled IMC Strategy Dashboard For Lead Management Infographics PDF. The topics addressed in these templates are Source Of Traffic, Lead Funnel. All the content presented in this PPT design is completely editable. Download it and make adjustments in color, background, font etc. as per your unique business setting.
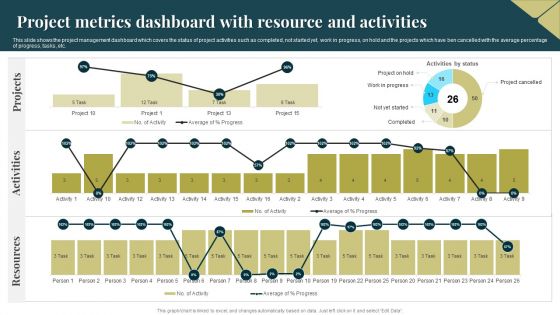
Project Metrics Dashboard With Resource And Activities Infographics PDF
This slide shows the project management dashboard which covers the status of project activities such as completed, not started yet, work in progress, on hold and the projects which have ben cancelled with the average percentage of progress, tasks, etc. Showcasing this set of slides titled Project Metrics Dashboard With Resource And Activities Infographics PDF. The topics addressed in these templates are Activities, Projects, Resources. All the content presented in this PPT design is completely editable. Download it and make adjustments in color, background, font etc. as per your unique business setting.
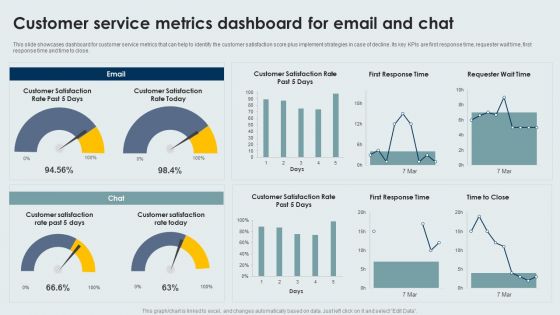
Customer Service Metrics Dashboard For Email And Chat Infographics PDF
This slide showcases dashboard for customer service metrics that can help to identify the customer satisfaction score plus implement strategies in case of decline. Its key KPIs are first response time, requester wait time, first response time and time to close. Pitch your topic with ease and precision using this Customer Service Metrics Dashboard For Email And Chat Infographics PDF. This layout presents information on Customer Service, Metrics Dashboard, Email And Chat. It is also available for immediate download and adjustment. So, changes can be made in the color, design, graphics or any other component to create a unique layout.
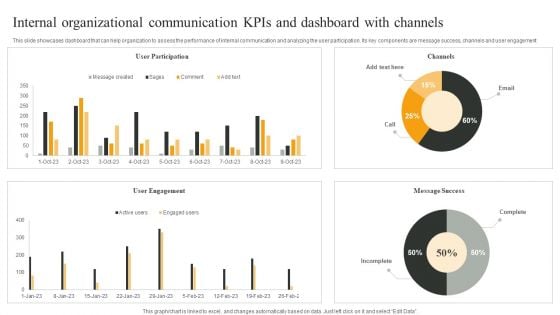
Internal Organizational Communication Kpis And Dashboard With Channels Infographics PDF
This slide showcases dashboard that can help organization to assess the performance of internal communication and analyzing the user participation. Its key components are message success, channels and user engagement. Pitch your topic with ease and precision using this Internal Organizational Communication Kpis And Dashboard With Channels Infographics PDF. This layout presents information on User Participation, User Engagement, Message Success. It is also available for immediate download and adjustment. So, changes can be made in the color, design, graphics or any other component to create a unique layout.
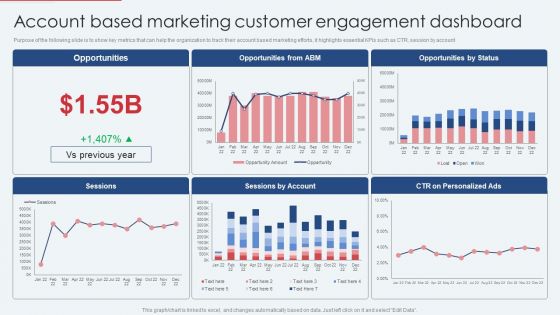
Account Based Marketing Customer Engagement Dashboard Infographics PDF
Purpose of the following slide is to show key metrics that can help the organization to track their account based marketing efforts, it highlights essential KPIs such as CTR, session by account. Boost your pitch with our creative Account Based Marketing Customer Engagement Dashboard Infographics PDF. Deliver an awe inspiring pitch that will mesmerize everyone. Using these presentation templates you will surely catch everyones attention. You can browse the ppts collection on our website. We have researchers who are experts at creating the right content for the templates. So you do not have to invest time in any additional work. Just grab the template now and use them.
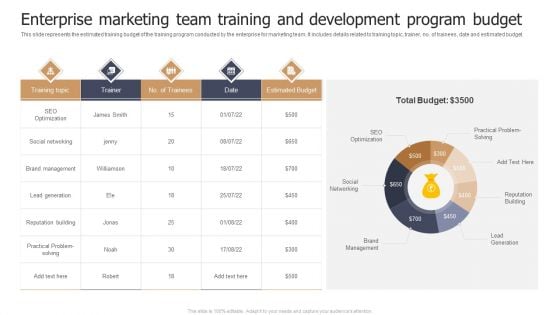
Enterprise Marketing Team Training And Development Program Budget Infographics PDF
This slide represents the estimated training budget of the training program conducted by the enterprise for marketing team. It includes details related to training topic, trainer, no. of trainees, date and estimated budget. Pitch your topic with ease and precision using this Enterprise Marketing Team Training And Development Program Budget Infographics PDF. This layout presents information on SEO Optimization, Social Networking, Brand Management. It is also available for immediate download and adjustment. So, changes can be made in the color, design, graphics or any other component to create a unique layout.
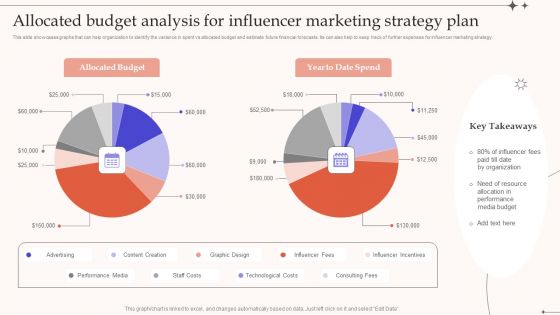
Allocated Budget Analysis For Influencer Marketing Strategy Plan Infographics PDF
This slide showcases graphs that can help organization to identify the variance in spent vs allocated budget and estimate future financial forecasts. Its can also help to keep track of further expenses for influencer marketing strategy.Showcasing this set of slides titled Allocated Budget Analysis For Influencer Marketing Strategy Plan Infographics PDF. The topics addressed in these templates are Allocated Budget, Date Organization, Performance Media Budget. All the content presented in this PPT design is completely editable. Download it and make adjustments in color, background, font etc. as per your unique business setting.
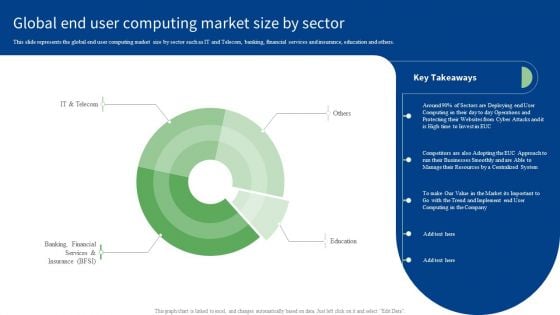
Global End User Computing Market Size By Sector Infographics PDF
This slide represents the global end user computing market size by sector such as IT and Telecom, banking, financial services and insurance, education and others. Boost your pitch with our creative Global End User Computing Market Size By Sector Infographics PDF. Deliver an awe-inspiring pitch that will mesmerize everyone. Using these presentation templates you will surely catch everyones attention. You can browse the ppts collection on our website. We have researchers who are experts at creating the right content for the templates. So you do not have to invest time in any additional work. Just grab the template now and use them.
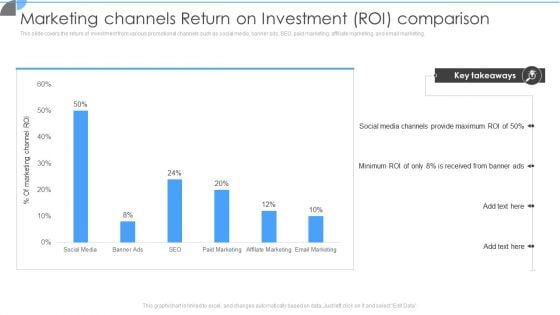
Marketing Channels Return On Investment ROI Comparison Infographics PDF
This slide covers the return of investment from various promotional channels such as social media, banner ads, SEO, paid marketing, affiliate marketing, and email marketing. The best PPT templates are a great way to save time, energy, and resources. Slidegeeks have 100 percent editable powerpoint slides making them incredibly versatile. With these quality presentation templates, you can create a captivating and memorable presentation by combining visually appealing slides and effectively communicating your message. Download Marketing Channels Return On Investment ROI Comparison Infographics PDF from Slidegeeks and deliver a wonderful presentation.
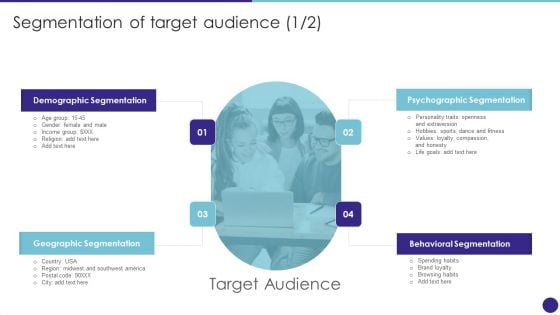
Segmentation Of Target Audience Retail Merchandising Techniques Infographics PDF
Are you in need of a template that can accommodate all of your creative concepts This one is crafted professionally and can be altered to fit any style. Use it with Google Slides or PowerPoint. Include striking photographs, symbols, depictions, and other visuals. Fill, move around, or remove text boxes as desired. Test out color palettes and font mixtures. Edit and save your work, or work with colleagues. Download Segmentation Of Target Audience Retail Merchandising Techniques Infographics PDF and observe how to make your presentation outstanding. Give an impeccable presentation to your group and make your presentation unforgettable.
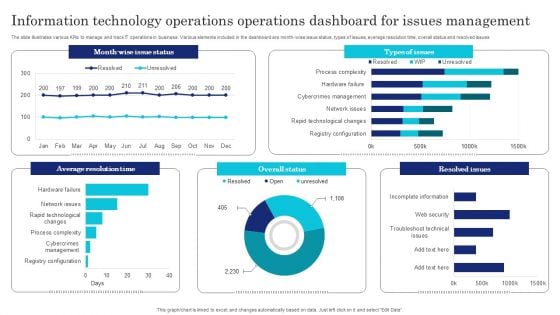
Information Technology Operations Operations Dashboard For Issues Management Infographics PDF
The slide illustrates various KPIs to manage and track IT operations in business. Various elements included in the dashboard are month-wise issue status, types of issues, average resolution time, overall status and resolved issues. Showcasing this set of slides titled Information Technology Operations Operations Dashboard For Issues Management Infographics PDF. The topics addressed in these templates are Information Technology Operations, Operations Dashboard, Issues Management. All the content presented in this PPT design is completely editable. Download it and make adjustments in color, background, font etc. as per your unique business setting.
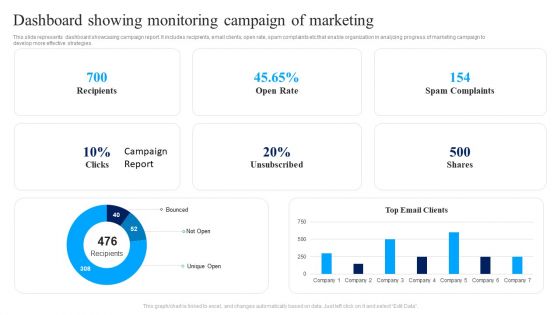
Dashboard Showing Monitoring Campaign Of Marketing Ppt Infographics PDF
This slide represents dashboard showcasing campaign report. It includes recipients, email clients, open rate, spam complaints etc that enable organization in analyzing progress of marketing campaign to develop more effective strategies. Showcasing this set of slides titled Dashboard Showing Monitoring Campaign Of Marketing Ppt Infographics PDF. The topics addressed in these templates are Recipients, Open Rate, Spam Complaints, Shares. All the content presented in this PPT design is completely editable. Download it and make adjustments in color, background, font etc. as per your unique business setting.
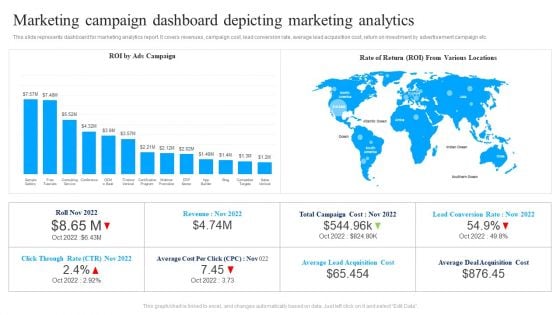
Marketing Campaign Dashboard Depicting Marketing Analytics Ppt Summary Infographics PDF
This slide represents dashboard for marketing analytics report. It covers revenues, campaign cost, lead conversion rate, average lead acquisition cost, return on investment by advertisement campaign etc. Pitch your topic with ease and precision using this Marketing Campaign Dashboard Depicting Marketing Analytics Ppt Summary Infographics PDF. This layout presents information on ROI Ads Campaign, Rate Of Return, Various Locations. It is also available for immediate download and adjustment. So, changes can be made in the color, design, graphics or any other component to create a unique layout.
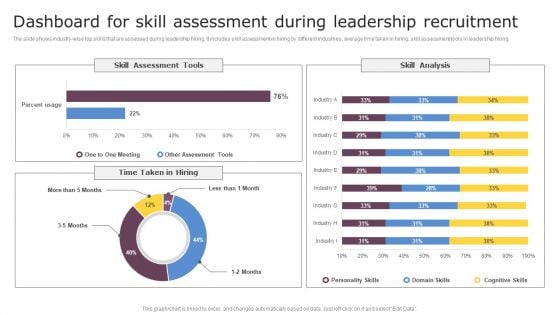
Dashboard For Skill Assessment During Leadership Recruitment Infographics PDF
The slide shows industry wise top skills that are assessed during leadership hiring. It includes skill assessment in hiring by different industries, average time taken in hiring, skill assessment tools in leadership hiring. Showcasing this set of slides titled Dashboard For Skill Assessment During Leadership Recruitment Infographics PDF. The topics addressed in these templates are Skill Assessment Tools, Skill Analysis. All the content presented in this PPT design is completely editable. Download it and make adjustments in color, background, font etc. as per your unique business setting.
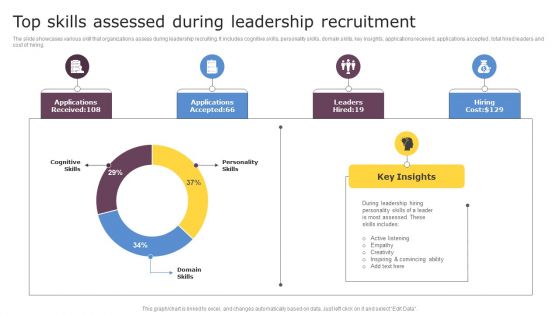
Top Skills Assessed During Leadership Recruitment Infographics PDF
The slide showcases various skill that organizations assess during leadership recruiting. It includes cognitive skills, personality skills, domain skills, key insights, applications received, applications accepted , total hired leaders and cost of hiring. Showcasing this set of slides titled Top Skills Assessed During Leadership Recruitment Infographics PDF. The topics addressed in these templates are Cognitive Skills, Personality Skills, Domain Skills. All the content presented in this PPT design is completely editable. Download it and make adjustments in color, background, font etc. as per your unique business setting.
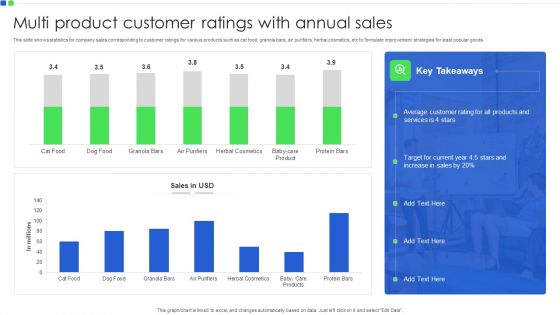
Multi Product Customer Ratings With Annual Sales Infographics PDF
This slide shows statistics for company sales corresponding to customer ratings for various products such as cat food, granola bars, air purifiers, herbal cosmetics, etc to formulate improvement strategies for least popular goods. Showcasing this set of slides titled Multi Product Customer Ratings With Annual Sales Infographics PDF. The topics addressed in these templates are Target For Current Year, Average Customer Rating. All the content presented in this PPT design is completely editable. Download it and make adjustments in color, background, font etc. as per your unique business setting.
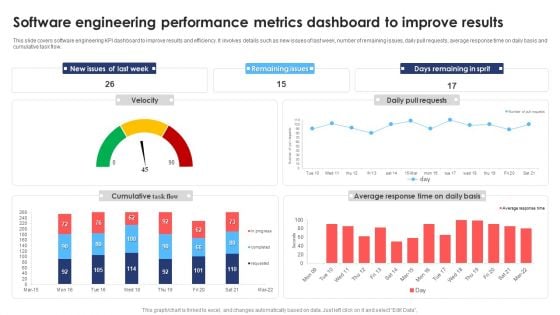
Software Engineering Performance Metrics Dashboard To Improve Results Infographics PDF
This slide covers software engineering KPI dashboard to improve results and efficiency. It involves details such as new issues of last week, number of remaining issues, daily pull requests, average response time on daily basis and cumulative task flow. Pitch your topic with ease and precision using this Software Engineering Performance Metrics Dashboard To Improve Results Infographics PDF. This layout presents information on Software Engineering Performance, Metrics Dashboard Improve Results. It is also available for immediate download and adjustment. So, changes can be made in the color, design, graphics or any other component to create a unique layout.
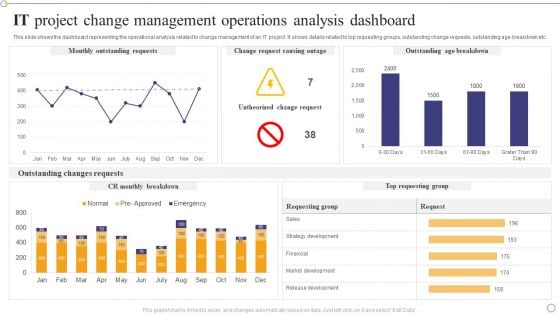
IT Project Change Management Operations Analysis Dashboard Infographics PDF
This slide shows the dashboard representing the operational analysis related to change management of an IT project. It shows details related to top requesting groups, outstanding change requests, outstanding age breakdown etc.Pitch your topic with ease and precision using this IT Project Change Management Operations Analysis Dashboard Infographics PDF. This layout presents information on Outstanding Requests, Outstanding Breakdown, Outstanding Changes. It is also available for immediate download and adjustment. So, changes can be made in the color, design, graphics or any other component to create a unique layout.
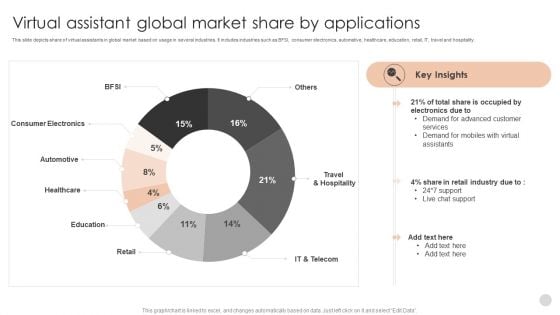
Virtual Assistant Global Market Share By Applications Infographics PDF
This slide depicts share of virtual assistants in global market based on usage in several industries. It includes industries such as BFSI, consumer electronics, automative, healthcare, education, retail, IT, travel and hospitality. Showcasing this set of slides titled Virtual Assistant Global Market Share By Applications Infographics PDF. The topics addressed in these templates are Consumer Electronics, Automotive, Demand Advanced. All the content presented in this PPT design is completely editable. Download it and make adjustments in color, background, font etc. as per your unique business setting.
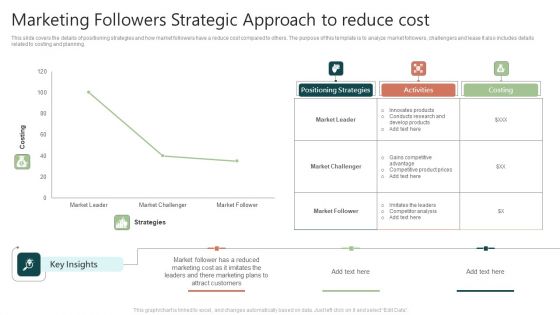
Marketing Followers Strategic Approach To Reduce Cost Infographics PDF
This slide covers the details of positioning strategies and how market followers have a reduce cost compared to others. The purpose of this template is to analyze market followers, challengers and lease It also includes details related to costing and planning. Pitch your topic with ease and precision using this Marketing Followers Strategic Approach To Reduce Cost Infographics PDF. This layout presents information on Positioning Strategies, Activities, Costing. It is also available for immediate download and adjustment. So, changes can be made in the color, design, graphics or any other component to create a unique layout.
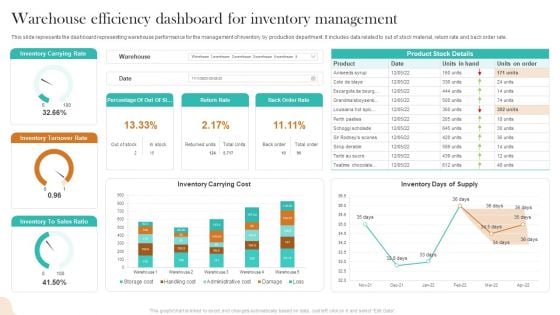
Warehouse Efficiency Dashboard For Inventory Management Infographics PDF
This slide represents the dashboard representing warehouse performance for the management of inventory by production department. It includes data related to out of stock material, return rate and back order rate. Showcasing this set of slides titled Warehouse Efficiency Dashboard For Inventory Management Infographics PDF. The topics addressed in these templates are Inventory Carrying Rate, Inventory Turnover Rate, Inventory Carrying Cost. All the content presented in this PPT design is completely editable. Download it and make adjustments in color, background, font etc. as per your unique business setting.

Stakeholders Management Strategy With Engagement Dashboard Infographics PDF
The following slide displays key parameters to map involvement of stakeholders in the business by analyzing them on the basis of influence, interest and impact to monitor and improve overall communication strategies of organization. Pitch your topic with ease and precision using this Stakeholders Management Strategy With Engagement Dashboard Infographics PDF. This layout presents information on Influence, Interest, Impact. It is also available for immediate download and adjustment. So, changes can be made in the color, design, graphics or any other component to create a unique layout.
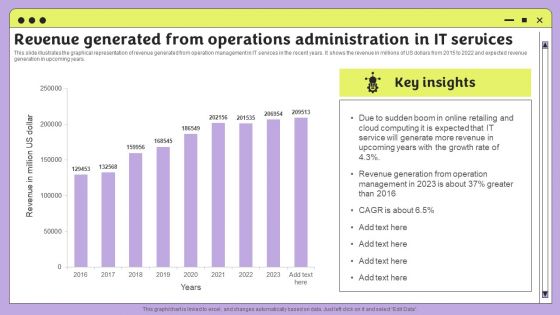
Revenue Generated From Operations Administration In It Services Infographics PDF
This slide illustrates the graphical representation of revenue generated from operation management in IT services in the recent years. It shows the revenue in millions of US dollars from 2015 to 2022 and expected revenue generation in upcoming years. Pitch your topic with ease and precision using this Revenue Generated From Operations Administration In It Services Infographics PDF. This layout presents information on Revenue, Management, Cloud Computing. It is also available for immediate download and adjustment. So, changes can be made in the color, design, graphics or any other component to create a unique layout.
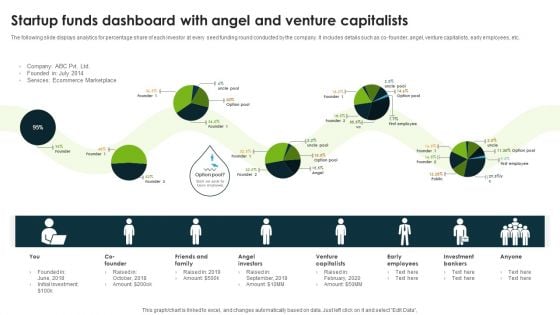
Startup Funds Dashboard With Angel And Venture Capitalists Infographics PDF
The following slide displays analytics for percentage share of each investor at every seed funding round conducted by the company. It includes details such as co founder, angel, venture capitalists, early employees, etc. Showcasing this set of slides titled Startup Funds Dashboard With Angel And Venture Capitalists Infographics PDF. The topics addressed in these templates are Angel Investors, Venture Capitalists, Early Employees. All the content presented in this PPT design is completely editable. Download it and make adjustments in color, background, font etc. as per your unique business setting.
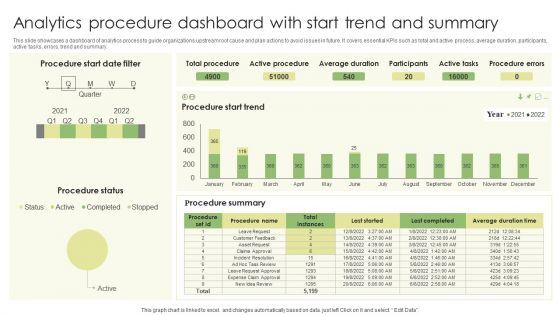
Analytics Procedure Dashboard With Start Trend And Summary Infographics PDF
This slide showcases a dashboard of analytics process to guide organizations upstream root cause and plan actions to avoid issues in future. It covers essential KPIs such as total and active process, average duration, participants, active tasks, errors, trend and summary. Showcasing this set of slides titled Analytics Procedure Dashboard With Start Trend And Summary Infographics PDF. The topics addressed in these templates are Procedure Status, Average Duration, Active Tasks. All the content presented in this PPT design is completely editable. Download it and make adjustments in color, background, font etc. as per your unique business setting.
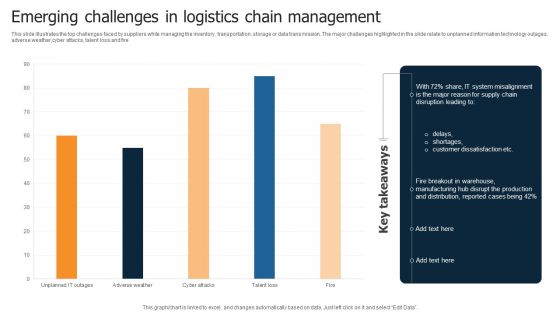
Emerging Challenges In Logistics Chain Management Infographics PDF
This slide illustrates the top challenges faced by suppliers while managing the inventory, transportation, storage or data transmission. The major challenges highlighted in the slide relate to unplanned information technology outages, adverse weather,cyber attacks, talent loss and fire Showcasing this set of slides titled Emerging Challenges In Logistics Chain Management Infographics PDF. The topics addressed in these templates are System Misalignment, Disruption Leading, Customer Dissatisfaction. All the content presented in this PPT design is completely editable. Download it and make adjustments in color, background, font etc. as per your unique business setting.
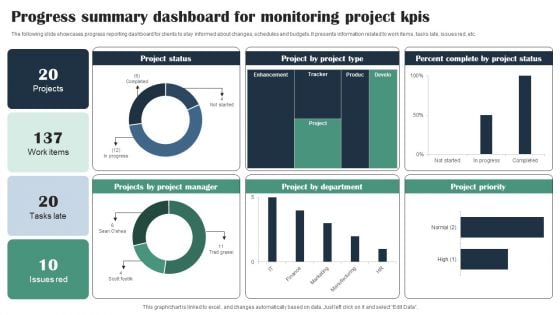
Progress Summary Dashboard For Monitoring Project Kpis Infographics PDF
The following slide showcases progress reporting dashboard for clients to stay informed about changes, schedules and budgets. It presents information related to work items, tasks late, issues red, etc. Pitch your topic with ease and precision using this Progress Summary Dashboard For Monitoring Project Kpis Infographics PDF. This layout presents information on Project Status, Project Manager, Project Type, Percent Complete. It is also available for immediate download and adjustment. So, changes can be made in the color, design, graphics or any other component to create a unique layout.
Website Leads Tracking Dashboard With Traffic Sources Infographics PDF
This slide showcases dashboard for lead generation that can help organziation to identify the traffic sources plus visitors and make changes in SEO of website. It also showcases key metrics that are bounce rate by week, visitors by user type, top channels by conversion, top campaign by conversion and top pages by conversion. Pitch your topic with ease and precision using this Website Leads Tracking Dashboard With Traffic Sources Infographics PDF. This layout presents information on Visitors User Type, Traffic Sources, Bounce Rate Week. It is also available for immediate download and adjustment. So, changes can be made in the color, design, graphics or any other component to create a unique layout.
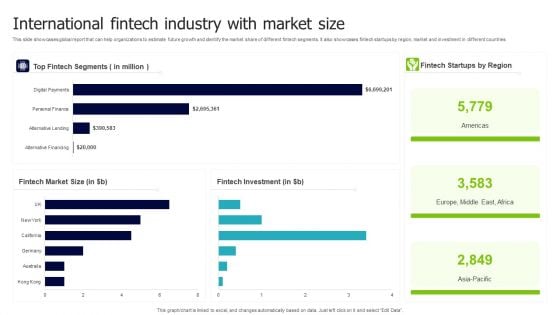
International Fintech Industry With Market Size Infographics PDF
This slide showcases global report that can help organizations to estimate future growth and identify the market share of different fintech segments. It also showcases fintech startups by region, market and investment in different countries. Showcasing this set of slides titled International Fintech Industry With Market Size Infographics PDF. The topics addressed in these templates are Fintech Segments, Region, Fintech Investment. All the content presented in this PPT design is completely editable. Download it and make adjustments in color, background, font etc. as per your unique business setting.
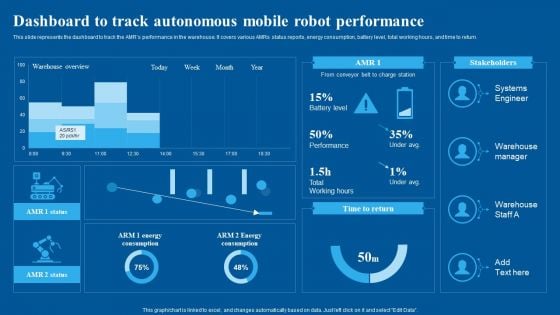
Dashboard To Track Autonomous Mobile Robot Performance Infographics PDF
This slide represents the dashboard to track the AMRs performance in the warehouse. It covers various AMRs status reports, energy consumption, battery level, total working hours, and time to return. Take your projects to the next level with our ultimate collection of Dashboard To Track Autonomous Mobile Robot Performance Infographics PDF. Slidegeeks has designed a range of layouts that are perfect for representing task or activity duration, keeping track of all your deadlines at a glance. Tailor these designs to your exact needs and give them a truly corporate look with your own brand colors they will make your projects stand out from the rest.
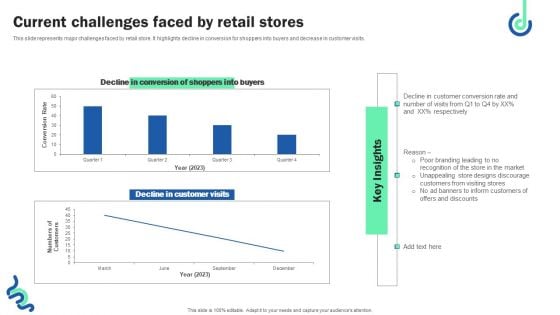
Current Challenges Faced By Retail Stores Infographics PDF
This slide represents major challenges faced by retail store. It highlights decline in conversion for shoppers into buyers and decrease in customer visits. Boost your pitch with our creative Current Challenges Faced By Retail Stores Infographics PDF. Deliver an awe inspiring pitch that will mesmerize everyone. Using these presentation templates you will surely catch everyones attention. You can browse the ppts collection on our website. We have researchers who are experts at creating the right content for the templates. So you do not have to invest time in any additional work. Just grab the template now and use them.
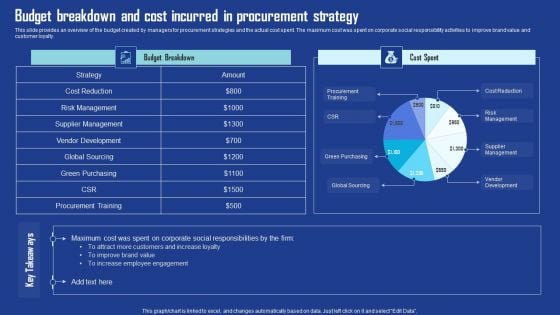
Budget Breakdown And Cost Incurred In Procurement Strategy Infographics PDF
This slide provides an overview of the budget created by managers for procurement strategies and the actual cost spent. The maximum cost was spent on corporate social responsibility activities to improve brand value and customer loyalty. From laying roadmaps to briefing everything in detail, our templates are perfect for you. You can set the stage with your presentation slides. All you have to do is download these easy to edit and customizable templates. Budget Breakdown And Cost Incurred In Procurement Strategy Infographics PDF will help you deliver an outstanding performance that everyone would remember and praise you for. Do download this presentation today.
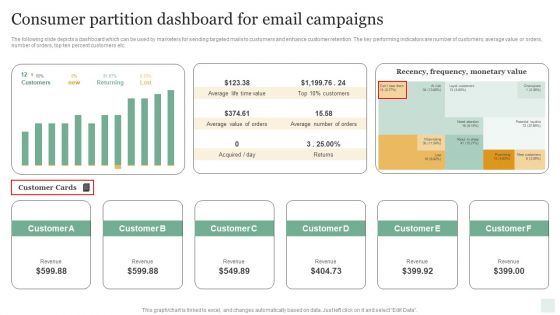
Consumer Partition Dashboard For Email Campaigns Infographics PDF
The following slide depicts a dashboard which can be used by marketers for sending targeted mails to customers and enhance customer retention. The key performing indicators are number of customers, average value or orders, number of orders, top ten percent customers etc. Showcasing this set of slides titled Consumer Partition Dashboard For Email Campaigns Infographics PDF. The topics addressed in these templates are Average Life Time Value, Average Value Of Orders, Returns, Average Number Of Orders. All the content presented in this PPT design is completely editable. Download it and make adjustments in color, background, font etc. as per your unique business setting.
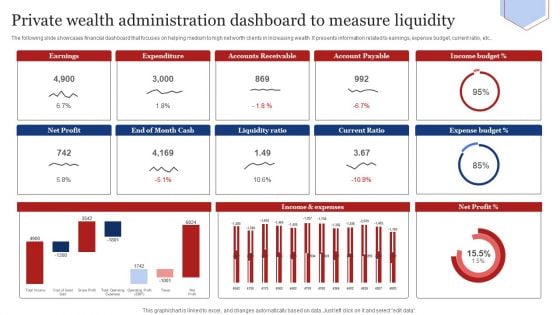
Private Wealth Administration Dashboard To Measure Liquidity Infographics PDF
The following slide showcases financial dashboard that focuses on helping medium to high net worth clients in increasing wealth. It presents information related to earnings, expense budget, current ratio, etc. Showcasing this set of slides titled Private Wealth Administration Dashboard To Measure Liquidity Infographics PDF. The topics addressed in these templates are Liquidity Ratio, Current Ratio, Expense Budget. All the content presented in this PPT design is completely editable. Download it and make adjustments in color, background, font etc. as per your unique business setting.
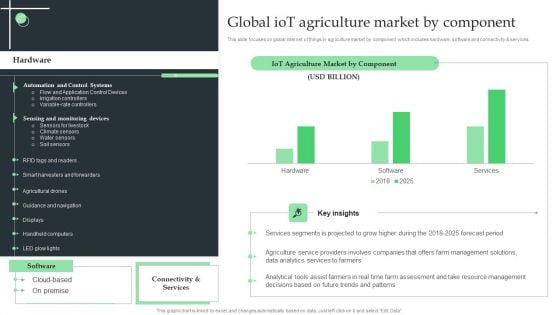
Global Iot Agriculture Market By Component Ppt Infographics Slides PDF
This slide focuses on global internet of things in agriculture market by component which includes hardware, software and connectivity and services. If your project calls for a presentation, then Slidegeeks is your go-to partner because we have professionally designed, easy-to-edit templates that are perfect for any presentation. After downloading, you can easily edit Global Iot Agriculture Market By Component Ppt Infographics Slides PDF and make the changes accordingly. You can rearrange slides or fill them with different images. Check out all the handy templates
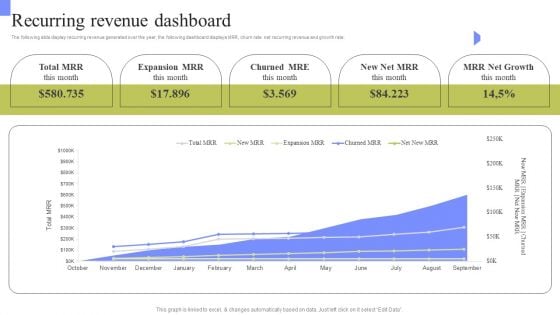
Periodic Revenue Model Recurring Revenue Dashboard Infographics PDF
The following slide display recurring revenue generated over the year, the following dashboard displays MRR, churn rate net recurring revenue and growth rate. Slidegeeks is one of the best resources for PowerPoint templates. You can download easily and regulate Periodic Revenue Model Recurring Revenue Dashboard Infographics PDF for your personal presentations from our wonderful collection. A few clicks is all it takes to discover and get the most relevant and appropriate templates. Use our Templates to add a unique zing and appeal to your presentation and meetings. All the slides are easy to edit and you can use them even for advertisement purposes.
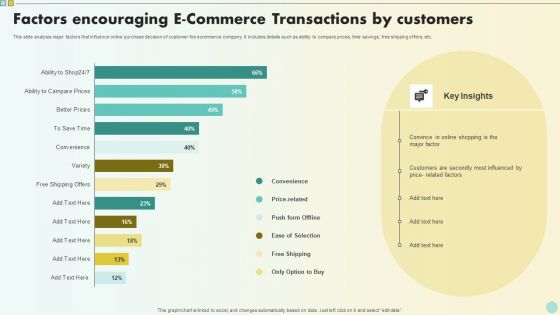
Factors Encouraging E Commerce Transactions By Customers Infographics PDF
This slide analysis major factors that influence online purchase decision of customer foe ecommerce company. It includes details such as ability to compare prices, time savings, free shipping offers, etc. Showcasing this set of slides titled Factors Encouraging E Commerce Transactions By Customers Infographics PDF. The topics addressed in these templates are Key Insights, Convenience, Push Form Offline. All the content presented in this PPT design is completely editable. Download it and make adjustments in color, background, font etc. as per your unique business setting.
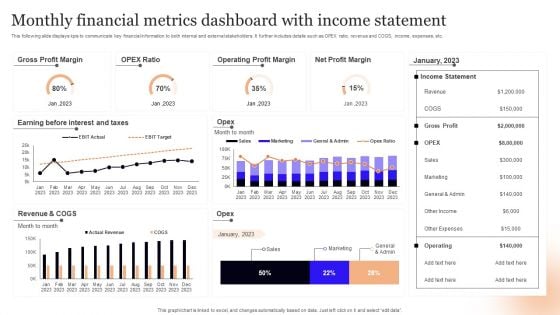
Monthly Financial Metrics Dashboard With Income Statement Infographics PDF
This following slide displays kpis to communicate key financial information to both internal and external stakeholders. It further includes details such as OPEX ratio, revenue and COGS, income, expenses, etc. Showcasing this set of slides titled Monthly Financial Metrics Dashboard With Income Statement Infographics PDF. The topics addressed in these templates are Gross Profit Margin, Taxes, Revenue. All the content presented in this PPT design is completely editable. Download it and make adjustments in color, background, font etc. as per your unique business setting.

Hotel Administration Software Dashboard For Business Intelligence Infographics PDF
This slide covers HMS dashboard. The purpose of this dashboard is to get an overview of hotel key metrics and to check financial status against targets. It includes elements such as reservations, check in guests, reservation type and housekeeping. Pitch your topic with ease and precision using this Hotel Administration Software Dashboard For Business Intelligence Infographics PDF. This layout presents information on Guest, Housekeeping, Reservation Type. It is also available for immediate download and adjustment. So, changes can be made in the color, design, graphics or any other component to create a unique layout.
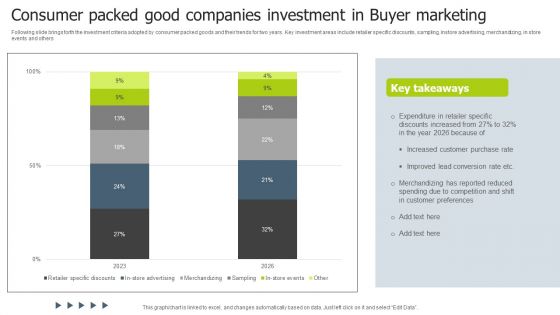
Consumer Packed Good Companies Investment In Buyer Marketing Infographics PDF
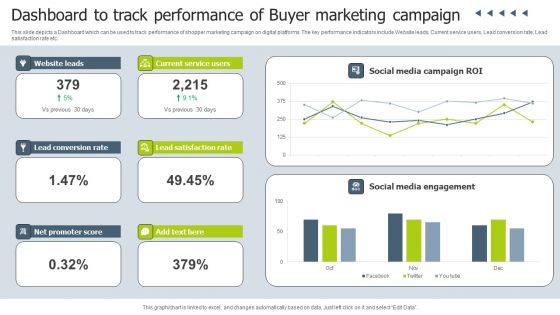
Dashboard To Track Performance Of Buyer Marketing Campaign Infographics PDF
This slide depicts a Dashboard which can be used to track performance of shopper marketing campaign on digital platforms. The key performance indicators include Website leads, Current service users, Lead conversion rate, Lead satisfaction rate etc. Pitch your topic with ease and precision using this Dashboard To Track Performance Of Buyer Marketing Campaign Infographics PDF. This layout presents information on Social Media Campaign, Social Media Engagement, Current Service Users. It is also available for immediate download and adjustment. So, changes can be made in the color, design, graphics or any other component to create a unique layout.
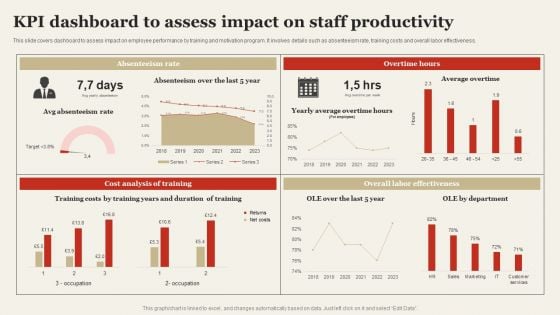
KPI Dashboard To Assess Impact On Staff Productivity Infographics PDF
This slide covers dashboard to assess impact on employee performance by training and motivation program. It involves details such as absenteeism rate, training costs and overall labor effectiveness. Make sure to capture your audiences attention in your business displays with our gratis customizable KPI Dashboard To Assess Impact On Staff Productivity Infographics PDF. These are great for business strategies, office conferences, capital raising or task suggestions. If you desire to acquire more customers for your tech business and ensure they stay satisfied, create your own sales presentation with these plain slides.
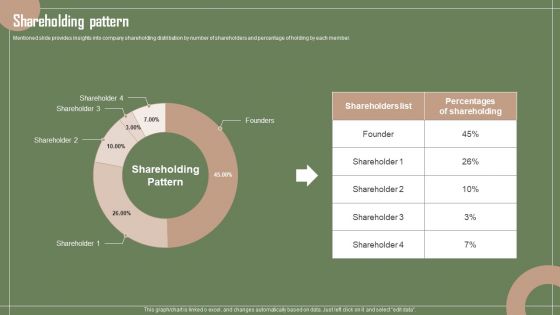
Data Automation Solution Investor Funding Presentation Shareholding Pattern Infographics PDF
Mentioned slide provides insights into company shareholding distribution by number of shareholders and percentage of holding by each member. Coming up with a presentation necessitates that the majority of the effort goes into the content and the message you intend to convey. The visuals of a PowerPoint presentation can only be effective if it supplements and supports the story that is being told. Keeping this in mind our experts created Data Automation Solution Investor Funding Presentation Shareholding Pattern Infographics PDF to reduce the time that goes into designing the presentation. This way, you can concentrate on the message while our designers take care of providing you with the right template for the situation.
Different Brands Performance Tracking Dashboard Ppt Gallery Infographics PDF
This slide provides information regarding different brands performance tracking dashboard in terms of brand metric, brand commitment, advertising metrics, and purchase metrics. Take your projects to the next level with our ultimate collection of Different Brands Performance Tracking Dashboard Ppt Gallery Infographics PDF. Slidegeeks has designed a range of layouts that are perfect for representing task or activity duration, keeping track of all your deadlines at a glance. Tailor these designs to your exact needs and give them a truly corporate look with your own brand colors they will make your projects stand out from the rest.
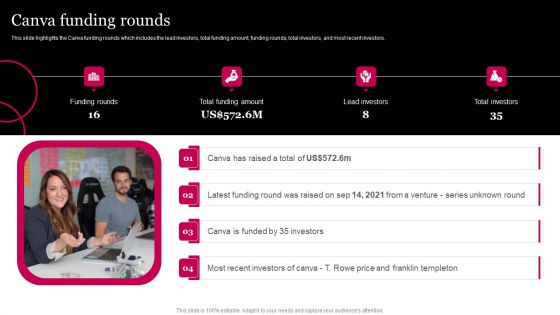
Picture Editing Company Outline Canva Funding Rounds Infographics PDF
This slide highlights the Canva raised capital and valuation from funding rounds which includes seed, series A, series B, series C, series D, and series D-1 rounds. This modern and well arranged Picture Editing Company Outline Canva Funding Rounds Infographics PDF provides lots of creative possibilities. It is very simple to customize and edit with the Powerpoint Software. Just drag and drop your pictures into the shapes. All facets of this template can be edited with Powerpoint no extra software is necessary. Add your own material, put your images in the places assigned for them, adjust the colors, and then you can show your slides to the world, with an animated slide included.
KPI Dashboard For Tracking Customer Retention Infographics PDF
This slide covers the dashboard for analyzing customer loyalty with metrics such as NPS, loyal customer rate, premium users, CLV, customer churn, revenue churn, net retention, MRR growth, etc. Slidegeeks is one of the best resources for PowerPoint templates. You can download easily and regulate KPI Dashboard For Tracking Customer Retention Infographics PDF for your personal presentations from our wonderful collection. A few clicks is all it takes to discover and get the most relevant and appropriate templates. Use our Templates to add a unique zing and appeal to your presentation and meetings. All the slides are easy to edit and you can use them even for advertisement purposes.
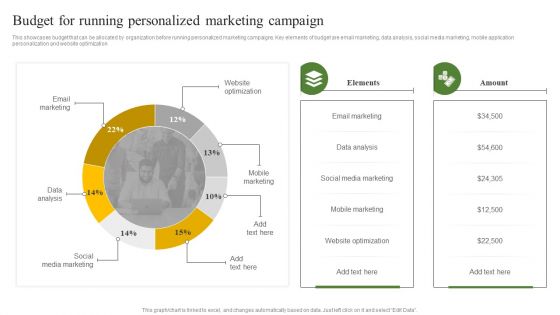
Budget For Running Personalized Marketing Campaign Ppt Infographics Images PDF
This showcases budget that can be allocated by organization before running personalized marketing campaigns. Key elements of budget are email marketing, data analysis, social media marketing, mobile application personalization and website optimization. This Budget For Running Personalized Marketing Campaign Ppt Infographics Images PDF is perfect for any presentation, be it in front of clients or colleagues. It is a versatile and stylish solution for organizing your meetings. The product features a modern design for your presentation meetings. The adjustable and customizable slides provide unlimited possibilities for acing up your presentation. Slidegeeks has done all the homework before launching the product for you. So, do not wait, grab the presentation templates today
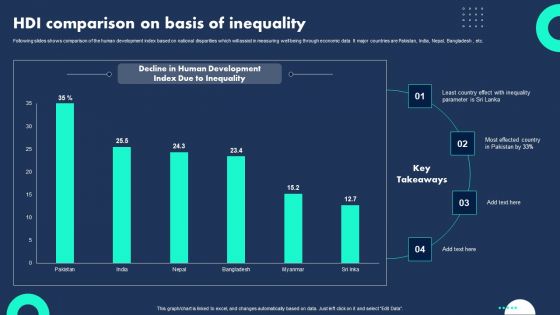
HDI Comparison On Basis Of Inequality Infographics PDF
Following slides shows comparison of the human development index based on national disparities which will assist in measuring well being through economic data It major countries are Pakistan, India, Nepal, Bangladesh , etc. Showcasing this set of slides titled HDI Comparison On Basis Of Inequality Infographics PDF. The topics addressed in these templates are Country Effect, Most Effected Country, Human Development. All the content presented in this PPT design is completely editable. Download it and make adjustments in color, background, font etc. as per your unique business setting.
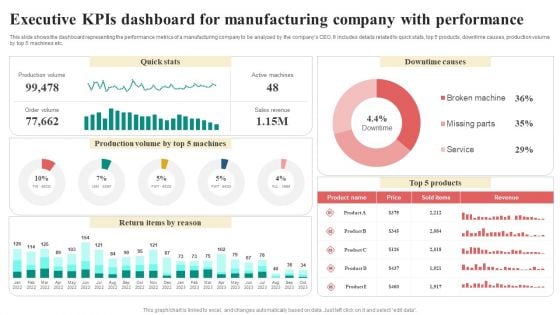
Executive Kpis Dashboard For Manufacturing Company With Performance Infographics PDF
This slide shows the dashboard representing the performance metrics of a manufacturing company to be analyzed by the companys CEO. It includes details related to quick stats, top 5 products, downtime causes, production volume by top 5 machines etc. Showcasing this set of slides titled Executive Kpis Dashboard For Manufacturing Company With Performance Infographics PDF. The topics addressed in these templates are Return Items By Reason, Quick Stats, Downtime Causes, Revenue. All the content presented in this PPT design is completely editable. Download it and make adjustments in color, background, font etc. as per your unique business setting.
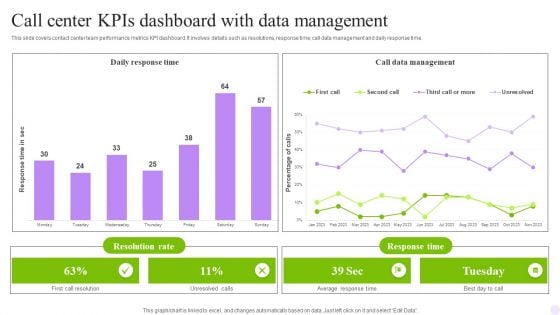
Call Center Kpis Dashboard With Data Management Infographics PDF
This slide covers contact center metrics KPI dashboard with call data details. It involves details such as total number of contacts handled, product sales, repeated calls and contact handles per day. Pitch your topic with ease and precision using this Call Center Kpis Dashboard With Data Management Infographics PDF. This layout presents information on Achieved, Contacts Handled, Repeated Calls. It is also available for immediate download and adjustment. So, changes can be made in the color, design, graphics or any other component to create a unique layout.
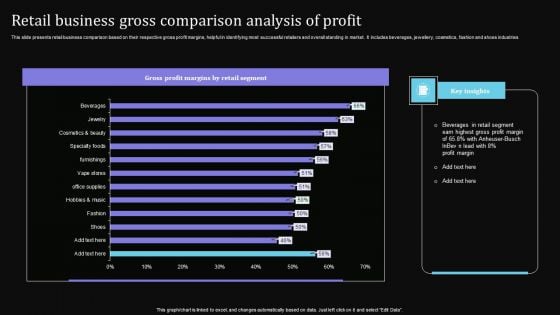
Retail Business Gross Comparison Analysis Of Profit Infographics PDF
This slide presents retail business comparison based on their respective gross profit margins, helpful in identifying most successful retailers and overall standing in market. It includes beverages, jewellery, cosmetics, fashion and shoes industries. Showcasing this set of slides titled Retail Business Gross Comparison Analysis Of Profit Infographics PDF. The topics addressed in these templates are Beverages Retail, Gross Profit Margin, Retail Segment. All the content presented in this PPT design is completely editable. Download it and make adjustments in color, background, font etc. as per your unique business setting.
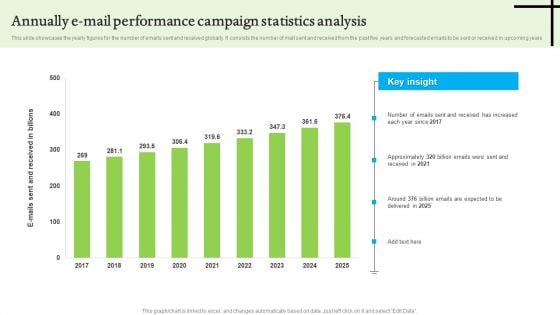
Annually E Mail Performance Campaign Statistics Analysis Infographics PDF
This slide showcases the yearly figures for the number of emails sent and received globally. It consists the number of mail sent and received from the past five years and forecasted emails to be sent or received in upcoming years. Showcasing this set of slides titled Annually E Mail Performance Campaign Statistics Analysis Infographics PDF. The topics addressed in these templates are Annually E Mail Performance, Campaign Statistics Analysis. All the content presented in this PPT design is completely editable. Download it and make adjustments in color, background, font etc. as per your unique business setting.
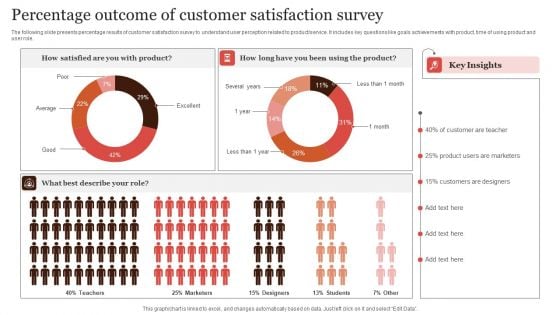
Percentage Outcome Of Customer Satisfaction Survey Infographics PDF
The following slide presents percentage results of customer satisfaction survey to understand user perception related to product or service. It includes key questions like goals achievements with product, time of using product and user role. Pitch your topic with ease and precision using this Percentage Outcome Of Customer Satisfaction Survey Infographics PDF. This layout presents information on Percentage Outcome, Customer Satisfaction Survey. It is also available for immediate download and adjustment. So, changes can be made in the color, design, graphics or any other component to create a unique layout.
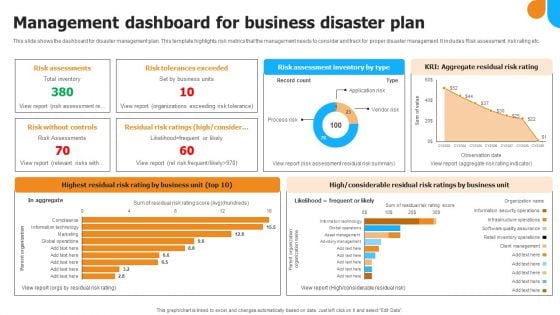
Management Dashboard For Business Disaster Plan Infographics PDF
This slide shows the dashboard for disaster management plan. This template highlights risk metrics that the management needs to consider and track for proper disaster management. It includes Risk assessment, risk rating etc. Showcasing this set of slides titled Management Dashboard For Business Disaster Plan Infographics PDF Graphics. The topics addressed in these templates are Risk Assessments, Risk Tolerances Exceeded, Risk Without Controls. All the content presented in this PPT design is completely editable. Download it and make adjustments in color, background, font etc. as per your unique business setting.
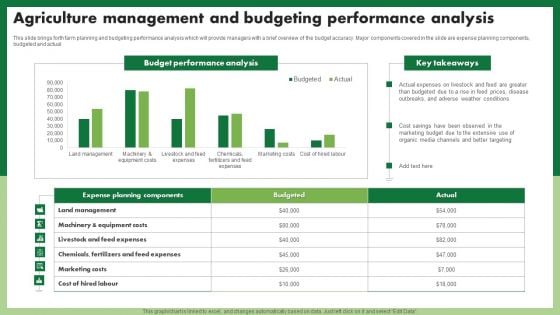
Agriculture Management And Budgeting Performance Analysis Infographics PDF
This slide brings forth farm planning and budgeting performance analysis which will provide managers with a brief overview of the budget accuracy. Major components covered in the slide are expense planning components, budgeted and actual. Showcasing this set of slides titled Agriculture Management And Budgeting Performance Analysis Infographics PDF. The topics addressed in these templates are Budget Performance Analysis. All the content presented in this PPT design is completely editable. Download it and make adjustments in color, background, font etc. as per your unique business setting.
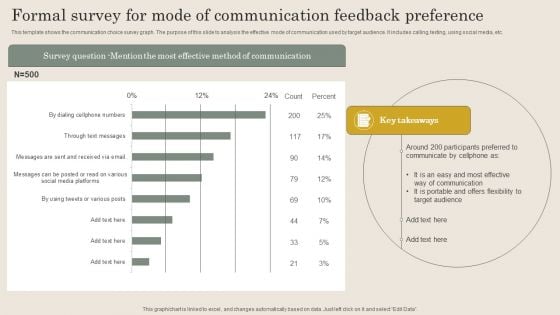
Formal Survey For Mode Of Communication Feedback Preference Infographics PDF
This template shows the communication choice survey graph. The purpose of this slide to analysis the effective mode of communication used by target audience. It includes calling, texting, using social media, etc. Showcasing this set of slides titled Formal Survey For Mode Of Communication Feedback Preference Infographics PDF. The topics addressed in these templates are Effective Way Communication, Offers Flexibility, Target Audience. All the content presented in this PPT design is completely editable. Download it and make adjustments in color, background, font etc. as per your unique business setting.
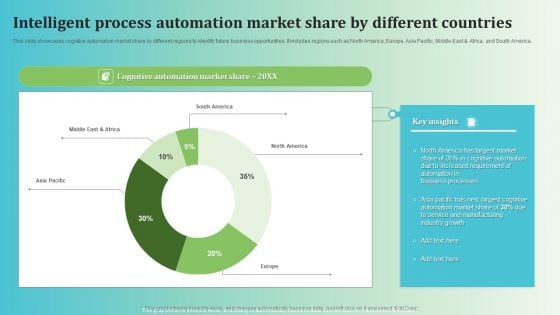
Intelligent Process Automation Market Share By Different Countries Infographics PDF
This slide showcases cognitive automation market share by different regions to identify future business opportunities. It includes regions such as North America, Europe, Asia Pacific, Middle East and Africa, and South America. Showcasing this set of slides titled Intelligent Process Automation Market Share By Different Countries Infographics PDF. The topics addressed in these templates are Cognitive Automation, Automation Business Processes, Manufacturing Industry Growth. All the content presented in this PPT design is completely editable. Download it and make adjustments in color, background, font etc. as per your unique business setting.
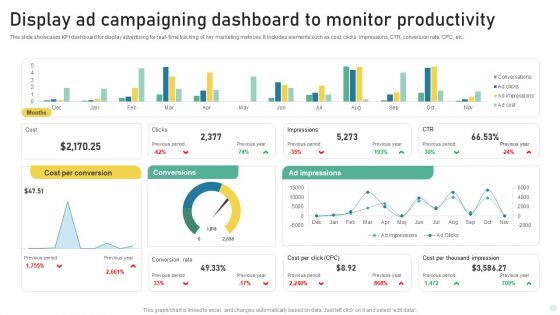
Display Ad Campaigning Dashboard To Monitor Productivity Infographics PDF
This slide showcases KPI dashboard for display advertising for real- time tracking of key marketing metrices, It includes elements such as cost, clicks, impressions, CTR, conversion rate, CPC, etc. Showcasing this set of slides titled Display Ad Campaigning Dashboard To Monitor Productivity Infographics PDF. The topics addressed in these templates are Cost Per Conversion, Conversions, Ad Impressions. All the content presented in this PPT design is completely editable. Download it and make adjustments in color, background, font etc. as per your unique business setting.
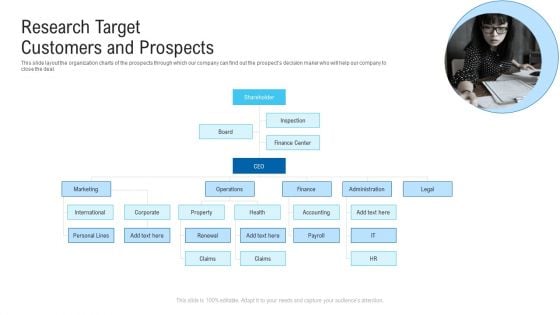
Research Target Customers And Prospects Ppt Infographics Show PDF
This slide layout the organization charts of the prospects through which our company can find out the prospects decision maker who will help our company to close the deal.Presenting research target customers and prospects ppt infographics show pdf. to provide visual cues and insights. Share and navigate important information on seven stages that need your due attention. This template can be used to pitch topics like shareholder, marketing, international, operations. In addtion, this PPT design contains high resolution images, graphics, etc, that are easily editable and available for immediate download.
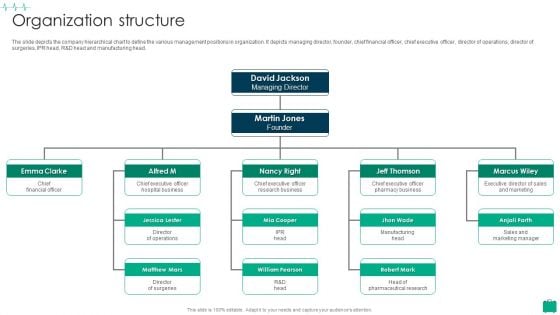
Healthcare Services Company Profile Organization Structure Infographics PDF
The slide depicts the company hierarchical chart to define the various management positions in organization. It depicts managing director, founder, chief financial officer, chief executive officer, director of operations, director of surgeries, IPR head, R and D head and manufacturing head.This is a Healthcare Services Company Profile Organization Structure Infographics PDF template with various stages. Focus and dispense information on five stages using this creative set, that comes with editable features. It contains large content boxes to add your information on topics like Hospital Business, Research Business, Pharmacy Business You can also showcase facts, figures, and other relevant content using this PPT layout. Grab it now.
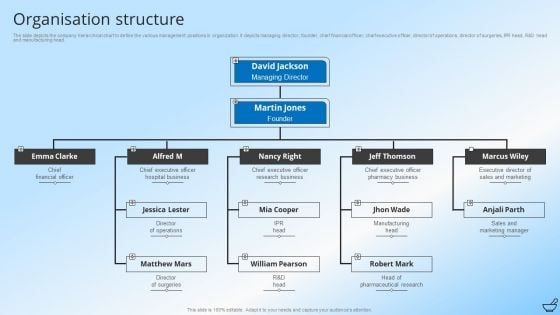
Pharmaceutical And Clinical Research Summary Organisation Structure Infographics PDF
The slide depicts the company hierarchical chart to define the various management positions in organization. It depicts managing director, founder, chief financial officer, chief executive officer, director of operations, director of surgeries, IPR head, R and D head and manufacturing head. This is a Pharmaceutical And Clinical Research Summary Organisation Structure Infographics PDF template with various stages. Focus and dispense information on four stages using this creative set, that comes with editable features. It contains large content boxes to add your information on topics like Sales And Marketing Manager, Manufacturing Head Chief, Financial Officer. You can also showcase facts, figures, and other relevant content using this PPT layout. Grab it now.
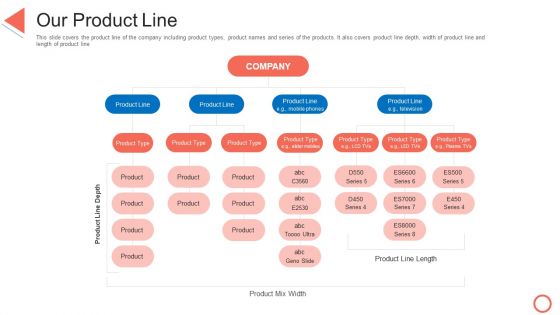
Our Product Line STP Approaches In Retail Marketing Infographics PDF
This slide covers the product line of the company including product types, product names and series of the products. It also covers product line depth, width of product line and length of product line. This is a our product line stp approaches in retail marketing infographics pdf template with various stages. Focus and dispense information on six stages using this creative set, that comes with editable features. It contains large content boxes to add your information on topics like our product line. You can also showcase facts, figures, and other relevant content using this PPT layout. Grab it now.
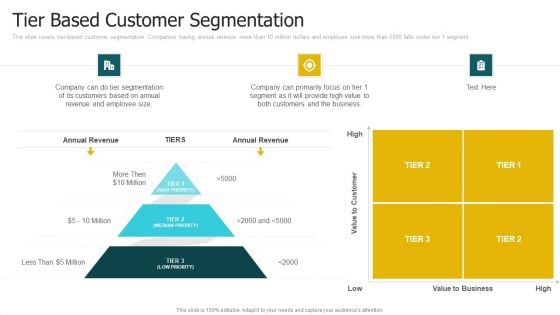
Tier Based Customer Segmentation Ppt Infographics Influencers PDF
This slide covers tier based customer segmentation. Companies having annual revenue more than 10 million dollars and employee size more than 5000 falls under tier 1 segment. This is a tier based customer segmentation ppt infographics influencers pdf template with various stages. Focus and dispense information on four stages using this creative set, that comes with editable features. It contains large content boxes to add your information on topics like value, customers, business, revenue. You can also showcase facts, figures, and other relevant content using this PPT layout. Grab it now.
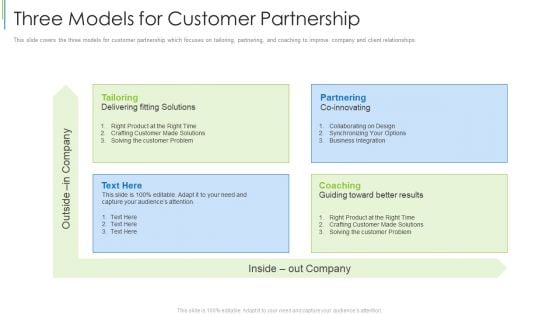
Three Models For Customer Partnership Ppt Professional Infographics PDF
This slide covers the three models for customer partnership which focuses on tailoring, partnering, and coaching to improve company and client relationships. This is a three models for customer partnership ppt professional infographics pdf template with various stages. Focus and dispense information on four stages using this creative set, that comes with editable features. It contains large content boxes to add your information on topics like three models for customer partnership. You can also showcase facts, figures, and other relevant content using this PPT layout. Grab it now.
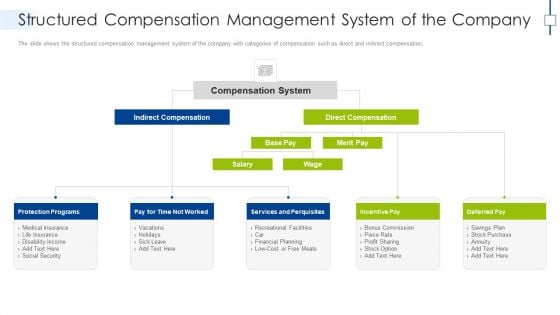
Structured Compensation Management System Of The Company Infographics PDF
The slide shows the structured compensation management system of the company with categories of compensation such as direct and indirect compensation. This is a structured compensation management system of the company infographics pdf template with various stages. Focus and dispense information on four stages using this creative set, that comes with editable features. It contains large content boxes to add your information on topics like protection programs, pay for time not worked, services and perquisites, incentive pay, deferred pay. You can also showcase facts, figures, and other relevant content using this PPT layout. Grab it now.
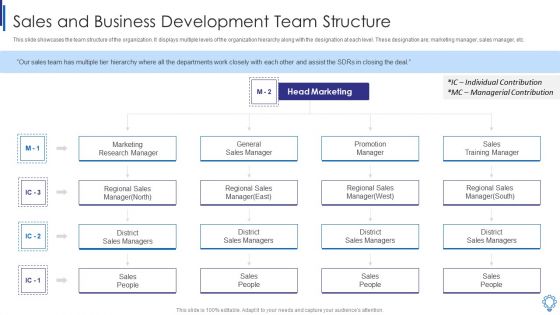
Sales And Business Development Team Structure Infographics PDF
This slide showcases the team structure of the organization. It displays multiple levels of the organization hierarchy along with the designation at each level. These designation are marketing manager, sales manager, etc. Presenting sales and business development team structure infographics pdf to provide visual cues and insights. Share and navigate important information on four stages that need your due attention. This template can be used to pitch topics like marketing research manager, general sales manager, sales training manager, individual contribution, managerial contribution. In addtion, this PPT design contains high resolution images, graphics, etc, that are easily editable and available for immediate download.
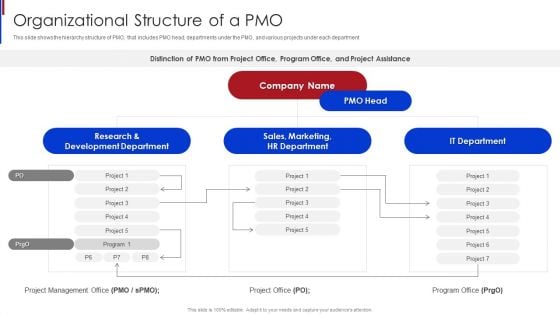
New Project Management Organizational Structure Of A PMO Infographics PDF
This slide shows the hierarchy structure of PMO, that includes PMO head, departments under the PMO, and various projects under each department. This is a New Project Management Organizational Structure Of A PMO Infographics PDF template with various stages. Focus and dispense information on five stages using this creative set, that comes with editable features. It contains large content boxes to add your information on topics like Research And Development Department, Sales, Marketing, HR Department, IT Department, PMO Head. You can also showcase facts, figures, and other relevant content using this PPT layout. Grab it now.
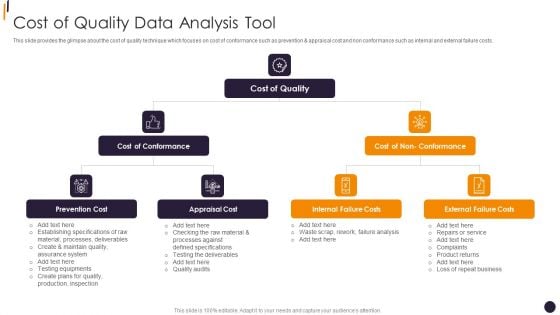
PMP Tools Cost Of Quality Data Analysis Tool Infographics PDF
This slide provides the glimpse about the cost of quality technique which focuses on cost of conformance such as prevention and appraisal cost and non conformance such as internal and external failure costs.Presenting PMP Tools Cost Of Quality Data Analysis Tool Infographics PDF to provide visual cues and insights. Share and navigate important information on six stages that need your due attention. This template can be used to pitch topics like Cost Of Conformance, Appraisal Cost, Prevention Cost In addtion, this PPT design contains high resolution images, graphics, etc, that are easily editable and available for immediate download.
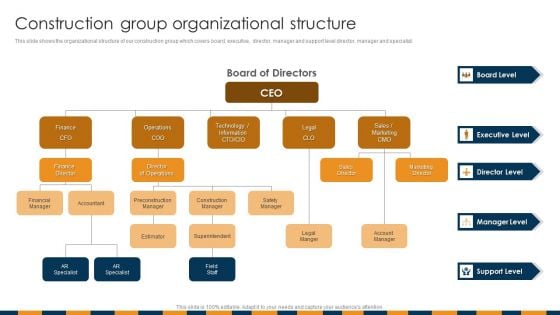
Construction Services Company Profile Construction Group Organizational Structure Infographics PDF
This slide shows the organizational structure of our construction group which covers board, executive, director, manager and support level director, manager and specialist.Presenting Construction Services Company Profile Construction Group Organizational Structure Infographics PDF to provide visual cues and insights. Share and navigate important information on five stages that need your due attention. This template can be used to pitch topics like Financial Manager, Finance Director, Executive Level In addtion, this PPT design contains high resolution images, graphics, etc, that are easily editable and available for immediate download.
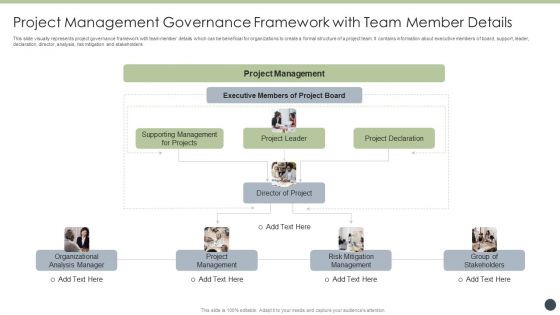
Project Management Governance Framework With Team Member Details Infographics PDF
This slide visually represents project governance framework with team member details which can be beneficial for organizations to create a formal structure of a project team. It contains information about executive members of board, support, leader, declaration, director, analysis, risk mitigation and stakeholders Persuade your audience using this Project Management Governance Framework With Team Member Details Infographics PDF. This PPT design covers three stages, thus making it a great tool to use. It also caters to a variety of topics including Supporting Management, Project Management, Organizational Analysis Manager. Download this PPT design now to present a convincing pitch that not only emphasizes the topic but also showcases your presentation skills.
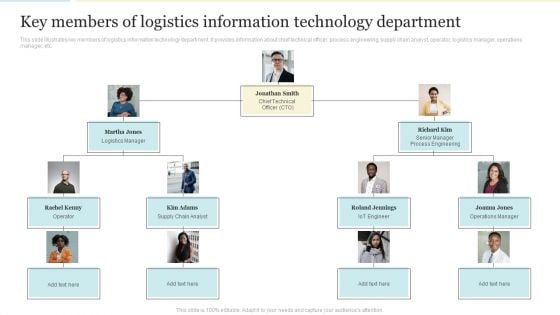
Key Members Of Logistics Information Technology Department Infographics PDF
This slide illustrates key members of logistics information technology department. It provides information about chief technical officer, process engineering, supply chain analyst, operator, logistics manager, operations manager, etc. This is a Key Members Of Logistics Information Technology Department Infographics PDF template with various stages. Focus and dispense information on three stages using this creative set, that comes with editable features. It contains large content boxes to add your information on topics like Supply Chain Analyst, Operations Manager, Chief Technical Officer. You can also showcase facts, figures, and other relevant content using this PPT layout. Grab it now.
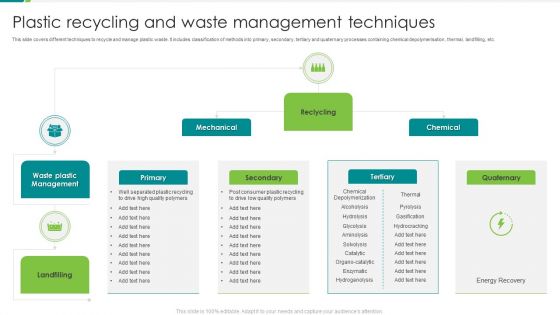
Plastic Recycling And Waste Management Techniques Ppt Infographics Designs PDF
This slide covers different techniques to recycle and manage plastic waste. It includes classification of methods into primary, secondary, tertiary and quaternary processes containing chemical depolymerisation, thermal, landfilling, etc. Persuade your audience using this Plastic Recycling And Waste Management Techniques Ppt Infographics Designs PDF. This PPT design covers three stages, thus making it a great tool to use. It also caters to a variety of topics including Mechanical, Reclycling, Chemical, Secondary. Download this PPT design now to present a convincing pitch that not only emphasizes the topic but also showcases your presentation skills.
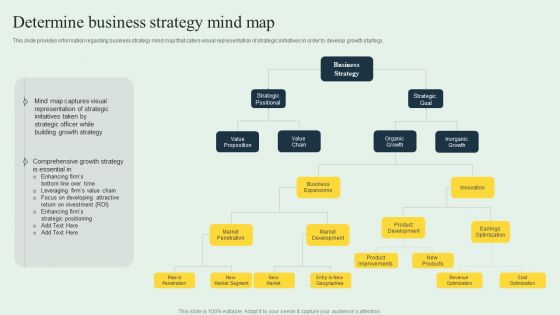
Effective Strategy Development Determine Business Strategy Mind Map Infographics PDF
This slide provides information regarding business strategy mind map that caters visual representation of strategic initiatives in order to develop growth startegy. Slidegeeks is one of the best resources for PowerPoint templates. You can download easily and regulate Effective Strategy Development Determine Business Strategy Mind Map Infographics PDF for your personal presentations from our wonderful collection. A few clicks is all it takes to discover and get the most relevant and appropriate templates. Use our Templates to add a unique zing and appeal to your presentation and meetings. All the slides are easy to edit and you can use them even for advertisement purposes.
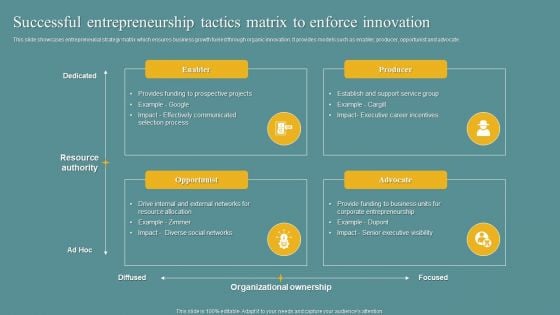
Successful Entrepreneurship Tactics Matrix To Enforce Innovation Infographics PDF
This slide showcases entrepreneurial strategy matrix which ensures business growth fueled through organic innovation. It provides models such as enabler, producer, opportunist and advocate. Persuade your audience using this Successful Entrepreneurship Tactics Matrix To Enforce Innovation Infographics PDF. This PPT design covers four stages, thus making it a great tool to use. It also caters to a variety of topics including Enabler, Opportunist, Advocate. Download this PPT design now to present a convincing pitch that not only emphasizes the topic but also showcases your presentation skills.
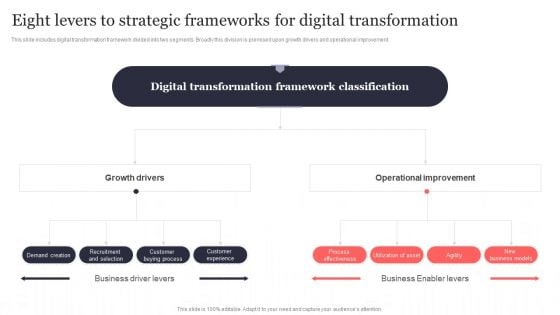
Eight Levers To Strategic Frameworks For Digital Transformation Infographics PDF
This slide includes digital transformation framework divided into two segments. Broadly this division is premised upon growth drivers and operational improvement. Persuade your audience using this Eight Levers To Strategic Frameworks For Digital Transformation Infographics PDF. This PPT design covers one stages, thus making it a great tool to use. It also caters to a variety of topics including Digital Transformation, Growth Drivers, Operational Improvement. Download this PPT design now to present a convincing pitch that not only emphasizes the topic but also showcases your presentation skills.
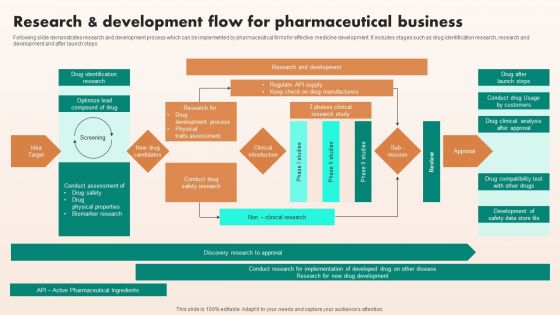
Research And Development Flow For Pharmaceutical Business Infographics PDF
Following slide demonstrates research and development process which can be implemented by pharmaceutical firms for effective medicine development. It includes stages such as drug identification research, research and development and after launch steps. Presenting Research And Development Flow For Pharmaceutical Business Infographics PDF to dispense important information. This template comprises one stages. It also presents valuable insights into the topics including Idea Target, Clinical Introduction, New Drug Candidates, Sub Mission, Approval. This is a completely customizable PowerPoint theme that can be put to use immediately. So, download it and address the topic impactfully.
Improving PPC Campaign Results Develop Campaign Performance Tracking Infographics Pdf
The following slide depicts campaign performance management dashboard to measure the results. It includes elements such as conversions funnel, conversion rates, opportunity value, landing pages, sources google, twitter, Facebook etc. If you are looking for a format to display your unique thoughts, then the professionally designed Improving PPC Campaign Results Develop Campaign Performance Tracking Infographics Pdf is the one for you. You can use it as a Google Slides template or a PowerPoint template. Incorporate impressive visuals, symbols, images, and other charts. Modify or reorganize the text boxes as you desire. Experiment with shade schemes and font pairings. Alter, share or cooperate with other people on your work. Download Improving PPC Campaign Results Develop Campaign Performance Tracking Infographics Pdf and find out how to give a successful presentation. Present a perfect display to your team and make your presentation unforgettable. The following slide depicts campaign performance management dashboard to measure the results. It includes elements such as conversions funnel, conversion rates, opportunity value, landing pages, sources google, twitter, Facebook etc.
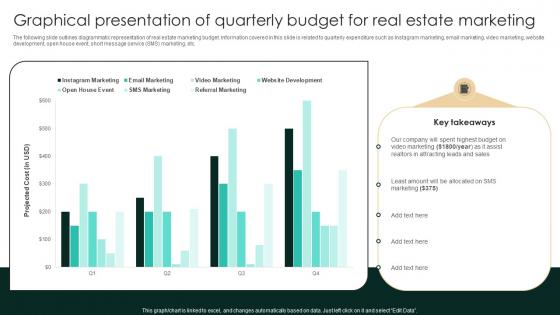
Graphical Presentation Of Quarterly Budget Strategic Real Estate Infographics Pdf
The following slide outlines diagrammatic representation of real estate marketing budget. Information covered in this slide is related to quarterly expenditure such as Instagram marketing, email marketing, video marketing, website development, open house event, short message service SMS marketing, etc. Crafting an eye-catching presentation has never been more straightforward. Let your presentation shine with this tasteful yet straightforward Graphical Presentation Of Quarterly Budget Strategic Real Estate Infographics Pdf template. It offers a minimalistic and classy look that is great for making a statement. The colors have been employed intelligently to add a bit of playfulness while still remaining professional. Construct the ideal Graphical Presentation Of Quarterly Budget Strategic Real Estate Infographics Pdf that effortlessly grabs the attention of your audience. Begin now and be certain to wow your customers. The following slide outlines diagrammatic representation of real estate marketing budget. Information covered in this slide is related to quarterly expenditure such as Instagram marketing, email marketing, video marketing, website development, open house event, short message service SMS marketing, etc.
Social Media Performance Tracking Sales Performance Enhancement Infographics Pdf
The following slide showcases a dashboard to track and measure social media platforms performance. It includes key elements such as website traffic, social media referral rate, site revenue, social media site revenue, etc. Here you can discover an assortment of the finest PowerPoint and Google Slides templates. With these templates, you can create presentations for a variety of purposes while simultaneously providing your audience with an eye catching visual experience. Download Social Media Performance Tracking Sales Performance Enhancement Infographics Pdf to deliver an impeccable presentation. These templates will make your job of preparing presentations much quicker, yet still, maintain a high level of quality. Slidegeeks has experienced researchers who prepare these templates and write high quality content for you. Later on, you can personalize the content by editing the Social Media Performance Tracking Sales Performance Enhancement Infographics Pdf. The following slide showcases a dashboard to track and measure social media platforms performance. It includes key elements such as website traffic, social media referral rate, site revenue, social media site revenue, etc.
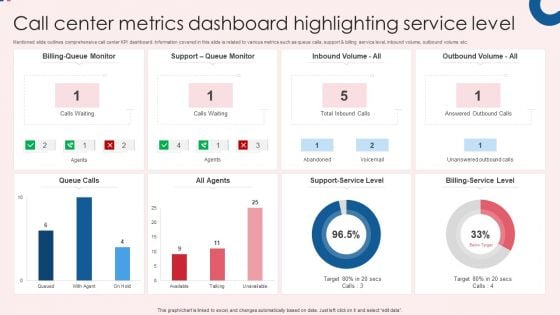
Call Center Metrics Dashboard Highlighting Service Level Infographics PDF
Mentioned slide outlines comprehensive call center KPI dashboard. Information covered in this slide is related to various metrics such as queue calls, support and billing service level, inbound volume, outbound volume etc. Pitch your topic with ease and precision using this Call Center Metrics Dashboard Highlighting Service Level Infographics PDF. This layout presents information on All Agents, Queue Calls, Billing Service Level. It is also available for immediate download and adjustment. So, changes can be made in the color, design, graphics or any other component to create a unique layout.
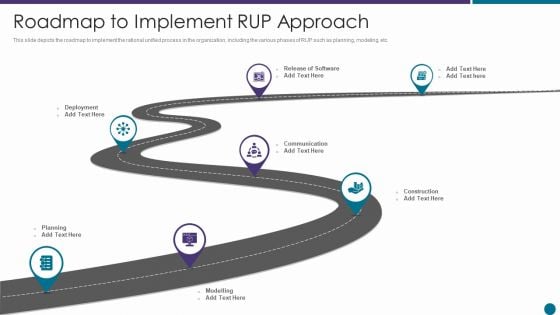
Roadmap To Implement RUP Approach Ppt Infographics Example File PDF
This slide depicts the roadmap to implement the rational unified process in the organization, including the various phases of RUP such as planning, modeling, etc. Presenting roadmap to implement rup approach ppt infographics example file pdf to provide visual cues and insights. Share and navigate important information on seven stages that need your due attention. This template can be used to pitch topics like planning, deployment, communication. In addtion, this PPT design contains high resolution images, graphics, etc, that are easily editable and available for immediate download.
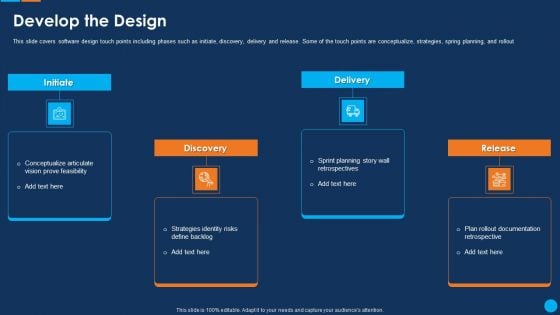
IT Application Development Project Plan Develop The Design Infographics PDF
This slide covers software design touch points including phases such as initiate, discovery, delivery and release. Some of the touch points are conceptualize, strategies, spring planning, and rollout This is a it application development project plan develop the design infographics pdf template with various stages. Focus and dispense information on four stages using this creative set, that comes with editable features. It contains large content boxes to add your information on topics like conceptualize articulate, vision prove feasibility, sprint planning story wall retrospectives You can also showcase facts, figures, and other relevant content using this PPT layout. Grab it now.
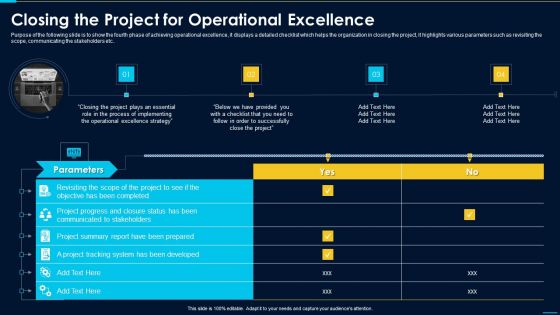
Closing The Project For Operational Excellence Infographics PDF
Purpose of the following slide is to show the fourth phase of achieving operational excellence, it displays a detailed checklist which helps the organization in closing the project, it highlights various parameters such as revisiting the scope, communicating the stakeholders etc.Deliver an awe inspiring pitch with this creative closing the project for operational excellence infographics pdf bundle. Topics like project progress, project summary, system has been developed can be discussed with this completely editable template. It is available for immediate download depending on the needs and requirements of the user.
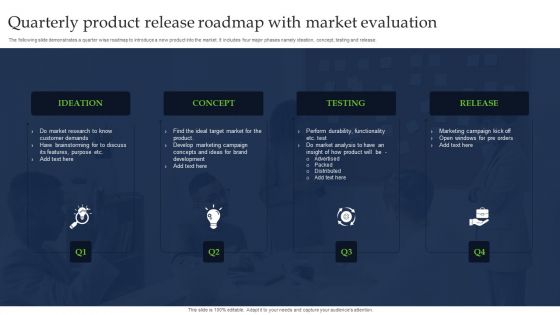
Quarterly Product Release Roadmap With Market Evaluation Infographics PDF
The following slide demonstrates a quarter wise roadmap to introduce a new product into the market. It includes four major phases namely ideation, concept, testing and release. Persuade your audience using this Quarterly Product Release Roadmap With Market Evaluation Infographics PDF. This PPT design covers four stages, thus making it a great tool to use. It also caters to a variety of topics including Concept, Ideation, Testing. Download this PPT design now to present a convincing pitch that not only emphasizes the topic but also showcases your presentation skills.
Three Step Policy Tracking And Assessment Framework Infographics PDF
This slide showcases three phase monitoring and evaluation framework for the company to ensure realization of planned output. It includes stages such as design, delivery and review. Persuade your audience using this Three Step Policy Tracking And Assessment Framework Infographics PDF. This PPT design covers Three stages, thus making it a great tool to use. It also caters to a variety of topics including Three Step Policy, Tracking, Assessment Framework. Download this PPT design now to present a convincing pitch that not only emphasizes the topic but also showcases your presentation skills.

Asset Acquisition With Ppt For Tender Submission Process Infographics PDF
This slide illustrates procurement of corporate assets and acquisition with tendering process. It includes phases such as initial PPT for tender planning, request for PPT for tender, PPT for tender invitation, etc. Persuade your audience using this Asset Acquisition With Ppt For Tender Submission Process Infographics PDF. This PPT design covers three stages, thus making it a great tool to use. It also caters to a variety of topics including Tender Planning, Tender Invitation, Suppliers Response. Download this PPT design now to present a convincing pitch that not only emphasizes the topic but also showcases your presentation skills.
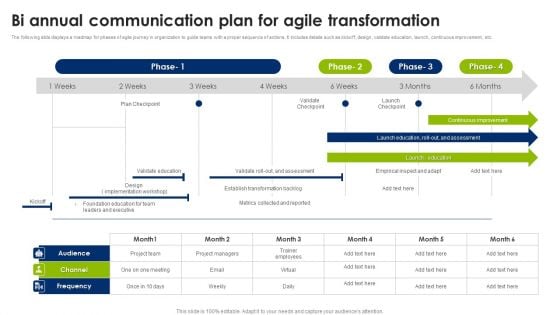
Bi Annual Communication Plan For Agile Transformation Infographics PDF
The following slide displays a roadmap for phases of agile journey in organization to guide teams with a proper sequence of actions. It includes details such as kickoff, design, validate education, launch, continuous improvement, etc. Showcasing this set of slides titled Bi Annual Communication Plan For Agile Transformation Infographics PDF. The topics addressed in these templates are Audience, Channel, Frequency. All the content presented in this PPT design is completely editable. Download it and make adjustments in color, background, font etc. as per your unique business setting.
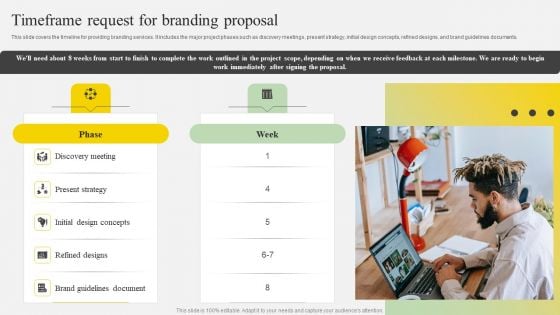
Timeframe Request For Branding Proposal Ppt Infographics Template PDF
This slide covers the timeline for providing branding services. It includes the major project phases such as discovery meetings, present strategy, initial design concepts, refined designs, and brand guidelines documents. Unleash your creativity with our Timeframe Request For Branding Proposal Ppt Infographics Template PDF single-slide PPT template. Whether you are a seasoned presenter or a newbie, our editable and visually-stunning template will make your presentations shine. This template is versatile and easy to use. Make your presentations unforgettable with our premium template and leave a lasting impression on your audience.
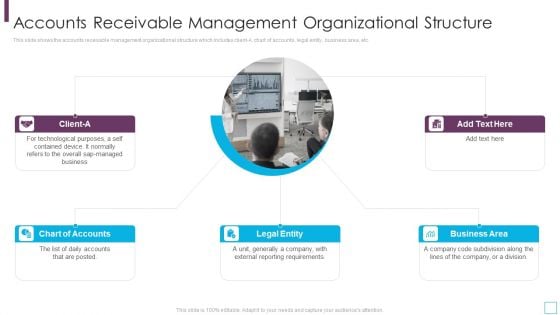
Key Strategies For Account Receivable Management Organizational Structure Infographics PDF
This slide shows the accounts receivable management organizational structure which includes client-A, chart of accounts, legal entity, business area, etc.This is a key strategies for account receivable management organizational structure infographics pdf template with various stages. Focus and dispense information on five stages using this creative set, that comes with editable features. It contains large content boxes to add your information on topics like chart of accounts, business area, external reporting requirements You can also showcase facts, figures, and other relevant content using this PPT layout. Grab it now.
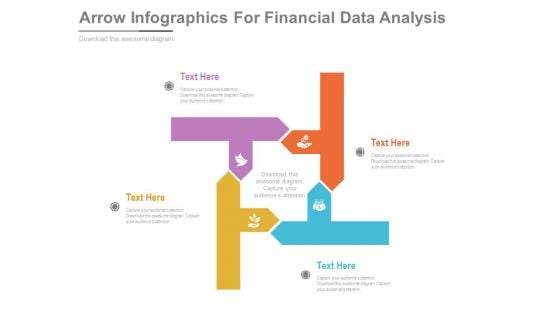
Arrow Infographics For Financial Data Analysis Powerpoint Template
This PowerPoint slide contains diagram of arrows infographic. This professional slide helps to exhibit financial data analysis for business growth. Use this PowerPoint template to make impressive presentations.
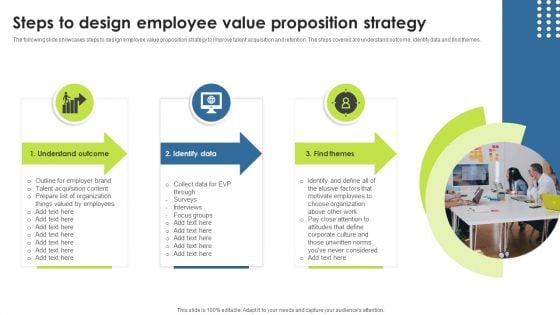
Steps To Design Employee Value Proposition Strategy Infographics PDF
The following slide showcases steps to design employee value proposition strategy to improve talent acquisition and retention. The steps covered are understand outcome, identify data and find themes. Presenting Steps To Design Employee Value Proposition Strategy Infographics PDF to dispense important information. This template comprises three stages. It also presents valuable insights into the topics including Understand Outcome, Identify Data, Find Themes. This is a completely customizable PowerPoint theme that can be put to use immediately. So, download it and address the topic impactfully.
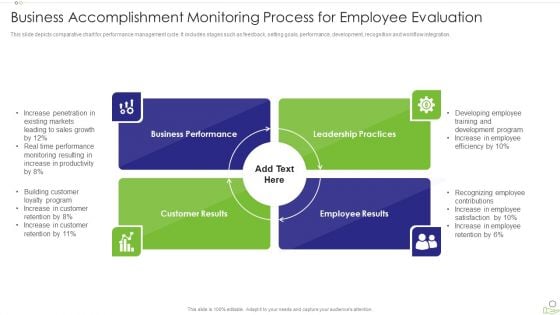
Business Accomplishment Monitoring Process For Employee Evaluation Infographics PDF
This slide depicts comparative chart for performance management cycle. It includes stages such as feedback, setting goals, performance, development, recognition and workflow integration. Persuade your audience using this business accomplishment monitoring process for employee evaluation infographics pdf. This PPT design covers four stages, thus making it a great tool to use. It also caters to a variety of topics including business performance, leadership practices, customer results. Download this PPT design now to present a convincing pitch that not only emphasizes the topic but also showcases your presentation skills.
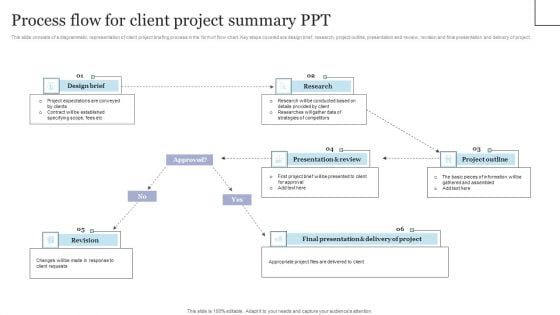
Process Flow For Client Project Summary Ppt Infographics PDF
This slide consists of a diagrammatic representation of client project briefing process in the form of flow chart. Key steps covered are design brief, research, project outline, presentation and review, revision and final presentation and delivery of project. Pitch your topic with ease and precision using this Process Flow For Client Project Summary Ppt Infographics PDF. This layout presents information on Design Brief, Revision, Research. It is also available for immediate download and adjustment. So, changes can be made in the color, design, graphics or any other component to create a unique layout.
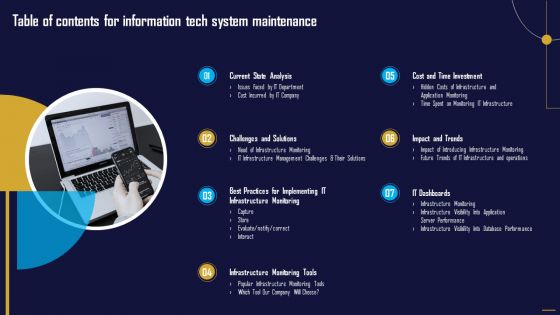
Table Of Contents For Information Tech System Maintenance Infographics PDF
Retrieve professionally designed Table Of Contents For Information Tech System Maintenance Infographics PDF to effectively convey your message and captivate your listeners. Save time by selecting pre-made slideshows that are appropriate for various topics, from business to educational purposes. These themes come in many different styles, from creative to corporate, and all of them are easily adjustable and can be edited quickly. Access them as PowerPoint templates or as Google Slides themes. You don not have to go on a hunt for the perfect presentation because Slidegeeks got you covered from everywhere.
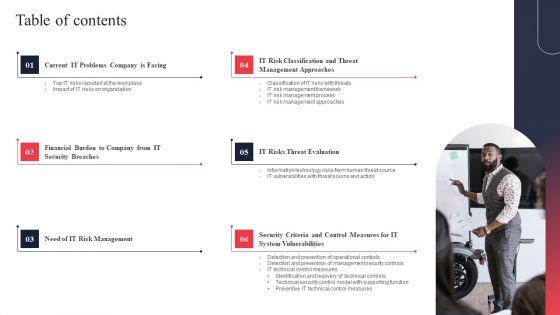
IT System Risk Management Guide Table Of Contents Infographics PDF
Retrieve professionally designed IT System Risk Management Guide Table Of Contents Infographics PDF to effectively convey your message and captivate your listeners. Save time by selecting pre made slideshows that are appropriate for various topics, from business to educational purposes. These themes come in many different styles, from creative to corporate, and all of them are easily adjustable and can be edited quickly. Access them as PowerPoint templates or as Google Slides themes. You don not have to go on a hunt for the perfect presentation because Slidegeeks got you covered from everywhere.

Interoperability Software Testing Semantic Interoperability Testing Type Infographics PDF
This slide represents the semantic type of interoperability testing that concentrates on the data transported algorithm and tests the semantics involved. Retrieve professionally designed Interoperability Software Testing Semantic Interoperability Testing Type Infographics PDF to effectively convey your message and captivate your listeners. Save time by selecting pre made slideshows that are appropriate for various topics, from business to educational purposes. These themes come in many different styles, from creative to corporate, and all of them are easily adjustable and can be edited quickly. Access them as PowerPoint templates or as Google Slides themes. You do not have to go on a hunt for the perfect presentation because Slidegeeks got you covered from everywhere.
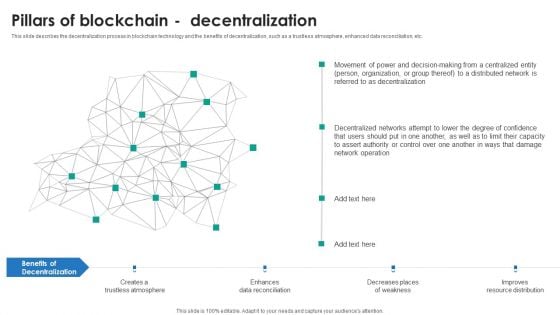
P2P Ledger Pillars Of Blockchain Decentralization Infographics PDF
This slide describes the decentralization process in blockchain technology and the benefits of decentralization, such as a trustless atmosphere, enhanced data reconciliation, etc.Retrieve professionally designed P2P Ledger Pillars Of Blockchain Decentralization Infographics PDF to effectively convey your message and captivate your listeners. Save time by selecting pre-made slideshows that are appropriate for various topics, from business to educational purposes. These themes come in many different styles, from creative to corporate, and all of them are easily adjustable and can be edited quickly. Access them as PowerPoint templates or as Google Slides themes. You do not have to go on a hunt for the perfect presentation because Slidegeeks got you covered from everywhere.
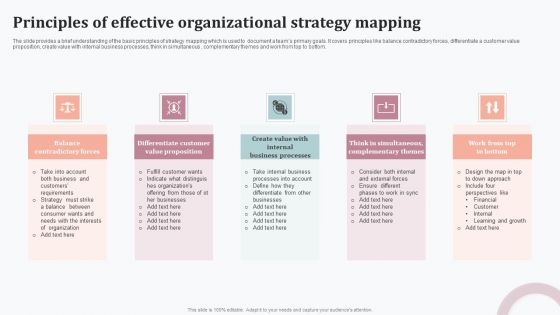
Principles Of Effective Organizational Strategy Mapping Infographics PDF
The slide provides a brief understanding of the basic principles of strategy mapping which is used to document a teams primary goals. It covers principles like balance contradictory forces, differentiate a customer value proposition, create value with internal business processes, think in simultaneous , complementary themes and work from top to bottom. Presenting Principles Of Effective Organizational Strategy Mapping Infographics PDF to dispense important information. This template comprises five stages. It also presents valuable insights into the topics including Balance Contradictory Forces, Differentiate Customer Value, Create Value Internal. This is a completely customizable PowerPoint theme that can be put to use immediately. So, download it and address the topic impactfully.
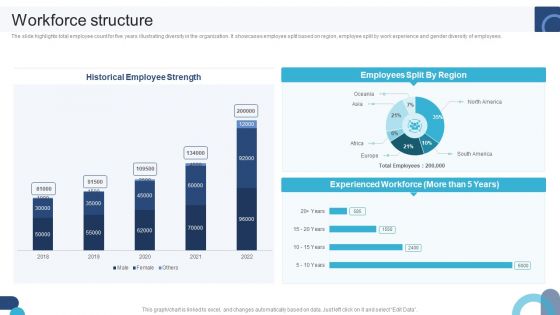
Digital Application Software Development Business Profile Workforce Structure Infographics PDF
The slide highlights total employee count for five years illustrating diversity in the organization. It showcases employee split based on region, employee split by work experience and gender diversity of employees. Do you know about Slidesgeeks Digital Application Software Development Business Profile Workforce Structure Infographics PDF These are perfect for delivering any kind od presentation. Using it, create PowerPoint presentations that communicate your ideas and engage audiences. Save time and effort by using our pre-designed presentation templates that are perfect for a wide range of topic. Our vast selection of designs covers a range of styles, from creative to business, and are all highly customizable and easy to edit. Download as a PowerPoint template or use them as Google Slides themes.
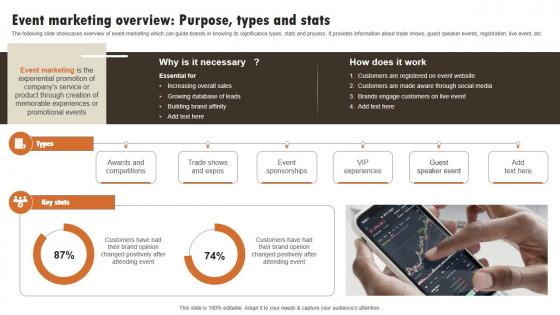
Event Marketing Overview Purpose Types Experiential Marketing Technique Infographics PDF
The following slide showcases overview of event marketing which can guide brands in knowing its significance types, stats and process. It provides information about trade shows, guest speaker events, registration, live event, etc. Make sure to capture your audiences attention in your business displays with our gratis customizable Event Marketing Overview Purpose Types Experiential Marketing Technique Infographics PDF. These are great for business strategies, office conferences, capital raising or task suggestions. If you desire to acquire more customers for your tech business and ensure they stay satisfied, create your own sales presentation with these plain slides. The following slide showcases overview of event marketing which can guide brands in knowing its significance types, stats and process. It provides information about trade shows, guest speaker events, registration, live event, etc.
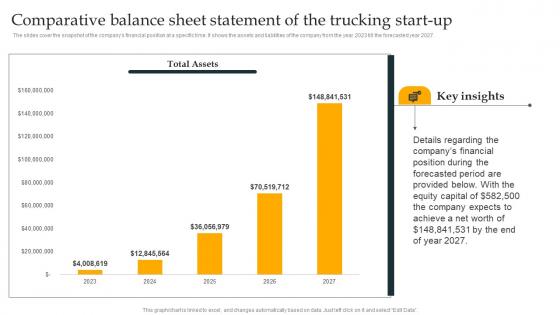
Comparative Balance Sheet Statement Freight Trucking Business Plan Infographics Pdf
The slides cover the snapshot of the companys financial position at a specific time. It shows the assets and liabilities of the company from the year 2023 till the forecasted year 2027.Slidegeeks is one of the best resources for PowerPoint templates. You can download easily and regulate Comparative Balance Sheet Statement Freight Trucking Business Plan Infographics Pdf for your personal presentations from our wonderful collection. A few clicks is all it takes to discover and get the most relevant and appropriate templates. Use our Templates to add a unique zing and appeal to your presentation and meetings. All the slides are easy to edit and you can use them even for advertisement purposes. The slides cover the snapshot of the companys financial position at a specific time. It shows the assets and liabilities of the company from the year 2023 till the forecasted year 2027.
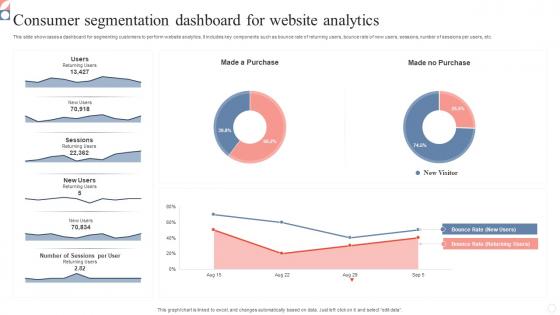
Consumer Segmentation Dashboard For Website Analytics Infographics Pdf
This slide showcases a dashboard for segmenting customers to perform website analytics. It includes key components such as bounce rate of returning users, bounce rate of new users, sessions, number of sessions per users, etc. Pitch your topic with ease and precision using this Consumer Segmentation Dashboard For Website Analytics Infographics Pdf. This layout presents information on Consumer Segmentation Dashboard, Website Analytics, Segmenting Customers. It is also available for immediate download and adjustment. So, changes can be made in the color, design, graphics or any other component to create a unique layout. This slide showcases a dashboard for segmenting customers to perform website analytics. It includes key components such as bounce rate of returning users, bounce rate of new users, sessions, number of sessions per users, etc.
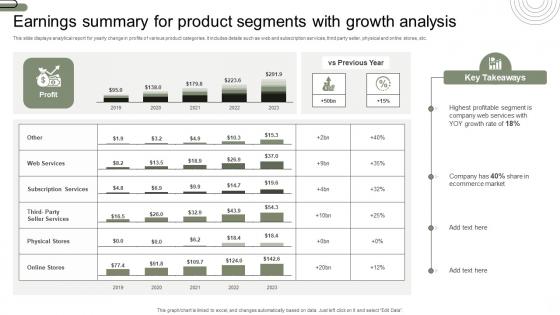
Earnings Summary For Product Segments With Growth Analysis Infographics Pdf
This slide displays analytical report for yearly change in profits of various product categories. It includes details such as web and subscription services, third party seller, physical and online stores, etc. Pitch your topic with ease and precision using this Earnings Summary For Product Segments With Growth Analysis Infographics Pdf. This layout presents information on Earnings Summary, Product Segments, Growth Analysis. It is also available for immediate download and adjustment. So, changes can be made in the color, design, graphics or any other component to create a unique layout. This slide displays analytical report for yearly change in profits of various product categories. It includes details such as web and subscription services, third party seller, physical and online stores, etc.
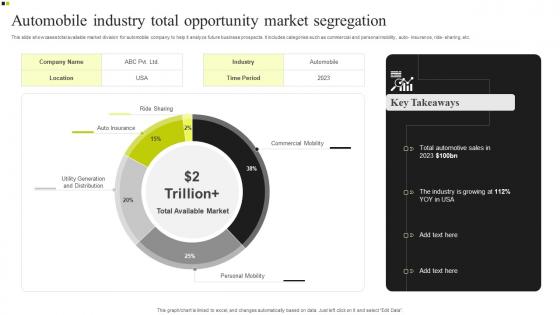
Automobile Industry Total Opportunity Market Segregation Infographics Pdf
This slide showcases total available market division for automobile company to help it analyze future business prospects. It includes categories such as commercial and personal mobility, auto- insurance, ride- sharing, etc. Showcasing this set of slides titled Automobile Industry Total Opportunity Market Segregation Infographics Pdf. The topics addressed in these templates are Automobile Industry, Total Opportunity, Market Segregation. All the content presented in this PPT design is completely editable. Download it and make adjustments in color, background, font etc. as per your unique business setting. This slide showcases total available market division for automobile company to help it analyze future business prospects. It includes categories such as commercial and personal mobility, auto- insurance, ride- sharing, etc.
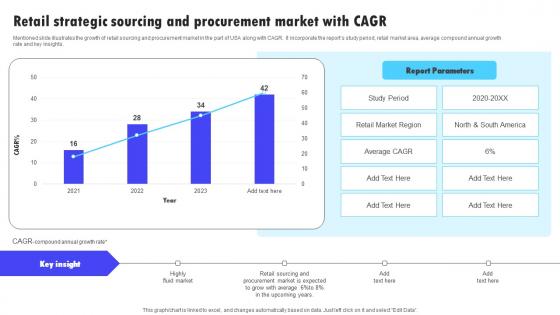
Retail Strategic Sourcing And Procurement Market With Cagr Infographics Pdf
Mentioned slide illustrates the growth of retail sourcing and procurement market in the part of USA along with CAGR. It incorporate the reports study period, retail market area, average compound annual growth rate and key insights. Showcasing this set of slides titled Retail Strategic Sourcing And Procurement Market With Cagr Infographics Pdf. The topics addressed in these templates are Reports Study Period, Retail Market Area, Average Compound0. All the content presented in this PPT design is completely editable. Download it and make adjustments in color, background, font etc. as per your unique business setting. Mentioned slide illustrates the growth of retail sourcing and procurement market in the part of USA along with CAGR. It incorporate the reports study period, retail market area, average compound annual growth rate and key insights.
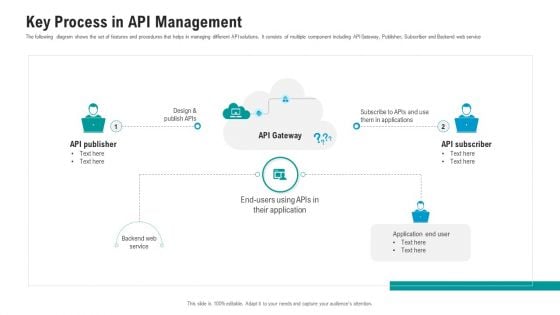
API Ecosystem Key Process In API Management Infographics PDF
The following diagram shows the set of features and procedures that helps in managing different API solutions. It consists of multiple component including API Gateway, Publisher, Subscriber and Backend web service. This is a api ecosystem key process in api management infographics pdf template with various stages. Focus and dispense information on three stages using this creative set, that comes with editable features. It contains large content boxes to add your information on topics like key process in api management. You can also showcase facts, figures, and other relevant content using this PPT layout. Grab it now.
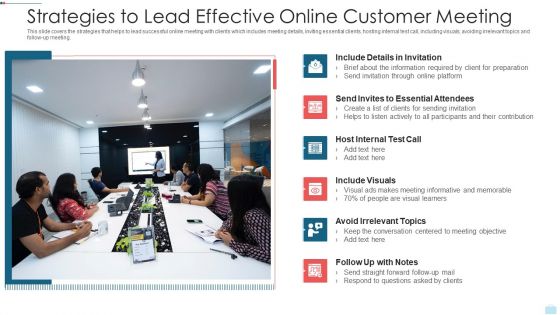
Strategies To Lead Effective Online Customer Meeting Infographics PDF
This slide covers the strategies that helps to lead successful online meeting with clients which includes meeting details, inviting essential clients, hosting internal test call, including visuals, avoiding irrelevant topics and follow-up meeting. Presenting strategies to lead effective online customer meeting infographics pdf to dispense important information. This template comprises six stages. It also presents valuable insights into the topics including include visuals, avoid irrelevant topics, host internal test call. This is a completely customizable PowerPoint theme that can be put to use immediately. So, download it and address the topic impactfully.
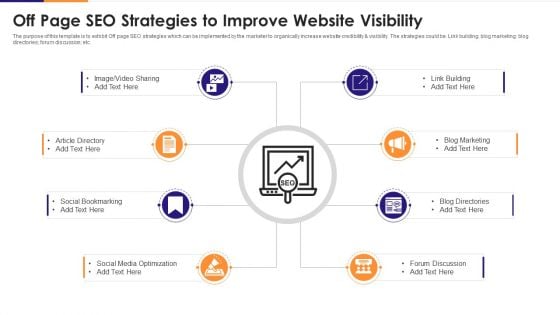
Off Page SEO Strategies To Improve Website Visibility Infographics PDF
The purpose of this template is to exhibit Off page SEO strategies which can be implemented by the marketer to organically increase website credibility and visibility. The strategies could be Link building blog marketing blog directories forum discussion etc. Presenting off page seo strategies to improve website visibility infographics pdf to dispense important information. This template comprises eight stages. It also presents valuable insights into the topics including social, optimization, marketing. This is a completely customizable PowerPoint theme that can be put to use immediately. So, download it and address the topic impactfully.
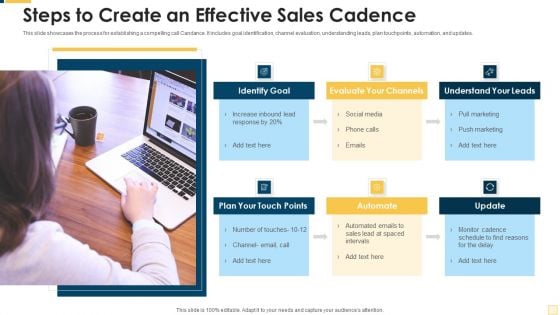
Steps To Create An Effective Sales Cadence Infographics PDF
This slide showcases the process for establishing a compelling call Candance. It includes goal identification, channel evaluation, understanding leads, plan touchpoints, automation, and updates. Presenting steps to create an effective sales cadence infographics pdf to dispense important information. This template comprises six stages. It also presents valuable insights into the topics including identify goal, evaluate your channels, understand your leads, plan your touch points, automate. This is a completely customizable PowerPoint theme that can be put to use immediately. So, download it and address the topic impactfully.
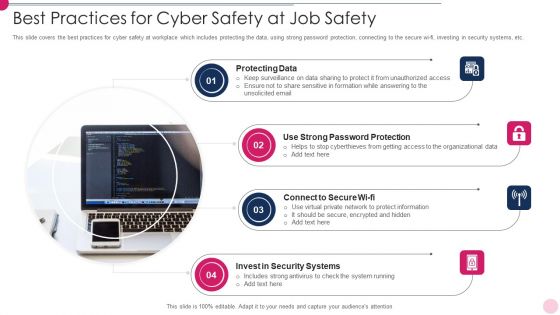
Best Practices For Cyber Safety At Job Safety Infographics PDF
This slide covers the best practices for cyber safety at workplace which includes protecting the data, using strong password protection, connecting to the secure wi-fi, investing in security systems, etc. Presenting best practices for cyber safety at job safety infographics pdf to dispense important information. This template comprises four stages. It also presents valuable insights into the topics including protecting data, connect to secure wi fi, invest in security systems, strong password protection. This is a completely customizable PowerPoint theme that can be put to use immediately. So, download it and address the topic impactfully.
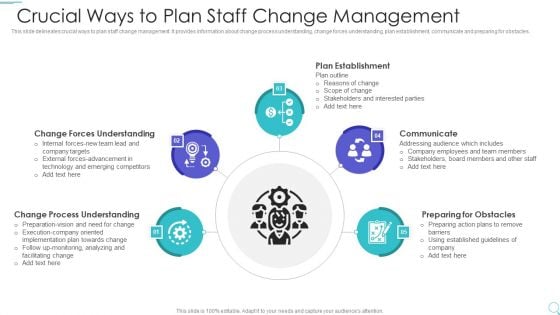
Crucial Ways To Plan Staff Change Management Infographics PDF
This slide delineates crucial ways to plan staff change management. It provides information about change process understanding, change forces understanding, plan establishment, communicate and preparing for obstacles. Presenting crucial ways to plan staff change management infographics pdf to dispense important information. This template comprises five stages. It also presents valuable insights into the topics including change forces understanding, change process understanding, plan establishment. This is a completely customizable PowerPoint theme that can be put to use immediately. So, download it and address the topic impactfully.
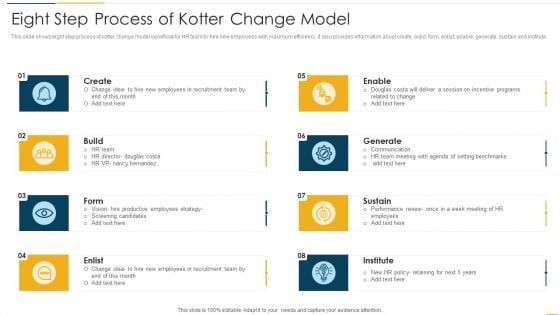
Eight Step Process Of Kotter Change Model Infographics PDF
This slide shows eight step process of kotter change model beneficial for HR team to hire new employees with maximum efficiency. It also provides information about create, build, form, enlist, enable, generate, sustain and institute.Presenting eight step process of kotter change model infographics pdf to dispense important information. This template comprises eight stages. It also presents valuable insights into the topics including employees in recruitment, douglas costa will deliver, communication This is a completely customizable PowerPoint theme that can be put to use immediately. So, download it and address the topic impactfully.
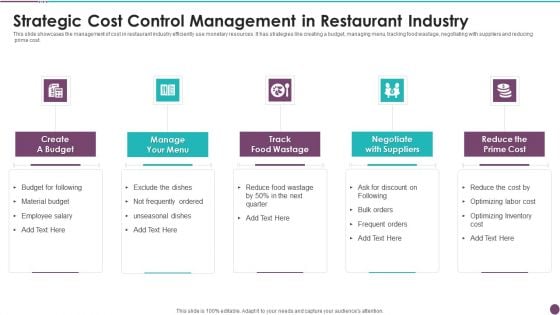
Strategic Cost Control Management In Restaurant Industry Infographics PDF
This slide showcases the management of cost in restaurant industry efficiently use monetary resources. It has strategies like creating a budget, managing menu, tracking food wastage, negotiating with suppliers and reducing prime cost. Presenting strategic cost control management in restaurant industry infographics pdf to dispense important information. This template comprises five stages. It also presents valuable insights into the topics including material budget, cost, negotiate with suppliers. This is a completely customizable PowerPoint theme that can be put to use immediately. So, download it and address the topic impactfully.
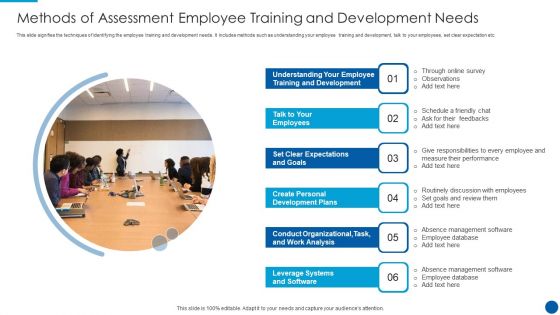
Methods Of Assessment Employee Training And Development Needs Infographics PDF
This slide signifies the techniques of identifying the employee training and development needs. It includes methods such as understanding your employee training and development, talk to your employees, set clear expectation etc. Presenting methods of assessment employee training and development needs infographics pdf to dispense important information. This template comprises six stages. It also presents valuable insights into the topics including management, goals, development plans. This is a completely customizable PowerPoint theme that can be put to use immediately. So, download it and address the topic impactfully.
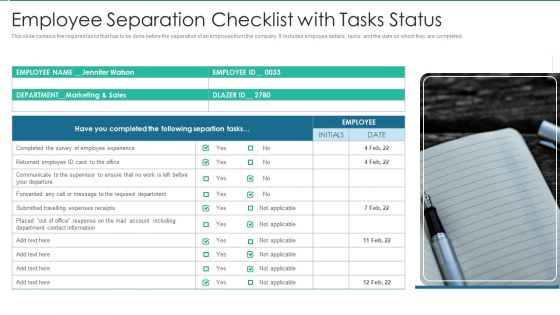
Employee Separation Checklist With Tasks Status Infographics PDF
This slide contains the required tasks that has to be done before the separation of an employee from the company. It includes employee details , tasks and the date on which they are completed.Presenting Employee Separation Checklist With Tasks Status Infographics PDF to dispense important information. This template comprises one stage. It also presents valuable insights into the topics including Employee Experience, Required Department, Account Including This is a completely customizable PowerPoint theme that can be put to use immediately. So, download it and address the topic impactfully.

Factors Affecting Project Implementation Planning Procedure Infographics PDF
The following slide highlights the factors affecting project execution plan illustrating key headings which includes scope change, schedule change, cost change, resource change and technical change. It helps the organization to decide on project change requests Presenting Factors Affecting Project Implementation Planning Procedure Infographics PDF to dispense important information. This template comprises five stages. It also presents valuable insights into the topics including Schedule Change, Cost Change, Resource Change. This is a completely customizable PowerPoint theme that can be put to use immediately. So, download it and address the topic impactfully.

Five Key Consideration For Hotel Protection And Security Infographics PDF
This slide highlights five strategies to ensure safety and security in hotels. It involves strategies such as installation of proper lighting, CCTV security cameras, fire alarms, emergency power and manual.Presenting Five Key Consideration For Hotel Protection And Security Infographics PDF to dispense important information. This template comprises five stages. It also presents valuable insights into the topics including Emergency Power, Emergency Manual, Proper Lighting This is a completely customizable PowerPoint theme that can be put to use immediately. So, download it and address the topic impactfully.
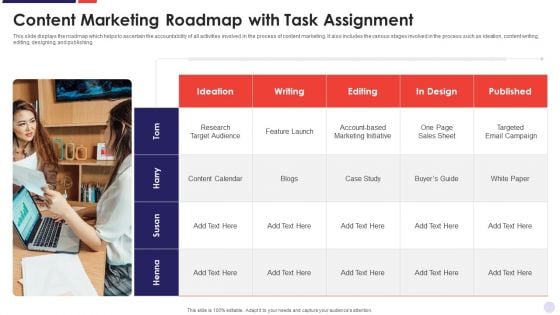
Content Marketing Roadmap With Task Assignment Infographics PDF
This slide displays the roadmap which helps to ascertain the accountability of all activities involved in the process of content marketing. It also includes the various stages involved in the process such as ideation, content writing, editing, designing, and publishing. Presenting Content Marketing Roadmap With Task Assignment Infographics PDF to dispense important information. This template comprises one stage. It also presents valuable insights into the topics including Research Target Audience, Targeted Email Campaign, Feature Launch . This is a completely customizable PowerPoint theme that can be put to use immediately. So, download it and address the topic impactfully.
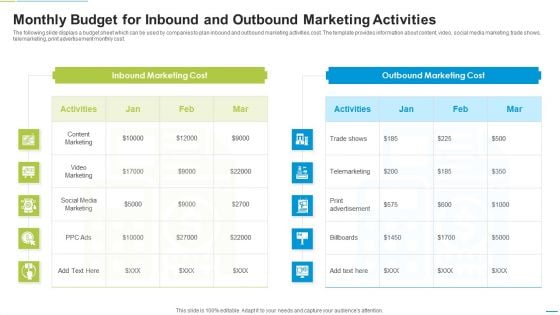
Monthly Budget For Inbound And Outbound Marketing Activities Infographics PDF
The following slide displays a budget sheet which can be used by companies to plan inbound and outbound marketing activities cost. The template provides information about content, video, social media marketing, trade shows, telemarketing, print advertisement monthly cost. Presenting Monthly Budget For Inbound And Outbound Marketing Activities Infographics PDF to dispense important information. This template comprises two stages. It also presents valuable insights into the topics including Content Marketing, Telemarketing, Social Media Marketing. This is a completely customizable PowerPoint theme that can be put to use immediately. So, download it and address the topic impactfully.

Counselling Diversity Issues In Career Development Infographics PDF
This slide depicts counselling multicultural issues in career development which can be referred by counselors to manage complex and dynamic situations in their sessions. It includes information about personal factors, socioeconomic, educational and tangible obstacles. Presenting Counselling Diversity Issues In Career Development Infographics PDF to dispense important information. This template comprises four stages. It also presents valuable insights into the topics including Personal Factors, Socioeconomic, Educational. This is a completely customizable PowerPoint theme that can be put to use immediately. So, download it and address the topic impactfully.

 Home
Home