Infographic Icons
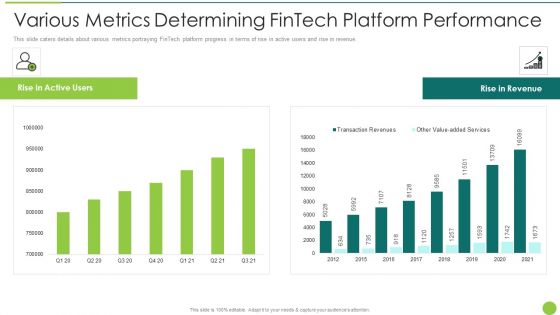
Various Metrics Determining Fintech Platform Performance Infographics PDF
This slide caters details about various metrics portraying FinTech platform progress in terms of rise in active users and rise in revenue. Deliver and pitch your topic in the best possible manner with this various metrics determining fintech platform performance infographics pdf. Use them to share invaluable insights on various metrics determining fintech platform performance and impress your audience. This template can be altered and modified as per your expectations. So, grab it now.
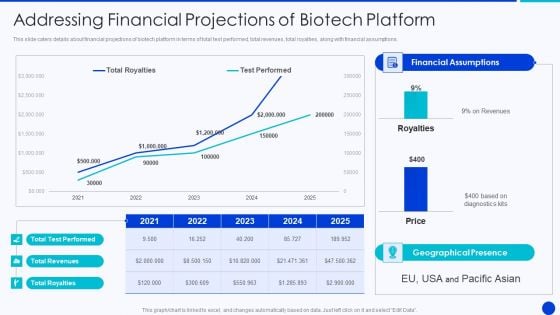
Bioprocessing Company Venture Capitalist Presentation Addressing Financial Projections Infographics PDF
This slide caters details about financial projections of biotech platform in terms of total test performed, total revenues, total royalties, along with financial assumptions.Deliver and pitch your topic in the best possible manner with this bioprocessing company venture capitalist presentation addressing financial projections infographics pdf Use them to share invaluable insights on addressing financial projections of biotech platform and impress your audience. This template can be altered and modified as per your expectations. So, grab it now.
Employee Performance Improvement Framework Determine Employee Performance Tracker Infographics PDF
This slide provides information about employee performance tracker dashboard which covers details in context to employee training, etc. Deliver an awe inspiring pitch with this creative employee performance improvement framework determine employee performance tracker infographics pdf bundle. Topics like outstanding, needs improvement sufficient, strong, current quarterly review can be discussed with this completely editable template. It is available for immediate download depending on the needs and requirements of the user.
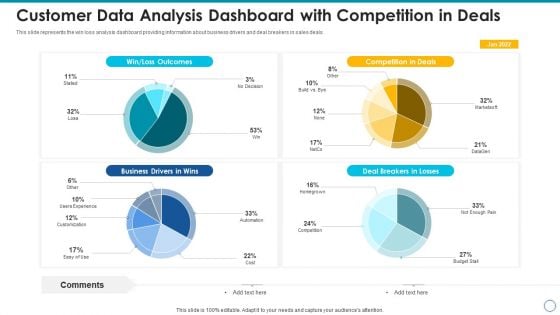
Customer Data Analysis Dashboard With Competition In Deals Infographics PDF
This slide represents the win loss analysis dashboard providing information about business drivers and deal breakers in sales deals. Pitch your topic with ease and precision using this customer data analysis dashboard with competition in deals infographics pdf. This layout presents information on customer data analysis dashboard with competition in deals. It is also available for immediate download and adjustment. So, changes can be made in the color, design, graphics or any other component to create a unique layout.
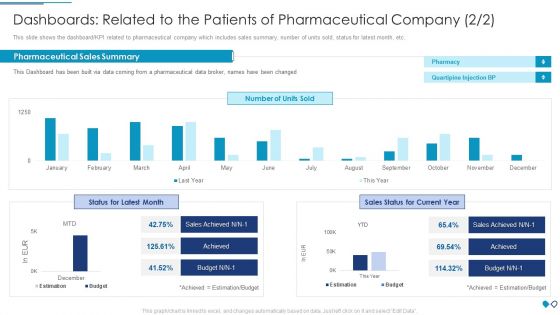
Dashboards Related To The Patients Of Pharmaceutical Company Infographics PDF
This slide shows the dashboard or KPI related to pharmaceutical company which includes sales summary, number of units sold, status for latest month, etc.Deliver an awe inspiring pitch with this creative dashboards related to the patients of pharmaceutical company infographics pdf bundle. Topics like pharmaceutical sales summary, pharmaceutical data broker, quartipine injection can be discussed with this completely editable template. It is available for immediate download depending on the needs and requirements of the user.
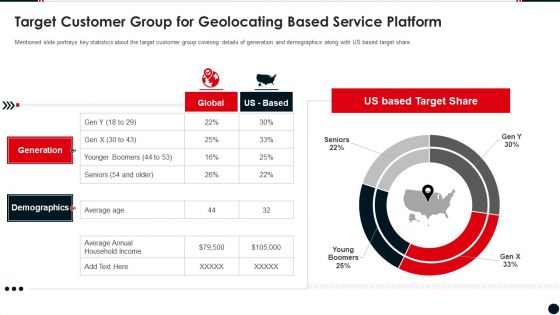
Target Customer Group For Geolocating Based Service Platform Infographics PDF
Mentioned slide portrays key statistics about the target customer group covering details of generation and demographics along with US based target share Deliver and pitch your topic in the best possible manner with this target customer group for geolocating based service platform infographics pdf. Use them to share invaluable insights on target customer group for geolocating based service platform and impress your audience. This template can be altered and modified as per your expectations. So, grab it now.
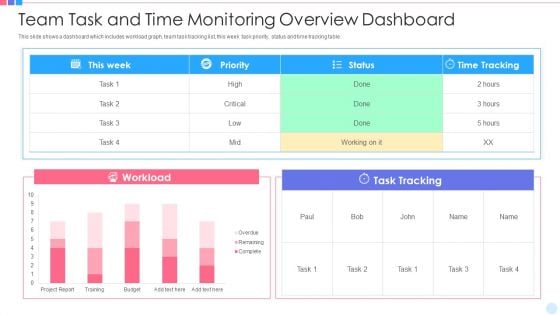
Team Task And Time Monitoring Overview Dashboard Infographics PDF
This slide shows a dashboard which includes workload graph, team task tracking list, this week task priority, status and time tracking table. Showcasing this set of slides titled team task and time monitoring overview dashboard infographics pdf. The topics addressed in these templates are team task and time monitoring overview dashboard. All the content presented in this PPT design is completely editable. Download it and make adjustments in color, background, font etc. as per your unique business setting.
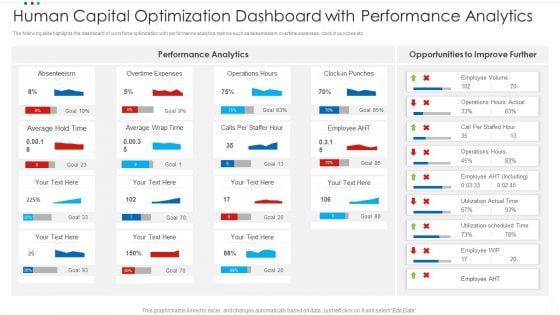
Human Capital Optimization Dashboard With Performance Analytics Infographics PDF
The following slide highlights the dashboard of workforce optimization with performance analytics metrics such as absenteeism, overtime expenses, clock in punches etc. Showcasing this set of slides titled human capital optimization dashboard with performance analytics infographics pdf. The topics addressed in these templates are average, overtime expenses, absenteeism. All the content presented in this PPT design is completely editable. Download it and make adjustments in color, background, font etc. as per your unique business setting.
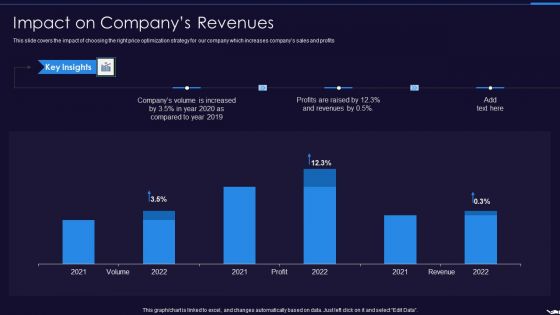
Optimize Marketing Pricing Impact On Companys Revenues Infographics PDF
This slide covers the impact of choosing the right price optimization strategy for our company which increases companys sales and profits. Deliver an awe inspiring pitch with this creative optimize marketing pricing impact on companys revenues infographics pdf bundle. Topics like impact on companys revenues can be discussed with this completely editable template. It is available for immediate download depending on the needs and requirements of the user.
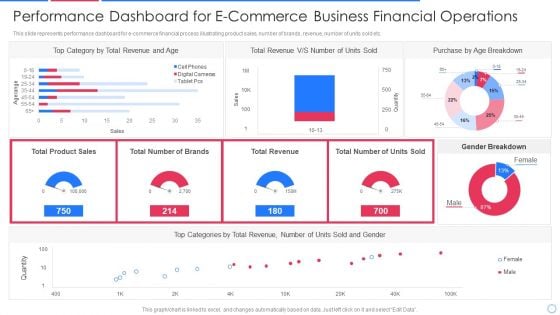
Performance Dashboard For E Commerce Business Financial Operations Infographics PDF
This slide represents performance dashboard for e-commerce financial process illustrating product sales, number of brands, revenue, number of units sold etc.Pitch your topic with ease and precision using this performance dashboard for e commerce business financial operations infographics pdf This layout presents information on category by total revenue, total revenue, purchase by age breakdown It is also available for immediate download and adjustment. So, changes can be made in the color, design, graphics or any other component to create a unique layout.
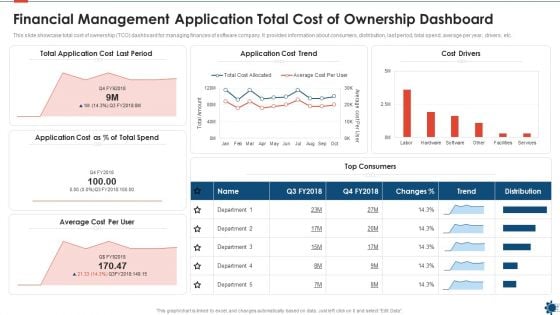
Financial Management Application Total Cost Of Ownership Dashboard Infographics PDF
This slide showcase total cost of ownership TCO dashboard for managing finances of software company. It provides information about consumers, distribution, last period, total spend, average per year, drivers, etc. Showcasing this set of slides titled financial management application total cost of ownership dashboard infographics pdf. The topics addressed in these templates are cost, application. All the content presented in this PPT design is completely editable. Download it and make adjustments in color, background, font etc. as per your unique business setting.
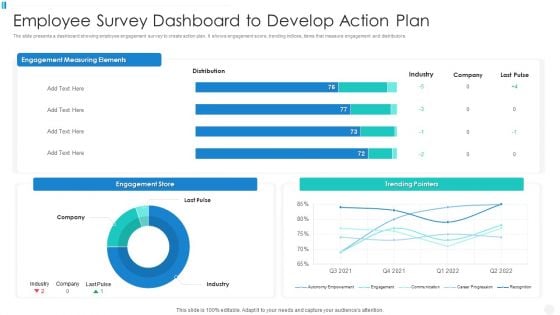
Employee Survey Dashboard To Develop Action Plan Infographics PDF
The slide presents a dashboard showing employee engagement survey to create action plan. It shows engagement score, trending indices, items that measure engagement and distributors. Showcasing this set of slides titled employee survey dashboard to develop action plan infographics pdf The topics addressed in these templates are employee survey dashboard to develop action plan All the content presented in this PPT design is completely editable. Download it and make adjustments in color, background, font etc. as per your unique business setting.
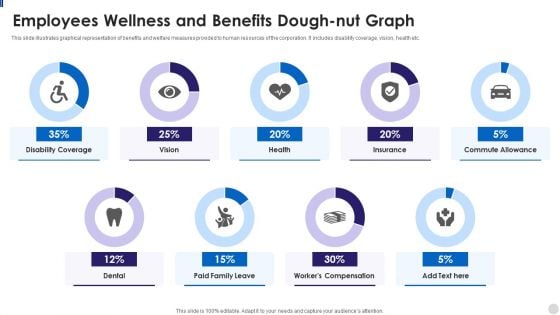
Employees Wellness And Benefits Dough Nut Graph Infographics PDF
This slide illustrates graphical representation of benefits and welfare measures provided to human resources of the corporation. It includes disability coverage, vision, health etc. Showcasing this set of slides titled Employees Wellness And Benefits Dough Nut Graph Infographics PDF. The topics addressed in these templates are Employees Wellness And Benefits Dough Nut Graph. All the content presented in this PPT design is completely editable. Download it and make adjustments in color, background, font etc. as per your unique business setting.
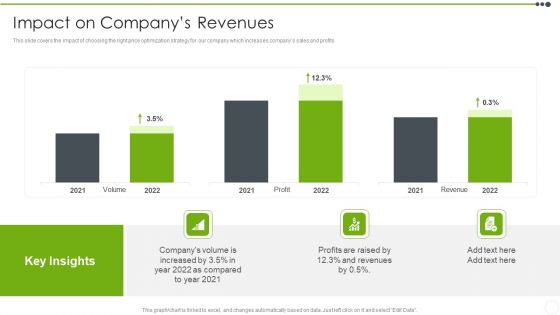
Estimating The Price Impact On Companys Revenues Infographics PDF
This slide covers the impact of choosing the right price optimization strategy for our company which increases companys sales and profits. Deliver an awe inspiring pitch with this creative Estimating The Price Impact On Companys Revenues Infographics PDF bundle. Topics like Profits, Revenues can be discussed with this completely editable template. It is available for immediate download depending on the needs and requirements of the user.
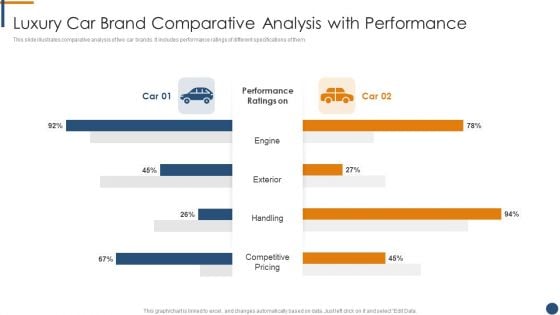
Luxury Car Brand Comparative Analysis With Performance Infographics PDF
This slide illustrates comparative analysis of two car brands. It includes performance ratings of different specifications of them.Showcasing this set of slides titled Luxury Car Brand Comparative Analysis With Performance Infographics PDF. The topics addressed in these templates are Competitive Pricing, Exterior, Engine. All the content presented in this PPT design is completely editable. Download it and make adjustments in color, background, font etc. as per your unique business setting.
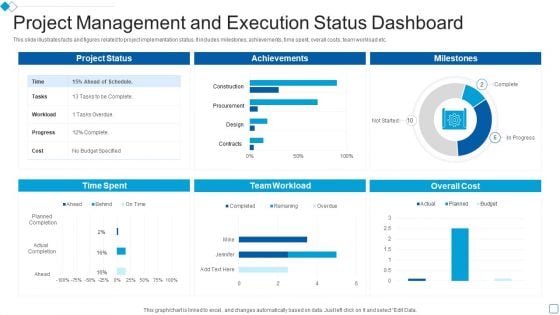
Project Management And Execution Status Dashboard Infographics PDF
This slide illustrates facts and figures related to project implementation status. It includes milestones, achievements, time spent, overall costs, team workload etc.Showcasing this set of slides titled Project Management And Execution Status Dashboard Infographics PDF. The topics addressed in these templates are Achievement, Team Workload, Overall Cost. All the content presented in this PPT design is completely editable. Download it and make adjustments in color, background, font etc. as per your unique business setting.
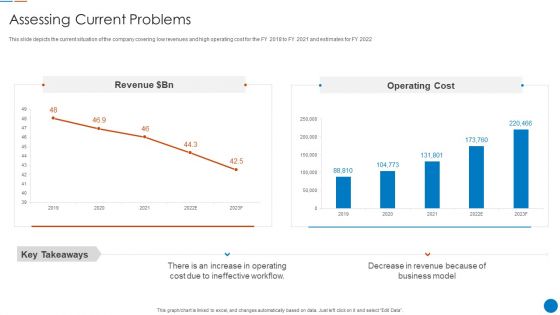
Organizational Restructuring Process Assessing Current Problems Infographics PDF
This slide depicts the current situation of the company covering low revenues and high operating cost for the FY 2018 to FY 2021 and estimates for FY 2022 Deliver and pitch your topic in the best possible manner with this Organizational Restructuring Process Assessing Current Problems Infographics PDF Use them to share invaluable insights on Ineffective Workflow, Increase In Operating, Decrease In Revenue and impress your audience. This template can be altered and modified as per your expectations. So, grab it now.
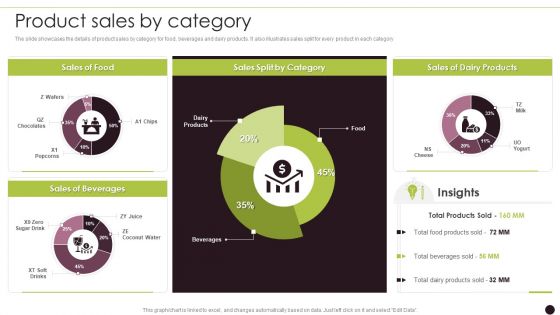
Canned Food Company Profile Product Sales By Category Infographics PDF
The slide showcases the details of product sales by category for food, beverages and dairy products. It also illustrates sales split for every product in each category Deliver and pitch your topic in the best possible manner with this Canned Food Company Profile Product Sales By Category Infographics PDF Use them to share invaluable insights on Sales Of Food, Sales Beverages, Sales Split and impress your audience. This template can be altered and modified as per your expectations. So, grab it now.
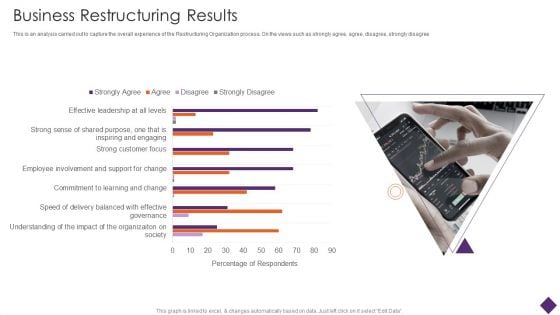
Business Restructuring Business Restructuring Results Ppt Infographics Summary PDF
This is an analysis carried out to capture the overall experience of the Restructuring Organization process. On the views such as strongly agree, agree, disagree, strongly disagree. Deliver an awe inspiring pitch with this creative Business Restructuring Business Restructuring Results Ppt Infographics Summary PDF bundle. Topics like Speed Delivery Balanced, Effective And Governance, Commitment Learning Change can be discussed with this completely editable template. It is available for immediate download depending on the needs and requirements of the user.
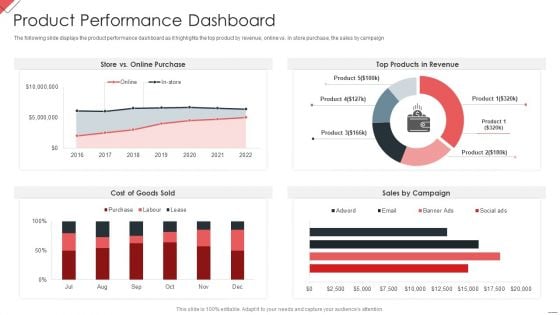
New Commodity Market Viability Review Product Performance Dashboard Infographics PDF
The following slide displays the product performance dashboard as it highlights the top product by revenue, online vs. in store purchase, the sales by campaign Deliver an awe inspiring pitch with this creative New Commodity Market Viability Review Product Performance Dashboard Infographics PDF bundle. Topics like Online Purchase, Products Revenue, Sales Campaign can be discussed with this completely editable template. It is available for immediate download depending on the needs and requirements of the user.
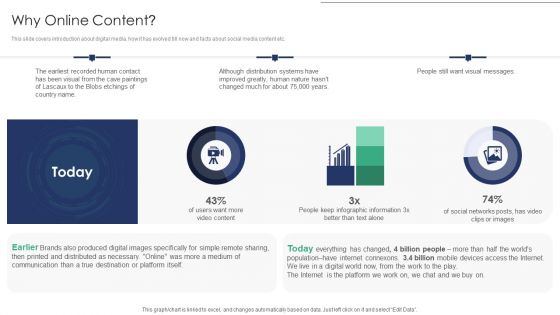
Online Asset Management Why Online Content Infographics PDF
This slide covers introduction about digital media, how it has evolved till now and facts about social media content etc. Deliver and pitch your topic in the best possible manner with this Online Asset Management Why Online Content Infographics PDF Use them to share invaluable insights on Earliest Recorded, Although Distribution, Destination Platform and impress your audience. This template can be altered and modified as per your expectations. So, grab it now.
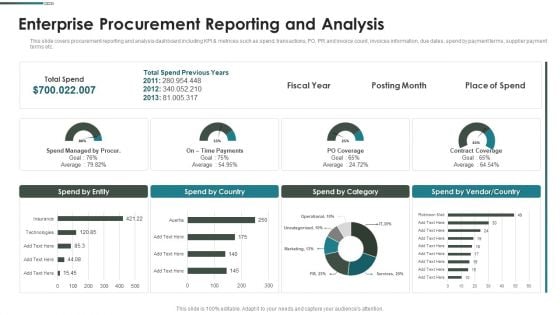
Purchase Assessment Process Enterprise Procurement Reporting And Analysis Infographics PDF
This slide covers procurement reporting and analysis dashboard including KPI metrices such as spend, transactions, PO, PR and invoice count, invoices information, due dates, spend by payment terms, supplier payment terms etc. Deliver an awe inspiring pitch with this creative Purchase Assessment Process Enterprise Procurement Reporting And Analysis Infographics PDF bundle. Topics like Spend Entity, Spend Country, Spend Category can be discussed with this completely editable template. It is available for immediate download depending on the needs and requirements of the user.
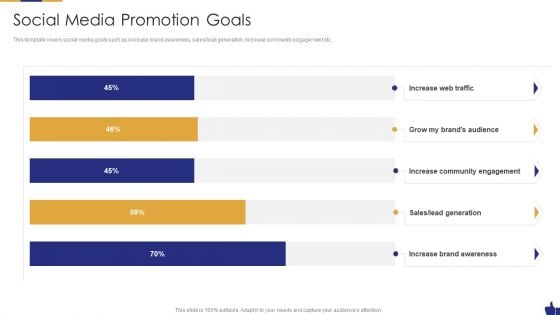
Digital Marketing Pitch Deck Social Media Promotion Goals Infographics PDF
This template covers social media goals such as increase brand awareness, sales lead generation, increase community engagement etc. Deliver and pitch your topic in the best possible manner with this Digital Marketing Pitch Deck Social Media Promotion Goals Infographics PDF Use them to share invaluable insights on Community Engagement, Lead Generation, Increase Brand and impress your audience. This template can be altered and modified as per your expectations. So, grab it now.
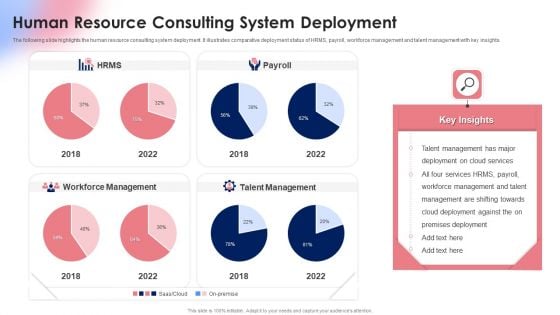
Human Resource Consulting System Deployment Ppt Portfolio Infographics PDF
The following slide highlights the human resource consulting system deployment. It illustrates comparative deployment status of HRMS, payroll, workforce management and talent management with key insights. Showcasing this set of slides titled Human Resource Consulting System Deployment Ppt Portfolio Infographics PDF. The topics addressed in these templates are Payroll, Workforce Management, Talent Management, 2018 To 2022. All the content presented in this PPT design is completely editable. Download it and make adjustments in color, background, font etc. as per your unique business setting.
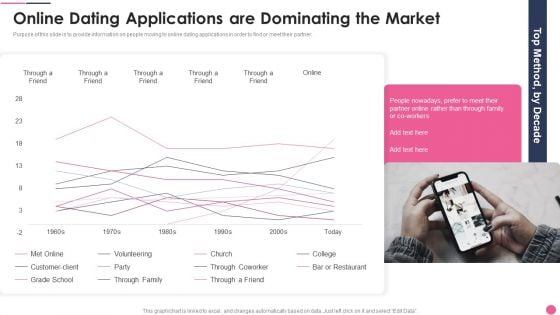
Online Dating Applications Are Dominating The Market Infographics PDF
Purpose of this slide is to provide information on people moving to online dating applications in order to find or meet their partner.Deliver an awe inspiring pitch with this creative Online Dating Applications Are Dominating The Market Infographics PDF bundle. Topics like Volunteering, Through Family, Through Coworker can be discussed with this completely editable template. It is available for immediate download depending on the needs and requirements of the user.
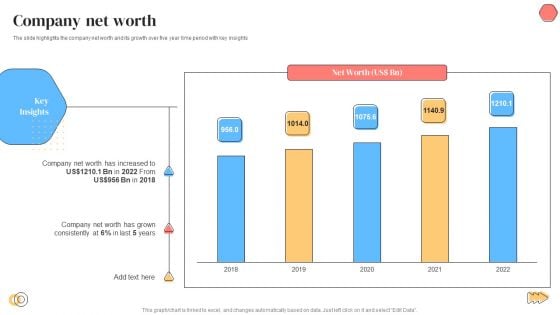
Banking Solutions Company Overview Company Net Worth Infographics PDF
The slide highlights the company net worth and its growth over five year time period with key insights. Deliver and pitch your topic in the best possible manner with this Banking Solutions Company Overview Company Net Worth Infographics PDF. Use them to share invaluable insights on Company Net Worth, Key Insights and impress your audience. This template can be altered and modified as per your expectations. So, grab it now.
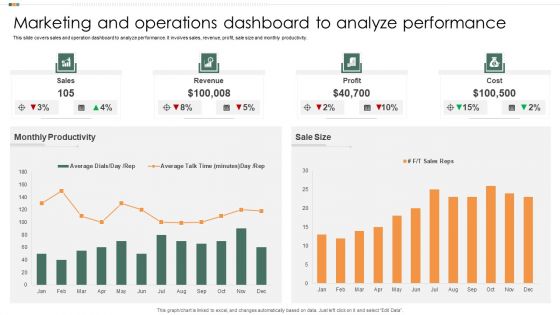
Marketing And Operations Dashboard To Analyze Performance Infographics PDF
This slide covers sales and operation dashboard to analyze performance. It involves sales, revenue, profit, sale size and monthly productivity. Showcasing this set of slides titled Marketing And Operations Dashboard To Analyze Performance Infographics PDF. The topics addressed in these templates are Monthly Productivity, Sales, Revenue. All the content presented in this PPT design is completely editable. Download it and make adjustments in color, background, font etc. as per your unique business setting.
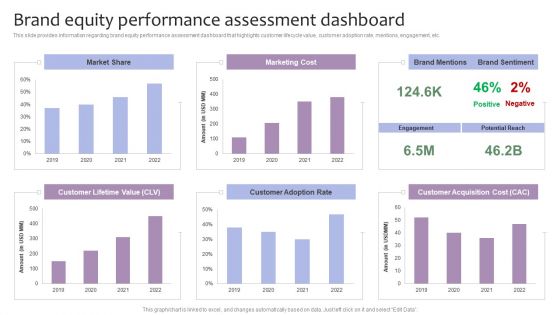
Strategic Brand Management Brand Equity Performance Assessment Dashboard Infographics PDF
This slide provides information regarding brand equity performance assessment dashboard that highlights customer lifecycle value, customer adoption rate, mentions, engagement, etc. Deliver and pitch your topic in the best possible manner with this Strategic Brand Management Brand Equity Performance Assessment Dashboard Infographics PDF. Use them to share invaluable insights on Market Share, Marketing Cost, Customer Lifetime Value, Customer Adoption Rate and impress your audience. This template can be altered and modified as per your expectations. So, grab it now.
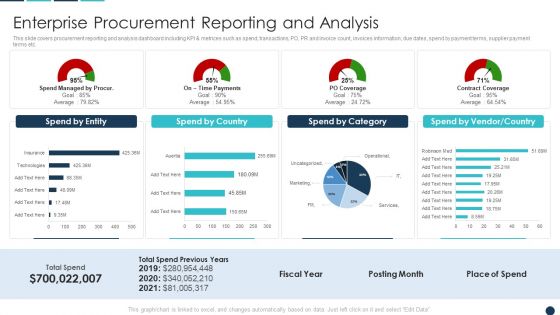
Procurement Analytics Tools And Strategies Enterprise Procurement Reporting Infographics PDF
This slide covers procurement reporting and analysis dashboard including KPI metrices such as spend, transactions, PO, PR and invoice count, invoices information, due dates, spend by payment terms, supplier payment terms etc. Deliver an awe inspiring pitch with this creative Procurement Analytics Tools And Strategies Enterprise Procurement Reporting Infographics PDF bundle. Topics like Spend By Country, Spend Category, Vendor Country can be discussed with this completely editable template. It is available for immediate download depending on the needs and requirements of the user.

Website SEO Audit With Page Load Speed Infographics PDF
This slide highlights the SEO audit which showcases the page score, critical errors, warnings, crawled pages results, site health, hreflang audit and page load speed.Deliver and pitch your topic in the best possible manner with this Website SEO Audit With Page Load Speed Infographics PDF. Use them to share invaluable insights on Compare Crawls, Total Warnings, Load Speed and impress your audience. This template can be altered and modified as per your expectations. So, grab it now.
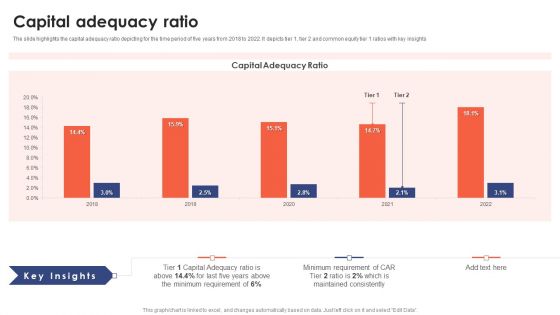
Banking Institution Company Profile Capital Adequacy Ratio Infographics PDF
The slide highlights the capital adequacy ratio depicting for the time period of five years from 2018 to 2022. It depicts tier 1, tier 2 and common equity tier 1 ratios with key insights.Deliver an awe inspiring pitch with this creative Banking Institution Company Profile Capital Adequacy Ratio Infographics PDF bundle. Topics like Capital Adequacy, Minimum Requirement, Maintained Consistently can be discussed with this completely editable template. It is available for immediate download depending on the needs and requirements of the user.
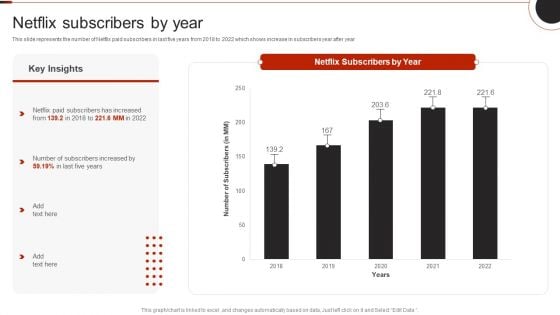
Netflix Company Outline Netflix Subscribers By Year Infographics PDF
This slide represents the number of Netflix paid subscribers in last five years from 2018 to 2022 which shows increase in subscribers year after year.Deliver an awe inspiring pitch with this creative Netflix Company Outline Netflix Subscribers By Year Infographics PDF bundle. Topics like Netflix Subscribers, Netflix Paid, Subscribers Increased can be discussed with this completely editable template. It is available for immediate download depending on the needs and requirements of the user.
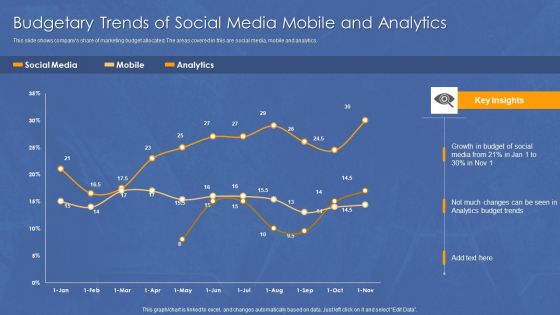
Budgetary Trends Of Social Media Mobile And Analytics Infographics PDF
This slide shows companys share of marketing budget allocated. The areas covered in this are social media, mobile and analytics.Showcasing this set of slides titled Budgetary Trends Of Social Media Mobile And Analytics Infographics PDF. The topics addressed in these templates are Growth Budget, Changes Can, Analytics Budget. All the content presented in this PPT design is completely editable. Download it and make adjustments in color, background, font etc. as per your unique business setting.
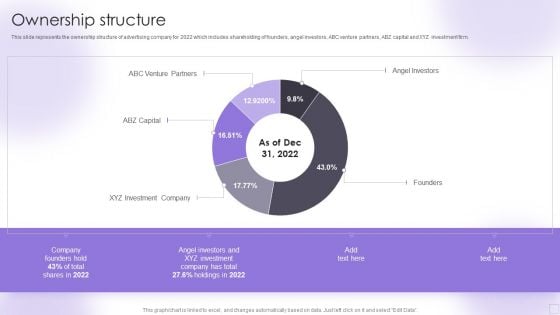
Advertising Services Company Profile Ownership Structure Infographics PDF
This slide represents the ownership structure of advertising company for 2022 which includes shareholding of founders, angel investors, ABC venture partners, ABZ capital and XYZ investment firm. Deliver and pitch your topic in the best possible manner with this Advertising Services Company Profile Ownership Structure Infographics PDF. Use them to share invaluable insights on Venture Partners, Capital, Investment Company, Angel Investors and impress your audience. This template can be altered and modified as per your expectations. So, grab it now.
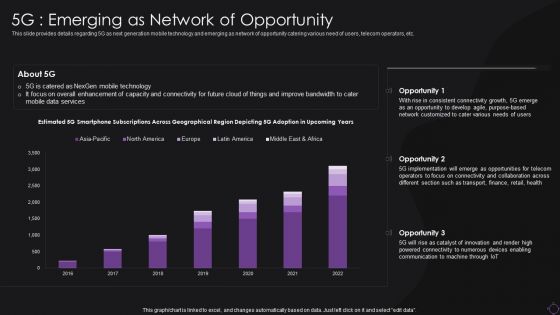
5G Emerging As Network Of Opportunity Infographics PDF
This slide provides details regarding 5G as next generation mobile technology and emerging as network of opportunity catering various need of users, telecom operators, etc. Deliver an awe inspiring pitch with this creative 5G Emerging As Network Of Opportunity Infographics PDF bundle. Topics like Technology, Mobile Data Services, Implementation can be discussed with this completely editable template. It is available for immediate download depending on the needs and requirements of the user.
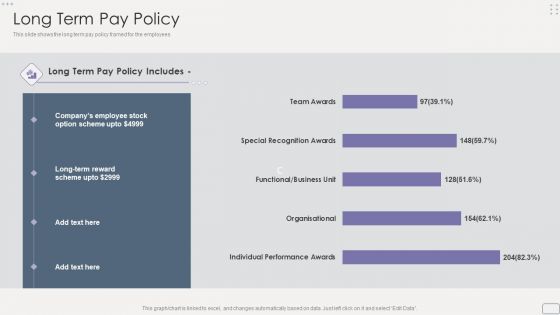
Income Assessment Report Long Term Pay Policy Infographics PDF
This slide shows the long term pay policy framed for the employees .Deliver and pitch your topic in the best possible manner with this Income Assessment Report Long Term Pay Policy Infographics PDF. Use them to share invaluable insights on Somewhat Satisfied, Respective Salary, Survey Findings and impress your audience. This template can be altered and modified as per your expectations. So, grab it now.
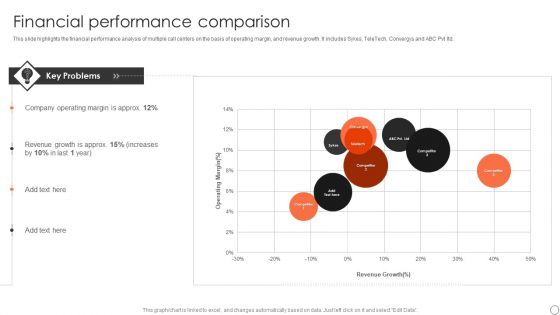
Customer Support Services Company Profile Financial Performance Comparison Infographics PDF
This slide highlights the financial performance analysis of multiple call centers on the basis of operating margin, and revenue growth. It includes Sykes, TeleTech, Convergys and ABC Pvt ltd. Deliver and pitch your topic in the best possible manner with this Customer Support Services Company Profile Financial Performance Comparison Infographics PDF. Use them to share invaluable insights on Revenue Growth, Operating Margin and impress your audience. This template can be altered and modified as per your expectations. So, grab it now.
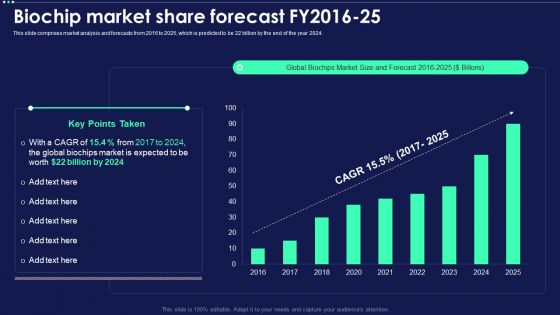
Micro Chip Biochip Market Share Forecast FY2016 25 Infographics PDF
This slide comprises market analysis and forecasts from 2016 to 2025, which is predicted to be 22 billion by the end of the year 2024. Deliver an awe inspiring pitch with this creative Micro Chip Biochip Market Share Forecast FY2016 25 Infographics PDF bundle. Topics like Global Biochips, Market, Size And Forecast, 2016 To 2025 can be discussed with this completely editable template. It is available for immediate download depending on the needs and requirements of the user.
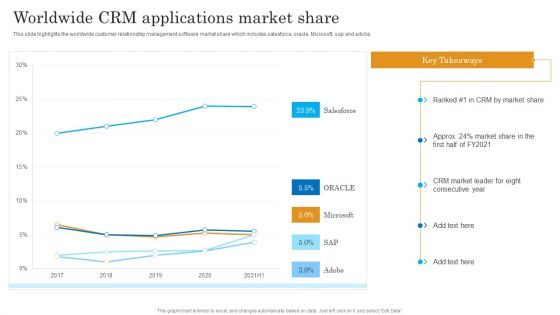
Worldwide CRM Applications Market Share Salesforce Business Profile Infographics PDF
This slide highlights the worldwide customer relationship management software market share which includes salesforce, oracle, Microsoft, sap and adobe. Deliver and pitch your topic in the best possible manner with this Worldwide CRM Applications Market Share Salesforce Business Profile Infographics PDF. Use them to share invaluable insights on Worldwide, Applications Market Share and impress your audience. This template can be altered and modified as per your expectations. So, grab it now.
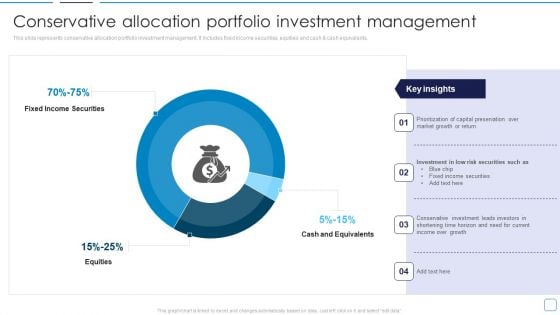
Portfolio Wealth Management Conservative Allocation Portfolio Investment Infographics PDF
This slide represents conservative allocation portfolio investment management. It includes fixed income securities, equities and cash and cash equivalents. Deliver an awe inspiring pitch with this creative Portfolio Wealth Management Conservative Allocation Portfolio Investment Infographics PDF bundle. Topics like Fixed Income Securities, Equities, Cash And Equivalents can be discussed with this completely editable template. It is available for immediate download depending on the needs and requirements of the user.
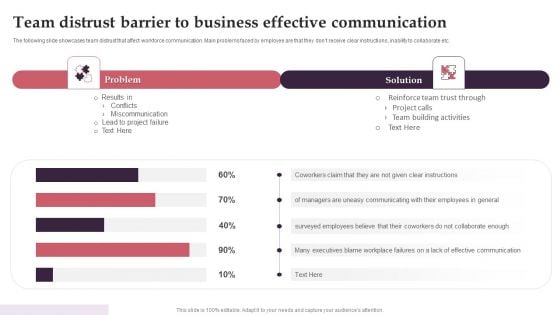
Team Distrust Barrier To Business Effective Communication Infographics PDF
The following slide showcases team distrust that affect workforce communication. Main problems faced by employee are that they dont receive clear instructions, inability to collaborate etc. Pitch your topic with ease and precision using this Team Distrust Barrier To Business Effective Communication Infographics PDF. This layout presents information on Team Distrust Barrier, Business Effective Communication. It is also available for immediate download and adjustment. So, changes can be made in the color, design, graphics or any other component to create a unique layout.
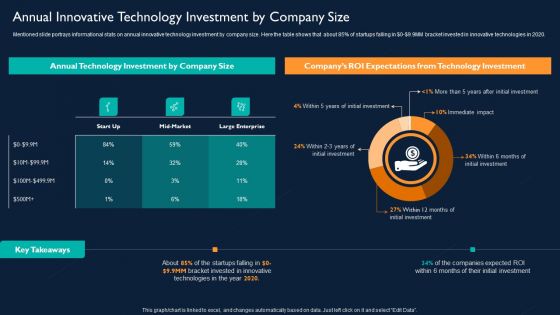
Annual Innovative Technology Investment By Company Size Infographics PDF
Mentioned slide portrays informational stats on annual innovative technology investment by company size. Here the table shows that about 85 percentage of startups falling in dollar 0 dollar 9.9MM bracket invested in innovative technologies in 2020. Deliver an awe inspiring pitch with this creative Annual Innovative Technology Investment By Company Size Infographics PDF bundle. Topics like Annual Technology Investment, Innovative can be discussed with this completely editable template. It is available for immediate download depending on the needs and requirements of the user.
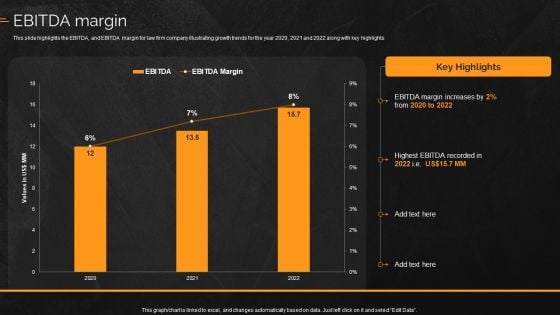
Law And Enforcement Company Profile Ebitda Margin Infographics PDF
This slide highlights the EBITDA, and EBITDA margin for law firm company illustrating growth trends for the year 2020, 2021 and 2022 along with key highlights. Deliver and pitch your topic in the best possible manner with this Law And Enforcement Company Profile Ebitda Margin Infographics PDF. Use them to share invaluable insights on Ebitda Margin and impress your audience. This template can be altered and modified as per your expectations. So, grab it now.
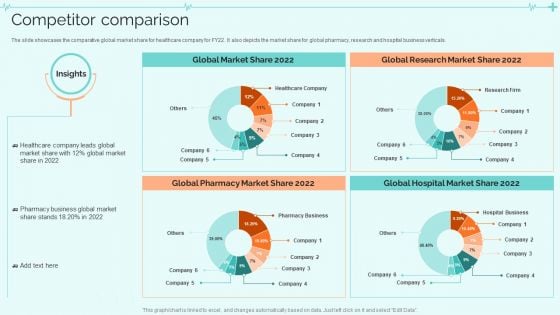
Clinical Services Company Profile Competitor Comparison Infographics PDF
The slide showcases the comparative global market share for healthcare company for FY22. It also depicts the market share for global pharmacy, research and hospital business verticals. Deliver an awe inspiring pitch with this creative Clinical Services Company Profile Competitor Comparison Infographics PDF bundle. Topics like Global Hospital Market Share, Global Pharmacy Market Share, Global Research Market Share can be discussed with this completely editable template. It is available for immediate download depending on the needs and requirements of the user.
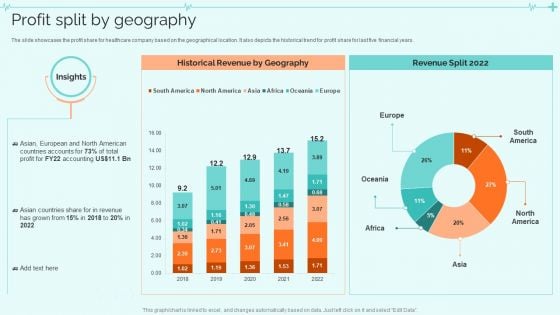
Clinical Services Company Profile Profit Split By Geography Infographics PDF
The slide showcases the profit share for healthcare company based on the geographical location. It also depicts the historical trend for profit share for last five financial years. Deliver and pitch your topic in the best possible manner with this Clinical Services Company Profile Profit Split By Geography Infographics PDF. Use them to share invaluable insights on Historical Revenue By Geography, Revenue Split and impress your audience. This template can be altered and modified as per your expectations. So, grab it now.
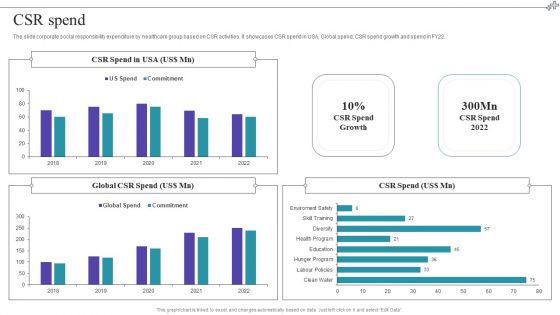
Medical Care Company Overview CSR Spend Infographics PDF
The slide corporate social responsibility expenditure by healthcare group based on CSR activities. It showcases CSR spend in USA, Global spend, CSR spend growth and spend in FY22. Deliver an awe inspiring pitch with this creative Medical Care Company Overview CSR Spend Infographics PDF bundle. Topics like CSR Spend can be discussed with this completely editable template. It is available for immediate download depending on the needs and requirements of the user.
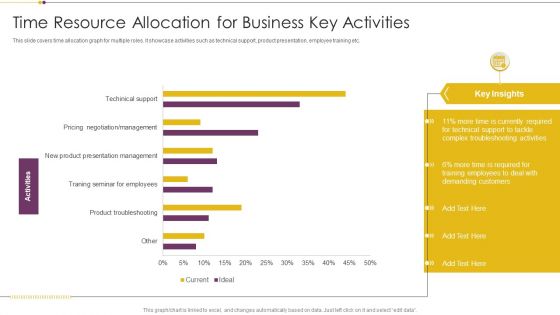
Time Resource Allocation For Business Key Activities Infographics PDF
This slide covers time allocation graph for multiple roles. It showcase activities such as technical support, product presentation, employee training etc. Pitch your topic with ease and precision using this Time Resource Allocation For Business Key Activities Infographics PDF. This layout presents information on Currently Required, Demanding Customers, Training Employees. It is also available for immediate download and adjustment. So, changes can be made in the color, design, graphics or any other component to create a unique layout.
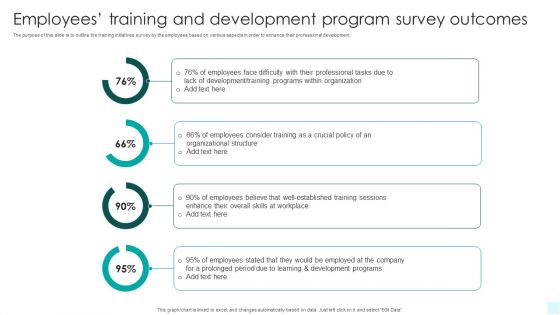
Employees Training And Development Program Survey Outcomes Infographics PDF
The purpose of this slide is to outline the training initiatives survey by the employees based on various aspects in order to enhance their professional development. Showcasing this set of slides titled Employees Training And Development Program Survey Outcomes Infographics PDF. The topics addressed in these templates are Organizational Structure, Development, Employees. All the content presented in this PPT design is completely editable. Download it and make adjustments in color, background, font etc. as per your unique business setting.
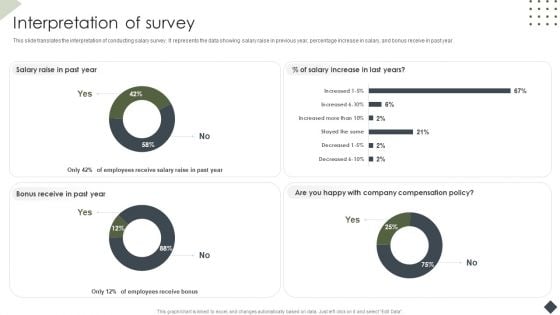
Income Assessment Document Interpretation Of Survey Ppt Inspiration Infographics PDF
This slide translates the interpretation of conducting salary survey. It represents the data showing salary raise in previous year, percentage increase in salary, and bonus receive in past year. Deliver an awe inspiring pitch with this creative Income Assessment Document Interpretation Of Survey Ppt Inspiration Infographics PDF bundle. Topics like Employees Receive Bonus, Bonus Receive, Past Year can be discussed with this completely editable template. It is available for immediate download depending on the needs and requirements of the user.
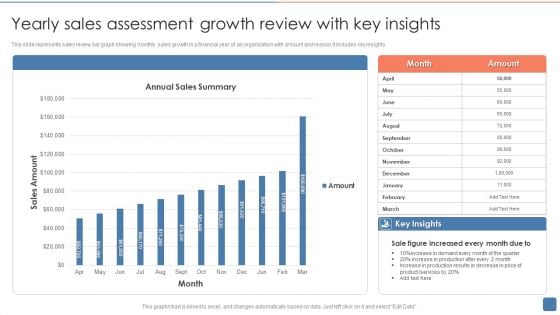
Yearly Sales Assessment Growth Review With Key Insights Infographics PDF
This slide represents sales review bar graph showing monthly sales growth in a financial year of an organization with amount and reason.It includes key insights. Showcasing this set of slides titled Yearly Sales Assessment Growth Review With Key Insights Infographics PDF. The topics addressed in these templates are Sale Figure, Demand, Services. All the content presented in this PPT design is completely editable. Download it and make adjustments in color, background, font etc. as per your unique business setting.
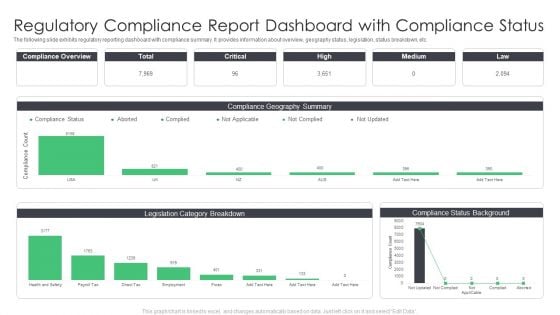
Regulatory Compliance Report Dashboard With Compliance Status Infographics PDF
The following slide exhibits regulatory reporting dashboard with compliance summary. It provides information about overview, geography status, legislation, status breakdown, etc. Pitch your topic with ease and precision using this Regulatory Compliance Report Dashboard With Compliance Status Infographics PDF. This layout presents information on Dashboard With Compliance Status, Regulatory Compliance Report. It is also available for immediate download and adjustment. So, changes can be made in the color, design, graphics or any other component to create a unique layout.
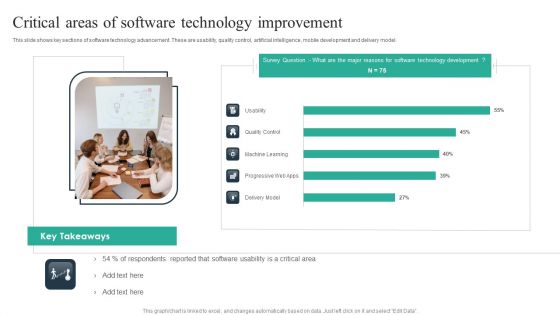
Critical Areas Of Software Technology Improvement Ppt Professional Infographics PDF
This slide shows key sections of software technology advancement. These are usability, quality control, artificial intelligence, mobile development and delivery model. Showcasing this set of slides titled Critical Areas Of Software Technology Improvement Ppt Professional Infographics PDF. The topics addressed in these templates are Usability, Quality Control, Machine Learning. All the content presented in this PPT design is completely editable. Download it and make adjustments in color, background, font etc. as per your unique business setting.
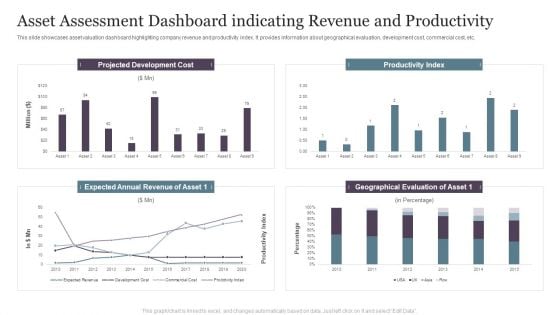
Asset Assessment Dashboard Indicating Revenue And Productivity Infographics PDF
This slide showcases asset valuation dashboard highlighting company revenue and productivity index. It provides information about geographical evaluation, development cost, commercial cost, etc.Pitch your topic with ease and precision using this Asset Assessment Dashboard Indicating Revenue And Productivity Infographics PDF. This layout presents information on Projected Development, Productivity Index, Geographical Evaluation. It is also available for immediate download and adjustment. So, changes can be made in the color, design, graphics or any other component to create a unique layout.
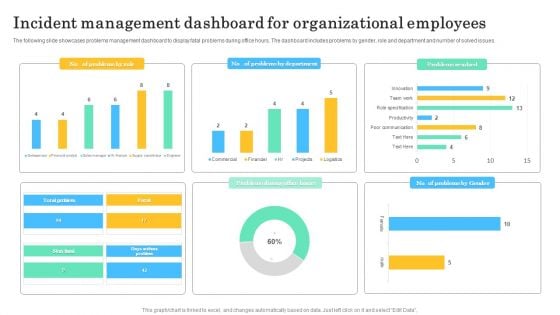
Incident Management Dashboard For Organizational Employees Infographics PDF
The following slide showcases problems management dashboard to display fatal problems during office hours. The dashboard includes problems by gender, role and department and number of solved issues. Showcasing this set of slides titled Incident Management Dashboard For Organizational Employees Infographics PDF. The topics addressed in these templates are Incident Management Dashboard, Organizational Employees. All the content presented in this PPT design is completely editable. Download it and make adjustments in color, background, font etc. as per your unique business setting.
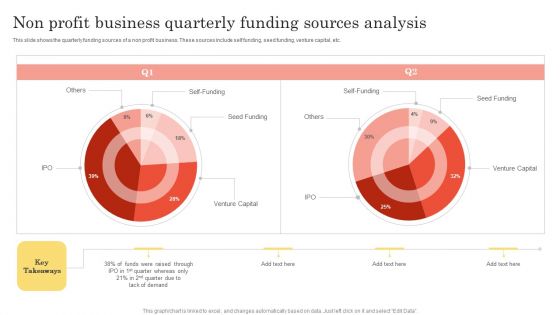
Non Profit Business Quarterly Funding Sources Analysis Infographics PDF
This slide shows the quarterly funding sources of a non profit business. These sources include self funding, seed funding, venture capital, etc. Pitch your topic with ease and precision using this Non Profit Business Quarterly Funding Sources Analysis Infographics PDF. This layout presents information on Venture Capital, Seed Funding, Quarter Whereas. It is also available for immediate download and adjustment. So, changes can be made in the color, design, graphics or any other component to create a unique layout.
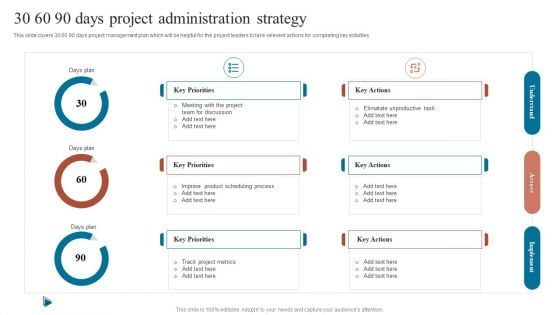
30 60 90 Days Project Administration Strategy Infographics PDF
This slide covers 30 60 90 days project management plan which will be helpful for the project leaders to take relevent actions for completing key activities.Pitch your topic with ease and precision using this 30 60 90 Days Project Administration Strategy Infographics PDF. This layout presents information on Team Discussion, Improve Product, Scheduling Process. It is also available for immediate download and adjustment. So, changes can be made in the color, design, graphics or any other component to create a unique layout.
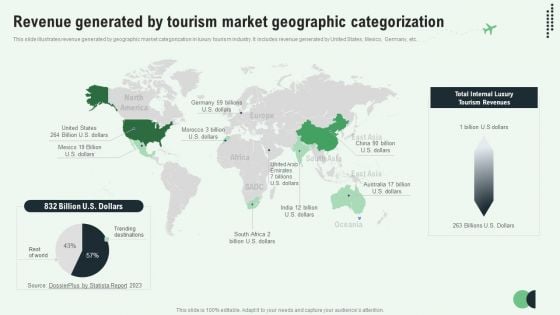
Revenue Generated By Tourism Market Geographic Categorization Infographics PDF
This slide illustrates revenue generated by geographic market categorization in luxury tourism industry. It includes revenue generated by United States, Mexico, Germany, etc. Showcasing this set of slides titled Revenue Generated By Tourism Market Geographic Categorization Infographics PDF. The topics addressed in these templates are Tourism Market, Geographic Categorization. All the content presented in this PPT design is completely editable. Download it and make adjustments in color, background, font etc. as per your unique business setting.
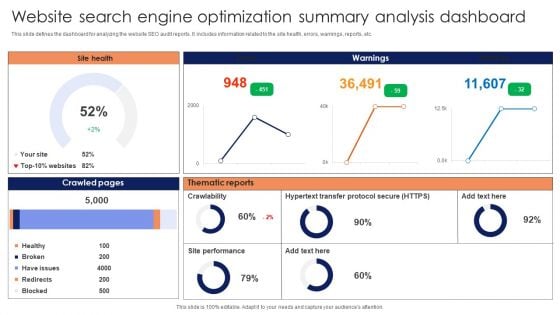
Website Search Engine Optimization Summary Analysis Dashboard Infographics PDF
This slide defines the dashboard for analyzing the website SEO audit reports. It includes information related to the site health, errors, warnings, reports, etc. Showcasing this set of slides titled Website Search Engine Optimization Summary Analysis Dashboard Infographics PDF. The topics addressed in these templates are Crawled Pages, Thematic Reports, Site Health, Warnings. All the content presented in this PPT design is completely editable. Download it and make adjustments in color, background, font etc. as per your unique business setting.
Continuous IT Project Tracking In Devops Dashboard Infographics PDF
This slide illustrates facts and data figures related to software project monitoring with DevOps. It includes lines of code, code elements, quality gates, rules, issues, etc. Showcasing this set of slides titled Continuous IT Project Tracking In Devops Dashboard Infographics PDF. The topics addressed in these templates are Most Recent, Baseline Build, Code Elements. All the content presented in this PPT design is completely editable. Download it and make adjustments in color, background, font etc. as per your unique business setting.
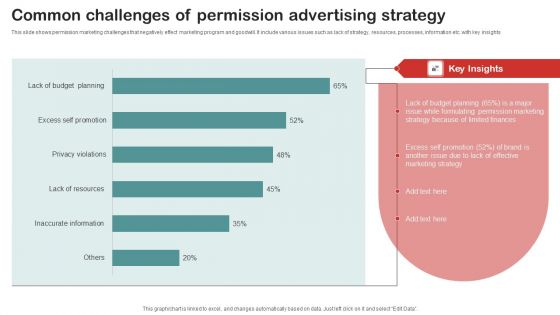
Common Challenges Of Permission Advertising Strategy Infographics PDF
This slide shows permission marketing challenges that negatively effect marketing program and goodwill. It include various issues such as lack of strategy, resources, processes, information etc. with key insights. Showcasing this set of slides titled Common Challenges Of Permission Advertising Strategy Infographics PDF. The topics addressed in these templates are Strategy, Finances, Permission Marketing. All the content presented in this PPT design is completely editable. Download it and make adjustments in color, background, font etc. as per your unique business setting.
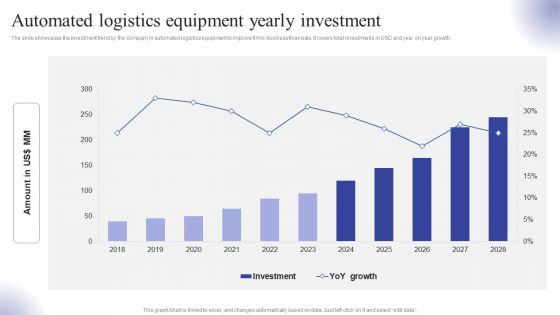
Automated Logistics Equipment Yearly Investment Ppt Infographics Outfit PDF
The slide showcases the investment trend by the company in automated logistics equipment to improve firms business financials. It covers total investments in USD and year on year growth. There are so many reasons you need a Automated Logistics Equipment Yearly Investment Ppt Infographics Outfit PDF. The first reason is you can not spend time making everything from scratch, Thus, Slidegeeks has made presentation templates for you too. You can easily download these templates from our website easily.
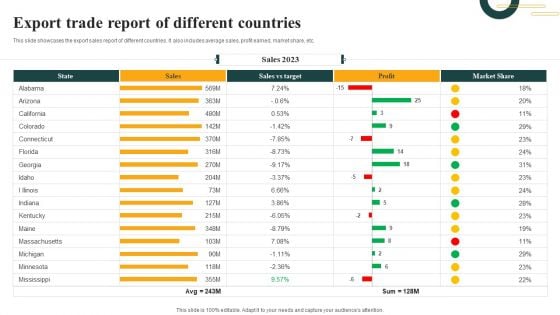
Export Trade Report Of Different Countries Infographics PDF
This slide showcases the export sales report of different countries. It also includes average sales, profit earned, market share, etc. Showcasing this set of slides titled Export Trade Report Of Different Countries Infographics PDF. The topics addressed in these templates are Sales Vs Target, Sales, Market Share. All the content presented in this PPT design is completely editable. Download it and make adjustments in color, background, font etc. as per your unique business setting.
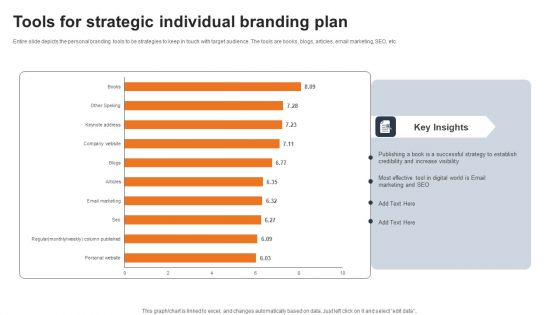
Tools For Strategic Individual Branding Plan Infographics PDF
Entire slide depicts the personal branding tools to be strategies to keep in touch with target audience. The tools are books, blogs, articles, email marketing, SEO, etc. Showcasing this set of slides titled Tools For Strategic Individual Branding Plan Infographics PDF. The topics addressed in these templates are Successful Strategy, Tool In Digital, Marketing And SEO. All the content presented in this PPT design is completely editable. Download it and make adjustments in color, background, font etc. as per your unique business setting.
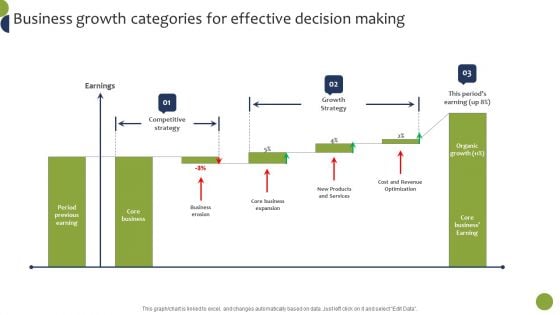
Business Growth Categories For Effective Decision Making Infographics PDF
The best PPT templates are a great way to save time, energy, and resources. Slidegeeks have 100 percent editable powerpoint slides making them incredibly versatile. With these quality presentation templates, you can create a captivating and memorable presentation by combining visually appealing slides and effectively communicating your message. Download Business Growth Categories For Effective Decision Making Infographics PDF from Slidegeeks and deliver a wonderful presentation.
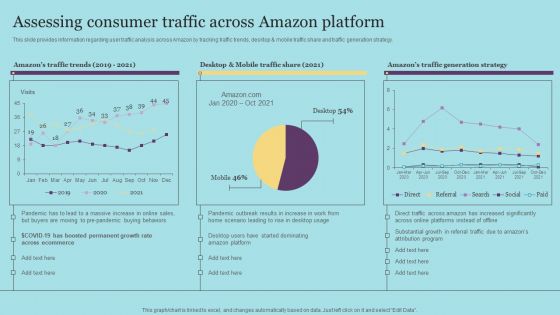
Assessing Consumer Traffic Across Amazon Platform Infographics PDF
This slide provides information regarding user traffic analysis across Amazon by tracking traffic trends, desktop and mobile traffic share and traffic generation strategy. Find a pre-designed and impeccable Assessing Consumer Traffic Across Amazon Platform Infographics PDF. The templates can ace your presentation without additional effort. You can download these easy-to-edit presentation templates to make your presentation stand out from others. So, what are you waiting for Download the template from Slidegeeks today and give a unique touch to your presentation.
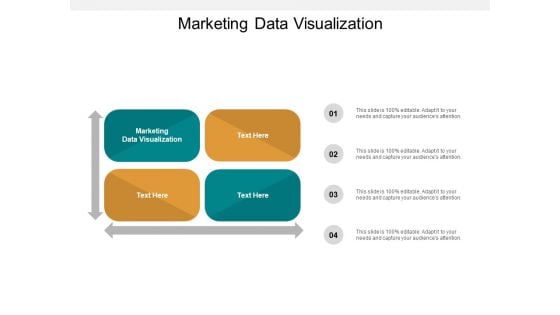
Marketing Data Visualization Ppt PowerPoint Presentation Infographics Rules Cpb
Presenting this set of slides with name marketing data visualization ppt powerpoint presentation infographics rules cpb. This is an editable Powerpoint four stages graphic that deals with topics like marketing data visualization to help convey your message better graphically. This product is a premium product available for immediate download and is 100 percent editable in Powerpoint. Download this now and use it in your presentations to impress your audience.

Portfolio Approach Risk Management Ppt PowerPoint Presentation File Infographics Cpb
Presenting this set of slides with name portfolio approach risk management ppt powerpoint presentation file infographics cpb. This is an editable Powerpoint four stages graphic that deals with topics like portfolio approach risk management to help convey your message better graphically. This product is a premium product available for immediate download and is 100 percent editable in Powerpoint. Download this now and use it in your presentations to impress your audience.
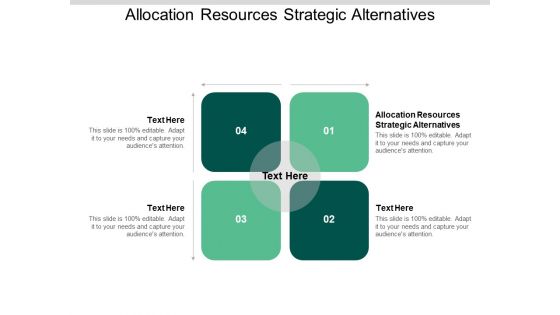
Allocation Resources Strategic Alternatives Ppt PowerPoint Presentation Infographics Show Cpb
Presenting this set of slides with name allocation resources strategic alternatives ppt powerpoint presentation infographics show cpb. This is an editable Powerpoint four stages graphic that deals with topics like allocation resources strategic alternatives to help convey your message better graphically. This product is a premium product available for immediate download and is 100 percent editable in Powerpoint. Download this now and use it in your presentations to impress your audience.
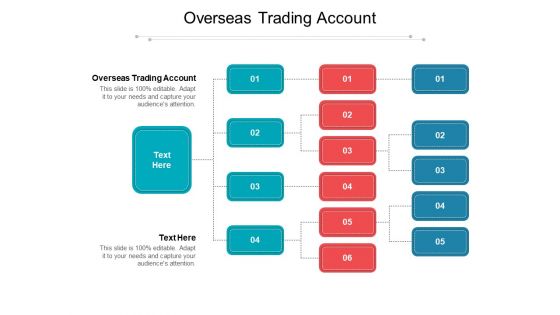
Overseas Trading Account Ppt PowerPoint Presentation Infographics Maker Cpb Pdf
Presenting this set of slides with name overseas trading account ppt powerpoint presentation infographics maker cpb pdf. This is an editable Powerpoint six stages graphic that deals with topics like overseas trading account to help convey your message better graphically. This product is a premium product available for immediate download and is 100 percent editable in Powerpoint. Download this now and use it in your presentations to impress your audience.

Banking Platform Ppt PowerPoint Presentation Infographics Gallery Cpb
Presenting this set of slides with name banking platform ppt powerpoint presentation infographics gallery cpb. This is an editable Powerpoint three stages graphic that deals with topics like banking platform to help convey your message better graphically. This product is a premium product available for immediate download and is 100 percent editable in Powerpoint. Download this now and use it in your presentations to impress your audience.
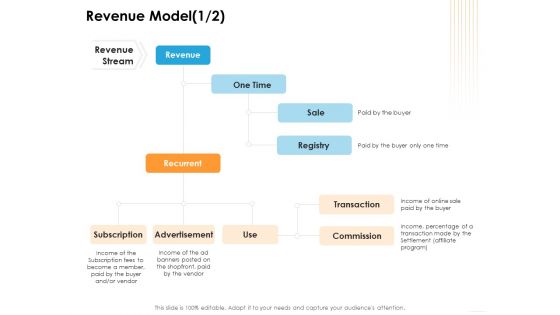
Ecommerce Management Revenue Model Sale Ppt Infographics Example PDF
This is a ecommerce management revenue model sale ppt infographics example pdf template with various stages. Focus and dispense information on one stages using this creative set, that comes with editable features. It contains large content boxes to add your information on topics like income, sale, revenue model. You can also showcase facts, figures, and other relevant content using this PPT layout. Grab it now.
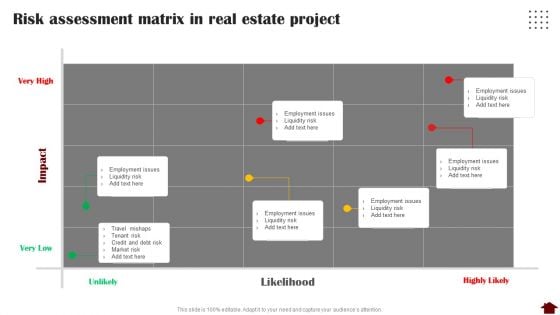
Risk Assessment Matrix In Real Estate Project Infographics PDF
Presenting Risk Assessment Matrix In Real Estate Project Infographics PDF to provide visual cues and insights. Share and navigate important information on seven stages that need your due attention. This template can be used to pitch topics like Liquidity Risk, Risk Assessment Matrix, Real Estate Project. In addtion, this PPT design contains high resolution images, graphics, etc, that are easily editable and available for immediate download.
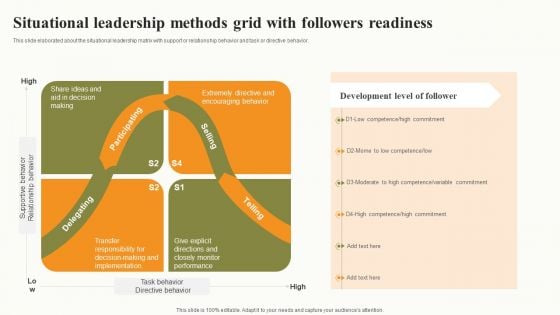
Situational Leadership Methods Grid With Followers Readiness Infographics PDF
This slide elaborated about the situational leadership matrix with support or relationship behavior and task or directive behavior. Persuade your audience using this Situational Leadership Methods Grid With Followers Readiness Infographics PDF. This PPT design covers four stages, thus making it a great tool to use. It also caters to a variety of topics including Performance, Implementation, Situational Leadership Methods Grid. Download this PPT design now to present a convincing pitch that not only emphasizes the topic but also showcases your presentation skills.
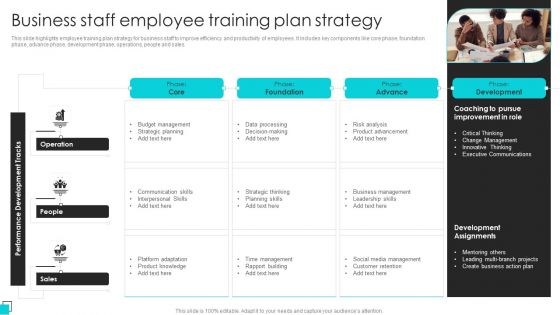
Business Staff Employee Training Plan Strategy Infographics PDF
This slide highlights employee training plan strategy for business staff to improve efficiency and productivity of employees. It includes key components like core phase, foundation phase, advance phase, development phase, operations, people and sales. Presenting Business Staff Employee Training Plan Strategy Infographics PDF to dispense important information. This template comprises Three stages. It also presents valuable insights into the topics including Core, Foundation, Advance. This is a completely customizable PowerPoint theme that can be put to use immediately. So, download it and address the topic impactfully.
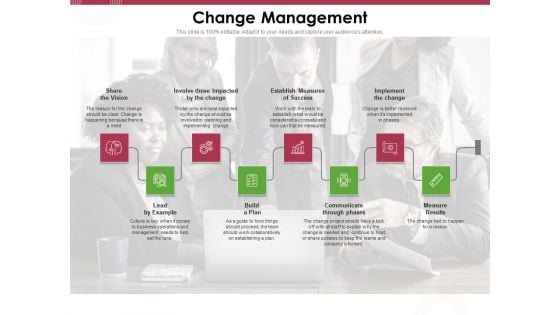
Online Product Planning Change Management Ppt Infographics Sample PDF
Presenting this set of slides with name online product planning change management ppt infographics sample pdf. This is a eight stage process. The stages in this process are build a plan, communicate through phases, measure results, implement the change, establish measures of success, lead by example. This is a completely editable PowerPoint presentation and is available for immediate download. Download now and impress your audience.
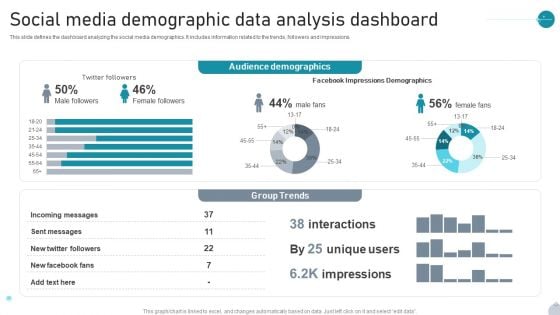
Social Media Demographic Data Analysis Dashboard Infographics PDF
This slide defines the dashboard analyzing the social media demographics. It includes information related to the trends, followers and impressions. Pitch your topic with ease and precision using this Social Media Demographic Data Analysis Dashboard Infographics PDF. This layout presents information on Audience Demographics, Group Trends, Impressions Demographics It is also available for immediate download and adjustment. So, changes can be made in the color, design, graphics or any other component to create a unique layout.
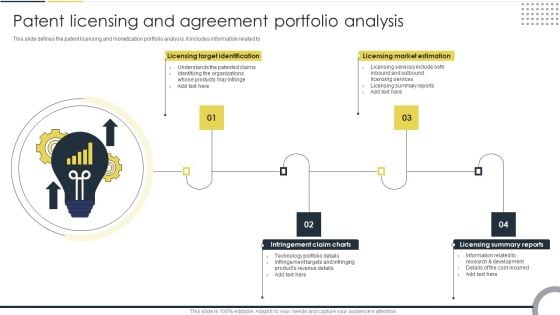
Patent Licensing And Agreement Portfolio Analysis Infographics PDF
This slide defines the patent licensing and monetization portfolio analysis. It includes information related toPresenting Patent Licensing And Agreement Portfolio Analysis Infographics PDF to dispense important information. This template comprises four stages. It also presents valuable insights into the topics including Licensing Target Identification, Licensing Market Estimation, Infringement Claim Charts. This is a completely customizable PowerPoint theme that can be put to use immediately. So, download it and address the topic impactfully.
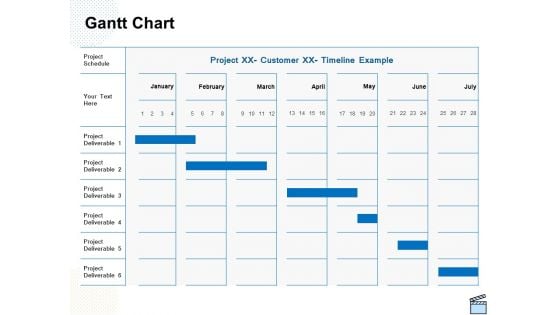
Professional Picture Proposal Gantt Chart Ppt Infographics Graphics Design PDF
Your complex projects can be managed and organized simultaneously using this detailed professional picture proposal gantt chart ppt infographics graphics design pdf template. Track the milestones, tasks, phases, activities, and subtasks to get an updated visual of your project. Share your planning horizon and release plan with this well crafted presentation template. This exemplary template can be used to plot various dependencies to distinguish the tasks in the pipeline and their impact on the schedules and deadlines of the project. Apart from this, you can also share this visual presentation with your team members and stakeholders. It a resourceful tool that can be incorporated into your business structure. Therefore, download and edit it conveniently to add the data and statistics as per your requirement.
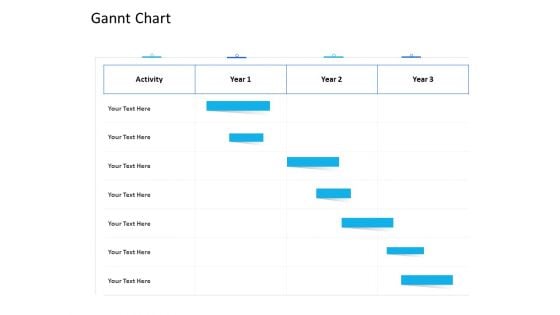
Organization Manpower Management Technology Gannt Chart Infographics PDF
Your complex projects can be managed and organized simultaneously using this detailed organization manpower management technology gannt chart infographics pdf template. Track the milestones, tasks, phases, activities, and subtasks to get an updated visual of your project. Share your planning horizon and release plan with this well crafted presentation template. This exemplary template can be used to plot various dependencies to distinguish the tasks in the pipeline and their impact on the schedules and deadlines of the project. Apart from this, you can also share this visual presentation with your team members and stakeholders. It a resourceful tool that can be incorporated into your business structure. Therefore, download and edit it conveniently to add the data and statistics as per your requirement.
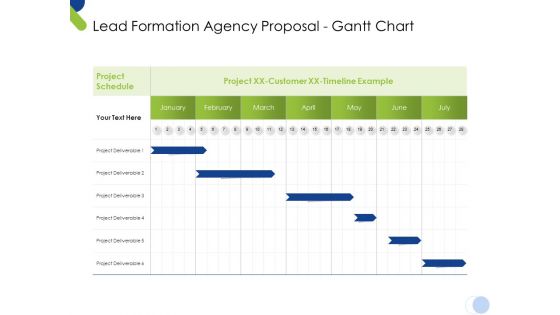
Lead Formation Agency Proposal Gantt Chart Ppt Summary Infographics PDF
Your complex projects can be managed and organized simultaneously using this detailed lead formation agency proposal gantt chart ppt summary infographics pdf template. Track the milestones, tasks, phases, activities, and subtasks to get an updated visual of your project. Share your planning horizon and release plan with this well crafted presentation template. This exemplary template can be used to plot various dependencies to distinguish the tasks in the pipeline and their impact on the schedules and deadlines of the project. Apart from this, you can also share this visual presentation with your team members and stakeholders. It a resourceful tool that can be incorporated into your business structure. Therefore, download and edit it conveniently to add the data and statistics as per your requirement.
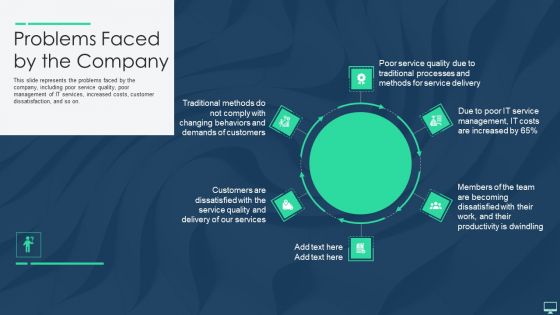
Problems Faced By The Company Ppt Infographics Themes PDF
This slide represents the problems faced by the company, including poor service quality, poor management of IT services, increased costs, customer dissatisfaction, and so on. Presenting problems faced by the company ppt infographics themes pdf to provide visual cues and insights. Share and navigate important information on six stages that need your due attention. This template can be used to pitch topics like quality, customers, service, methods, management. In addtion, this PPT design contains high resolution images, graphics, etc, that are easily editable and available for immediate download.
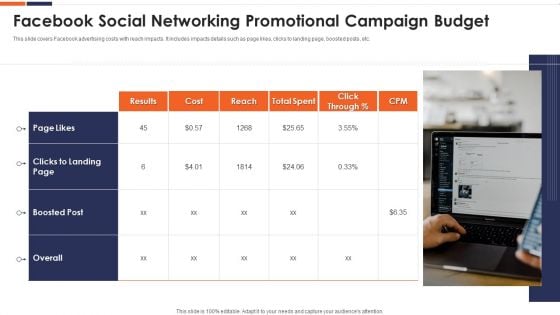
Facebook Social Networking Promotional Campaign Budget Ppt Infographics Themes PDF
This slide covers Facebook advertising costs with reach impacts. It includes impacts details such as page likes, clicks to landing page, boosted posts, etc. Persuade your audience using this facebook social networking promotional campaign budget ppt infographics themes pdf. This PPT design covers one stages, thus making it a great tool to use. It also caters to a variety of topics including cost, boosted post, cpm, total spent, reach. Download this PPT design now to present a convincing pitch that not only emphasizes the topic but also showcases your presentation skills.
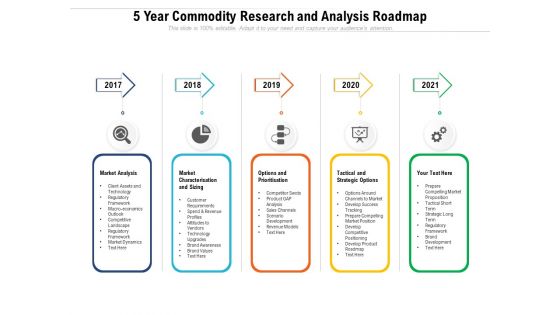
5 Year Commodity Research And Analysis Roadmap Infographics
Presenting our innovatively-structured 5 year commodity research and analysis roadmap infographics Template. Showcase your roadmap process in different formats like PDF, PNG, and JPG by clicking the download button below. This PPT design is available in both Standard Screen and Widescreen aspect ratios. It can also be easily personalized and presented with modified font size, font type, color, and shapes to measure your progress in a clear way.
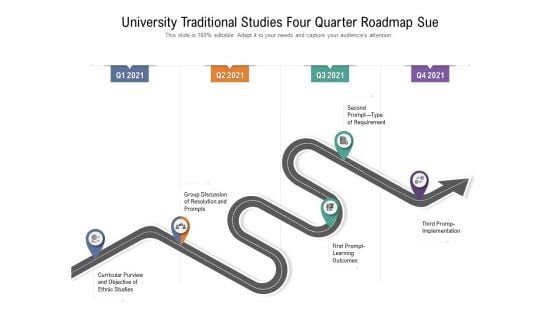
University Traditional Studies Four Quarter Roadmap Sue Infographics
Presenting our innovatively-structured university traditional studies four quarter roadmap sue infographics Template. Showcase your roadmap process in different formats like PDF, PNG, and JPG by clicking the download button below. This PPT design is available in both Standard Screen and Widescreen aspect ratios. It can also be easily personalized and presented with modified font size, font type, color, and shapes to measure your progress in a clear way.
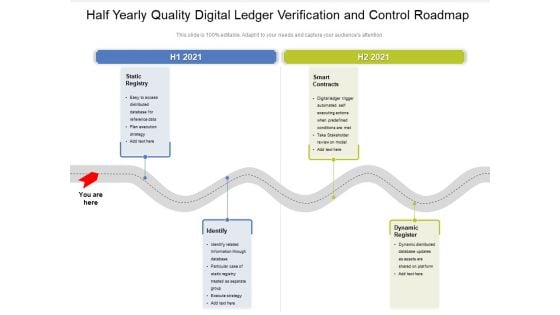
Half Yearly Quality Digital Ledger Verification And Control Roadmap Infographics
Presenting our innovatively-structured half yearly quality digital ledger verification and control roadmap infographics Template. Showcase your roadmap process in different formats like PDF, PNG, and JPG by clicking the download button below. This PPT design is available in both Standard Screen and Widescreen aspect ratios. It can also be easily personalized and presented with modified font size, font type, color, and shapes to measure your progress in a clear way.
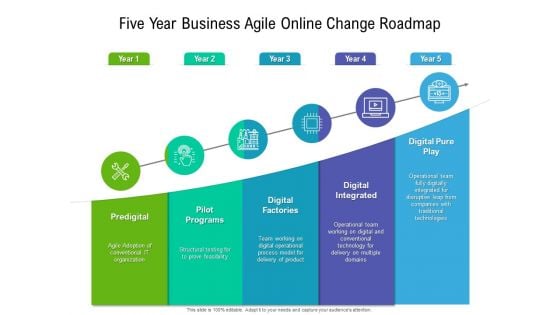
Five Year Business Agile Online Change Roadmap Infographics
Presenting our innovatively structured five year business agile online change roadmap infographics Template. Showcase your roadmap process in different formats like PDF, PNG, and JPG by clicking the download button below. This PPT design is available in both Standard Screen and Widescreen aspect ratios. It can also be easily personalized and presented with modified font size, font type, color, and shapes to measure your progress in a clear way.
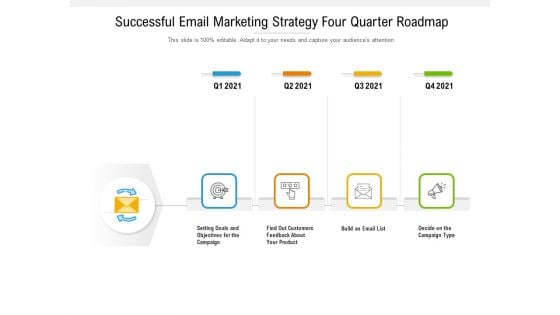
Successful Email Marketing Strategy Four Quarter Roadmap Infographics
Presenting our innovatively structured successful email marketing strategy four quarter roadmap infographics Template. Showcase your roadmap process in different formats like PDF, PNG, and JPG by clicking the download button below. This PPT design is available in both Standard Screen and Widescreen aspect ratios. It can also be easily personalized and presented with modified font size, font type, color, and shapes to measure your progress in a clear way.
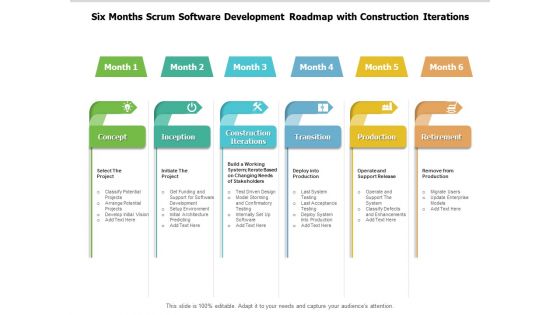
Six Months Scrum Software Development Roadmap With Construction Iterations Infographics
Presenting our innovatively-structured six months scrum software development roadmap with construction iterations infographics Template. Showcase your roadmap process in different formats like PDF, PNG, and JPG by clicking the download button below. This PPT design is available in both Standard Screen and Widescreen aspect ratios. It can also be easily personalized and presented with modified font size, font type, color, and shapes to measure your progress in a clear way.
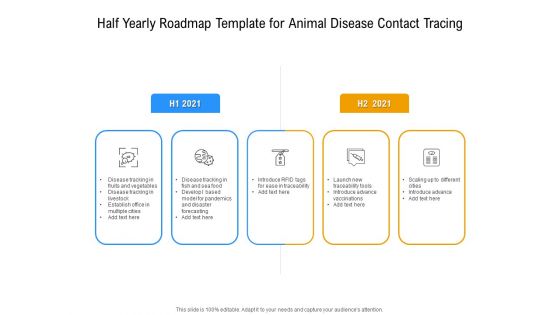
Half Yearly Roadmap Template For Animal Disease Contact Tracing Infographics
Presenting our innovatively structured half yearly roadmap template for animal disease contact tracing infographics Template. Showcase your roadmap process in different formats like PDF, PNG, and JPG by clicking the download button below. This PPT design is available in both Standard Screen and Widescreen aspect ratios. It can also be easily personalized and presented with modified font size, font type, color, and shapes to measure your progress in a clear way.
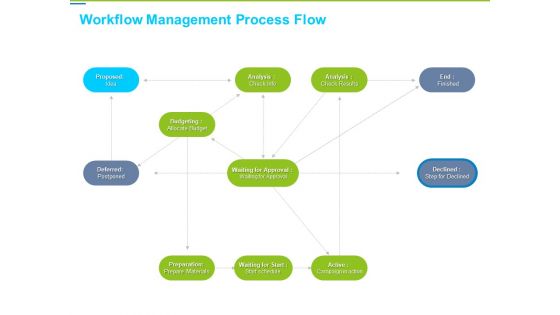
Framework Administration Workflow Management Process Flow Ppt Infographics Tips PDF
This is a framework administration workflow management process flow ppt infographics tips pdf template with various stages. Focus and dispense information on eleven stages using this creative set, that comes with editable features. It contains large content boxes to add your information on topics like budgeting, declined, analysis, preparation, active . You can also showcase facts, figures, and other relevant content using this PPT layout. Grab it now.
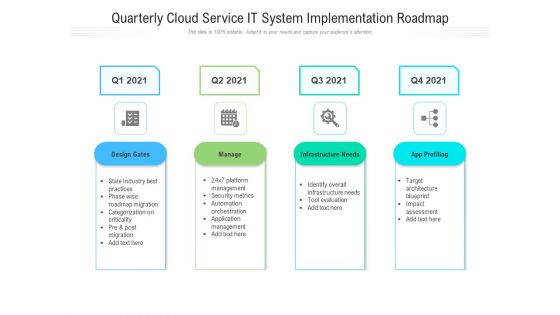
Quarterly Cloud Service IT System Implementation Roadmap Infographics
Presenting our innovatively-structured quarterly cloud service it system implementation roadmap infographics Template. Showcase your roadmap process in different formats like PDF, PNG, and JPG by clicking the download button below. This PPT design is available in both Standard Screen and Widescreen aspect ratios. It can also be easily personalized and presented with modified font size, font type, color, and shapes to measure your progress in a clear way.
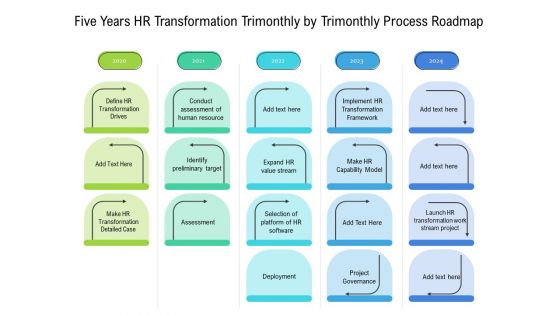
Five Years HR Transformation Trimonthly By Trimonthly Process Roadmap Infographics
Presenting our innovatively structured five years hr transformation trimonthly by trimonthly process roadmap infographics Template. Showcase your roadmap process in different formats like PDF, PNG, and JPG by clicking the download button below. This PPT design is available in both Standard Screen and Widescreen aspect ratios. It can also be easily personalized and presented with modified font size, font type, color, and shapes to measure your progress in a clear way.
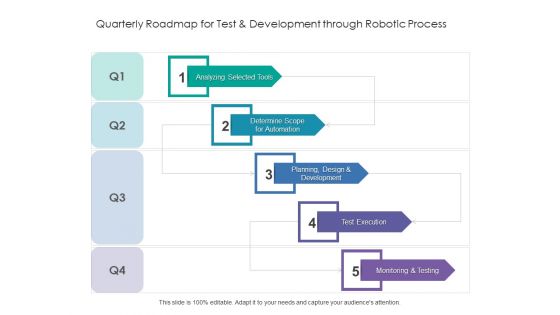
Quarterly Roadmap For Test And Development Through Robotic Process Infographics
Presenting our innovatively structured quarterly roadmap for test and development through robotic process infographics Template. Showcase your roadmap process in different formats like PDF, PNG, and JPG by clicking the download button below. This PPT design is available in both Standard Screen and Widescreen aspect ratios. It can also be easily personalized and presented with modified font size, font type, color, and shapes to measure your progress in a clear way.
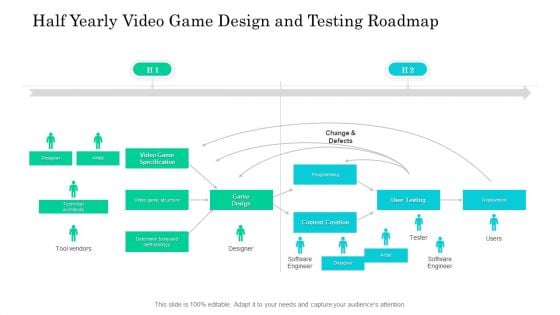
Half Yearly Video Game Design And Testing Roadmap Infographics
Presenting our innovatively structured half yearly video game design and testing roadmap infographics Template. Showcase your roadmap process in different formats like PDF, PNG, and JPG by clicking the download button below. This PPT design is available in both Standard Screen and Widescreen aspect ratios. It can also be easily personalized and presented with modified font size, font type, color, and shapes to measure your progress in a clear way.
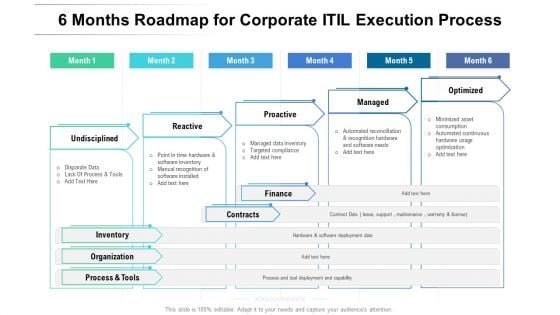
6 Months Roadmap For Corporate ITIL Execution Process Infographics
Presenting our innovatively structured 6 months roadmap for corporate itil execution process infographics Template. Showcase your roadmap process in different formats like PDF, PNG, and JPG by clicking the download button below. This PPT design is available in both Standard Screen and Widescreen aspect ratios. It can also be easily personalized and presented with modified font size, font type, color, and shapes to measure your progress in a clear way.
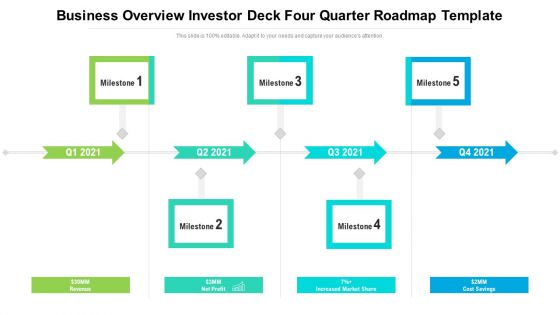
Business Overview Investor Deck Four Quarter Roadmap Template Infographics
Presenting our innovatively structured business overview investor deck four quarter roadmap template infographics Template. Showcase your roadmap process in different formats like PDF, PNG, and JPG by clicking the download button below. This PPT design is available in both Standard Screen and Widescreen aspect ratios. It can also be easily personalized and presented with modified font size, font type, color, and shapes to measure your progress in a clear way.
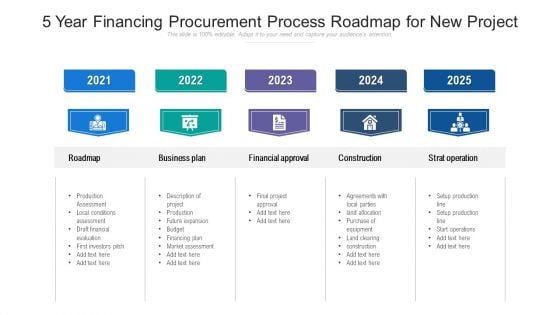
5 Year Financing Procurement Process Roadmap For New Project Infographics
Presenting our innovatively structured 5 year financing procurement process roadmap for new project infographics Template. Showcase your roadmap process in different formats like PDF, PNG, and JPG by clicking the download button below. This PPT design is available in both Standard Screen and Widescreen aspect ratios. It can also be easily personalized and presented with modified font size, font type, color, and shapes to measure your progress in a clear way.
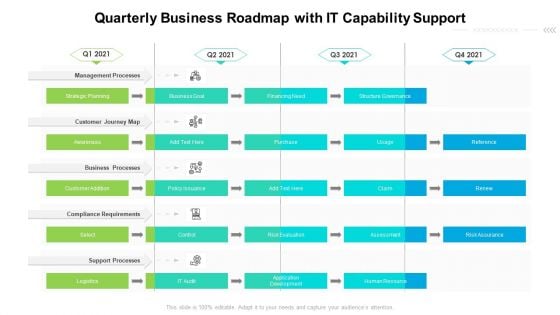
Quarterly Business Roadmap With IT Capability Support Infographics
Presenting our innovatively structured quarterly business roadmap with it capability support infographics Template. Showcase your roadmap process in different formats like PDF, PNG, and JPG by clicking the download button below. This PPT design is available in both Standard Screen and Widescreen aspect ratios. It can also be easily personalized and presented with modified font size, font type, color, and shapes to measure your progress in a clear way.
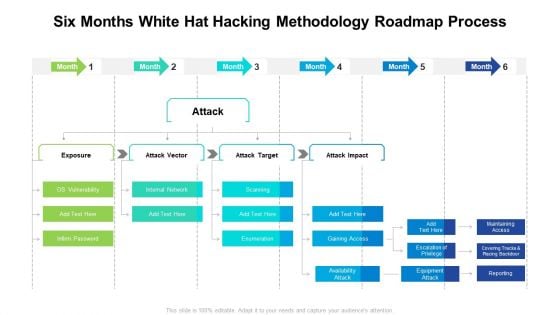
Six Months White Hat Hacking Methodology Roadmap Process Infographics
Presenting our innovatively structured six months white hat hacking methodology roadmap process infographics Template. Showcase your roadmap process in different formats like PDF, PNG, and JPG by clicking the download button below. This PPT design is available in both Standard Screen and Widescreen aspect ratios. It can also be easily personalized and presented with modified font size, font type, color, and shapes to measure your progress in a clear way.
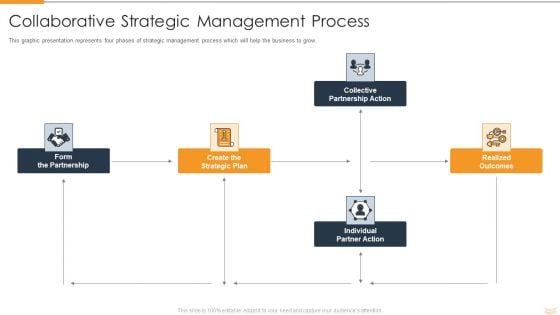
Strategic Partnership Management Plan Collaborative Strategic Management Process Infographics PDF
This graphic presentation represents four phases of strategic management process which will help the business to grow. Presenting strategic partnership management plan collaborative strategic management process infographics pdf to provide visual cues and insights. Share and navigate important information on five stages that need your due attention. This template can be used to pitch topics like collective partnership action, realized outcomes, individual partner action, create the strategic plan, form the partnership. In addtion, this PPT design contains high resolution images, graphics, etc, that are easily editable and available for immediate download.
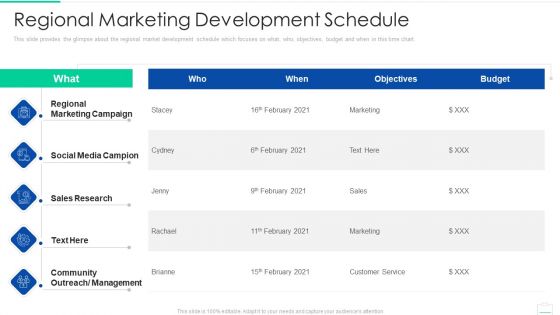
Market Area Analysis Regional Marketing Development Schedule Infographics PDF
This slide provides the glimpse about the regional market development schedule which focuses on what, who, objectives, budget and when in this time chart.Deliver and pitch your topic in the best possible manner with this market area analysis regional marketing development schedule infographics pdf. Use them to share invaluable insights on regional marketing campaign, social media campion, sales research and impress your audience. This template can be altered and modified as per your expectations. So, grab it now.
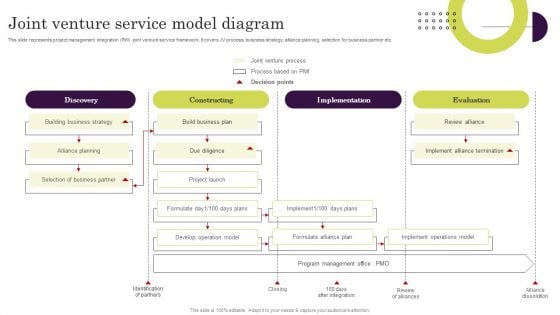
Joint Venture Service Model Diagram Ppt Infographics Mockup PDF
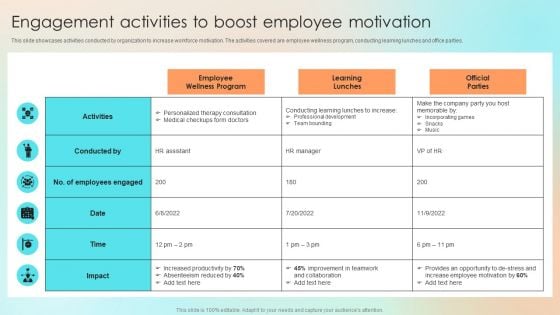
Engagement Activities To Boost Employee Motivation Infographics PDF
This slide showcases activities conducted by organization to increase workforce motivation. The activities covered are employee wellness program, conducting learning lunches and office parties. If you are looking for a format to display your unique thoughts, then the professionally designed Engagement Activities To Boost Employee Motivation Infographics PDF is the one for you. You can use it as a Google Slides template or a PowerPoint template. Incorporate impressive visuals, symbols, images, and other charts. Modify or reorganize the text boxes as you desire. Experiment with shade schemes and font pairings. Alter, share or cooperate with other people on your work. Download Engagement Activities To Boost Employee Motivation Infographics PDF and find out how to give a successful presentation. Present a perfect display to your team and make your presentation unforgettable.
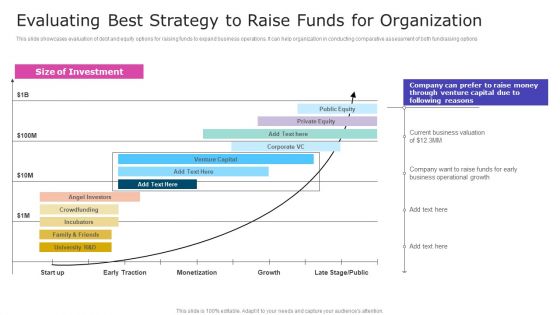
Evaluating Best Strategy To Raise Funds For Organization Infographics PDF
This slide showcases evaluation of debt and equity options for raising funds to expand business operations. It can help organization in conducting comparative assessment of both fundraising options. If you are looking for a format to display your unique thoughts, then the professionally designed Evaluating Best Strategy To Raise Funds For Organization Infographics PDF is the one for you. You can use it as a Google Slides template or a PowerPoint template. Incorporate impressive visuals, symbols, images, and other charts. Modify or reorganize the text boxes as you desire. Experiment with shade schemes and font pairings. Alter, share or cooperate with other people on your work. Download Evaluating Best Strategy To Raise Funds For Organization Infographics PDF and find out how to give a successful presentation. Present a perfect display to your team and make your presentation unforgettable.
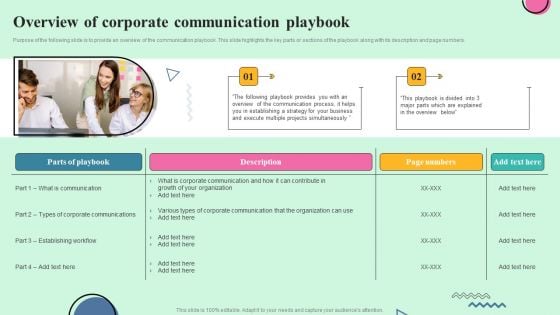
Developing Effective Stakeholder Communication Overview Of Corporate Communication Infographics PDF
Purpose of the following slide is to provide an overview of the communication playbook. This slide highlights the key parts or sections of the playbook along with its description and page numbers. If you are looking for a format to display your unique thoughts, then the professionally designed Developing Effective Stakeholder Communication Overview Of Corporate Communication Infographics PDF is the one for you. You can use it as a Google Slides template or a PowerPoint template. Incorporate impressive visuals, symbols, images, and other charts. Modify or reorganize the text boxes as you desire. Experiment with shade schemes and font pairings. Alter, share or cooperate with other people on your work. Download Developing Effective Stakeholder Communication Overview Of Corporate Communication Infographics PDF and find out how to give a successful presentation. Present a perfect display to your team and make your presentation unforgettable.
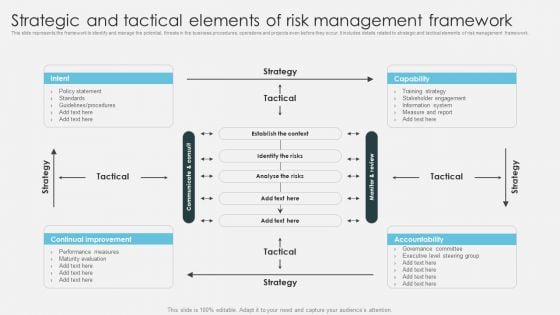
Strategic And Tactical Elements Of Risk Management Framework Infographics PDF
This slide represents the framework to identify and manage the potential, threats in the business procedures, operations and projects even before they occur. It includes details related to strategic and tactical elements of risk management framework.If you are looking for a format to display your unique thoughts, then the professionally designed Strategic And Tactical Elements Of Risk Management Framework Infographics PDF is the one for you. You can use it as a Google Slides template or a PowerPoint template. Incorporate impressive visuals, symbols, images, and other charts. Modify or reorganize the text boxes as you desire. Experiment with shade schemes and font pairings. Alter, share or cooperate with other people on your work. Download Strategic And Tactical Elements Of Risk Management Framework Infographics PDF and find out how to give a successful presentation. Present a perfect display to your team and make your presentation unforgettable.
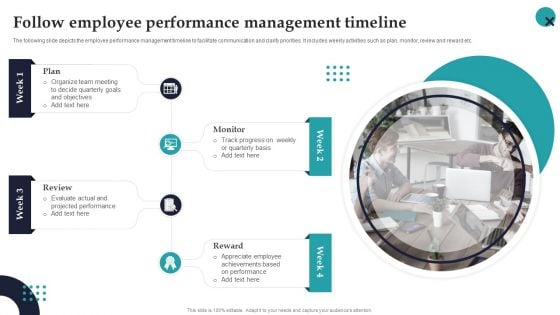
Follow Employee Performance Management Timeline Employee Performance Management Infographics PDF
The following slide depicts the employee performance management timeline to facilitate communication and clarify priorities. It includes weekly activities such as plan, monitor, review and reward etc.If you are looking for a format to display your unique thoughts, then the professionally designed Follow Employee Performance Management Timeline Employee Performance Management Infographics PDF is the one for you. You can use it as a Google Slides template or a PowerPoint template. Incorporate impressive visuals, symbols, images, and other charts. Modify or reorganize the text boxes as you desire. Experiment with shade schemes and font pairings. Alter, share or cooperate with other people on your work. Download Follow Employee Performance Management Timeline Employee Performance Management Infographics PDF and find out how to give a successful presentation. Present a perfect display to your team and make your presentation unforgettable.
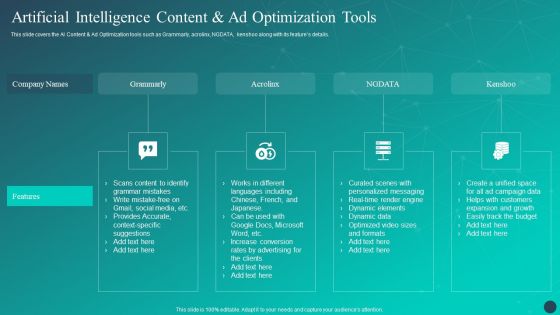
Artificial Intelligence Content And Ad Optimization Tools Infographics PDF
This slide covers the AI Content and Ad Optimization tools such as Grammarly, acrolinx, NGDATA, kenshoo along with its features details. If you are looking for a format to display your unique thoughts, then the professionally designed Artificial Intelligence Content And Ad Optimization Tools Infographics PDF is the one for you. You can use it as a Google Slides template or a PowerPoint template. Incorporate impressive visuals, symbols, images, and other charts. Modify or reorganize the text boxes as you desire. Experiment with shade schemes and font pairings. Alter, share or cooperate with other people on your work. Download Artificial Intelligence Content And Ad Optimization Tools Infographics PDF and find out how to give a successful presentation. Present a perfect display to your team and make your presentation unforgettable.
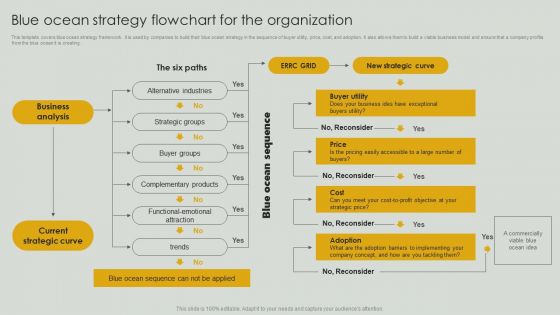
Blue Ocean Strategy Flowchart For The Organization Infographics PDF
This template covers blue ocean strategy framework. It is used by companies to build their blue ocean strategy in the sequence of buyer utility, price, cost, and adoption. It also allows them to build a viable business model and ensure that a company profits from the blue ocean it is creating. If you are looking for a format to display your unique thoughts, then the professionally designed Blue Ocean Strategy Flowchart For The Organization Infographics PDF is the one for you. You can use it as a Google Slides template or a PowerPoint template. Incorporate impressive visuals, symbols, images, and other charts. Modify or reorganize the text boxes as you desire. Experiment with shade schemes and font pairings. Alter, share or cooperate with other people on your work. Download Blue Ocean Strategy Flowchart For The Organization Infographics PDF and find out how to give a successful presentation. Present a perfect display to your team and make your presentation unforgettable.
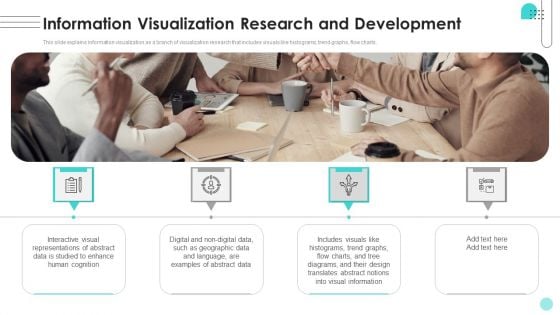
Information Visualization Research And Development Ppt Infographics Gallery PDF
This slide explains information visualization as a branch of visualization research that includes visuals like histograms, trend graphs, flow charts. Here you can discover an assortment of the finest PowerPoint and Google Slides templates. With these templates, you can create presentations for a variety of purposes while simultaneously providing your audience with an eye-catching visual experience. Download Information Visualization Research And Development Ppt Infographics Gallery PDF to deliver an impeccable presentation. These templates will make your job of preparing presentations much quicker, yet still, maintain a high level of quality. Slidegeeks has experienced researchers who prepare these templates and write high-quality content for you. Later on, you can personalize the content by editing the Information Visualization Research And Development Ppt Infographics Gallery PDF.
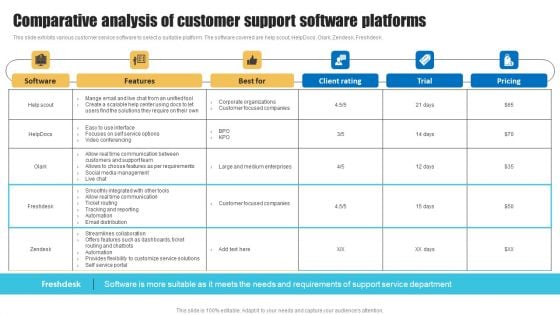
Comparative Analysis Of Customer Support Software Platforms Infographics PDF
This slide exhibits various customer service software to select a suitable platform. The software covered are help scout, HelpDocs, Olark, Zendesk, Freshdesk. If you are looking for a format to display your unique thoughts, then the professionally designed Comparative Analysis Of Customer Support Software Platforms Infographics PDF is the one for you. You can use it as a Google Slides template or a PowerPoint template. Incorporate impressive visuals, symbols, images, and other charts. Modify or reorganize the text boxes as you desire. Experiment with shade schemes and font pairings. Alter, share or cooperate with other people on your work. Download Comparative Analysis Of Customer Support Software Platforms Infographics PDF and find out how to give a successful presentation. Present a perfect display to your team and make your presentation unforgettable.
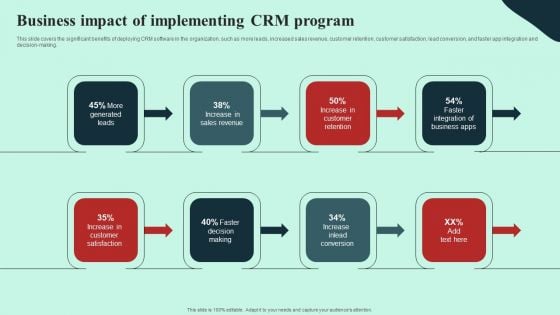
Business Impact Of Implementing CRM Program Infographics PDF
This slide covers the significant benefits of deploying CRM software in the organization, such as more leads, increased sales revenue, customer retention, customer satisfaction, lead conversion, and faster app integration and decision-making. If you are looking for a format to display your unique thoughts, then the professionally designed Business Impact Of Implementing CRM Program Infographics PDF is the one for you. You can use it as a Google Slides template or a PowerPoint template. Incorporate impressive visuals, symbols, images, and other charts. Modify or reorganize the text boxes as you desire. Experiment with shade schemes and font pairings. Alter, share or cooperate with other people on your work. Download Business Impact Of Implementing CRM Program Infographics PDF and find out how to give a successful presentation. Present a perfect display to your team and make your presentation unforgettable.

Highlighting Ongoing Cybersecurity Trends Across Globe Infographics PDF
This slide provides details regarding cybersecurity trends existing across globe in terms of rise in automotive hacking, IoT with 5G, cloud platform as potential vulnerable, etc. If you are looking for a format to display your unique thoughts, then the professionally designed Highlighting Ongoing Cybersecurity Trends Across Globe Infographics PDF is the one for you. You can use it as a Google Slides template or a PowerPoint template. Incorporate impressive visuals, symbols, images, and other charts. Modify or reorganize the text boxes as you desire. Experiment with shade schemes and font pairings. Alter, share or cooperate with other people on your work. Download Highlighting Ongoing Cybersecurity Trends Across Globe Infographics PDF and find out how to give a successful presentation. Present a perfect display to your team and make your presentation unforgettable.
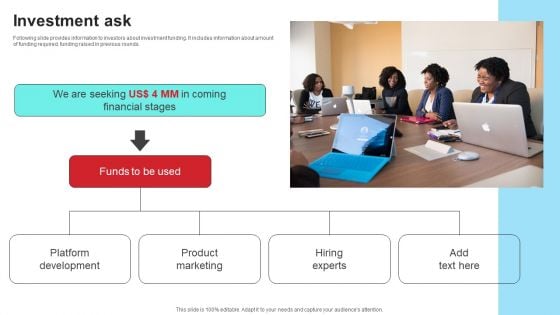
Community Engagement Platform Fundraising Pitch Deck Investment Ask Infographics PDF
Following slide provides information to investors about investment funding. It includes information about amount of funding required, funding raised in previous rounds. If you are looking for a format to display your unique thoughts, then the professionally designed Community Engagement Platform Fundraising Pitch Deck Investment Ask Infographics PDF is the one for you. You can use it as a Google Slides template or a PowerPoint template. Incorporate impressive visuals, symbols, images, and other charts. Modify or reorganize the text boxes as you desire. Experiment with shade schemes and font pairings. Alter, share or cooperate with other people on your work. Download Community Engagement Platform Fundraising Pitch Deck Investment Ask Infographics PDF and find out how to give a successful presentation. Present a perfect display to your team and make your presentation unforgettable.
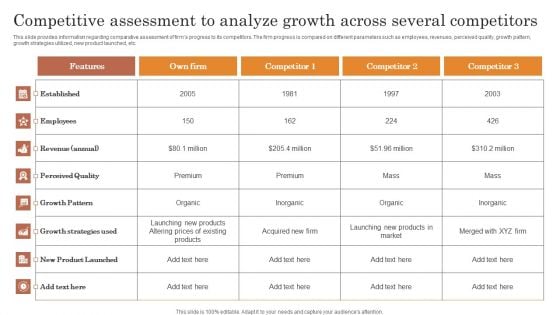
Competitive Assessment To Analyze Growth Across Several Competitors Infographics PDF
This slide provides information regarding comparative assessment of firms progress to its competitors. The firm progress is compared on different parameters such as employees, revenues, perceived quality, growth pattern, growth strategies utilized, new product launched, etc. If you are looking for a format to display your unique thoughts, then the professionally designed Competitive Assessment To Analyze Growth Across Several Competitors Infographics PDF is the one for you. You can use it as a Google Slides template or a PowerPoint template. Incorporate impressive visuals, symbols, images, and other charts. Modify or reorganize the text boxes as you desire. Experiment with shade schemes and font pairings. Alter, share or cooperate with other people on your work. Download Competitive Assessment To Analyze Growth Across Several Competitors Infographics PDF and find out how to give a successful presentation. Present a perfect display to your team and make your presentation unforgettable.
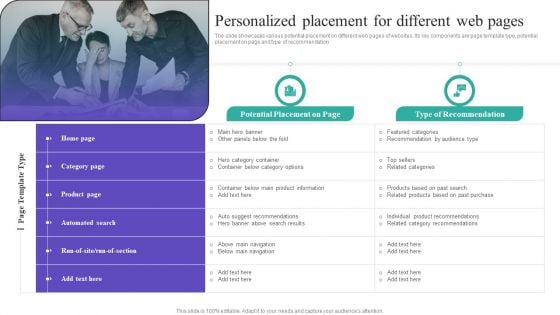
Personalized Placement For Different Web Pages Infographics PDF
The slide showcases various potential placement on different web pages of websites. Its key components are page template type, potential placement on page and type of recommendation If you are looking for a format to display your unique thoughts, then the professionally designed Personalized Placement For Different Web Pages Infographics PDF is the one for you. You can use it as a Google Slides template or a PowerPoint template. Incorporate impressive visuals, symbols, images, and other charts. Modify or reorganize the text boxes as you desire. Experiment with shade schemes and font pairings. Alter, share or cooperate with other people on your work. Download Personalized Placement For Different Web Pages Infographics PDF and find out how to give a successful presentation. Present a perfect display to your team and make your presentation unforgettable.
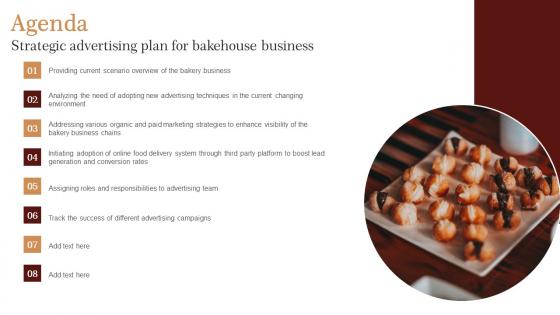
Agenda Strategic Advertising Plan For Bakehouse Business Infographics Pdf
Retrieve professionally designed Agenda Strategic Advertising Plan For Bakehouse Business Infographics Pdf to effectively convey your message and captivate your listeners. Save time by selecting pre made slideshows that are appropriate for various topics, from business to educational purposes. These themes come in many different styles, from creative to corporate, and all of them are easily adjustable and can be edited quickly. Access them as PowerPoint templates or as Google Slides themes. You do not have to go on a hunt for the perfect presentation because Slidegeeks got you covered from everywhere. Our Agenda Strategic Advertising Plan For Bakehouse Business Infographics Pdf are topically designed to provide an attractive backdrop to any subject. Use them to look like a presentation pro.
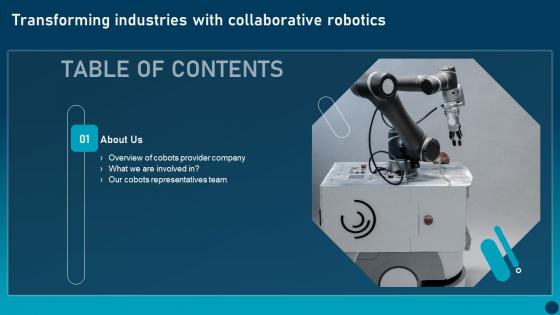
Transforming Industries With Collaborative Robotics Table Of Contents Infographics Pdf
Retrieve professionally designed Transforming Industries With Collaborative Robotics Table Of Contents Infographics Pdf to effectively convey your message and captivate your listeners. Save time by selecting pre made slideshows that are appropriate for various topics, from business to educational purposes. These themes come in many different styles, from creative to corporate, and all of them are easily adjustable and can be edited quickly. Access them as PowerPoint templates or as Google Slides themes. You do not have to go on a hunt for the perfect presentation because Slidegeeks got you covered from everywhere. Our Transforming Industries With Collaborative Robotics Table Of Contents Infographics Pdf are topically designed to provide an attractive backdrop to any subject. Use them to look like a presentation pro.
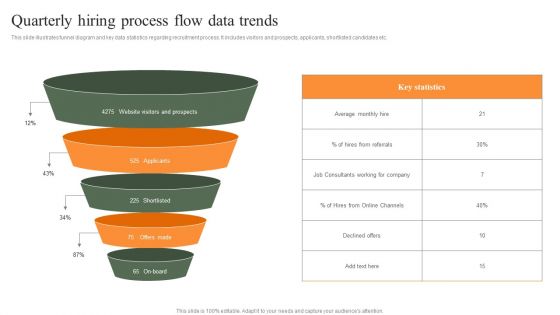
Quarterly Hiring Process Flow Data Trends Infographics PDF
This slide illustrates funnel diagram and key data statistics regarding recruitment process. It includes visitors and prospects, applicants, shortlisted candidates etc. Persuade your audience using this Quarterly Hiring Process Flow Data Trends Infographics PDF. This PPT design covers five stages, thus making it a great tool to use. It also caters to a variety of topics including Applicants, Average, Key Statistics. Download this PPT design now to present a convincing pitch that not only emphasizes the topic but also showcases your presentation skills.
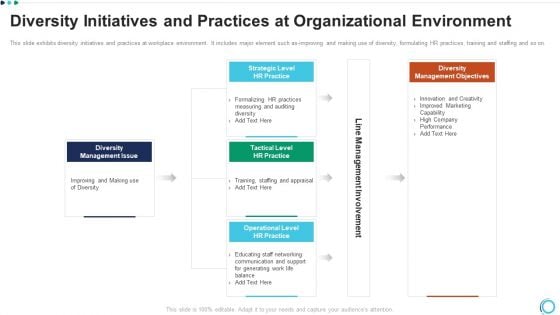
Diversity Initiatives And Practices At Organizational Environment Infographics PDF
This slide exhibits diversity initiatives and practices at workplace environment. It includes major element such as improving and making use of diversity, formulating HR practices, training and staffing and so on. Presenting diversity initiatives and practices at organizational environment infographics pdf to dispense important information. This template comprises three stages. It also presents valuable insights into the topics including strategic, management, innovation. This is a completely customizable PowerPoint theme that can be put to use immediately. So, download it and address the topic impactfully.

 Home
Home