Innovation Icons
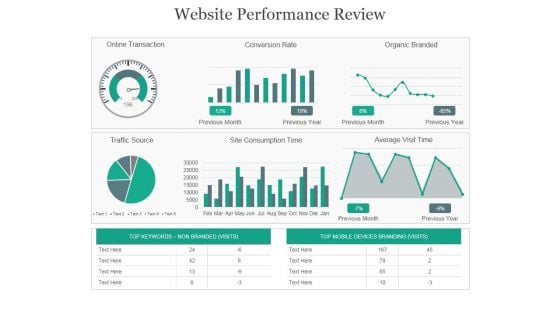
Website Performance Review Ppt PowerPoint Presentation Background Images
This is a website performance review ppt powerpoint presentation background images. This is a three stage process. The stages in this process are online transaction, conversion rate, organic branded, traffic source, site consumption time.
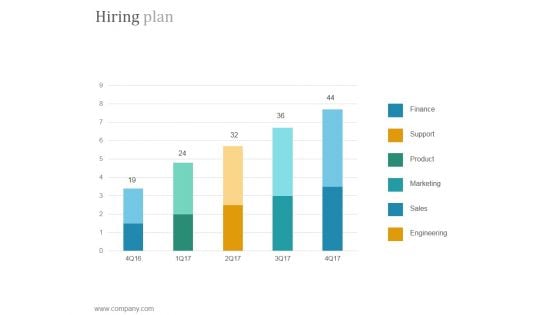
Hiring Plan Ppt PowerPoint Presentation Tips
This is a hiring plan ppt powerpoint presentation tips. This is a five stage process. The stages in this process are finance, support, product, marketing, sales, engineering.
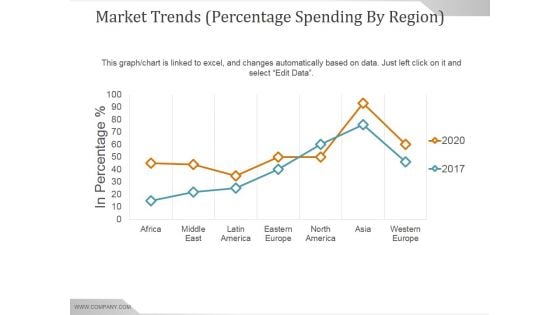
Market Trends Percentage Spending By Region Ppt PowerPoint Presentation Sample
This is a market trends percentage spending by region ppt powerpoint presentation sample. This is a seven stage process. The stages in this process are africa, middle east, latin america, eastern europe, north america, asia, western europe.
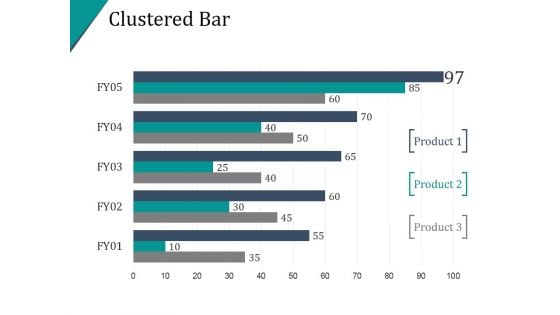
Clustered Bar Ppt PowerPoint Presentation Inspiration
This is a clustered bar ppt powerpoint presentation inspiration. This is a five stage process. The stages in this process are bar graph, business, marketing, finance, percentage.
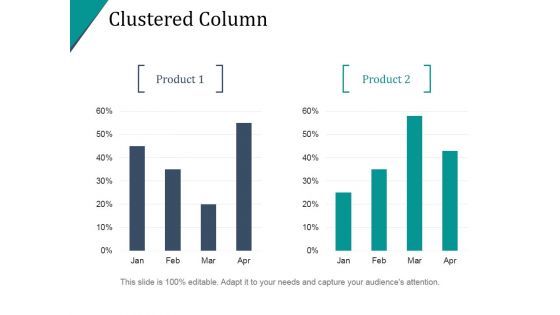
Clustered Column Ppt PowerPoint Presentation Infographic Template
This is a clustered column ppt powerpoint presentation infographic template. This is a two stage process. The stages in this process are finance, percentage, bar graph, business, marketing.
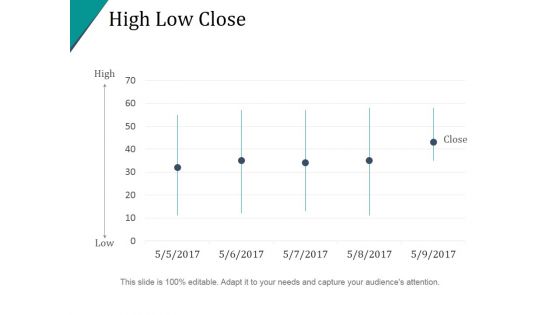
High Low Close Ppt PowerPoint Presentation Designs
This is a high low close ppt powerpoint presentation designs. This is a five stage process. The stages in this process are low, high, close.
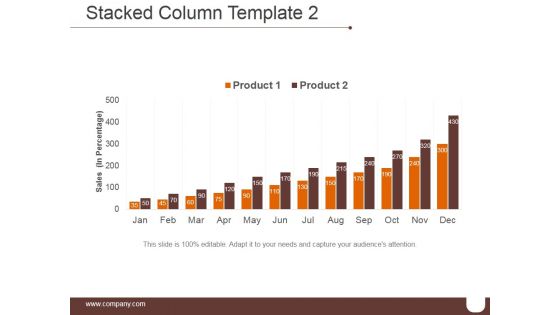
Stacked Column Template 2 Ppt PowerPoint Presentation Templates
This is a stacked column template 2 ppt powerpoint presentation templates. This is a twelve stage process. The stages in this process are finance, analysis, business, marketing, strategy.
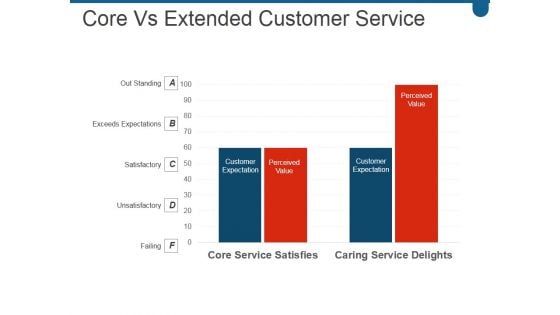
Core Vs Extended Customer Service Ppt PowerPoint Presentation Example 2015
This is a core vs extended customer service ppt powerpoint presentation example 2015. This is a four stage process. The stages in this process are customer expectation, perceived value, expectation, customer value, perceived.
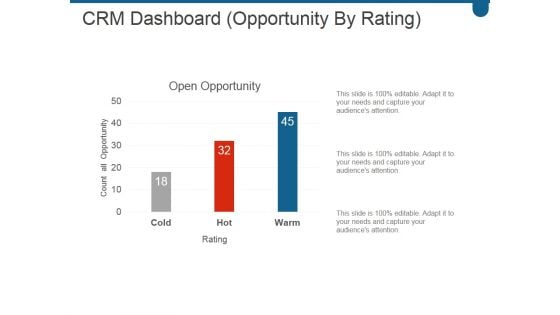
Crm Dashboard Opportunity By Rating Ppt PowerPoint Presentation Model
This is a crm dashboard opportunity by rating ppt powerpoint presentation model. This is a three stage process. The stages in this process are open opportunity, cold, hot, warm.
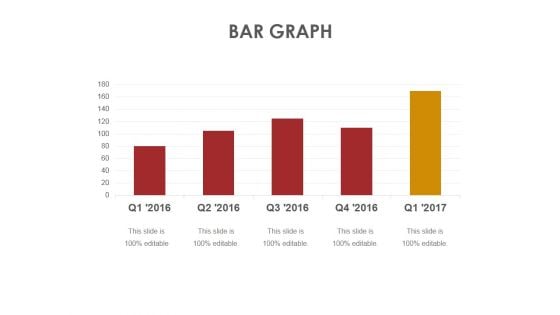
Bar Graph Ppt PowerPoint Presentation Gallery Infographic Template
This is a bar graph ppt powerpoint presentation gallery infographic template. This is a five stage process. The stages in this process are business, marketing, analysis, strategy, bar graph.
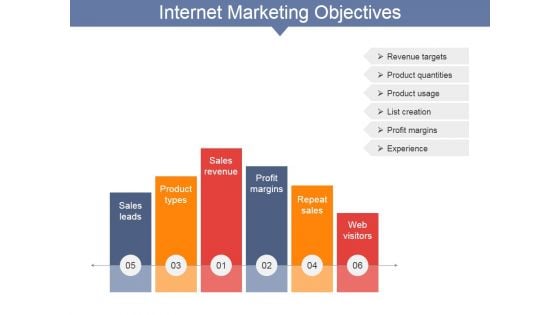
Internet Marketing Objectives Ppt PowerPoint Presentation Layouts Smartart
This is a internet marketing objectives ppt powerpoint presentation layouts smartart. This is a six stage process. The stages in this process are sales leads, product types, sales revenue, profit margins, repeat sales, web visitors.
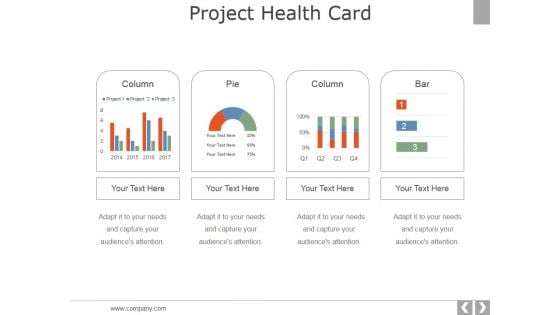
Project Health Card Template 1 Ppt PowerPoint Presentation Professional Example
This is a project health card template 1 ppt powerpoint presentation professional example. This is a four stage process. The stages in this process are column pie, pie, column, bar.
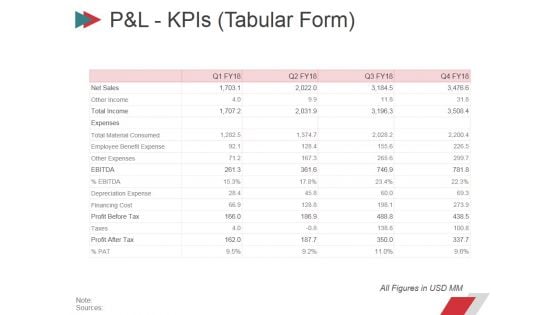
Pandl Kpis Tabular Form Ppt PowerPoint Presentation Summary Layout
This is a pandl kpis tabular form ppt powerpoint presentation summary layout. This is a four stage process. The stages in this process are revenue, cogs, operating profit, net profit.
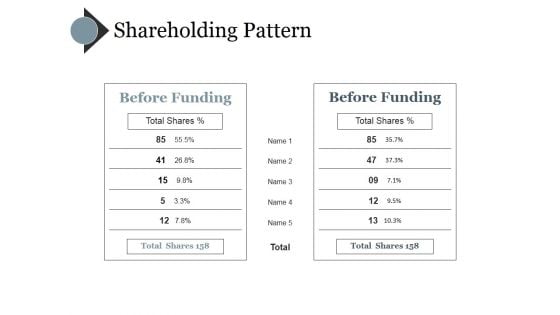
Shareholding Pattern Template Ppt PowerPoint Presentation Inspiration Demonstration
This is a shareholding pattern template ppt powerpoint presentation inspiration demonstration. This is a five stage process. The stages in this process are After funding, before funding.
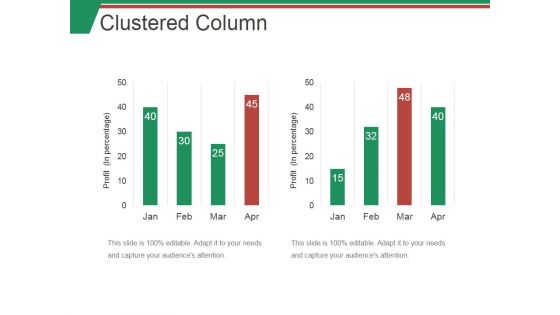
Clustered Column Ppt PowerPoint Presentation Summary Topics
This is a clustered column ppt powerpoint presentation summary topics. This is a two stage process. The stages in this process are bar, graph, finance, marketing, strategy.
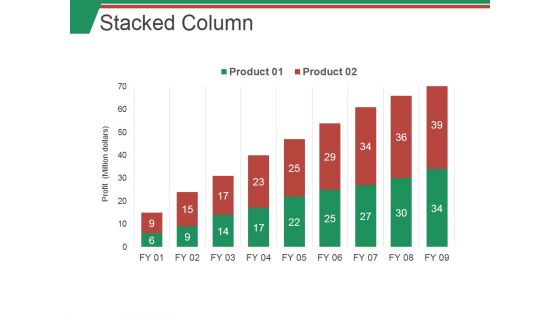
Stacked Column Ppt PowerPoint Presentation Infographic Template Graphics
This is a stacked column ppt powerpoint presentation infographic template graphics. This is a nine stage process. The stages in this process are business, marketing, finance, analysis, planning.
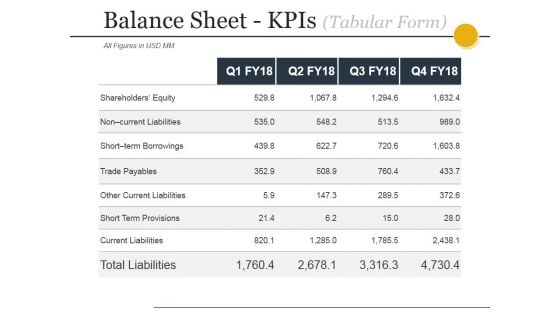
Balance Sheet Kpis Tabular Form Ppt PowerPoint Presentation Infographics Good
This is a balance sheet kpis tabular form ppt powerpoint presentation infographics good. This is a four stage process. The stages in this process are current assets, current liabilities, total assets, total liabilities.
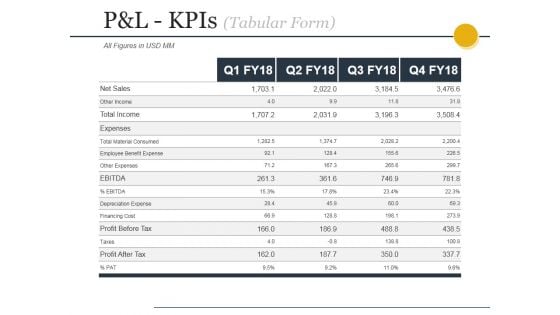
Pandl Kpis Tabular Form Ppt PowerPoint Presentation File Design Templates
This is a pandl kpis tabular form ppt powerpoint presentation file design templates. This is a four stage process. The stages in this process are revenue, cogs, operating profit, net profit.
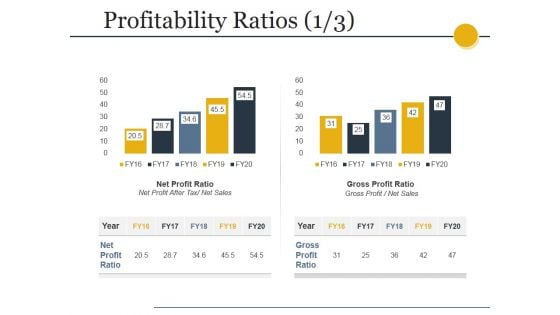
Profitability Ratios Template 1 Ppt PowerPoint Presentation Slides Inspiration
This is a profitability ratios template 1 ppt powerpoint presentation slides inspiration. This is a two stage process. The stages in this process are net profit ratio, net profit after tax net sales, gross profit ratio, gross profit net sales.
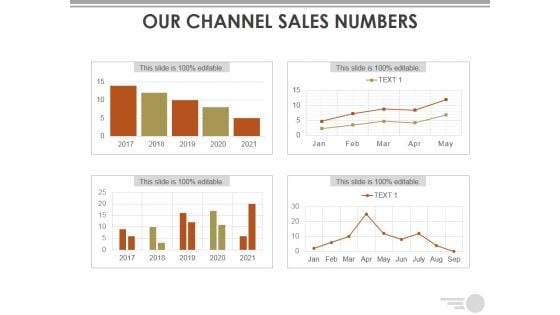
Our Channel Sales Numbers Ppt PowerPoint Presentation Styles Show
This is a our channel sales numbers ppt powerpoint presentation styles show. This is a four stage process. The stages in this process are business, marketing, planning, finance, strategy.
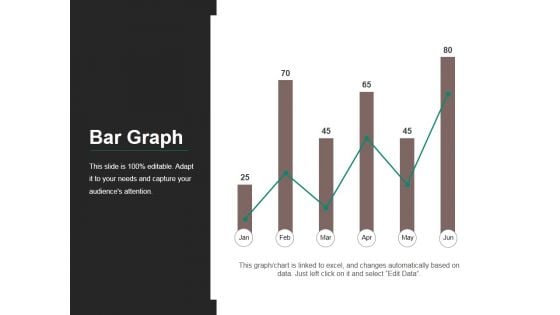
Bar Graph Ppt PowerPoint Presentation Slides Graphic Images
This is a bar graph ppt powerpoint presentation slides graphic images. This is a six stage process. The stages in this process are bar, finance, business, marketing, growth.
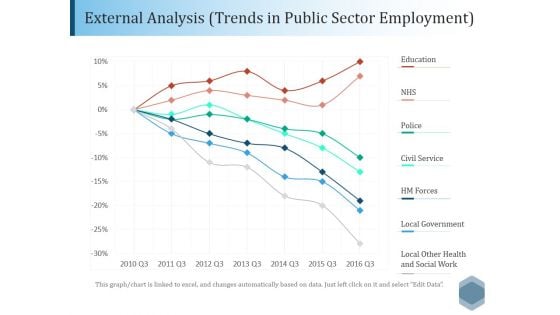
External Analysis Trends In Public Sector Employment Ppt PowerPoint Presentation File Outline
This is a external analysis trends in public sector employment ppt powerpoint presentation file outline. This is a seven stage process. The stages in this process are education, nhs, police, civil service, local government.
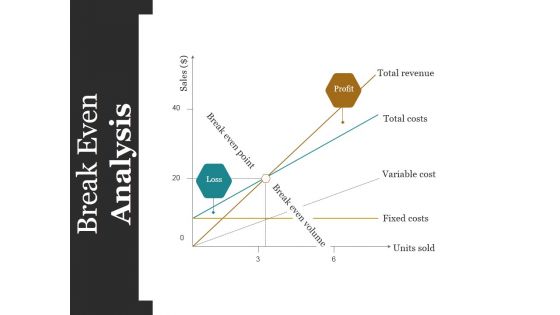
Break Even Analysis Ppt PowerPoint Presentation Inspiration Layouts
This is a break even analysis ppt powerpoint presentation inspiration layouts. This is a three stage process. The stages in this process are total revenue, total costs, variable cost, fixed costs, units sold.
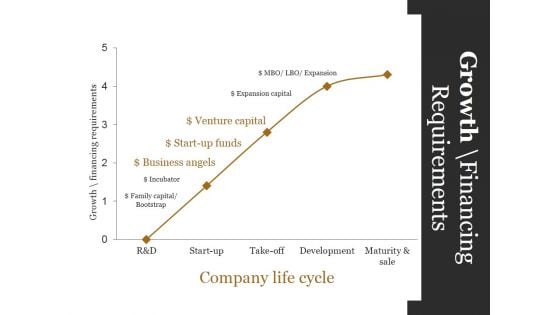
Growth Financing Requirements Ppt PowerPoint Presentation Gallery Ideas
This is a growth financing requirements ppt powerpoint presentation gallery ideas. This is a five stage process. The stages in this process are business angels, startup funds, venture capital, expansion capital, expansion.
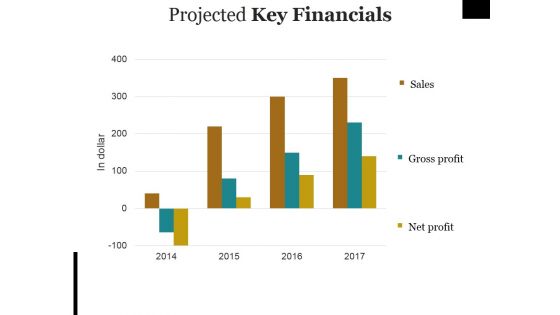
Projected Key Financials Ppt PowerPoint Presentation Pictures Objects
This is a projected key financials ppt powerpoint presentation pictures objects. This is a three stage process. The stages in this process are sales, gross profit, net profit.
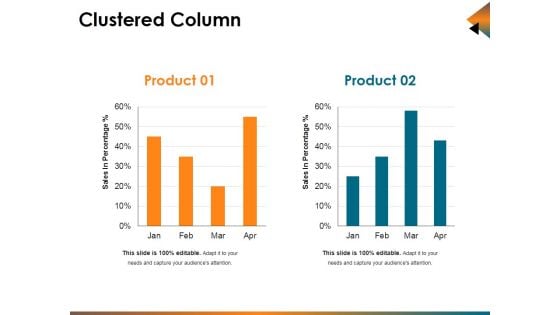
Clustered Column Ppt PowerPoint Presentation Infographic Template Background Designs
This is a clustered column ppt powerpoint presentation infographic template background designs. This is a two stage process. The stages in this process are sales in percentage, bar, business, marketing, planning.
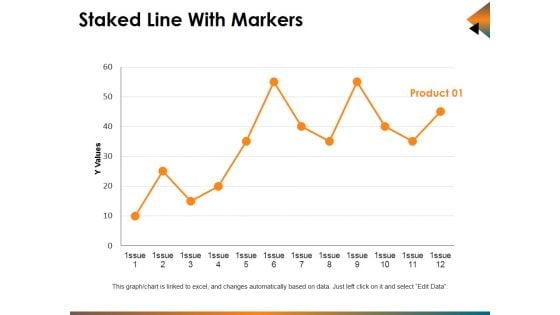
Staked Line With Markers Ppt PowerPoint Presentation Infographics Show
This is a staked line with markers ppt powerpoint presentation infographics show. This is a one stage process. The stages in this process are business, marketing, finance, line, analysis.
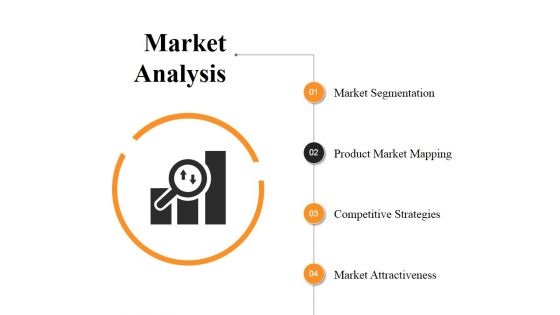
Market Analysis Ppt PowerPoint Presentation Show Design Inspiration
This is a market analysis ppt powerpoint presentation show design inspiration. This is a four stage process. The stages in this process are market segmentation, product market mapping, competitive strategies, market attractiveness.
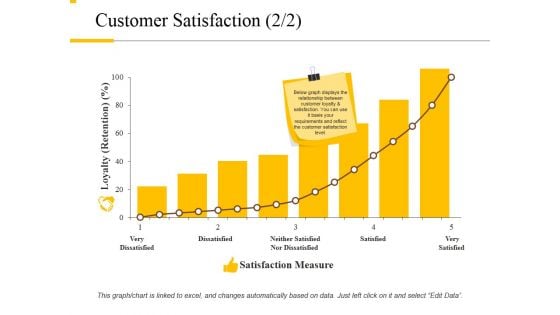
Customer Satisfaction Template 2 Ppt PowerPoint Presentation Professional Pictures
This is a customer satisfaction template 2 ppt powerpoint presentation professional pictures. This is a eight stage process. The stages in this process are loyalty, dissatisfied, satisfied, satisfaction measure, very satisfied.
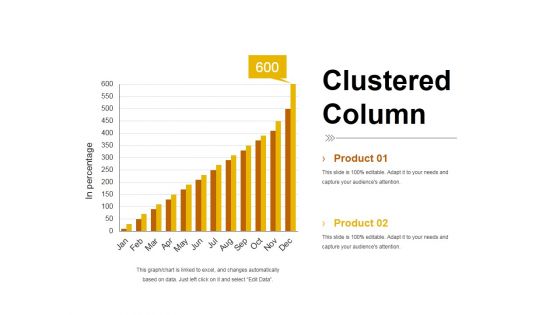
Clustered Column Template 2 Ppt PowerPoint Presentation Summary Smartart
This is a clustered column template 2 ppt powerpoint presentation summary smartart. This is a two stage process. The stages in this process are product, bar graph, in percentage, clustered column, growth.
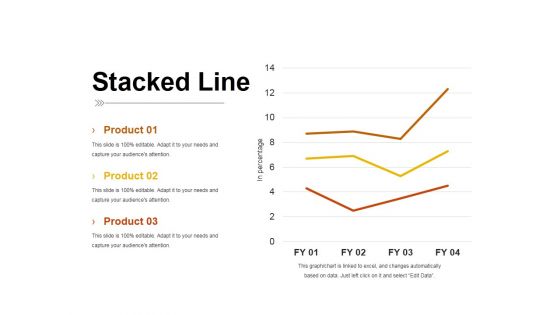
Stacked Line Ppt PowerPoint Presentation Inspiration Pictures
This is a stacked line ppt powerpoint presentation inspiration pictures. This is a three stage process. The stages in this process are product, stacked line, in percentage, business, growth.
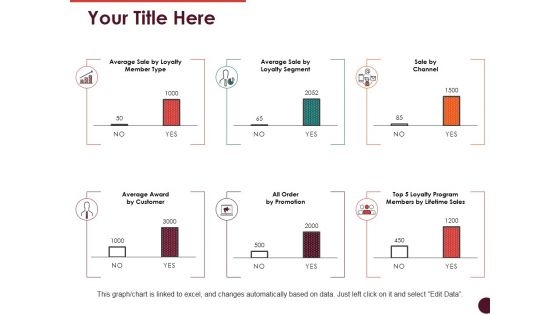
Your Title Here Ppt PowerPoint Presentation Show Good
This is a your title here ppt powerpoint presentation show good. This is a six stage process. The stages in this process are sale by channel, average award by customer, all order by promotion.
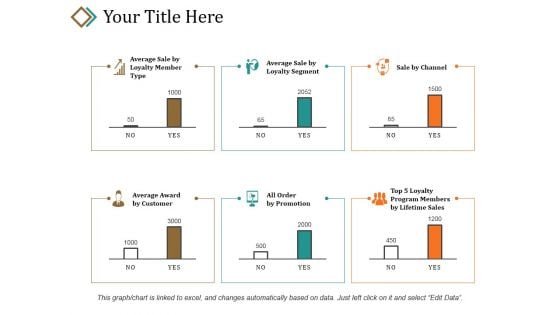
Your Title Here Ppt PowerPoint Presentation Layouts Introduction
This is a your title here ppt powerpoint presentation layouts introduction. This is a six stage process. The stages in this process are sale by channel, average award by customer, all order by promotion.
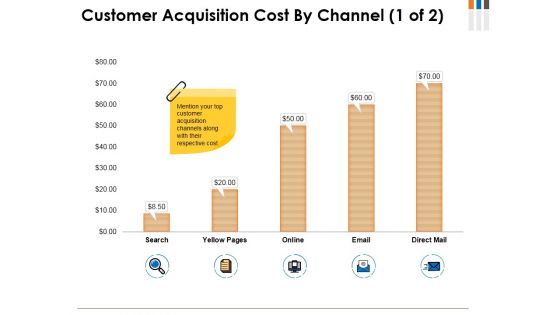
Customer Acquisition Cost By Channel Template 1 Ppt PowerPoint Presentation Model Inspiration
This is a customer acquisition cost by channel template 1 ppt powerpoint presentation model inspiration. This is a five stage process. The stages in this process are search, yellow pages, online, email, direct mail.
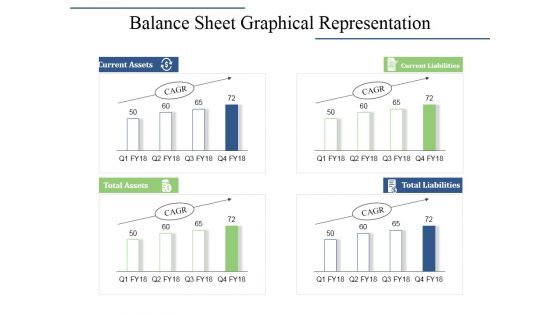
Balance Sheet Graphical Representation Ppt PowerPoint Presentation Inspiration Design Inspiration
This is a balance sheet graphical representation ppt powerpoint presentation inspiration design inspiration. This is a four stage process. The stages in this process are current assets, current liabilities, total assets, total liabilities.
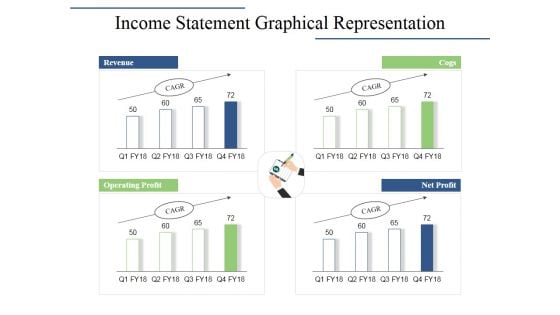
Income Statement Graphical Representation Ppt PowerPoint Presentation Infographics Layouts
This is a income statement graphical representation ppt powerpoint presentation infographics layouts. This is a four stage process. The stages in this process are revenue, cogs, operating profit, net profit.
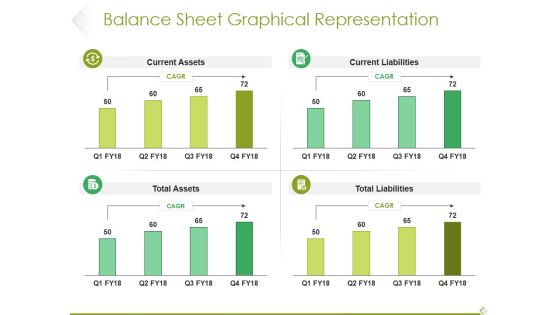
Balance Sheet Graphical Representation Ppt PowerPoint Presentation Outline Microsoft
This is a balance sheet graphical representation ppt powerpoint presentation outline microsoft. This is a four stage process. The stages in this process are current assets, current liabilities, total assets, total liabilities.
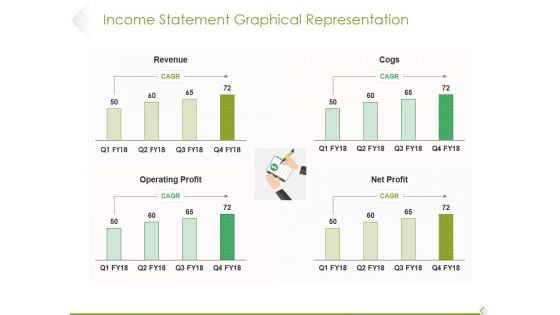
Income Statement Graphical Representation Ppt PowerPoint Presentation Infographic Template Influencers
This is a income statement graphical representation ppt powerpoint presentation infographic template influencers. This is a four stage process. The stages in this process are revenue, cogs, operating profit, profit.
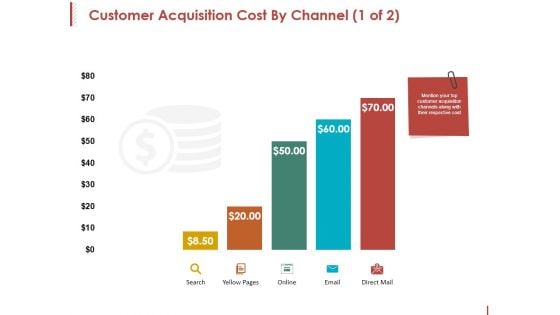
Customer Acquisition Cost By Channel Template 1 Ppt PowerPoint Presentation File Aids
This is a customer acquisition cost by channel template 1 ppt powerpoint presentation file aids. This is a five stage process. The stages in this process are search, yellow pages, online, email, direct mail.
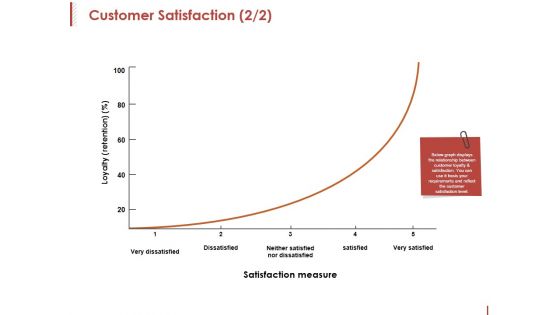
Customer Satisfaction Template 2 Ppt PowerPoint Presentation Slides Ideas
This is a customer satisfaction template 2 ppt powerpoint presentation slides ideas. This is a one stage process. The stages in this process are loyalty, satisfaction measure, dissatisfied, satisfied, very satisfied.
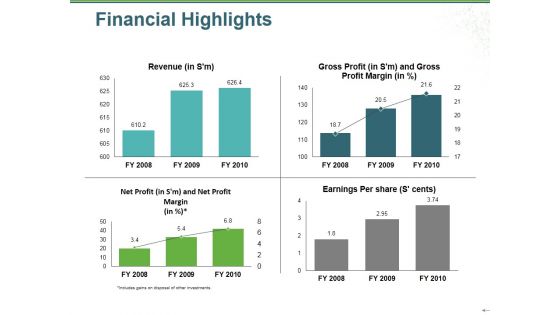
Financial Highlights Ppt PowerPoint Presentation Gallery Graphics Example
This is a financial highlights ppt powerpoint presentation gallery graphics example. This is a four stage process. The stages in this process are revenue, gross profit, net profit, earnings per share, bar graph.
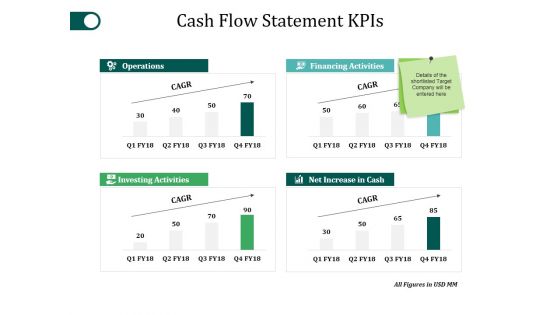
Cash Flow Statement Kpis Template 2 Ppt PowerPoint Presentation Summary Guidelines
This is a cash flow statement kpis template 2 ppt powerpoint presentation summary guidelines. This is a four stage process. The stages in this process are operations, investing activities, net increase in cash, financing activities.
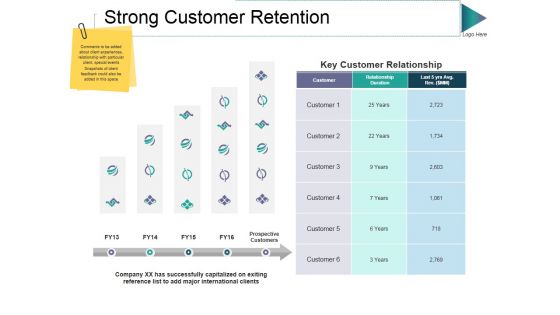
Strong Customer Retention Ppt PowerPoint Presentation Show Guide
This is a strong customer retention ppt powerpoint presentation show guide. This is a two stage process. The stages in this process are prospective customers, relationship duration, key customer relationship, prospective customers, customer.
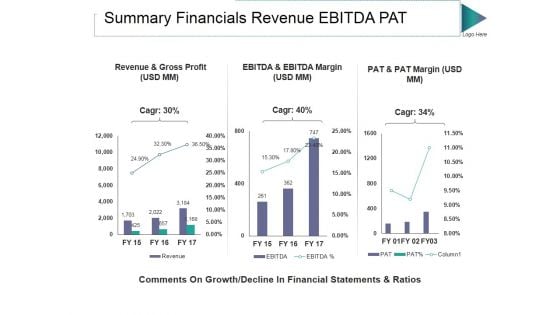
Summary Financials Revenue Ebitda Pat Ppt PowerPoint Presentation Visuals
This is a summary financials revenue ebitda pat ppt powerpoint presentation visuals. This is a three stage process. The stages in this process are revenue and gross profit, pat and pat margin, ebitda and ebitda margin.
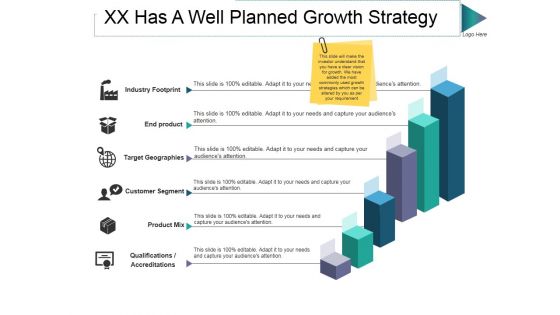
Xx Has A Well Planned Growth Strategy Ppt PowerPoint Presentation Slides Visual Aids
This is a xx has a well planned growth strategy ppt powerpoint presentation slides visual aids. This is a six stage process. The stages in this process are end product, target geographies, customer segment, product mix, industry footprint.
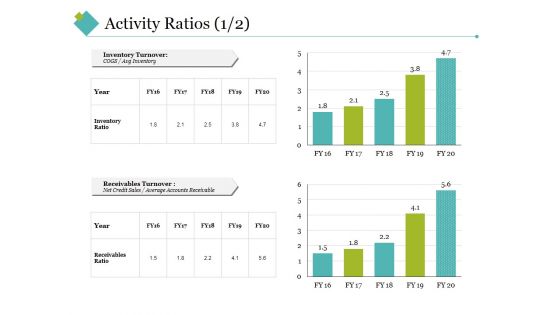
Activity Ratios Template 2 Ppt PowerPoint Presentation Show Images
This is a activity ratios template 2 ppt powerpoint presentation show images. This is a two stage process. The stages in this process are inventory turnover, receivables turnover, inventory ratio, receivables ratio, year.
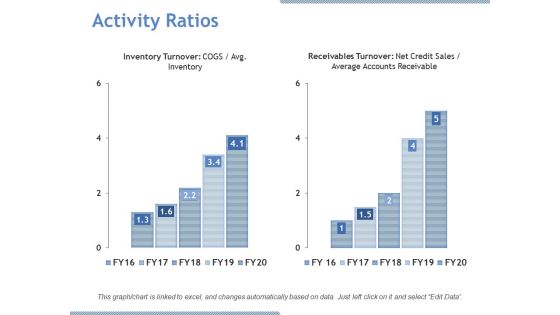
Activity Ratios Ppt PowerPoint Presentation Gallery Microsoft
This is a activity ratios ppt powerpoint presentation gallery microsoft. This is a two stage process. The stages in this process are inventory turnover, receivables turnover, net credit sales, average accounts receivable.
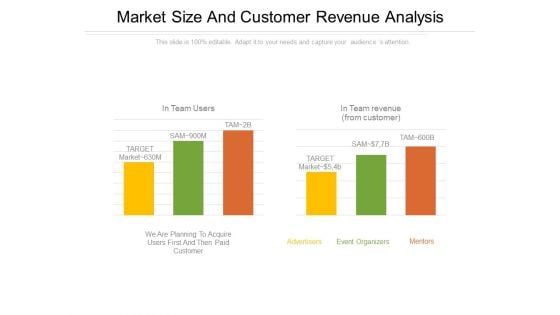
Market Size And Customer Revenue Analysis PowerPoint Presentation Examples
This is a market size and customer revenue analysis powerpoint presentation examples. This is a two stage process. The stages in this process are advertisers, mentors, event organizers, target, in team users.
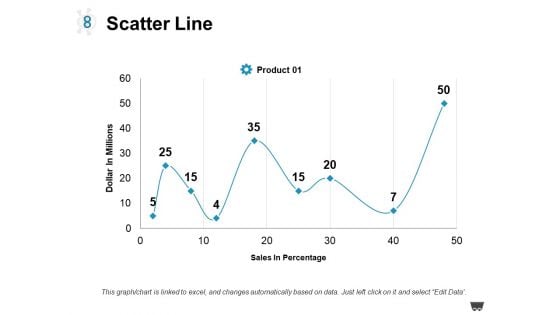
Scatter Line Ppt PowerPoint Presentation Styles Graphics Pictures
This is a scatter line ppt powerpoint presentation styles graphics pictures. This is a one stage process. The stages in this process are product, dollar in millions, sales in percentage.
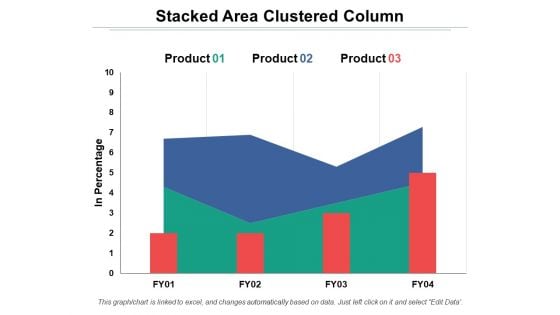
Stacked Area Clustered Column Ppt PowerPoint Presentation Professional Influencers
This is a stacked area clustered column ppt powerpoint presentation professional influencers. This is a three stage process. The stages in this process are stacked area clustered column, percentage, product, year.
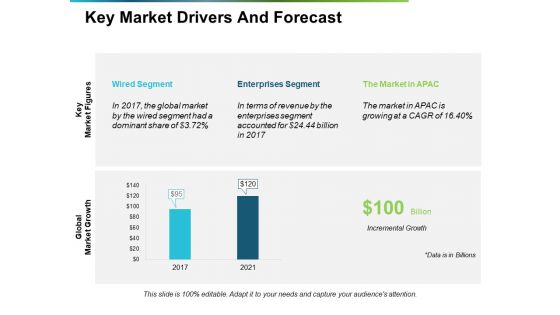
Key Market Drivers And Forecast Ppt PowerPoint Presentation Summary Templates
This is a key market drivers and forecast ppt powerpoint presentation summary templates. This is a two stage process. The stages in this process are key market drivers, forecast, growth, bar graph, business.
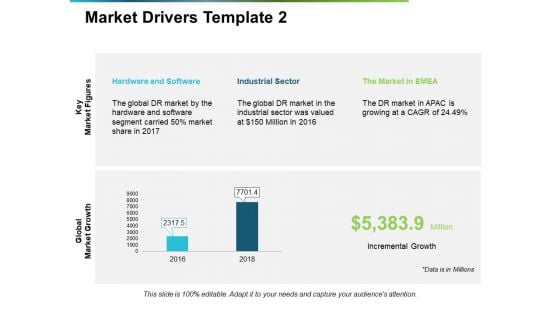
Market Drivers Hardware And Software Ppt PowerPoint Presentation Inspiration Graphics Design
This is a market drivers hardware and software ppt powerpoint presentation inspiration graphics design. This is a two stage process. The stages in this process are key market drivers, forecast, growth, bar graph, business.
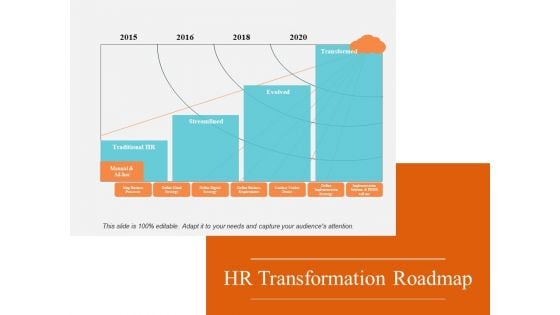
HR Transformation Roadmap Ppt PowerPoint Presentation Portfolio Example
This is a hr transformation roadmap ppt powerpoint presentation portfolio example. This is a four stage process. The stages in this process are traditional, streamlined, evolved, transformed, growth.
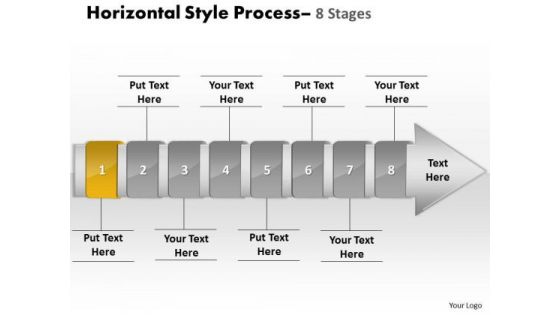
Ppt Theme Linear Demonstration Of 8 Steps Procedure Corporate Plan PowerPoint 2 Graphic
We present our PPT Theme Linear Demonstration of 8 steps procedure corporate plan power point 2 Graphic. Use our Arrows PowerPoint Templates because; Lay down the fundamentals to build upon. Use our Shapes PowerPoint Templates because; Help them align their arrows to consistently be accurate. Use our Finance PowerPoint Templates because, hence this diagram has the unique ability to drive home your ideas and show how they mesh to guarantee success. Use our Business PowerPoint Templates because, If making a mark is your obsession,. Use our Process and Flows PowerPoint Templates because, Profit fairly earned is what you believe infused these PowerPoint slides for presentations relating to accent, advertisement, arrow, badge, banner, business, button, collection, color, decoration, design, direction, element, financial, flow, graph, horizontal, instruction, isolated, label, manual, message, process, sale, set, shape, steps, symbol, template. The prominent colors used in the PowerPoint template are Yellow, Gray, and Black Flaunt it with our Ppt Theme Linear Demonstration Of 8 Steps Procedure Corporate Plan PowerPoint 2 Graphic. Exhibit your ability without a care.
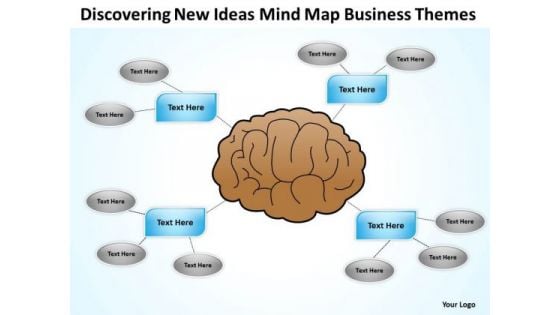
New Ideas Mind Map Business Themes Ppt Sample Plan PowerPoint Slides
We present our new ideas mind map business themes ppt sample plan PowerPoint Slides.Download our Business PowerPoint Templates because Our PowerPoint Templates and Slides will provide you the cutting edge. Slice through the doubts in the minds of your listeners. Use our Mindmaps PowerPoint Templates because Our PowerPoint Templates and Slides are topically designed to provide an attractive backdrop to any subject. Present our Process and Flows PowerPoint Templates because our PowerPoint Templates and Slides will give your ideas the shape. Use our Shapes PowerPoint Templates because Your success is our commitment. Our PowerPoint Templates and Slides will ensure you reach your goal. Present our Marketing PowerPoint Templates because It can Bubble and burst with your ideas.Use these PowerPoint slides for presentations relating to 3d,brain, human, real, medical, section, isolated, wisdom, pons, psychology, oblongata, cortex, central, head, diagram, tissue, cerebral, memory, neurology, mentality,medicine, lobe, mind, hemisphere, illustration, scientific, system, function, cerebellum, thalamus, telepathy, medulla, body, science, nerve, lateral, intellect,anatomy, genius, cerebrum, organ, health, anatomical. The prominent colors used in the PowerPoint template are Brown, Gray, Blue light. Win easily with our New Ideas Mind Map Business Themes Ppt Sample Plan PowerPoint Slides. Download without worries with our money back guaranteee.
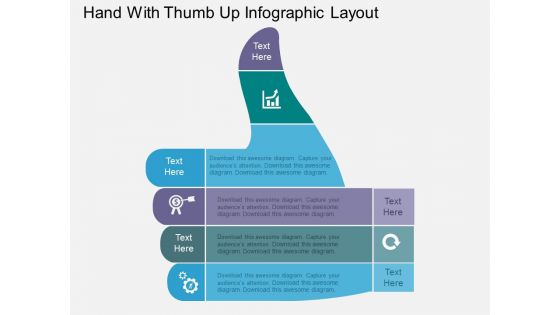
Hand With Thumb Up Infographic Layout Powerpoint Templates
Our above PPT slide displays diagram of hand with thump up infographic. This diagram may be used to display success and like concepts. Download this template to leave permanent impression on your audience.
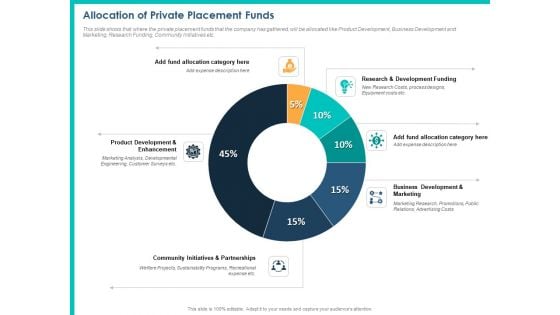
PPM Private Equity Allocation Of Private Placement Funds Ppt PowerPoint Presentation Inspiration Slide Download PDF
This slide shows that where the private placement funds that the company has gathered, will be allocated like Product Development, Business Development and Marketing, Research Funding, Community Initiatives etc. Deliver an awe-inspiring pitch with this creative ppm private equity allocation of private placement funds ppt powerpoint presentation inspiration slide download pdf bundle. Topics like add fund allocation category here, research and development funding, add fund allocation category here, business development and marketing, community initiatives and partnerships, product development and enhancement can be discussed with this completely editable template. It is available for immediate download depending on the needs and requirements of the user.
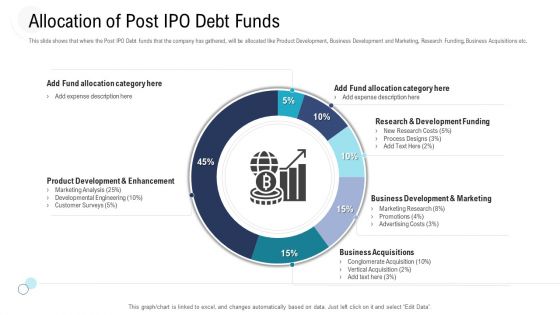
Investor Pitch Deck To Procure Federal Debt From Banks Allocation Of Post IPO Debt Funds Demonstration PDF
This slide shows that where the Post IPO Debt funds that the company has gathered, will be allocated like Product Development, Business Development and Marketing, Research Funding, Business Acquisitions etc. Deliver an awe inspiring pitch with this creative investor pitch deck to procure federal debt from banks allocation of post IPO debt funds demonstration pdf bundle. Topics like product development enhancement, marketing analysis, developmental engineering, research development funding, business development marketing can be discussed with this completely editable template. It is available for immediate download depending on the needs and requirements of the user.
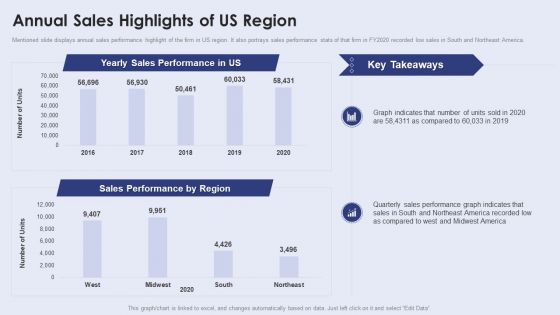
Creating New Product Launch Campaign Strategy Annual Sales Highlights Of Us Region Microsoft PDF
Mentioned slide displays annual sales performance highlight of the firm in US region. It also portrays sales performance stats of that firm in FY2020 recorded low sales in South and Northeast America. If you are looking for a format to display your unique thoughts, then the professionally designed Creating New Product Launch Campaign Strategy Annual Sales Highlights Of Us Region Microsoft PDF is the one for you. You can use it as a Google Slides template or a PowerPoint template. Incorporate impressive visuals, symbols, images, and other charts. Modify or reorganize the text boxes as you desire. Experiment with shade schemes and font pairings. Alter, share or cooperate with other people on your work. Download Creating New Product Launch Campaign Strategy Annual Sales Highlights Of Us Region Microsoft PDF and find out how to give a successful presentation. Present a perfect display to your team and make your presentation unforgettable.
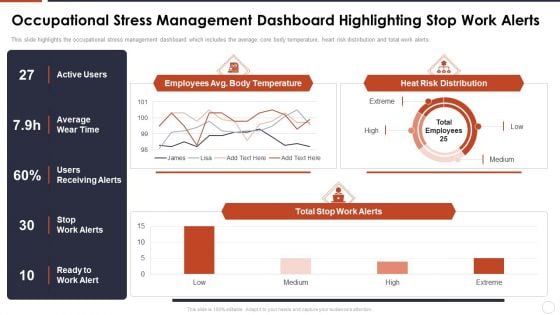
Occupational Stress Management Dashboard Highlighting Stop Work Alerts Background PDF
This slide highlights the occupational stress management dashboard which includes the average core body temperature, heart risk distribution and total work alerts. If you are looking for a format to display your unique thoughts, then the professionally designed Occupational Stress Management Dashboard Highlighting Stop Work Alerts Background PDF is the one for you. You can use it as a Google Slides template or a PowerPoint template. Incorporate impressive visuals, symbols, images, and other charts. Modify or reorganize the text boxes as you desire. Experiment with shade schemes and font pairings. Alter, share or cooperate with other people on your work. Download Occupational Stress Management Dashboard Highlighting Stop Work Alerts Background PDF and find out how to give a successful presentation. Present a perfect display to your team and make your presentation unforgettable.
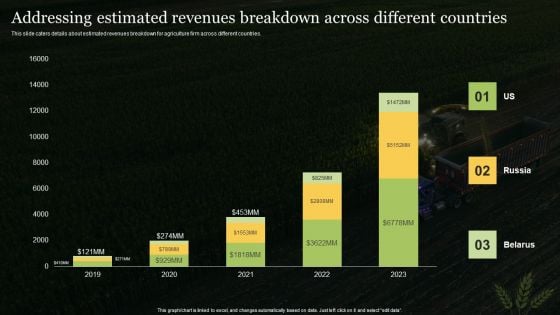
Addressing Estimated Revenues Breakdown Across Different Countries Professional PDF
This slide caters details about estimated revenues breakdown for agriculture firm across different countries. If you are looking for a format to display your unique thoughts, then the professionally designed Addressing Estimated Revenues Breakdown Across Different Countries Professional PDF is the one for you. You can use it as a Google Slides template or a PowerPoint template. Incorporate impressive visuals, symbols, images, and other charts. Modify or reorganize the text boxes as you desire. Experiment with shade schemes and font pairings. Alter, share or cooperate with other people on your work. Download Addressing Estimated Revenues Breakdown Across Different Countries Professional PDF and find out how to give a successful presentation. Present a perfect display to your team and make your presentation unforgettable.
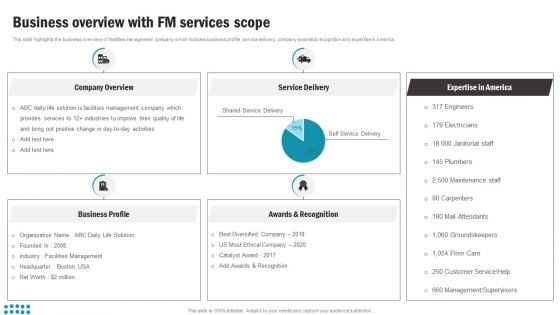
Business Overview With FM Services Scope Background PDF
This slide highlights the business overview of facilities management company which includes business profile, service delivery, company awards and recognition and expertise in America. If you are looking for a format to display your unique thoughts, then the professionally designed Business Overview With FM Services Scope Background PDF is the one for you. You can use it as a Google Slides template or a PowerPoint template. Incorporate impressive visuals, symbols, images, and other charts. Modify or reorganize the text boxes as you desire. Experiment with shade schemes and font pairings. Alter, share or cooperate with other people on your work. Download Business Overview With FM Services Scope Background PDF and find out how to give a successful presentation. Present a perfect display to your team and make your presentation unforgettable.
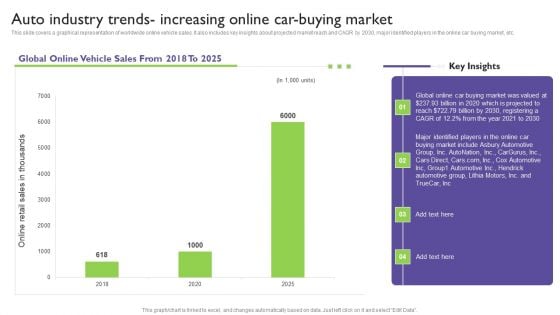
Global Automotive Industry Analysis Auto Industry Trends Increasing Online Car Buying Market Template PDF
This slide covers a graphical representation of worldwide online vehicle sales. It also includes key insights about projected market reach and CAGR by 2030, major identified players in the online car buying market, etc. If you are looking for a format to display your unique thoughts, then the professionally designed Global Automotive Industry Analysis Auto Industry Trends Increasing Online Car Buying Market Template PDF is the one for you. You can use it as a Google Slides template or a PowerPoint template. Incorporate impressive visuals, symbols, images, and other charts. Modify or reorganize the text boxes as you desire. Experiment with shade schemes and font pairings. Alter, share or cooperate with other people on your work. Download Global Automotive Industry Analysis Auto Industry Trends Increasing Online Car Buying Market Template PDF and find out how to give a successful presentation. Present a perfect display to your team and make your presentation unforgettable.
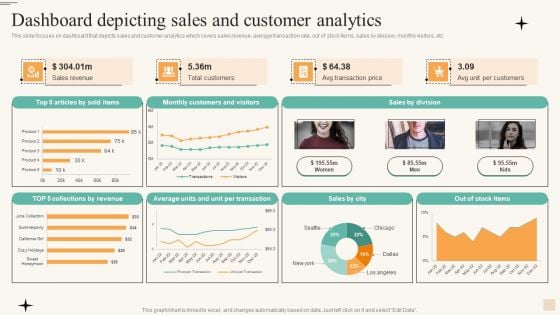
Dashboard Depicting Sales And Customer Analytics Infographics PDF
This slide focuses on dashboard that depicts sales and customer analytics which covers sales revenue, average transaction rate, out of stock items, sales by division, monthly visitors, etc. If you are looking for a format to display your unique thoughts, then the professionally designed Dashboard Depicting Sales And Customer Analytics Infographics PDF is the one for you. You can use it as a Google Slides template or a PowerPoint template. Incorporate impressive visuals, symbols, images, and other charts. Modify or reorganize the text boxes as you desire. Experiment with shade schemes and font pairings. Alter, share or cooperate with other people on your work. Download Dashboard Depicting Sales And Customer Analytics Infographics PDF and find out how to give a successful presentation. Present a perfect display to your team and make your presentation unforgettable.
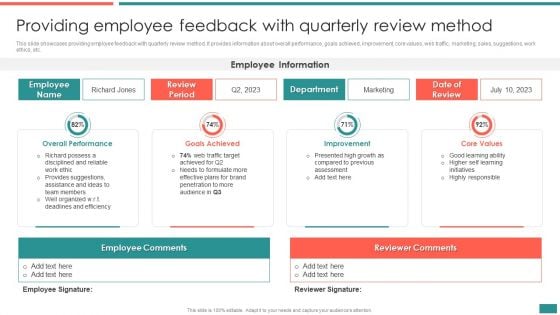
Providing Employee Feedback With Quarterly Review Method Building Efficient Workplace Performance Topics PDF
This slide showcases promoting team performance incentives and appraisal. It provides information about referrals, sponsors, benefits, coupons, traveling packages, performance assessment, rewards, top performers, program effectiveness, KPIs, etc.If you are looking for a format to display your unique thoughts, then the professionally designed Providing Employee Feedback With Quarterly Review Method Building Efficient Workplace Performance Topics PDF is the one for you. You can use it as a Google Slides template or a PowerPoint template. Incorporate impressive visuals, symbols, images, and other charts. Modify or reorganize the text boxes as you desire. Experiment with shade schemes and font pairings. Alter, share or cooperate with other people on your work. Download Providing Employee Feedback With Quarterly Review Method Building Efficient Workplace Performance Topics PDF and find out how to give a successful presentation. Present a perfect display to your team and make your presentation unforgettable.
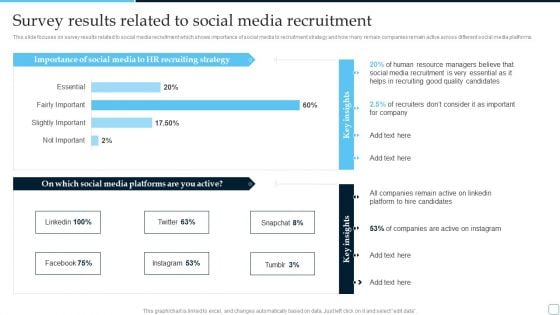
Survey Results Related To Social Media Recruitment Tactical Plan To Enhance Social Media Hiring Process Demonstration PDF
This slide focuses on survey results related to social media recruitment which shows importance of social media to recruitment strategy and how many remain companies remain active across different social media platforms.If you are looking for a format to display your unique thoughts, then the professionally designed Survey Results Related To Social Media Recruitment Tactical Plan To Enhance Social Media Hiring Process Demonstration PDF is the one for you. You can use it as a Google Slides template or a PowerPoint template. Incorporate impressive visuals, symbols, images, and other charts. Modify or reorganize the text boxes as you desire. Experiment with shade schemes and font pairings. Alter, share or cooperate with other people on your work. Download Survey Results Related To Social Media Recruitment Tactical Plan To Enhance Social Media Hiring Process Demonstration PDF and find out how to give a successful presentation. Present a perfect display to your team and make your presentation unforgettable.
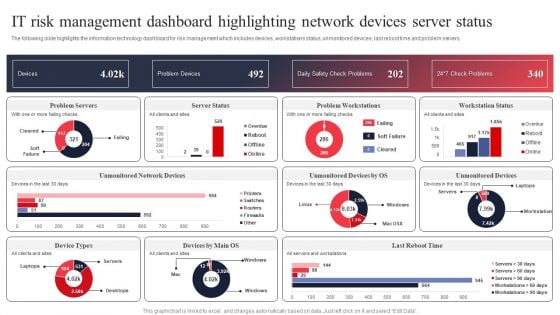
IT System Risk Management Guide IT Risk Management Dashboard Highlighting Network Devices Server Status Elements PDF
The following slide highlights the information technology dashboard for risk management which includes devices, workstations status, unmonitored devices, last reboot time and problem servers. If you are looking for a format to display your unique thoughts, then the professionally designed IT System Risk Management Guide IT Risk Management Dashboard Highlighting Network Devices Server Status Elements PDF is the one for you. You can use it as a Google Slides template or a PowerPoint template. Incorporate impressive visuals, symbols, images, and other charts. Modify or reorganize the text boxes as you desire. Experiment with shade schemes and font pairings. Alter, share or cooperate with other people on your work. Download IT System Risk Management Guide IT Risk Management Dashboard Highlighting Network Devices Server Status Elements PDF and find out how to give a successful presentation. Present a perfect display to your team and make your presentation unforgettable.
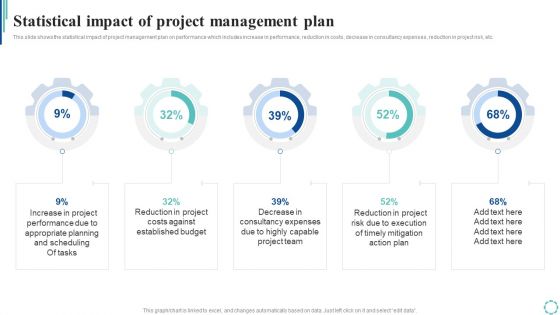
Statistical Impact Of Project Management Plan Strategies To Enhance Project Lifecycle Designs PDF
This slide shows the statistical impact of project management plan on performance which includes increase in performance, reduction in costs, decrease in consultancy expenses, reduction in project risk, etc.If you are looking for a format to display your unique thoughts, then the professionally designed Statistical Impact Of Project Management Plan Strategies To Enhance Project Lifecycle Designs PDF is the one for you. You can use it as a Google Slides template or a PowerPoint template. Incorporate impressive visuals, symbols, images, and other charts. Modify or reorganize the text boxes as you desire. Experiment with shade schemes and font pairings. Alter, share or cooperate with other people on your work. Download Statistical Impact Of Project Management Plan Strategies To Enhance Project Lifecycle Designs PDF and find out how to give a successful presentation. Present a perfect display to your team and make your presentation unforgettable.
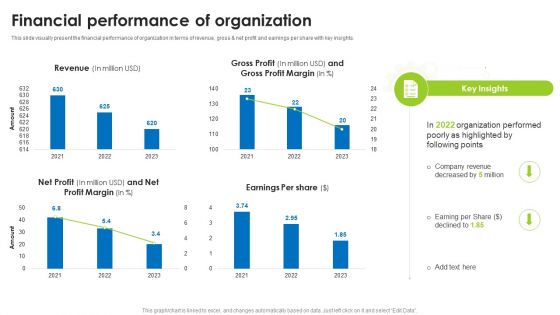
BI Technique For Data Informed Decisions Financial Performance Of Organization Guidelines PDF
This slide visually present the financial performance of organization in terms of revenue, gross and net profit and earnings per share with key insights. If you are looking for a format to display your unique thoughts, then the professionally designed BI Technique For Data Informed Decisions Financial Performance Of Organization Guidelines PDF is the one for you. You can use it as a Google Slides template or a PowerPoint template. Incorporate impressive visuals, symbols, images, and other charts. Modify or reorganize the text boxes as you desire. Experiment with shade schemes and font pairings. Alter, share or cooperate with other people on your work. Download BI Technique For Data Informed Decisions Financial Performance Of Organization Guidelines PDF and find out how to give a successful presentation. Present a perfect display to your team and make your presentation unforgettable.

Ad And Media Agency Company Profile Operating Profit 2018 To 2022 Information PDF
This slide focuses on operating profit of advertising agency for last five years from 2018 to 2022 which represents increasing trend due to reduced operating expenses. If you are looking for a format to display your unique thoughts, then the professionally designed Ad And Media Agency Company Profile Operating Profit 2018 To 2022 Information PDF is the one for you. You can use it as a Google Slides template or a PowerPoint template. Incorporate impressive visuals, symbols, images, and other charts. Modify or reorganize the text boxes as you desire. Experiment with shade schemes and font pairings. Alter, share or cooperate with other people on your work. Download Ad And Media Agency Company Profile Operating Profit 2018 To 2022 Information PDF and find out how to give a successful presentation. Present a perfect display to your team and make your presentation unforgettable.
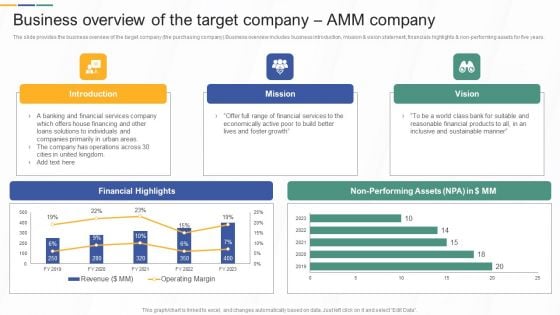
Business Overview Of The Target Company AMM Company Investment Banking And Deal Pitchbook Topics PDF
The slide provides the business overview of the target company the purchasing company.Business overview includes business introduction, mission and vision statement, financials highlights and non-performing assets for five years.If you are looking for a format to display your unique thoughts, then the professionally designed Business Overview Of The Target Company AMM Company Investment Banking And Deal Pitchbook Topics PDF is the one for you. You can use it as a Google Slides template or a PowerPoint template. Incorporate impressive visuals, symbols, images, and other charts. Modify or reorganize the text boxes as you desire. Experiment with shade schemes and font pairings. Alter, share or cooperate with other people on your work. Download Business Overview Of The Target Company AMM Company Investment Banking And Deal Pitchbook Topics PDF and find out how to give a successful presentation. Present a perfect display to your team and make your presentation unforgettable.
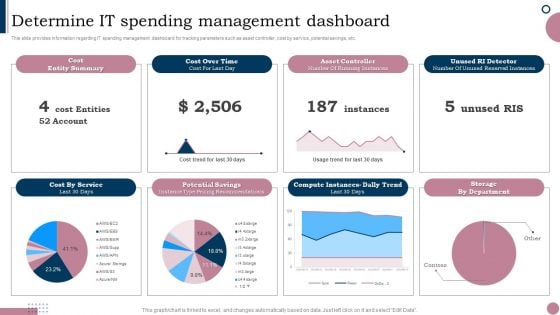
Cios Guide To Optimize Determine IT Spending Management Dashboard Portrait PDF
This slide provides information regarding IT spending management dashboard for tracking parameters such as asset controller, cost by service, potential savings, etc. If you are looking for a format to display your unique thoughts, then the professionally designed Cios Guide To Optimize Determine IT Spending Management Dashboard Portrait PDF is the one for you. You can use it as a Google Slides template or a PowerPoint template. Incorporate impressive visuals, symbols, images, and other charts. Modify or reorganize the text boxes as you desire. Experiment with shade schemes and font pairings. Alter, share or cooperate with other people on your work. Download Cios Guide To Optimize Determine IT Spending Management Dashboard Portrait PDF and find out how to give a successful presentation. Present a perfect display to your team and make your presentation unforgettable.
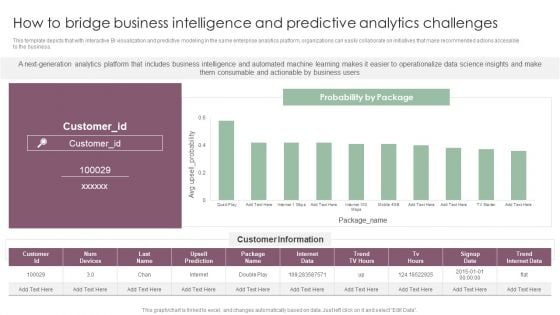
How To Bridge Business Intelligence And Predictive Analytics Challenges Mockup PDF
This template depicts that with interactive BI visualization and predictive modeling in the same enterprise analytics platform, organizations can easily collaborate on initiatives that make recommended actions accessible to the business. If you are looking for a format to display your unique thoughts, then the professionally designed How To Bridge Business Intelligence And Predictive Analytics Challenges Mockup PDF is the one for you. You can use it as a Google Slides template or a PowerPoint template. Incorporate impressive visuals, symbols, images, and other charts. Modify or reorganize the text boxes as you desire. Experiment with shade schemes and font pairings. Alter, share or cooperate with other people on your work. Download How To Bridge Business Intelligence And Predictive Analytics Challenges Mockup PDF and find out how to give a successful presentation. Present a perfect display to your team and make your presentation unforgettable.
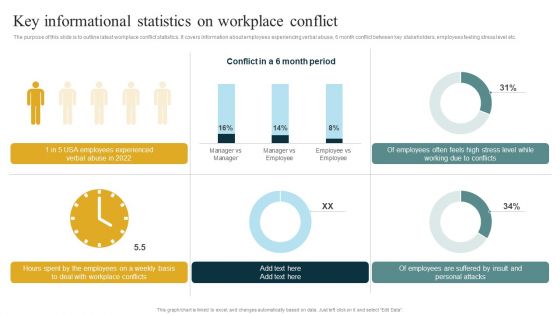
Key Informational Statistics On Workplace Conflict Managing Organizational Conflicts To Boost Portrait PDF
The purpose of this slide is to outline latest workplace conflict statistics. It covers information about employees experiencing verbal abuse, 6 month conflict between key stakeholders, employees feeling stress level etc.If you are looking for a format to display your unique thoughts, then the professionally designed Key Informational Statistics On Workplace Conflict Managing Organizational Conflicts To Boost Portrait PDF is the one for you. You can use it as a Google Slides template or a PowerPoint template. Incorporate impressive visuals, symbols, images, and other charts. Modify or reorganize the text boxes as you desire. Experiment with shade schemes and font pairings. Alter, share or cooperate with other people on your work. Download Key Informational Statistics On Workplace Conflict Managing Organizational Conflicts To Boost Portrait PDF and find out how to give a successful presentation. Present a perfect display to your team and make your presentation unforgettable.
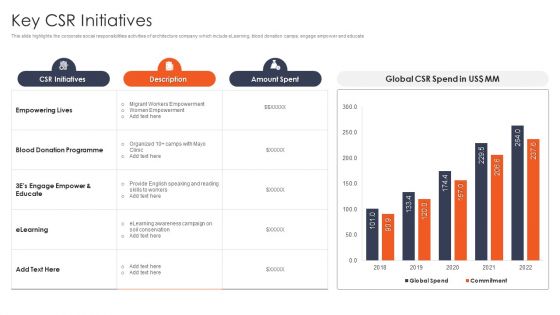
International Design And Architecture Firm Key CSR Initiatives Ppt Background Images PDF
This slide highlights the corporate social responsibilities activities of architecture company which include eLearning, blood donation camps, engage empower and educate If you are looking for a format to display your unique thoughts, then the professionally designed International Design And Architecture Firm Key CSR Initiatives Ppt Background Images PDF is the one for you. You can use it as a Google Slides template or a PowerPoint template. Incorporate impressive visuals, symbols, images, and other charts. Modify or reorganize the text boxes as you desire. Experiment with shade schemes and font pairings. Alter, share or cooperate with other people on your work. Download International Design And Architecture Firm Key CSR Initiatives Ppt Background Images PDF and find out how to give a successful presentation. Present a perfect display to your team and make your presentation unforgettable.

Call Center Action Plan Dashboard Highlighting Agent Performance With Satisfaction Score Information PDF
This slide showcases dashboard for call center action plan which includes total calls, average answer speed, abandon rate, average calls per minute with agent performance and overall customer satisfaction score. If you are looking for a format to display your unique thoughts, then the professionally designed Call Center Action Plan Dashboard Highlighting Agent Performance With Satisfaction Score Information PDF is the one for you. You can use it as a Google Slides template or a PowerPoint template. Incorporate impressive visuals, symbols, images, and other charts. Modify or reorganize the text boxes as you desire. Experiment with shade schemes and font pairings. Alter, share or cooperate with other people on your work. Download Call Center Action Plan Dashboard Highlighting Agent Performance With Satisfaction Score Information PDF and find out how to give a successful presentation. Present a perfect display to your team and make your presentation unforgettable.
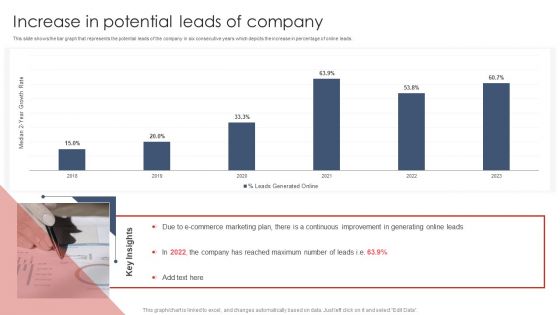
Increase In Potential Leads Of Company Digital Marketing Strategy Deployment Slides PDF
This slide shows the bar graph that represents the potential leads of the company in six consecutive years which depicts the increase in percentage of online leads.If you are looking for a format to display your unique thoughts, then the professionally designed Increase In Potential Leads Of Company Digital Marketing Strategy Deployment Slides PDF is the one for you. You can use it as a Google Slides template or a PowerPoint template. Incorporate impressive visuals, symbols, images, and other charts. Modify or reorganize the text boxes as you desire. Experiment with shade schemes and font pairings. Alter, share or cooperate with other people on your work. Download Increase In Potential Leads Of Company Digital Marketing Strategy Deployment Slides PDF and find out how to give a successful presentation. Present a perfect display to your team and make your presentation unforgettable.
CRM Pipeline Administration Tracking Customer Sales Funnel Dashboard Brochure PDF
This slide covers information regarding the customer sales funnel tracking with sales volume and total market. If you are looking for a format to display your unique thoughts, then the professionally designed CRM Pipeline Administration Tracking Customer Sales Funnel Dashboard Brochure PDF is the one for you. You can use it as a Google Slides template or a PowerPoint template. Incorporate impressive visuals, symbols, images, and other charts. Modify or reorganize the text boxes as you desire. Experiment with shade schemes and font pairings. Alter, share or cooperate with other people on your work. Download CRM Pipeline Administration Tracking Customer Sales Funnel Dashboard Brochure PDF and find out how to give a successful presentation. Present a perfect display to your team and make your presentation unforgettable.
Business To Business Digital Implement Tracking And Reporting To Measure Summary PDF
This template covers dashboard to measure and analyze campaign performance. It also helps in tracking and reporting account based marketing channel and tactics. If you are looking for a format to display your unique thoughts, then the professionally designed Business To Business Digital Implement Tracking And Reporting To Measure Summary PDF is the one for you. You can use it as a Google Slides template or a PowerPoint template. Incorporate impressive visuals, symbols, images, and other charts. Modify or reorganize the text boxes as you desire. Experiment with shade schemes and font pairings. Alter, share or cooperate with other people on your work. Download Business To Business Digital Implement Tracking And Reporting To Measure Summary PDF and find out how to give a successful presentation. Present a perfect display to your team and make your presentation unforgettable.
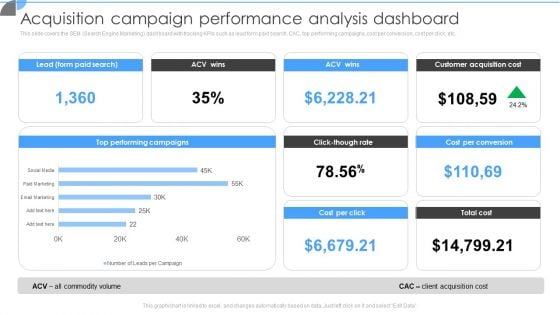
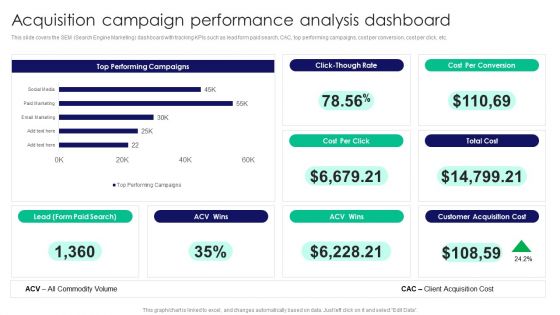
Customer Acquisition Approaches To Enhance Organization Growth Acquisition Campaign Performance Analysis Dashboard Information PDF
This slide covers the SEM Search Engine Marketing dashboard with tracking KPIs such as lead form paid search, CAC, top performing campaigns, cost per conversion, cost per click, etc. If you are looking for a format to display your unique thoughts, then the professionally designed Customer Acquisition Approaches To Enhance Organization Growth Acquisition Campaign Performance Analysis Dashboard Information PDF is the one for you. You can use it as a Google Slides template or a PowerPoint template. Incorporate impressive visuals, symbols, images, and other charts. Modify or reorganize the text boxes as you desire. Experiment with shade schemes and font pairings. Alter, share or cooperate with other people on your work. Download Customer Acquisition Approaches To Enhance Organization Growth Acquisition Campaign Performance Analysis Dashboard Information PDF and find out how to give a successful presentation. Present a perfect display to your team and make your presentation unforgettable.
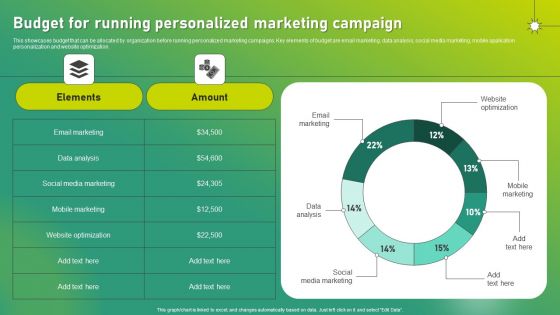
Targeted Marketing Strategic Plan For Audience Engagement Budget For Running Personalized Marketing Campaign Infographics PDF
This showcases budget that can be allocated by organization before running personalized marketing campaigns. Key elements of budget are email marketing, data analysis, social media marketing, mobile application personalization and website optimization. If you are looking for a format to display your unique thoughts, then the professionally designed Targeted Marketing Strategic Plan For Audience Engagement Budget For Running Personalized Marketing Campaign Infographics PDF is the one for you. You can use it as a Google Slides template or a PowerPoint template. Incorporate impressive visuals, symbols, images, and other charts. Modify or reorganize the text boxes as you desire. Experiment with shade schemes and font pairings. Alter, share or cooperate with other people on your work. Download Targeted Marketing Strategic Plan For Audience Engagement Budget For Running Personalized Marketing Campaign Infographics PDF and find out how to give a successful presentation. Present a perfect display to your team and make your presentation unforgettable.
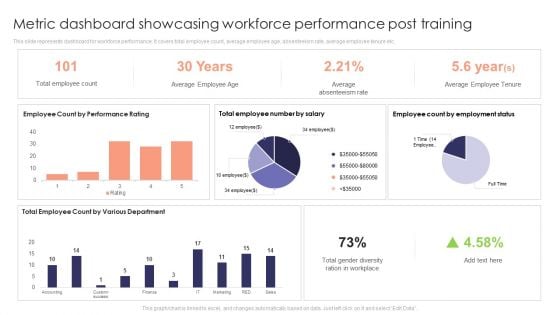
Metric Dashboard Showcasing Workforce Performance Post Training Ideas PDF
This slide represents dashboard for workforce performance. It covers total employee count, average employee age, absenteeism rate, average employee tenure etc. If you are looking for a format to display your unique thoughts, then the professionally designed Metric Dashboard Showcasing Workforce Performance Post Training Ideas PDF is the one for you. You can use it as a Google Slides template or a PowerPoint template. Incorporate impressive visuals, symbols, images, and other charts. Modify or reorganize the text boxes as you desire. Experiment with shade schemes and font pairings. Alter, share or cooperate with other people on your work. Download Metric Dashboard Showcasing Workforce Performance Post Training Ideas PDF and find out how to give a successful presentation. Present a perfect display to your team and make your presentation unforgettable.
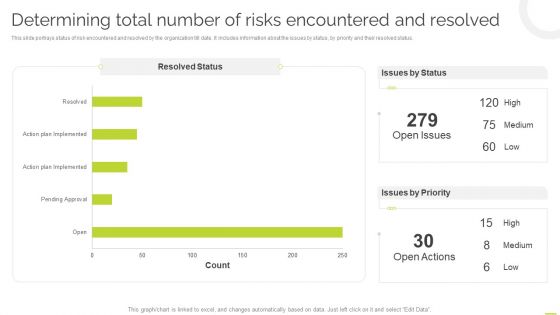
Effective BPM Tool For Business Process Management Determining Total Number Of Risks Encountered And Resolved Inspiration PDF
This slide portrays status of risk encountered and resolved by the organization till date. It includes information about the issues by status, by priority and their resolved status. If you are looking for a format to display your unique thoughts, then the professionally designed Effective BPM Tool For Business Process Management Determining Total Number Of Risks Encountered And Resolved Inspiration PDF is the one for you. You can use it as a Google Slides template or a PowerPoint template. Incorporate impressive visuals, symbols, images, and other charts. Modify or reorganize the text boxes as you desire. Experiment with shade schemes and font pairings. Alter, share or cooperate with other people on your work. Download Effective BPM Tool For Business Process Management Determining Total Number Of Risks Encountered And Resolved Inspiration PDF and find out how to give a successful presentation. Present a perfect display to your team and make your presentation unforgettable.
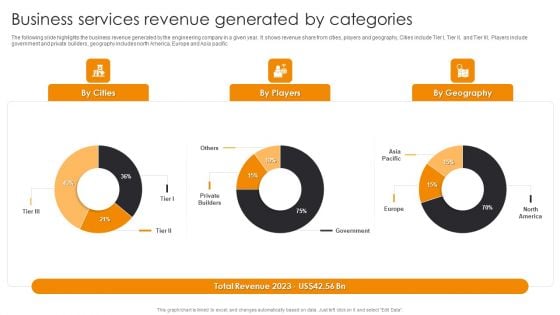
Business Services Revenue Generated By Categories Engineering Company Financial Analysis Report Graphics PDF
The following slide highlights the business revenue generated by the engineering company in a given year. It shows revenue share from cities, players and geography, Cities include Tier I, Tier II, and Tier III, Players include government and private builders, geography includes north America, Europe and Asia pacific.If you are looking for a format to display your unique thoughts, then the professionally designed Business Services Revenue Generated By Categories Engineering Company Financial Analysis Report Graphics PDF is the one for you. You can use it as a Google Slides template or a PowerPoint template. Incorporate impressive visuals, symbols, images, and other charts. Modify or reorganize the text boxes as you desire. Experiment with shade schemes and font pairings. Alter, share or cooperate with other people on your work. Download Business Services Revenue Generated By Categories Engineering Company Financial Analysis Report Graphics PDF and find out how to give a successful presentation. Present a perfect display to your team and make your presentation unforgettable.
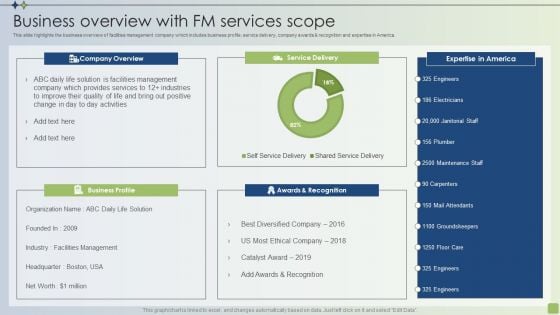
Strategic FM Services Business Overview With FM Services Scope Demonstration PDF
This slide highlights the business overview of facilities management company which includes business profile, service delivery, company awards and recognition and expertise in America. If you are looking for a format to display your unique thoughts, then the professionally designed Strategic FM Services Business Overview With FM Services Scope Demonstration PDF is the one for you. You can use it as a Google Slides template or a PowerPoint template. Incorporate impressive visuals, symbols, images, and other charts. Modify or reorganize the text boxes as you desire. Experiment with shade schemes and font pairings. Alter, share or cooperate with other people on your work. Download Strategic FM Services Business Overview With FM Services Scope Demonstration PDF and find out how to give a successful presentation. Present a perfect display to your team and make your presentation unforgettable.
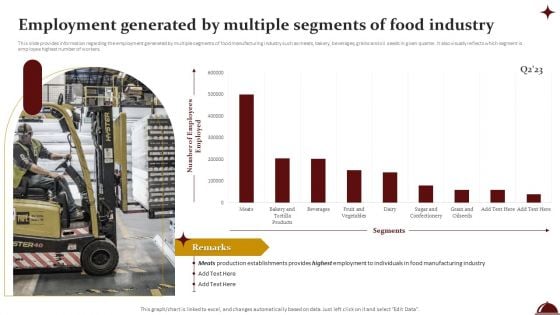
Employment Generated By Multiple Segments Of Food Industry Download PDF
This slide provides information regarding the employment generated by multiple segments of food manufacturing industry such as meats, bakery, beverages, grains and oil seeds in given quarter. It also visually reflects which segment is employee highest number of workers. If you are looking for a format to display your unique thoughts, then the professionally designed Employment Generated By Multiple Segments Of Food Industry Download PDF is the one for you. You can use it as a Google Slides template or a PowerPoint template. Incorporate impressive visuals, symbols, images, and other charts. Modify or reorganize the text boxes as you desire. Experiment with shade schemes and font pairings. Alter, share or cooperate with other people on your work. Download Employment Generated By Multiple Segments Of Food Industry Download PDF and find out how to give a successful presentation. Present a perfect display to your team and make your presentation unforgettable.
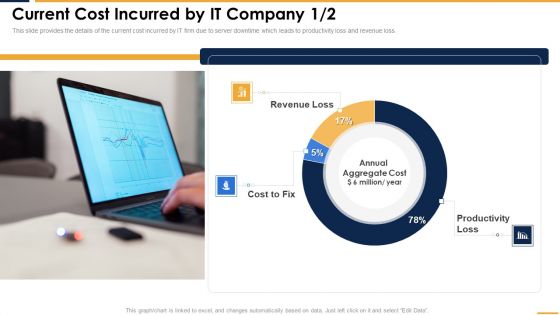
Current Cost Incurred By IT Company Microsoft PDF
This slide provides the details of the current cost incurred by IT firm due to server downtime which leads to productivity loss and revenue loss. If you are looking for a format to display your unique thoughts, then the professionally designed Current Cost Incurred By IT Company Microsoft PDF is the one for you. You can use it as a Google Slides template or a PowerPoint template. Incorporate impressive visuals, symbols, images, and other charts. Modify or reorganize the text boxes as you desire. Experiment with shade schemes and font pairings. Alter, share or cooperate with other people on your work. Download Current Cost Incurred By IT Company Microsoft PDF and find out how to give a successful presentation. Present a perfect display to your team and make your presentation unforgettable.

Website Audit To Increase Conversion Rate Crawl Diagnostics With SEO Checker Analysis Slides PDF
This slide highlights the website crawl diagnostics which includes errors, warnings, and notices with most common errors including duplicate page title and duplicate page content. If you are looking for a format to display your unique thoughts, then the professionally designed Website Audit To Increase Conversion Rate Crawl Diagnostics With SEO Checker Analysis Slides PDF is the one for you. You can use it as a Google Slides template or a PowerPoint template. Incorporate impressive visuals, symbols, images, and other charts. Modify or reorganize the text boxes as you desire. Experiment with shade schemes and font pairings. Alter, share or cooperate with other people on your work. Download Website Audit To Increase Conversion Rate Crawl Diagnostics With SEO Checker Analysis Slides PDF and find out how to give a successful presentation. Present a perfect display to your team and make your presentation unforgettable.
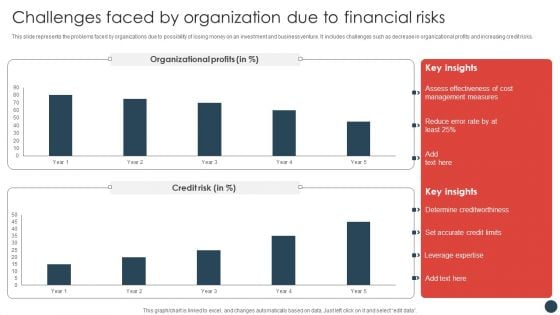
Strategic Risk Management Plan Challenges Faced By Organization Due To Financial Risks Elements PDF
This slide represents the problems faced by organizations due to possibility of losing money on an investment and business venture. It includes challenges such as decrease in organizational profits and increasing credit risks.If you are looking for a format to display your unique thoughts, then the professionally designed Strategic Risk Management Plan Challenges Faced By Organization Due To Financial Risks Elements PDF is the one for you. You can use it as a Google Slides template or a PowerPoint template. Incorporate impressive visuals, symbols, images, and other charts. Modify or reorganize the text boxes as you desire. Experiment with shade schemes and font pairings. Alter, share or cooperate with other people on your work. Download Strategic Risk Management Plan Challenges Faced By Organization Due To Financial Risks Elements PDF and find out how to give a successful presentation. Present a perfect display to your team and make your presentation unforgettable.
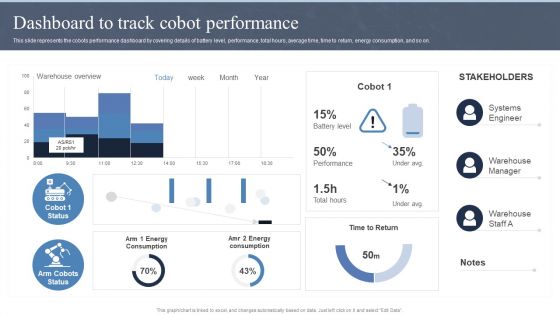
Collaborative Robots IT Dashboard To Track Cobot Performance Ppt Slides Guidelines PDF
This slide represents the cobots performance dashboard by covering details of battery level, performance, total hours, average time, time to return, energy consumption, and so on. If you are looking for a format to display your unique thoughts, then the professionally designed Collaborative Robots IT Dashboard To Track Cobot Performance Ppt Slides Guidelines PDF is the one for you. You can use it as a Google Slides template or a PowerPoint template. Incorporate impressive visuals, symbols, images, and other charts. Modify or reorganize the text boxes as you desire. Experiment with shade schemes and font pairings. Alter, share or cooperate with other people on your work. Download Collaborative Robots IT Dashboard To Track Cobot Performance Ppt Slides Guidelines PDF and find out how to give a successful presentation. Present a perfect display to your team and make your presentation unforgettable.
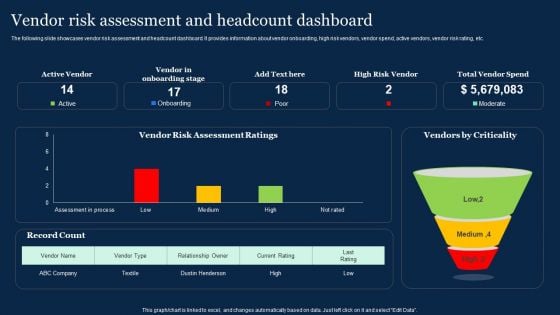
Vendor Risk Assessment And Headcount Dashboard Effective Vendor Management For Enhancing Elements PDF
The following slide showcases vendor risk assessment and headcount dashboard. It provides information about vendor onboarding, high risk vendors, vendor spend, active vendors, vendor risk rating, etc. If you are looking for a format to display your unique thoughts, then the professionally designed Vendor Risk Assessment And Headcount Dashboard Effective Vendor Management For Enhancing Elements PDF is the one for you. You can use it as a Google Slides template or a PowerPoint template. Incorporate impressive visuals, symbols, images, and other charts. Modify or reorganize the text boxes as you desire. Experiment with shade schemes and font pairings. Alter, share or cooperate with other people on your work. Download Vendor Risk Assessment And Headcount Dashboard Effective Vendor Management For Enhancing Elements PDF and find out how to give a successful presentation. Present a perfect display to your team and make your presentation unforgettable.
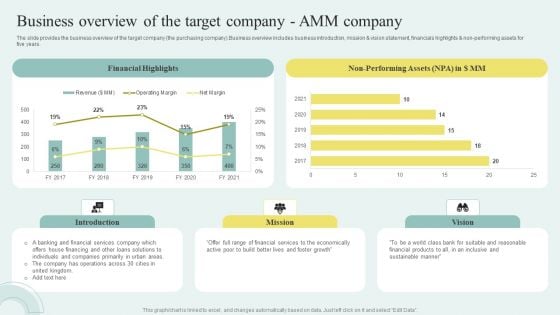
Sell Side M And A Pitchbook With Deal Overview Business Overview Of The Target Company AMM Company Graphics PDF
The slide provides the business overview of the target company the purchasing company.Business overview includes business introduction, mission and vision statement, financials highlights and non performing assets for five years. If you are looking for a format to display your unique thoughts, then the professionally designed Sell Side M And A Pitchbook With Deal Overview Business Overview Of The Target Company AMM Company Graphics PDF is the one for you. You can use it as a Google Slides template or a PowerPoint template. Incorporate impressive visuals, symbols, images, and other charts. Modify or reorganize the text boxes as you desire. Experiment with shade schemes and font pairings. Alter, share or cooperate with other people on your work. Download Sell Side M And A Pitchbook With Deal Overview Business Overview Of The Target Company AMM Company Graphics PDF and find out how to give a successful presentation. Present a perfect display to your team and make your presentation unforgettable.
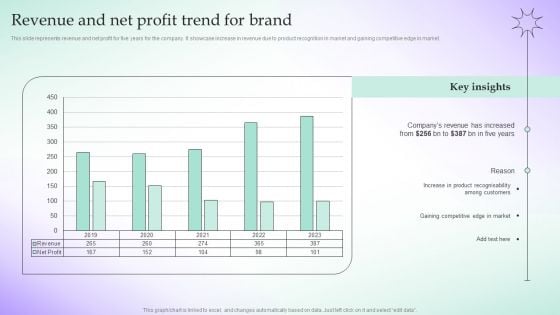
Revenue And Net Profit Trend For Brand Adopting Culture Branding Strategy Portrait PDF
If you are looking for a format to display your unique thoughts, then the professionally designed Revenue And Net Profit Trend For Brand Adopting Culture Branding Strategy Portrait PDF is the one for you. You can use it as a Google Slides template or a PowerPoint template. Incorporate impressive visuals, symbols, images, and other charts. Modify or reorganize the text boxes as you desire. Experiment with shade schemes and font pairings. Alter, share or cooperate with other people on your work. Download Revenue And Net Profit Trend For Brand Adopting Culture Branding Strategy Portrait PDF and find out how to give a successful presentation. Present a perfect display to your team and make your presentation unforgettable.
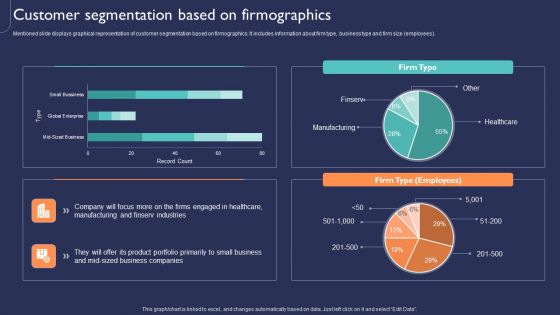
Introduction To New Product Portfolio Customer Segmentation Based On Firmographics Ppt Model Ideas PDF
Mentioned slide displays graphical representation of customer segmentation based on firmographics. It includes information about firm type, business type and firm size employees. If you are looking for a format to display your unique thoughts, then the professionally designed Introduction To New Product Portfolio Customer Segmentation Based On Firmographics Ppt Model Ideas PDF is the one for you. You can use it as a Google Slides template or a PowerPoint template. Incorporate impressive visuals, symbols, images, and other charts. Modify or reorganize the text boxes as you desire. Experiment with shade schemes and font pairings. Alter, share or cooperate with other people on your work. Download Introduction To New Product Portfolio Customer Segmentation Based On Firmographics Ppt Model Ideas PDF and find out how to give a successful presentation. Present a perfect display to your team and make your presentation unforgettable.
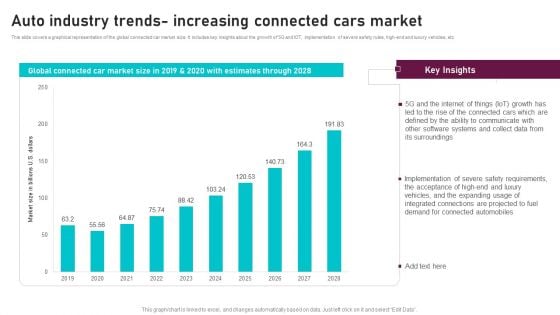
Auto Industry Trends Increasing Connected Cars Market Global Automotive Manufacturing Market Analysis Clipart PDF
This slide covers a graphical representation of the global connected car market size. It includes key insights about the growth of 5G and IOT, implementation of severe safety rules, high end and luxury vehicles, etc. If you are looking for a format to display your unique thoughts, then the professionally designed Auto Industry Trends Increasing Connected Cars Market Global Automotive Manufacturing Market Analysis Clipart PDF is the one for you. You can use it as a Google Slides template or a PowerPoint template. Incorporate impressive visuals, symbols, images, and other charts. Modify or reorganize the text boxes as you desire. Experiment with shade schemes and font pairings. Alter, share or cooperate with other people on your work. Download Auto Industry Trends Increasing Connected Cars Market Global Automotive Manufacturing Market Analysis Clipart PDF and find out how to give a successful presentation. Present a perfect display to your team and make your presentation unforgettable.
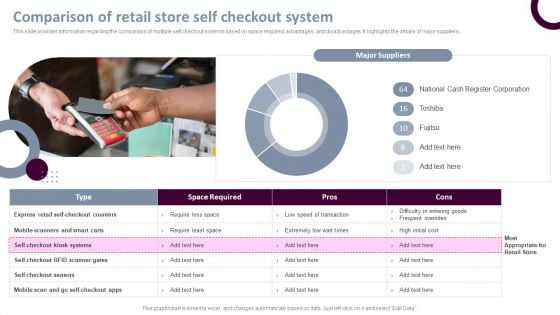
Retail Store Operations Comparison Of Retail Store Self Checkout System Template PDF
This slide provides information regarding the comparison of multiple self checkout systems based on space required, advantages, and disadvantages. It highlights the details of major suppliers. If you are looking for a format to display your unique thoughts, then the professionally designed Retail Store Operations Comparison Of Retail Store Self Checkout System Template PDF is the one for you. You can use it as a Google Slides template or a PowerPoint template. Incorporate impressive visuals, symbols, images, and other charts. Modify or reorganize the text boxes as you desire. Experiment with shade schemes and font pairings. Alter, share or cooperate with other people on your work. Download Retail Store Operations Comparison Of Retail Store Self Checkout System Template PDF and find out how to give a successful presentation. Present a perfect display to your team and make your presentation unforgettable.
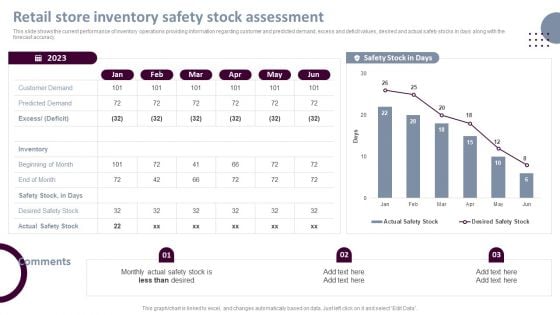
Retail Store Operations Retail Store Inventory Safety Stock Assessment Background PDF
This slide shows the current performance of inventory operations providing information regarding customer and predicted demand, excess and deficit values, desired and actual safety stocks in days along with the forecast accuracy. If you are looking for a format to display your unique thoughts, then the professionally designed Retail Store Operations Retail Store Inventory Safety Stock Assessment Background PDF is the one for you. You can use it as a Google Slides template or a PowerPoint template. Incorporate impressive visuals, symbols, images, and other charts. Modify or reorganize the text boxes as you desire. Experiment with shade schemes and font pairings. Alter, share or cooperate with other people on your work. Download Retail Store Operations Retail Store Inventory Safety Stock Assessment Background PDF and find out how to give a successful presentation. Present a perfect display to your team and make your presentation unforgettable.
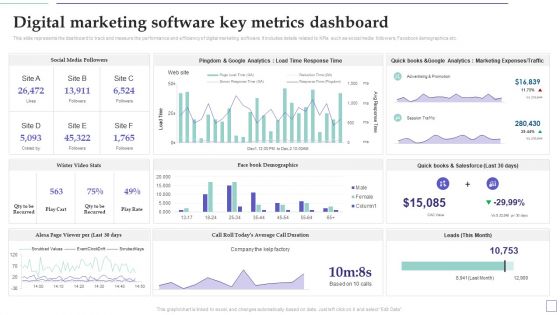
System Deployment Project Digital Marketing Software Key Metrics Dashboard Graphics PDF
This slide represents the dashboard to track and measure the performance and efficiency of digital marketing software. It includes details related to KPIs such as social media followers, Facebook demographics etc. If you are looking for a format to display your unique thoughts, then the professionally designed System Deployment Project Digital Marketing Software Key Metrics Dashboard Graphics PDF is the one for you. You can use it as a Google Slides template or a PowerPoint template. Incorporate impressive visuals, symbols, images, and other charts. Modify or reorganize the text boxes as you desire. Experiment with shade schemes and font pairings. Alter, share or cooperate with other people on your work. Download System Deployment Project Digital Marketing Software Key Metrics Dashboard Graphics PDF and find out how to give a successful presentation. Present a perfect display to your team and make your presentation unforgettable.
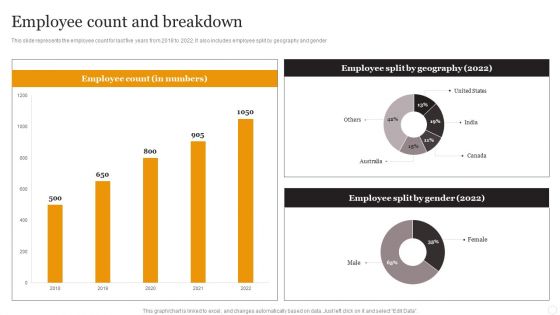
Website Designing Solutions Company Profile Employee Count And Breakdown Rules PDF
This slide represents the employee count for last five years from 2018 to 2022. It also includes employee split by geography and gender. If you are looking for a format to display your unique thoughts, then the professionally designed Website Designing Solutions Company Profile Employee Count And Breakdown Rules PDF is the one for you. You can use it as a Google Slides template or a PowerPoint template. Incorporate impressive visuals, symbols, images, and other charts. Modify or reorganize the text boxes as you desire. Experiment with shade schemes and font pairings. Alter, share or cooperate with other people on your work. Download Website Designing Solutions Company Profile Employee Count And Breakdown Rules PDF and find out how to give a successful presentation. Present a perfect display to your team and make your presentation unforgettable.
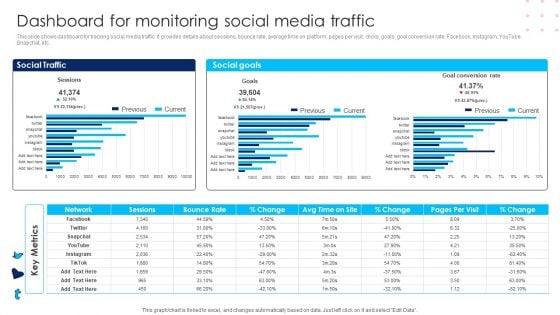
Using Social Media Platforms To Enhance Dashboard For Monitoring Social Media Traffic Structure PDF
This slide shows dashboard for tracking social media traffic. It provides details about sessions, bounce rate, average time on platform, pages per visit, clicks, goals, goal conversion rate, Facebook, Instagram, YouTube, Snapchat, etc. If you are looking for a format to display your unique thoughts, then the professionally designed Using Social Media Platforms To Enhance Dashboard For Monitoring Social Media Traffic Structure PDF is the one for you. You can use it as a Google Slides template or a PowerPoint template. Incorporate impressive visuals, symbols, images, and other charts. Modify or reorganize the text boxes as you desire. Experiment with shade schemes and font pairings. Alter, share or cooperate with other people on your work. Download Using Social Media Platforms To Enhance Dashboard For Monitoring Social Media Traffic Structure PDF and find out how to give a successful presentation. Present a perfect display to your team and make your presentation unforgettable.
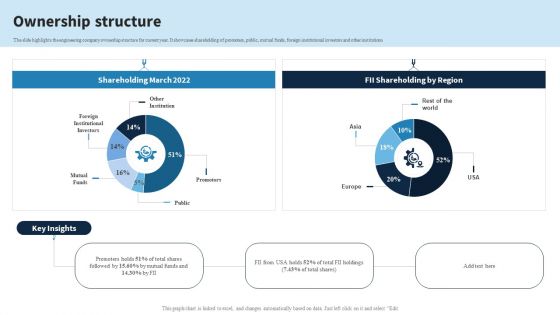
Engineering Services Company Report Ownership Structure Ppt PowerPoint Presentation File Model PDF
The slide highlights the engineering company ownership structure for current year. It showcases shareholding of promoters, public, mutual funds, foreign institutional investors and other institutions. If you are looking for a format to display your unique thoughts, then the professionally designed Engineering Services Company Report Ownership Structure Ppt PowerPoint Presentation File Model PDF is the one for you. You can use it as a Google Slides template or a PowerPoint template. Incorporate impressive visuals, symbols, images, and other charts. Modify or reorganize the text boxes as you desire. Experiment with shade schemes and font pairings. Alter, share or cooperate with other people on your work. Download Engineering Services Company Report Ownership Structure Ppt PowerPoint Presentation File Model PDF and find out how to give a successful presentation. Present a perfect display to your team and make your presentation unforgettable.
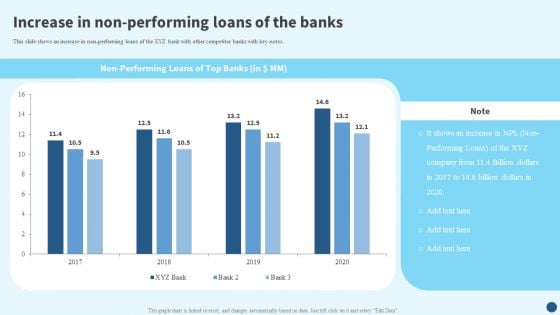
Credit Risk Management Increase In Non Performing Loans Of The Banks Demonstration PDF
This slide shows an increase in non-performing loans of the XYZ bank with other competitor banks with key notes. If you are looking for a format to display your unique thoughts, then the professionally designed Credit Risk Management Increase In Non Performing Loans Of The Banks Demonstration PDF is the one for you. You can use it as a Google Slides template or a PowerPoint template. Incorporate impressive visuals, symbols, images, and other charts. Modify or reorganize the text boxes as you desire. Experiment with shade schemes and font pairings. Alter, share or cooperate with other people on your work. Download Credit Risk Management Increase In Non Performing Loans Of The Banks Demonstration PDF and find out how to give a successful presentation. Present a perfect display to your team and make your presentation unforgettable.
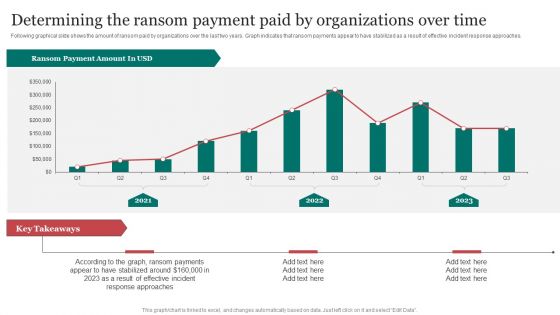
Determining The Ransom Payment Paid By Organizations Over Time Information PDF
Following graphical slide shows the amount of ransom paid by organizations over the last two years. Graph indicates that ransom payments appear to have stabilized as a result of effective incident response approaches.If you are looking for a format to display your unique thoughts, then the professionally designed Determining The Ransom Payment Paid By Organizations Over Time Information PDF is the one for you. You can use it as a Google Slides template or a PowerPoint template. Incorporate impressive visuals, symbols, images, and other charts. Modify or reorganize the text boxes as you desire. Experiment with shade schemes and font pairings. Alter, share or cooperate with other people on your work. Download Determining The Ransom Payment Paid By Organizations Over Time Information PDF and find out how to give a successful presentation. Present a perfect display to your team and make your presentation unforgettable.
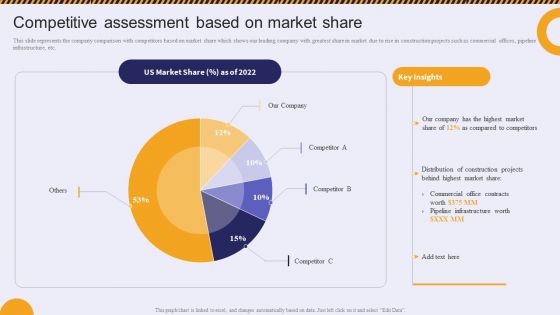
Competitive Assessment Based On Market Share Residential And Commercial Building Slides PDF
This slide represents the company comparison with competitors based on market share which shows our leading company with greatest share in market due to rise in construction projects such as commercial offices, pipeline infrastructure, etc.If you are looking for a format to display your unique thoughts, then the professionally designed Competitive Assessment Based On Market Share Residential And Commercial Building Slides PDF is the one for you. You can use it as a Google Slides template or a PowerPoint template. Incorporate impressive visuals, symbols, images, and other charts. Modify or reorganize the text boxes as you desire. Experiment with shade schemes and font pairings. Alter, share or cooperate with other people on your work. Download Competitive Assessment Based On Market Share Residential And Commercial Building Slides PDF and find out how to give a successful presentation. Present a perfect display to your team and make your presentation unforgettable.
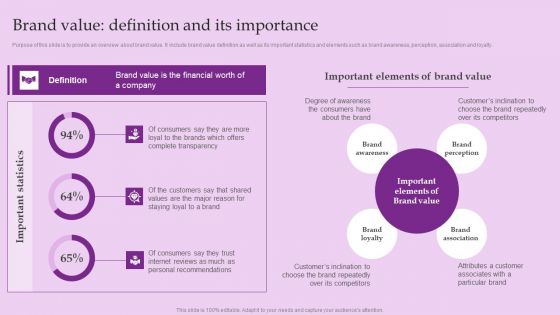
Brand Value Definition And Its Importance Brand And Equity Evaluation Techniques Brochure PDF
Purpose of this slide is to provide an overview about brand value. It include brand value definition as well as its important statistics and elements such as brand awareness, perception, association and loyalty.If you are looking for a format to display your unique thoughts, then the professionally designed Brand Value Definition And Its Importance Brand And Equity Evaluation Techniques Brochure PDF is the one for you. You can use it as a Google Slides template or a PowerPoint template. Incorporate impressive visuals, symbols, images, and other charts. Modify or reorganize the text boxes as you desire. Experiment with shade schemes and font pairings. Alter, share or cooperate with other people on your work. Download Brand Value Definition And Its Importance Brand And Equity Evaluation Techniques Brochure PDF and find out how to give a successful presentation. Present a perfect display to your team and make your presentation unforgettable.
Effective Brand Reputation Management Rebranding Performance Tracking Dashboard Summary PDF
This slide provides information regarding promotion plan to optimize overall brands reputation through initiatives such as organizing contest, product giveaways, promotional gifts, customer appreciation, etc. If you are looking for a format to display your unique thoughts, then the professionally designed Effective Brand Reputation Management Rebranding Performance Tracking Dashboard Summary PDF is the one for you. You can use it as a Google Slides template or a PowerPoint template. Incorporate impressive visuals, symbols, images, and other charts. Modify or reorganize the text boxes as you desire. Experiment with shade schemes and font pairings. Alter, share or cooperate with other people on your work. Download Effective Brand Reputation Management Rebranding Performance Tracking Dashboard Summary PDF and find out how to give a successful presentation. Present a perfect display to your team and make your presentation unforgettable.
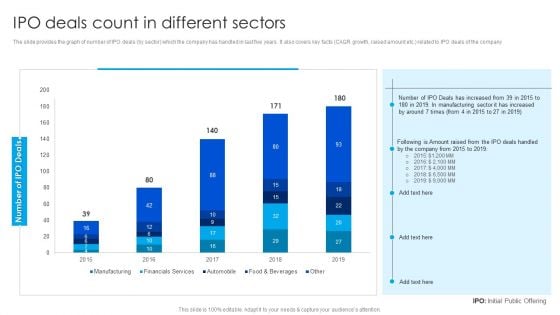
Strategy To Raise Funds IPO Deals Count In Different Sectors Designs PDF
The slide provides the graph of number of IPO deals by sector which the company has handled in last five years. It also covers key facts CAGR growth, raised amount etc. related to IPO deals of the company. If you are looking for a format to display your unique thoughts, then the professionally designed Strategy To Raise Funds IPO Deals Count In Different Sectors Designs PDF is the one for you. You can use it as a Google Slides template or a PowerPoint template. Incorporate impressive visuals, symbols, images, and other charts. Modify or reorganize the text boxes as you desire. Experiment with shade schemes and font pairings. Alter, share or cooperate with other people on your work. Download Strategy To Raise Funds IPO Deals Count In Different Sectors Designs PDF and find out how to give a successful presentation. Present a perfect display to your team and make your presentation unforgettable.
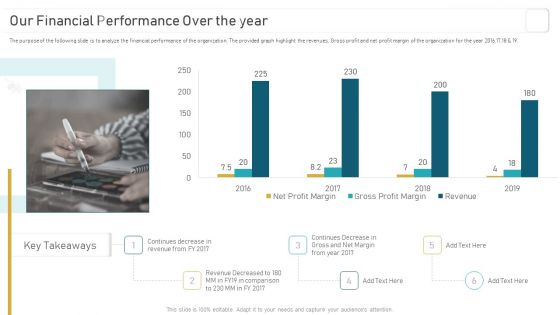
Deploying And Managing Recurring Our Financial Performance Over The Year Infographics PDF
The purpose of the following slide is to analyze the financial performance of the organization. The provided graph highlight the revenues, Gross profit and net profit margin of the organization for the year 2016,17,18 and 19. If you are looking for a format to display your unique thoughts, then the professionally designed Deploying And Managing Recurring Our Financial Performance Over The Year Infographics PDF is the one for you. You can use it as a Google Slides template or a PowerPoint template. Incorporate impressive visuals, symbols, images, and other charts. Modify or reorganize the text boxes as you desire. Experiment with shade schemes and font pairings. Alter, share or cooperate with other people on your work. Download Deploying And Managing Recurring Our Financial Performance Over The Year Infographics PDF and find out how to give a successful presentation. Present a perfect display to your team and make your presentation unforgettable.
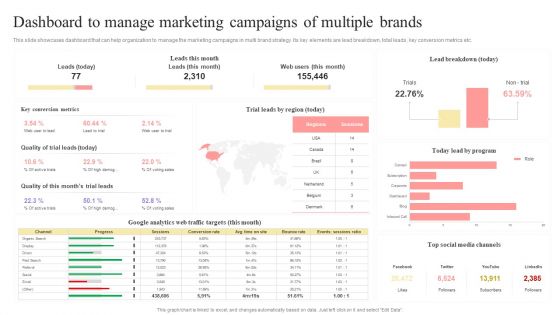
Dashboard To Manage Marketing Campaigns Of Multiple Brands Structure PDF
This slide showcases dashboard that can help organization to manage the marketing campaigns in multi brand strategy. Its key elements are lead breakdown, total leads, key conversion metrics etc.If you are looking for a format to display your unique thoughts, then the professionally designed Dashboard To Manage Marketing Campaigns Of Multiple Brands Structure PDF is the one for you. You can use it as a Google Slides template or a PowerPoint template. Incorporate impressive visuals, symbols, images, and other charts. Modify or reorganize the text boxes as you desire. Experiment with shade schemes and font pairings. Alter, share or cooperate with other people on your work. Download Dashboard To Manage Marketing Campaigns Of Multiple Brands Structure PDF and find out how to give a successful presentation. Present a perfect display to your team and make your presentation unforgettable.
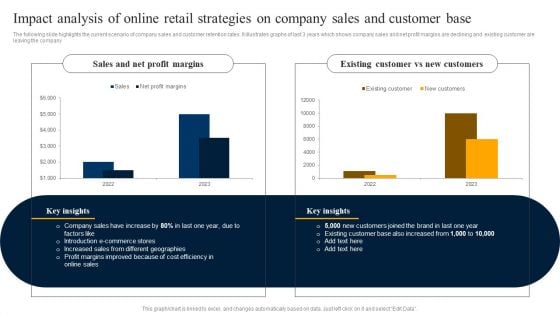
Impact Analysis Of Online Retail Strategies On Company Sales And Customer Base Pictures PDF
The following slide highlights the current scenario of company sales and customer retention rates. It illustrates graphs of last 3 years which shows company sales and net profit margins are declining and existing customer are leaving the company. If you are looking for a format to display your unique thoughts, then the professionally designed Impact Analysis Of Online Retail Strategies On Company Sales And Customer Base Pictures PDF is the one for you. You can use it as a Google Slides template or a PowerPoint template. Incorporate impressive visuals, symbols, images, and other charts. Modify or reorganize the text boxes as you desire. Experiment with shade schemes and font pairings. Alter, share or cooperate with other people on your work. Download Impact Analysis Of Online Retail Strategies On Company Sales And Customer Base Pictures PDF and find out how to give a successful presentation. Present a perfect display to your team and make your presentation unforgettable.
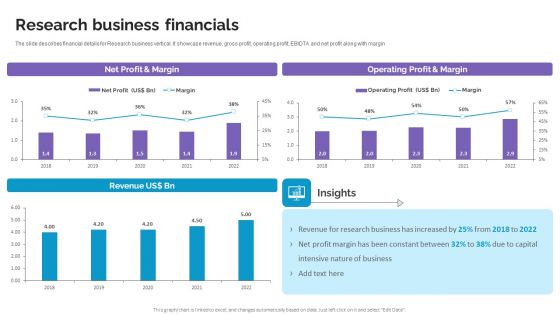
Research Business Financials Life Science And Healthcare Solutions Company Profile Information PDF
The slide describes financial details for Research business vertical. It showcase revenue, gross profit, operating profit, EBIDTA and net profit along with margin. If you are looking for a format to display your unique thoughts, then the professionally designed Research Business Financials Life Science And Healthcare Solutions Company Profile Information PDF is the one for you. You can use it as a Google Slides template or a PowerPoint template. Incorporate impressive visuals, symbols, images, and other charts. Modify or reorganize the text boxes as you desire. Experiment with shade schemes and font pairings. Alter, share or cooperate with other people on your work. Download Research Business Financials Life Science And Healthcare Solutions Company Profile Information PDF and find out how to give a successful presentation. Present a perfect display to your team and make your presentation unforgettable.
Dashboard For Cloud Storage Tracking Ppt PowerPoint Presentation File Layouts PDF
This slide represents the dashboard for cloud storage tracking by covering details of users, available workspaces, shared files, downloads, uploads, and moves. If you are looking for a format to display your unique thoughts, then the professionally designed Dashboard For Cloud Storage Tracking Ppt PowerPoint Presentation File Layouts PDF is the one for you. You can use it as a Google Slides template or a PowerPoint template. Incorporate impressive visuals, symbols, images, and other charts. Modify or reorganize the text boxes as you desire. Experiment with shade schemes and font pairings. Alter, share or cooperate with other people on your work. Download Dashboard For Cloud Storage Tracking Ppt PowerPoint Presentation File Layouts PDF and find out how to give a successful presentation. Present a perfect display to your team and make your presentation unforgettable.
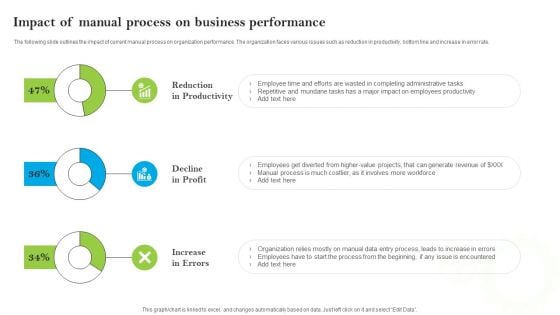
Introducing AI Tools Impact Of Manual Process On Business Performance Ideas PDF
The following slide outlines the impact of current manual process on organization performance. The organization faces various issues such as reduction in productivity, bottom line and increase in error rate. If you are looking for a format to display your unique thoughts, then the professionally designed Introducing AI Tools Impact Of Manual Process On Business Performance Ideas PDF is the one for you. You can use it as a Google Slides template or a PowerPoint template. Incorporate impressive visuals, symbols, images, and other charts. Modify or reorganize the text boxes as you desire. Experiment with shade schemes and font pairings. Alter, share or cooperate with other people on your work. Download Introducing AI Tools Impact Of Manual Process On Business Performance Ideas PDF and find out how to give a successful presentation. Present a perfect display to your team and make your presentation unforgettable.
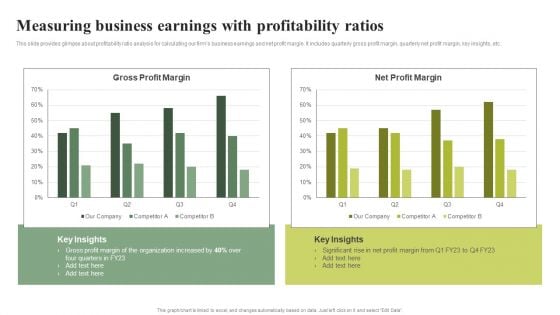
Measuring Business Earnings With Profitability Ratios Effective Planning For Monetary Strategy Elements PDF
This slide provides glimpse about profitability ratio analysis for calculating our firms business earnings and net profit margin. It includes quarterly gross profit margin, quarterly net profit margin, key insights, etc.If you are looking for a format to display your unique thoughts, then the professionally designed Measuring Business Earnings With Profitability Ratios Effective Planning For Monetary Strategy Elements PDF is the one for you. You can use it as a Google Slides template or a PowerPoint template. Incorporate impressive visuals, symbols, images, and other charts. Modify or reorganize the text boxes as you desire. Experiment with shade schemes and font pairings. Alter, share or cooperate with other people on your work. Download Measuring Business Earnings With Profitability Ratios Effective Planning For Monetary Strategy Elements PDF and find out how to give a successful presentation. Present a perfect display to your team and make your presentation unforgettable.
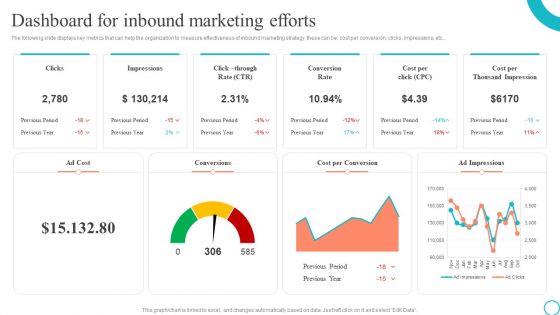
Dashboard For Inbound Marketing Efforts Marketing Tactics To Enhance Business Graphics PDF
The following slide displays key metrics that can help the organization to measure effectiveness of inbound marketing strategy, these can be cost per conversion, clicks, impressions, etc. If you are looking for a format to display your unique thoughts, then the professionally designed Dashboard For Inbound Marketing Efforts Marketing Tactics To Enhance Business Graphics PDF is the one for you. You can use it as a Google Slides template or a PowerPoint template. Incorporate impressive visuals, symbols, images, and other charts. Modify or reorganize the text boxes as you desire. Experiment with shade schemes and font pairings. Alter, share or cooperate with other people on your work. Download Dashboard For Inbound Marketing Efforts Marketing Tactics To Enhance Business Graphics PDF and find out how to give a successful presentation. Present a perfect display to your team and make your presentation unforgettable.
Guide To Business Customer Acquisition Acquisition Campaign Performance Analysis Dashboard Rules PDF
This slide covers the SEM Search Engine Marketing dashboard with tracking KPIs such as lead form paid search, CAC, top performing campaigns, cost per conversion, cost per click, etc. If you are looking for a format to display your unique thoughts, then the professionally designed Guide To Business Customer Acquisition Acquisition Campaign Performance Analysis Dashboard Rules PDF is the one for you. You can use it as a Google Slides template or a PowerPoint template. Incorporate impressive visuals, symbols, images, and other charts. Modify or reorganize the text boxes as you desire. Experiment with shade schemes and font pairings. Alter, share or cooperate with other people on your work. Download Guide To Business Customer Acquisition Acquisition Campaign Performance Analysis Dashboard Rules PDF and find out how to give a successful presentation. Present a perfect display to your team and make your presentation unforgettable.
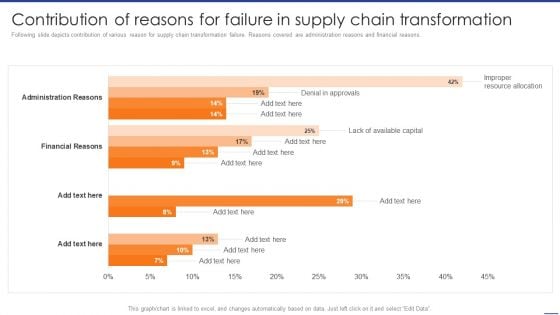
Digital Transformation Of Supply Contribution Of Reasons For Failure In Supply Chain Guidelines PDF
Following slide depicts contribution of various reason for supply chain transformation failure. Reasons covered are administration reasons and financial reasons. If you are looking for a format to display your unique thoughts, then the professionally designed Digital Transformation Of Supply Contribution Of Reasons For Failure In Supply Chain Guidelines PDF is the one for you. You can use it as a Google Slides template or a PowerPoint template. Incorporate impressive visuals, symbols, images, and other charts. Modify or reorganize the text boxes as you desire. Experiment with shade schemes and font pairings. Alter, share or cooperate with other people on your work. Download Digital Transformation Of Supply Contribution Of Reasons For Failure In Supply Chain Guidelines PDF and find out how to give a successful presentation. Present a perfect display to your team and make your presentation unforgettable.

Engineering Enterprise Competitive Competitor Comparison Topics PDF
The slide highlights the competitor comparison for top competitors. It compares companies on the basis of global market share, revenue, employee count, location served and services offered. If you are looking for a format to display your unique thoughts, then the professionally designed Engineering Enterprise Competitive Competitor Comparison Topics PDF is the one for you. You can use it as a Google Slides template or a PowerPoint template. Incorporate impressive visuals, symbols, images, and other charts. Modify or reorganize the text boxes as you desire. Experiment with shade schemes and font pairings. Alter, share or cooperate with other people on your work. Download Engineering Enterprise Competitive Competitor Comparison Topics PDF and find out how to give a successful presentation. Present a perfect display to your team and make your presentation unforgettable.
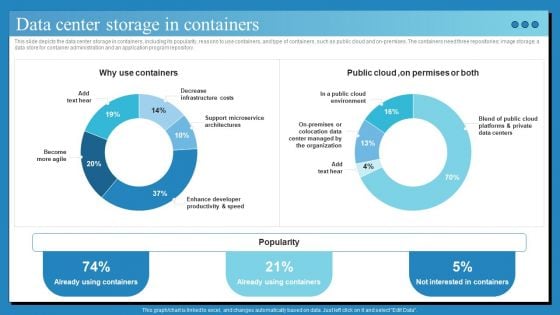
Data Center Infrastructure Technologies Data Center Storage In Containers Designs PDF
This slide depicts the data center storage in containers, including its popularity, reasons to use containers, and type of containers, such as public cloud and on-premises. The containers need three repositories image storage, a data store for container administration and an application program repository. If you are looking for a format to display your unique thoughts, then the professionally designed Data Center Infrastructure Technologies Data Center Storage In Containers Designs PDF is the one for you. You can use it as a Google Slides template or a PowerPoint template. Incorporate impressive visuals, symbols, images, and other charts. Modify or reorganize the text boxes as you desire. Experiment with shade schemes and font pairings. Alter, share or cooperate with other people on your work. Download Data Center Infrastructure Technologies Data Center Storage In Containers Designs PDF and find out how to give a successful presentation. Present a perfect display to your team and make your presentation unforgettable.
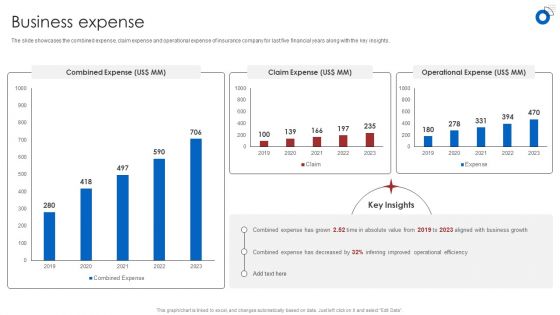
Insurance Business Financial Analysis Business Expense Ppt Show Rules PDF
The slide showcases the combined expense, claim expense and operational expense of insurance company for last five financial years along with the key insights. If you are looking for a format to display your unique thoughts, then the professionally designed Insurance Business Financial Analysis Business Expense Ppt Show Rules PDF is the one for you. You can use it as a Google Slides template or a PowerPoint template. Incorporate impressive visuals, symbols, images, and other charts. Modify or reorganize the text boxes as you desire. Experiment with shade schemes and font pairings. Alter, share or cooperate with other people on your work. Download Insurance Business Financial Analysis Business Expense Ppt Show Rules PDF and find out how to give a successful presentation. Present a perfect display to your team and make your presentation unforgettable.

 Home
Home