Investment Performance
New Product Performance Cost Analysis Ppt PowerPoint Presentation Complete Deck With Slides
Presenting this set of slides with name new product performance cost analysis ppt powerpoint presentation complete deck with slides. The topics discussed in these slides are recurrent costs, cost decreasing, cost benefits analysis. This is a completely editable PowerPoint presentation and is available for immediate download. Download now and impress your audience.
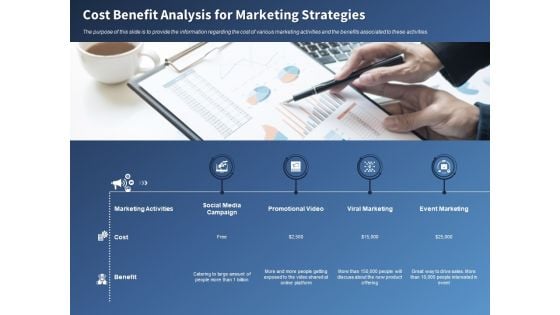
Performance Assessment Sales Initiative Report Cost Benefit Analysis For Marketing Strategies Ppt Layouts Brochure PDF
Presenting this set of slides with name performance assessment sales initiative report cost benefit analysis for marketing strategies ppt layouts brochure pdf. This is a four stage process. The stages in this process are marketing, cost, social media, campaign, marketing. This is a completely editable PowerPoint presentation and is available for immediate download. Download now and impress your audience.
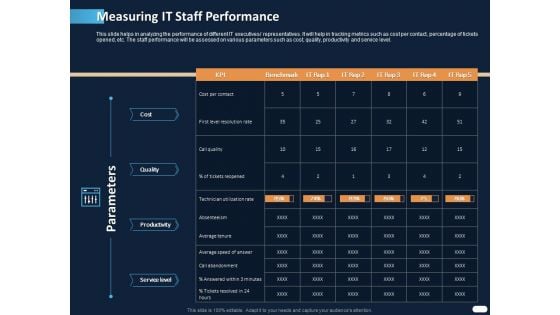
ITIL Strategy Service Excellence Measuring IT Staff Performance Cost Ppt PowerPoint Presentation File Background Image PDF
Presenting this set of slides with name itil strategy service excellence measuring it staff performance cost ppt powerpoint presentation file background image pdf. The topics discussed in these slides are cost, quality, productivity, service level. This is a completely editable PowerPoint presentation and is available for immediate download. Download now and impress your audience.
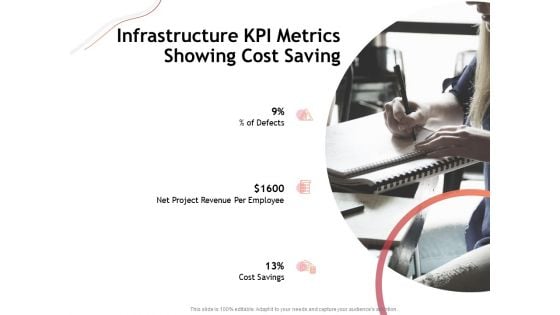
Performance Measuement Of Infrastructure Project Infrastructure KPI Metrics Showing Cost Saving Clipart PDF
Presenting this set of slides with name performance measuement of infrastructure project infrastructure kpi metrics showing cost saving clipart pdf. This is a three stage process. The stages in this process are defects, revenue, cost savings. This is a completely editable PowerPoint presentation and is available for immediate download. Download now and impress your audience.
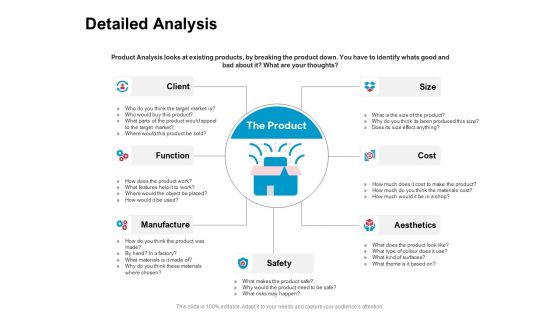
New Product Development Performance Evaluation Detailed Analysis Cost Ppt PowerPoint Presentation Professional Brochure PDF
Presenting this set of slides with name new product development performance evaluation detailed analysis cost ppt powerpoint presentation professional brochure pdf. This is a seven stage process. The stages in this process are client, function, manufacture, safety, aesthetics, cost, size. This is a completely editable PowerPoint presentation and is available for immediate download. Download now and impress your audience.
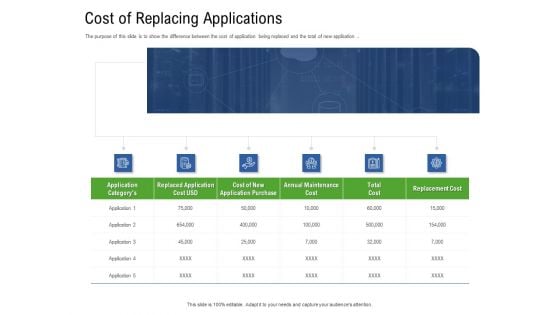
Application Performance Management Cost Of Replacing Applications Ppt Infographic Template Layout PDF
Presenting application performance management cost of replacing applications ppt infographic template layout pdf to provide visual cues and insights. Share and navigate important information on five stages that need your due attention. This template can be used to pitch topics like cost, maintenance, replacement. In addtion, this PPT design contains high resolution images, graphics, etc, that are easily editable and available for immediate download.
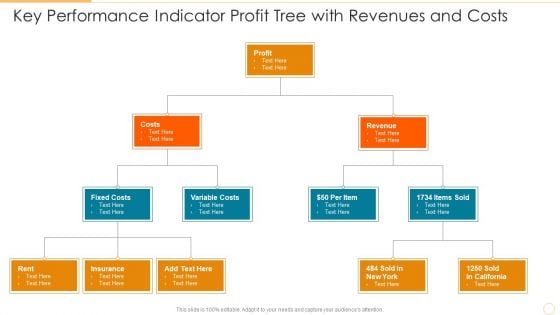
Key Performance Indicator Profit Tree With Revenues And Costs Template PDF
Presenting key performance indicator profit tree with revenues and costs template pdf to dispense important information. This template comprises three stages. It also presents valuable insights into the topics including costs, profit, revenue. This is a completely customizable PowerPoint theme that can be put to use immediately. So, download it and address the topic impactfully.

Key Performance Indicator Tree Indicating Fixed And Variable Costs Diagrams PDF
Persuade your audience using this key performance indicator tree indicating fixed and variable costs diagrams pdf. This PPT design covers four stages, thus making it a great tool to use. It also caters to a variety of topics including costs, revenue, profit. Download this PPT design now to present a convincing pitch that not only emphasizes the topic but also showcases your presentation skills.
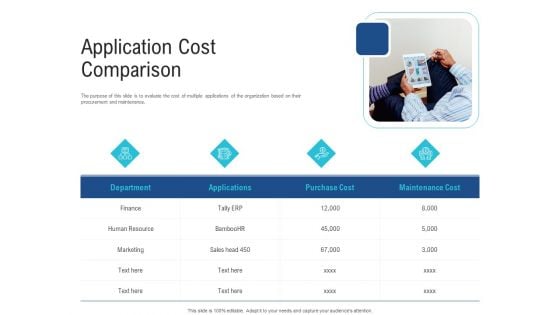
Enhance Enterprise Application Performance Application Cost Comparison Ppt Infographic Template Example PDF
Presenting enhance enterprise application performance application cost comparison ppt infographic template example pdf to provide visual cues and insights. Share and navigate important information on four stages that need your due attention. This template can be used to pitch topics like purchase cost, maintenance cost, finance, marketing, human resource . In addtion, this PPT design contains high-resolution images, graphics, etc, that are easily editable and available for immediate download.
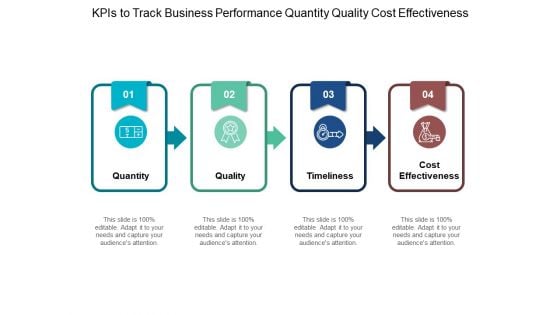
Kpis To Track Business Performance Quantity Quality Cost Effectiveness Ppt PowerPoint Presentation Styles Show
Presenting this set of slides with name kpis to track business performance quantity quality cost effectiveness ppt powerpoint presentation styles show. This is a four stage process. The stages in this process are Marketing, Business, Management, Planning, Strategy. This is a completely editable PowerPoint presentation and is available for immediate download. Download now and impress your audience.
New Product Performance Cost Analysis Icons Slide Ppt PowerPoint Presentation Layouts Pictures
Presenting this set of slides containing editable icons for topic new product performance cost analysis icons slide ppt powerpoint presentation layouts pictures. All icons in this slide are 100 percent editable. You can replace icons in your deck with any of these icons. Download now and impress your audience.

Thanks You New Product Performance Cost Analysis Ppt PowerPoint Presentation Infographic Template Summary
Presenting this set of slides with name thanks you new product performance cost analysis ppt powerpoint presentation infographic template summary. The topics discussed in these slide is thanks you. This is a completely editable PowerPoint presentation and is available for immediate download. Download now and impress your audience.
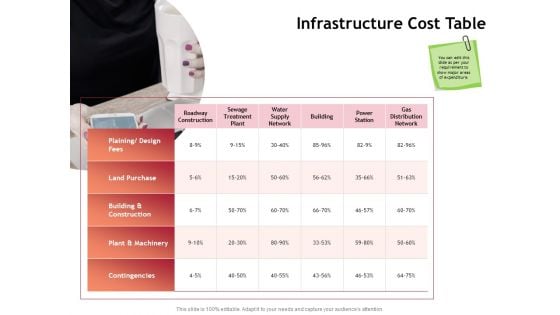
Performance Measuement Of Infrastructure Project Infrastructure Cost Table Ppt Inspiration Vector PDF
Presenting this set of slides with name performance measuement of infrastructure project infrastructure cost table ppt inspiration vector pdf. This is a one stage process. The stages in this process are plaining, land purchase, building and construction, plant and machinery, contingencies. This is a completely editable PowerPoint presentation and is available for immediate download. Download now and impress your audience.
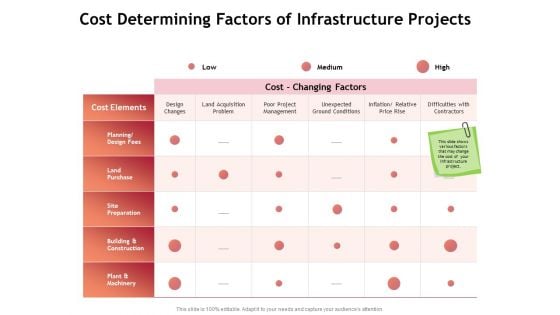
Performance Measuement Of Infrastructure Project Cost Determining Factors Of Infrastructure Projects Diagrams PDF
Presenting this set of slides with name performance measuement of infrastructure project cost determining factors of infrastructure projects diagrams pdf. The topics discussed in these slides are planning, land purchase, site preparation, building and construction, plant and machinery. This is a completely editable PowerPoint presentation and is available for immediate download. Download now and impress your audience.
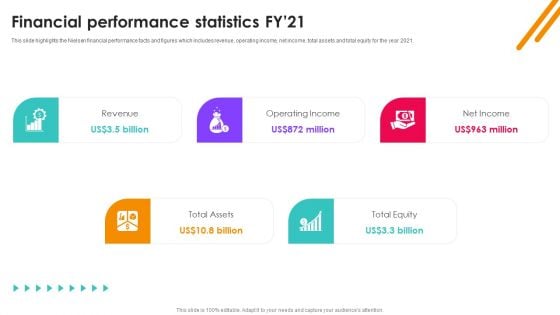
Nielsen Business Profile Financial Performance Statistics Fy21 Ppt PowerPoint Presentation Diagram PDF
This slide highlights the Nielsen financial performance facts and figures which includes revenue, operating income, net income, total assets and total equity for the year 2021. Do you have to make sure that everyone on your team knows about any specific topic I yes, then you should give Nielsen Business Profile Financial Performance Statistics Fy21 Ppt PowerPoint Presentation Diagram PDF a try. Our experts have put a lot of knowledge and effort into creating this impeccable Nielsen Business Profile Financial Performance Statistics Fy21 Ppt PowerPoint Presentation Diagram PDF. You can use this template for your upcoming presentations, as the slides are perfect to represent even the tiniest detail. You can download these templates from the Slidegeeks website and these are easy to edit. So grab these today.
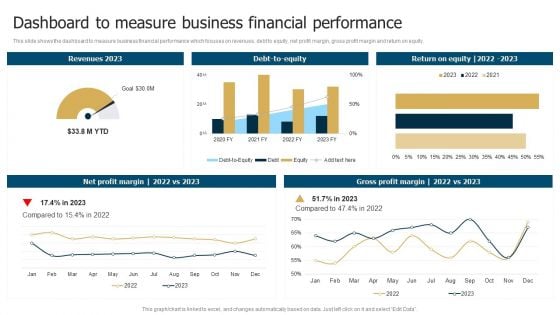
Business Restructuring Process Dashboard To Measure Business Financial Performance Rules PDF
This slide shows the dashboard to measure business financial performance which focuses on revenues, debt to equity, net profit margin, gross profit margin and return on equity. If you are looking for a format to display your unique thoughts, then the professionally designed Business Restructuring Process Dashboard To Measure Business Financial Performance Rules PDF is the one for you. You can use it as a Google Slides template or a PowerPoint template. Incorporate impressive visuals, symbols, images, and other charts. Modify or reorganize the text boxes as you desire. Experiment with shade schemes and font pairings. Alter, share or cooperate with other people on your work. Download Business Restructuring Process Dashboard To Measure Business Financial Performance Rules PDF and find out how to give a successful presentation. Present a perfect display to your team and make your presentation unforgettable.
Naas Architectural Framework Network As A Service Performance Tracking Dashboard Icons PDF
This slide represents the performance tracking dashboard for Naas, covering service availability, inventory details, software compliance status, service level agreement, alert notifications, number of changes and incidents. Here you can discover an assortment of the finest PowerPoint and Google Slides templates. With these templates, you can create presentations for a variety of purposes while simultaneously providing your audience with an eye-catching visual experience. Download Naas Architectural Framework Network As A Service Performance Tracking Dashboard Icons PDF to deliver an impeccable presentation. These templates will make your job of preparing presentations much quicker, yet still, maintain a high level of quality. Slidegeeks has experienced researchers who prepare these templates and write high-quality content for you. Later on, you can personalize the content by editing the Naas Architectural Framework Network As A Service Performance Tracking Dashboard Icons PDF.
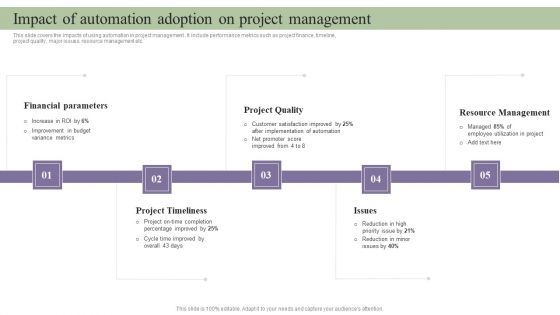
Deployment Of Process Automation To Increase Organisational Performance Impact Of Automation Adoption Infographics PDF
This slide covers the impacts of using automation in project management . It include performance metrics such as project finance, timeline, project quality, major issues, resource management etc. Do you have to make sure that everyone on your team knows about any specific topic I yes, then you should give Deployment Of Process Automation To Increase Organisational Performance Impact Of Automation Adoption Infographics PDF a try. Our experts have put a lot of knowledge and effort into creating this impeccable Deployment Of Process Automation To Increase Organisational Performance Impact Of Automation Adoption Infographics PDF. You can use this template for your upcoming presentations, as the slides are perfect to represent even the tiniest detail. You can download these templates from the Slidegeeks website and these are easy to edit. So grab these today.
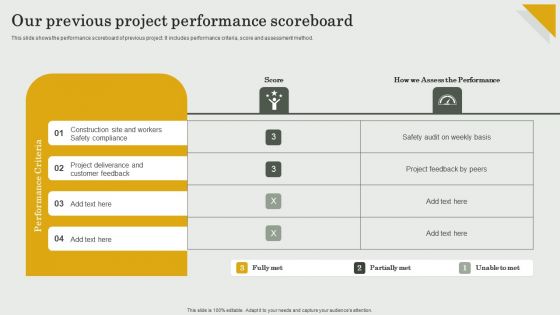
Submission Of Project Viability Report For Bank Loan Our Previous Project Performance Scoreboard Designs PDF
Slidegeeks is here to make your presentations a breeze with Submission Of Project Viability Report For Bank Loan Our Previous Project Performance Scoreboard Designs PDF With our easy-to-use and customizable templates, you can focus on delivering your ideas rather than worrying about formatting. With a variety of designs to choose from, you are sure to find one that suits your needs. And with animations and unique photos, illustrations, and fonts, you can make your presentation pop. So whether you are giving a sales pitch or presenting to the board, make sure to check out Slidegeeks first
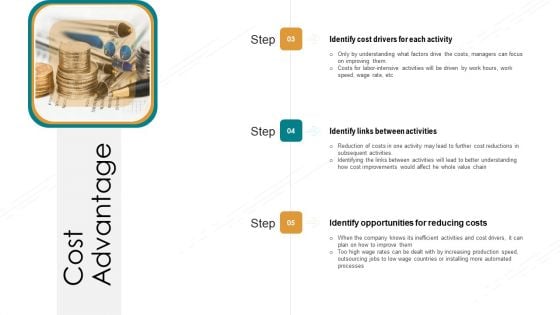
Value Chain Techniques For Performance Assessment Cost Advantage Opportunities Summary PDF
This is a value chain techniques for performance assessment cost advantage opportunities summary pdf. template with various stages. Focus and dispense information on three stages using this creative set, that comes with editable features. It contains large content boxes to add your information on topics like identify cost drivers for each activity, identify links between activities, identify opportunities for reducing costs. You can also showcase facts, figures, and other relevant content using this PPT layout. Grab it now.
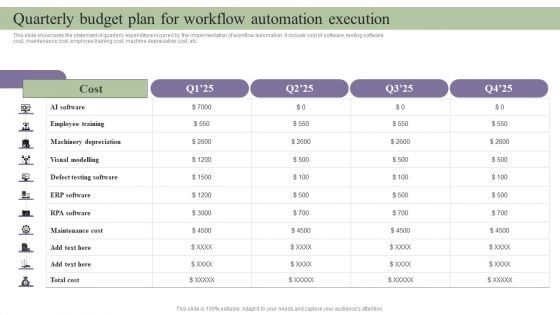
Deployment Of Process Automation To Increase Organisational Performance Quarterly Budget Plan For Workflow Clipart PDF
This slide showcases the statement of quarterly expenditure incurred by the implementation of workflow automation. It include cost of software, testing software cost, maintenance cost, employee training cost, machine depreciation cost ,etc. Explore a selection of the finest Deployment Of Process Automation To Increase Organisational Performance Quarterly Budget Plan For Workflow Clipart PDF here. With a plethora of professionally designed and pre made slide templates, you can quickly and easily find the right one for your upcoming presentation. You can use our Deployment Of Process Automation To Increase Organisational Performance Quarterly Budget Plan For Workflow Clipart PDF to effectively convey your message to a wider audience. Slidegeeks has done a lot of research before preparing these presentation templates. The content can be personalized and the slides are highly editable. Grab templates today from Slidegeeks.
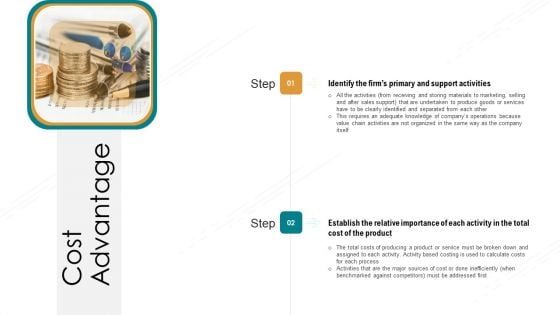
Value Chain Techniques For Performance Assessment Cost Advantage Ppt Slides Inspiration PDF
Presenting value chain techniques for performance assessment cost advantage ppt slides inspiration pdf. to provide visual cues and insights. Share and navigate important information on two stages that need your due attention. This template can be used to pitch topics like identify the firms primary and support activities, establish the relative importance of total cost of the product. In addtion, this PPT design contains high resolution images, graphics, etc, that are easily editable and available for immediate download.
Dashboard To Measure Performance Of E Commerce Retail Business Growth Marketing Techniques Icons PDF
This following slide displays the key metrics that can help an organization to measure effectiveness of e-commerce strategies. These can be revenue generated using e-commerce platform, conversion rates etc. If your project calls for a presentation, then Slidegeeks is your go to partner because we have professionally designed, easy to edit templates that are perfect for any presentation. After downloading, you can easily edit Dashboard To Measure Performance Of E Commerce Retail Business Growth Marketing Techniques Icons PDF and make the changes accordingly. You can rearrange slides or fill them with different images. Check out all the handy templates
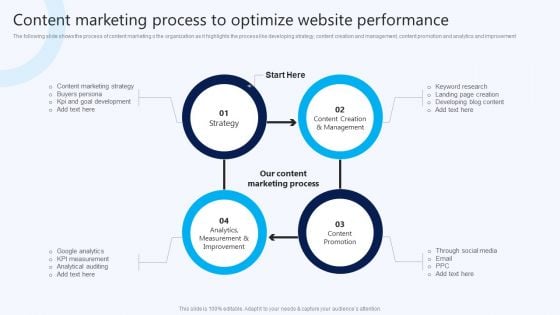
Content Marketing Process To Optimize Website Performance B2B Electronic Commerce Startup Elements PDF
The following slide shows the process of content marketing o the organization as it highlights the process like developing strategy, content creation and management, content promotion and analytics and improvement. If you are looking for a format to display your unique thoughts, then the professionally designed Content Marketing Process To Optimize Website Performance B2B Electronic Commerce Startup Elements PDF is the one for you. You can use it as a Google Slides template or a PowerPoint template. Incorporate impressive visuals, symbols, images, and other charts. Modify or reorganize the text boxes as you desire. Experiment with shade schemes and font pairings. Alter, share or cooperate with other people on your work. Download Content Marketing Process To Optimize Website Performance B2B Electronic Commerce Startup Elements PDF and find out how to give a successful presentation. Present a perfect display to your team and make your presentation unforgettable.
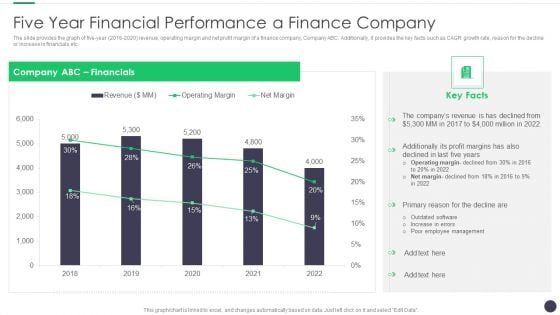
Finance And Accounting Online Conversion Plan Five Year Financial Performance A Finance Company Professional PDF
The slide provides the graph of five-year 2016 to 2020 revenue, operating margin and net profit margin of a finance company, Company ABC. Additionally, it provides the key facts such as CAGR growth rate, reason for the decline or increase in financials etc. Deliver and pitch your topic in the best possible manner with this Finance And Accounting Online Conversion Plan Five Year Financial Performance A Finance Company Professional PDF. Use them to share invaluable insights on Company, Financials, Revenue and impress your audience. This template can be altered and modified as per your expectations. So, grab it now.
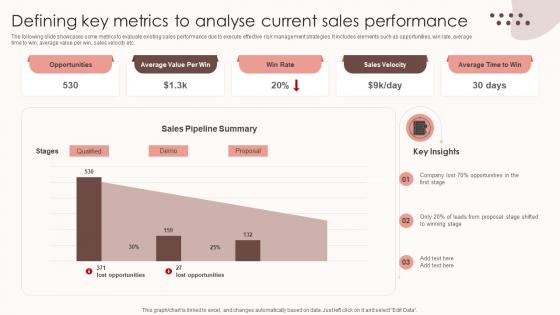
Assessing Sales Risks Defining Key Metrics To Analyse Current Sales Performance Professional PDF
The following slide showcases some metrics to evaluate existing sales performance due to execute effective risk management strategies. It includes elements such as opportunities, win rate, average time to win, average value per win, sales velocity etc. Whether you have daily or monthly meetings, a brilliant presentation is necessary. Assessing Sales Risks Defining Key Metrics To Analyse Current Sales Performance Professional PDF can be your best option for delivering a presentation. Represent everything in detail using Assessing Sales Risks Defining Key Metrics To Analyse Current Sales Performance Professional PDF and make yourself stand out in meetings. The template is versatile and follows a structure that will cater to your requirements. All the templates prepared by Slidegeeks are easy to download and edit. Our research experts have taken care of the corporate themes as well. So, give it a try and see the results. The following slide showcases some metrics to evaluate existing sales performance due to execute effective risk management strategies. It includes elements such as opportunities, win rate, average time to win, average value per win, sales velocity etc.
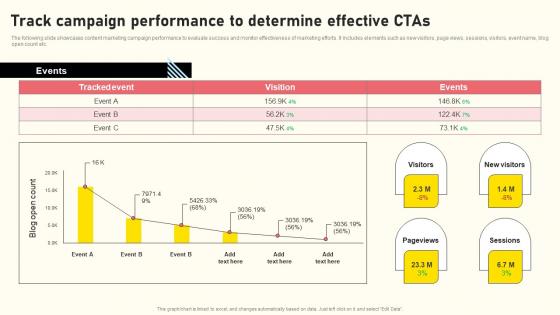
Effective Real Time Marketing Principles Track Campaign Performance To Determine Microsoft Pdf
The following slide showcases content marketing campaign performance to evaluate success and monitor effectiveness of marketing efforts. It includes elements such as new visitors, page views, sessions, visitors, event name, blog open count etc. Do you have an important presentation coming up Are you looking for something that will make your presentation stand out from the rest Look no further than Effective Real Time Marketing Principles Track Campaign Performance To Determine Microsoft Pdf. With our professional designs, you can trust that your presentation will pop and make delivering it a smooth process. And with Slidegeeks, you can trust that your presentation will be unique and memorable. So why wait Grab Effective Real Time Marketing Principles Track Campaign Performance To Determine Microsoft Pdf today and make your presentation stand out from the rest The following slide showcases content marketing campaign performance to evaluate success and monitor effectiveness of marketing efforts. It includes elements such as new visitors, page views, sessions, visitors, event name, blog open count etc.
Facebook Marketing Plan Dashboard For Tracking Facebook Post Performance Strategy SS V
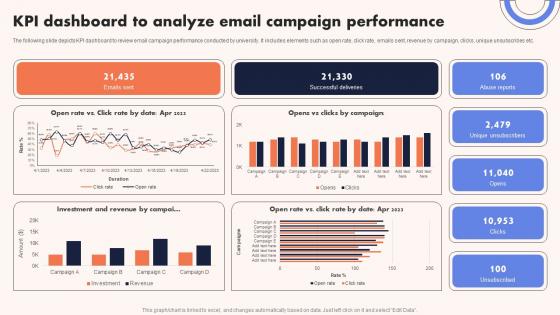
University Marketing Guide KPI Dashboard To Analyze Email Campaign Performance Strategy SS V
The following slide depicts KPI dashboard to review email campaign performance conducted by university. It includes elements such as open rate, click rate, emails sent, revenue by campaign, clicks, unique unsubscribes etc. Are you searching for a University Marketing Guide KPI Dashboard To Analyze Email Campaign Performance Strategy SS V that is uncluttered, straightforward, and original Its easy to edit, and you can change the colors to suit your personal or business branding. For a presentation that expresses how much effort you have put in, this template is ideal With all of its features, including tables, diagrams, statistics, and lists, its perfect for a business plan presentation. Make your ideas more appealing with these professional slides. Download University Marketing Guide KPI Dashboard To Analyze Email Campaign Performance Strategy SS V from Slidegeeks today. The following slide depicts KPI dashboard to review email campaign performance conducted by university. It includes elements such as open rate, click rate, emails sent, revenue by campaign, clicks, unique unsubscribes etc.
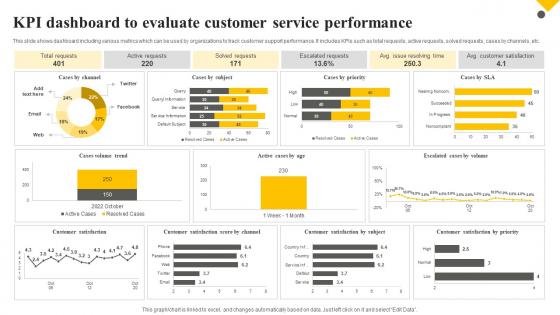
Client Support Plan To Increase Customer Kpi Dashboard To Evaluate Customer Service Performance Strategy SS V
This slide shows dashboard including various metrics which can be used by organizations to track customer support performance. It includes KPIs such as total requests, active requests, solved requests, cases by channels, etc. Find highly impressive Client Support Plan To Increase Customer Kpi Dashboard To Evaluate Customer Service Performance Strategy SS V on Slidegeeks to deliver a meaningful presentation. You can save an ample amount of time using these presentation templates. No need to worry to prepare everything from scratch because Slidegeeks experts have already done a huge research and work for you. You need to download Client Support Plan To Increase Customer Kpi Dashboard To Evaluate Customer Service Performance Strategy SS V for your upcoming presentation. All the presentation templates are 100 percent editable and you can change the color and personalize the content accordingly. Download now This slide shows dashboard including various metrics which can be used by organizations to track customer support performance. It includes KPIs such as total requests, active requests, solved requests, cases by channels, etc.
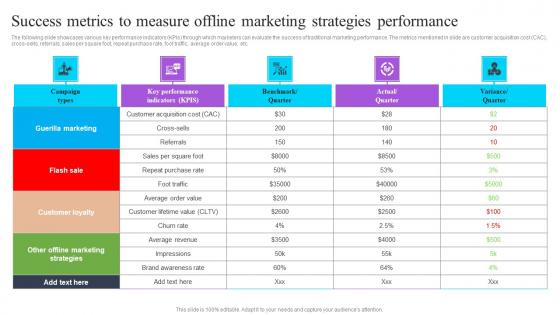
Success Metrics To Measure Offline Marketing Strategies Performance Effective GTM Techniques Brochure PDF
The following slide showcases various key performance indicators KPIs through which marketers can evaluate the success of traditional marketing performance. The metrics mentioned in slide are customer acquisition cost CAC, cross-sells, referrals, sales per square foot, repeat purchase rate, foot traffic, average order value, etc. Slidegeeks is here to make your presentations a breeze with Success Metrics To Measure Offline Marketing Strategies Performance Effective GTM Techniques Brochure PDF With our easy-to-use and customizable templates, you can focus on delivering your ideas rather than worrying about formatting. With a variety of designs to choose from, you are sure to find one that suits your needs. And with animations and unique photos, illustrations, and fonts, you can make your presentation pop. So whether you are giving a sales pitch or presenting to the board, make sure to check out Slidegeeks first The following slide showcases various key performance indicators KPIs through which marketers can evaluate the success of traditional marketing performance. The metrics mentioned in slide are customer acquisition cost CAC cross-sells, referrals, sales per square foot, repeat purchase rate, foot traffic, average order value, etc.
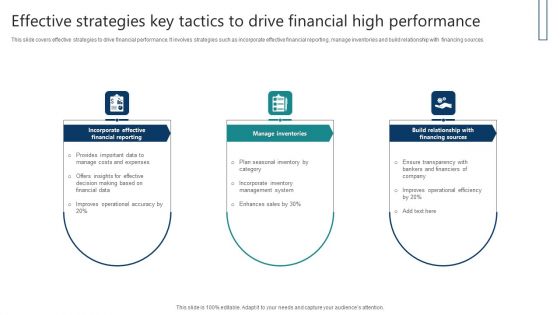
Effective Strategies Key Tactics To Drive Financial High Performance Clipart PDF
This slide covers effective strategies to drive financial performance. It involves strategies such as incorporate effective financial reporting, manage inventories and build relationship with financing sources. Persuade your audience using this Effective Strategies Key Tactics To Drive Financial High Performance Clipart PDF. This PPT design covers three stages, thus making it a great tool to use. It also caters to a variety of topics including Incorporate Effective, Financial Reporting, Manage Inventories, Build Relationship , Financing Sources. Download this PPT design now to present a convincing pitch that not only emphasizes the topic but also showcases your presentation skills.
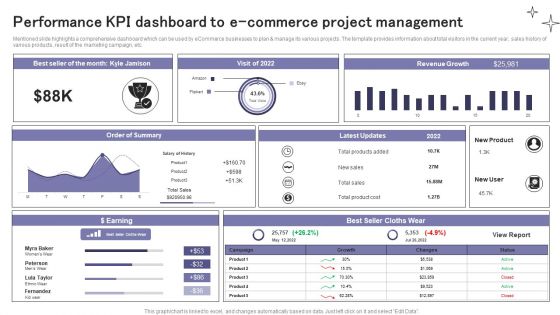
Performance KPI Dashboard To E Commerce Project Management Ppt Summary Inspiration PDF
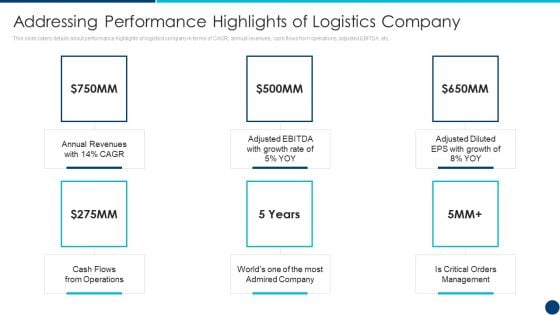
Freight Forwarding Agency Addressing Performance Highlights Of Logistics Company Ppt Styles Slides PDF
This slide caters details about performance highlights of logistics company in terms of CAGR, annual revenues, cash flows from operations, adjusted EBITDA, etc. This is a freight forwarding agency addressing performance highlights of logistics company ppt styles slides pdf template with various stages. Focus and dispense information on six stages using this creative set, that comes with editable features. It contains large content boxes to add your information on topics like annual revenues, growth rate, cash flows, operations, critical orders management. You can also showcase facts, figures, and other relevant content using this PPT layout. Grab it now.
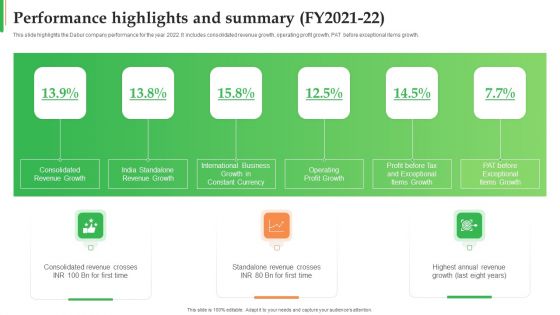
Dabur Business Profile Performance Highlights And Summary FY2021 To 22 Portrait PDF
This slide highlights the Dabur company performance for the year 2022. It includes consolidated revenue growth, operating profit growth, PAT before exceptional items growth. This is a Dabur Business Profile Performance Highlights And Summary FY2021 To 22 Portrait PDF template with various stages. Focus and dispense information on three stages using this creative set, that comes with editable features. It contains large content boxes to add your information on topics like Consolidated, Revenue Growth, India Standalone. You can also showcase facts, figures, and other relevant content using this PPT layout. Grab it now.

Multiple Point Of Sale System Dashboard Depicting Restaurants Daily Performance Mockup PDF
This Slide represents point of sale system dashboard depicting restaurants daily performance which can be beneficial for eateries to manage their regular sales. It includes information about sales, expenditure, menu, customer data, bookings and reports. Persuade your audience using this Multiple Point Of Sale System Dashboard Depicting Restaurants Daily Performance Mockup PDF. This PPT design covers four stages, thus making it a great tool to use. It also caters to a variety of topics including Expenditure, Sales, Customer Data. Download this PPT design now to present a convincing pitch that not only emphasizes the topic but also showcases your presentation skills.
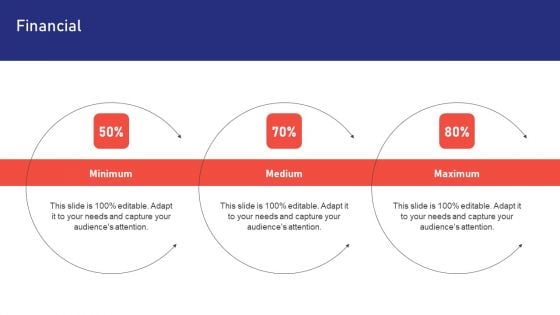
Sales Risk Assessment Profit Maximization Team Performance Enhancement Financial Topics PDF
Formulating a presentation can take up a lot of effort and time, so the content and message should always be the primary focus. The visuals of the PowerPoint can enhance the presenters message, so our Sales Risk Assessment Profit Maximization Team Performance Enhancement Financial Topics PDF was created to help save time. Instead of worrying about the design, the presenter can concentrate on the message while our designers work on creating the ideal templates for whatever situation is needed. Slidegeeks has experts for everything from amazing designs to valuable content, we have put everything into Sales Risk Assessment Profit Maximization Team Performance Enhancement Financial Topics PDF.
Marketing Qualified Leads MQL Performance Measurement Dashboard Ppt Icon Examples PDF
This slide shows dashboard for tracking performance of generated marketing qualified leads. It shows details related to audience, prospects and also shows details related to financial KPIs. Persuade your audience using this Marketing Qualified Leads MQL Performance Measurement Dashboard Ppt Icon Examples PDF. This PPT design covers one stages, thus making it a great tool to use. It also caters to a variety of topics including Audience, Closing Percentage, Per Lead Category, Financial KPIs. Download this PPT design now to present a convincing pitch that not only emphasizes the topic but also showcases your presentation skills.
Nestle Performance Management Report Our Target Ppt Infographics Example Topics PDF
If you are looking for a format to display your unique thoughts, then the professionally designed Nestle Performance Management Report Our Target Ppt Infographics Example Topics PDF is the one for you. You can use it as a Google Slides template or a PowerPoint template. Incorporate impressive visuals, symbols, images, and other charts. Modify or reorganize the text boxes as you desire. Experiment with shade schemes and font pairings. Alter, share or cooperate with other people on your work. Download Nestle Performance Management Report Our Target Ppt Infographics Example Topics PDF and find out how to give a successful presentation. Present a perfect display to your team and make your presentation unforgettable.
Effective Benefits Of Business Performance Coaching Ppt Icon Graphic Images PDF
This slide shows effective benefits of business performance coaching which contains productivity, value for money, convenient and increment in strength. It can benefit businessmen in realizing their value for money to get personal and organizational objectives. Presenting Effective Benefits Of Business Performance Coaching Ppt Icon Graphic Images PDF to dispense important information. This template comprises four stages. It also presents valuable insights into the topics including Productivity, Increment Strength, Value For Money, Convenient. This is a completely customizable PowerPoint theme that can be put to use immediately. So, download it and address the topic impactfully.
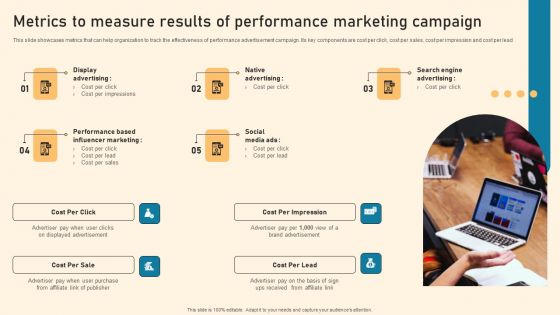
Metrics To Measure Results Of Performance Marketing Campaign Ppt PowerPoint Presentation File Portfolio PDF
This slide showcases metrics that can help organization to track the effectiveness of performance advertisement campaign. Its key components are cost per click, cost per sales, cost per impression and cost per lead Create an editable Metrics To Measure Results Of Performance Marketing Campaign Ppt PowerPoint Presentation File Portfolio PDF that communicates your idea and engages your audience. Whether youre presenting a business or an educational presentation, pre designed presentation templates help save time. Metrics To Measure Results Of Performance Marketing Campaign Ppt PowerPoint Presentation File Portfolio PDF is highly customizable and very easy to edit, covering many different styles from creative to business presentations. Slidegeeks has creative team members who have crafted amazing templates. So, go and get them without any delay.
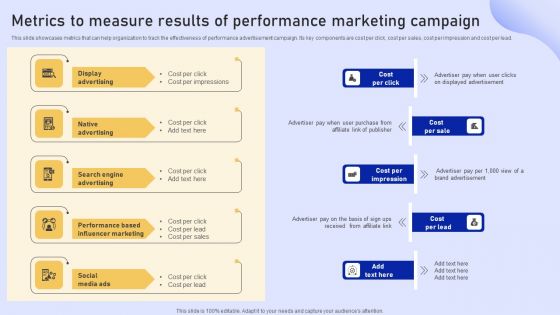
Online Marketing Strategy For Lead Generation Metrics To Measure Results Of Performance Marketing Campaign Elements PDF

How To Measure CPA Marketing Tactics To Optimize Corporate Performance Rules Pdf
Mentioned slide showcase the estimation of CPA marketing campaign performance. It provides total advertising cost, average cost per action calculation explained with help of an example. If your project calls for a presentation, then Slidegeeks is your go to partner because we have professionally designed, easy to edit templates that are perfect for any presentation. After downloading, you can easily edit How To Measure CPA Marketing Tactics To Optimize Corporate Performance Rules Pdf and make the changes accordingly. You can rearrange slides or fill them with different images. Check out all the handy templates Mentioned slide showcase the estimation of CPA marketing campaign performance. It provides total advertising cost, average cost per action calculation explained with help of an example.
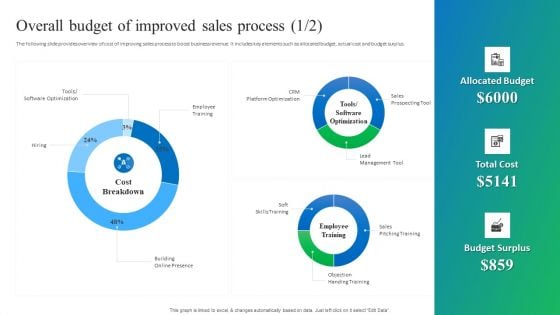
Process Enhancement Plan To Boost Sales Performance Overall Budget Of Improved Sales Process Inspiration PDF
The following slide provides overview of cost of improving sales process to boost business revenue. It includes key elements such as allocated budget, actual cost and budget surplus. Want to ace your presentation in front of a live audience Our Process Enhancement Plan To Boost Sales Performance Overall Budget Of Improved Sales Process Inspiration PDF can help you do that by engaging all the users towards you. Slidegeeks experts have put their efforts and expertise into creating these impeccable powerpoint presentations so that you can communicate your ideas clearly. Moreover, all the templates are customizable, and easy to edit and downloadable. Use these for both personal and commercial use.
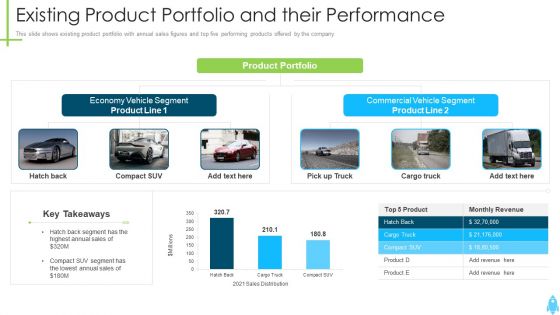
Product Kick Off Strategy Existing Product Portfolio And Their Performance Summary PDF
This slide shows existing product portfolio with annual sales figures and top five performing products offered by the company. Deliver an awe inspiring pitch with this creative product kick off strategy existing product portfolio and their performance summary pdf bundle. Topics like product portfolio, commercial vehicle segment, economy vehicle segment can be discussed with this completely editable template. It is available for immediate download depending on the needs and requirements of the user.
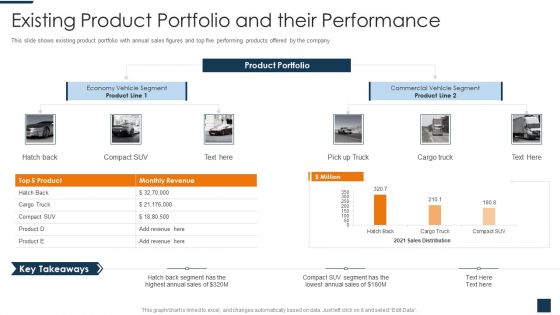
Go To Market Strategy For New Product Existing Product Portfolio And Their Performance Demonstration PDF
This slide shows existing product portfolio with annual sales figures and top five performing products offered by the company. Deliver an awe inspiring pitch with this creative go to market strategy for new product existing product portfolio and their performance demonstration pdf bundle. Topics like economy vehicle segment, commercial vehicle segment can be discussed with this completely editable template. It is available for immediate download depending on the needs and requirements of the user.
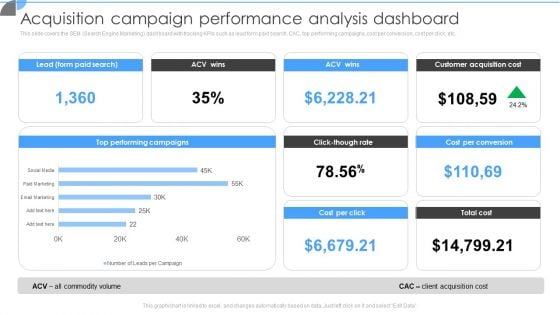
Customer Acquisition Approaches To Enhance Organization Growth Acquisition Campaign Performance Analysis Dashboard Information PDF
This slide covers the SEM Search Engine Marketing dashboard with tracking KPIs such as lead form paid search, CAC, top performing campaigns, cost per conversion, cost per click, etc. If you are looking for a format to display your unique thoughts, then the professionally designed Customer Acquisition Approaches To Enhance Organization Growth Acquisition Campaign Performance Analysis Dashboard Information PDF is the one for you. You can use it as a Google Slides template or a PowerPoint template. Incorporate impressive visuals, symbols, images, and other charts. Modify or reorganize the text boxes as you desire. Experiment with shade schemes and font pairings. Alter, share or cooperate with other people on your work. Download Customer Acquisition Approaches To Enhance Organization Growth Acquisition Campaign Performance Analysis Dashboard Information PDF and find out how to give a successful presentation. Present a perfect display to your team and make your presentation unforgettable.
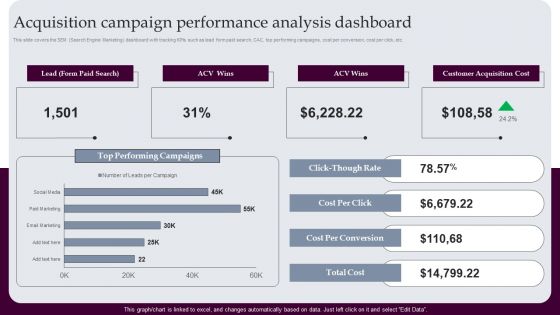
Acquisition Campaign Performance Analysis Dashboard Strategies For Acquiring Consumers Themes PDF
This slide covers the SEM Search Engine Marketing dashboard with tracking KPIs such as lead form paid search, CAC, top performing campaigns, cost per conversion, cost per click, etc. Crafting an eye-catching presentation has never been more straightforward. Let your presentation shine with this tasteful yet straightforward Acquisition Campaign Performance Analysis Dashboard Strategies For Acquiring Consumers Themes PDF template. It offers a minimalistic and classy look that is great for making a statement. The colors have been employed intelligently to add a bit of playfulness while still remaining professional. Construct the ideal Acquisition Campaign Performance Analysis Dashboard Strategies For Acquiring Consumers Themes PDF that effortlessly grabs the attention of your audience Begin now and be certain to wow your customers.
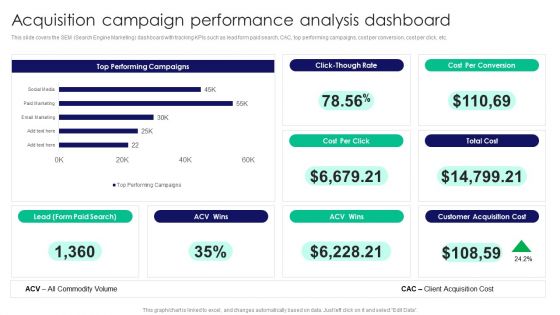
Guide To Business Customer Acquisition Acquisition Campaign Performance Analysis Dashboard Rules PDF
This slide covers the SEM Search Engine Marketing dashboard with tracking KPIs such as lead form paid search, CAC, top performing campaigns, cost per conversion, cost per click, etc. If you are looking for a format to display your unique thoughts, then the professionally designed Guide To Business Customer Acquisition Acquisition Campaign Performance Analysis Dashboard Rules PDF is the one for you. You can use it as a Google Slides template or a PowerPoint template. Incorporate impressive visuals, symbols, images, and other charts. Modify or reorganize the text boxes as you desire. Experiment with shade schemes and font pairings. Alter, share or cooperate with other people on your work. Download Guide To Business Customer Acquisition Acquisition Campaign Performance Analysis Dashboard Rules PDF and find out how to give a successful presentation. Present a perfect display to your team and make your presentation unforgettable.
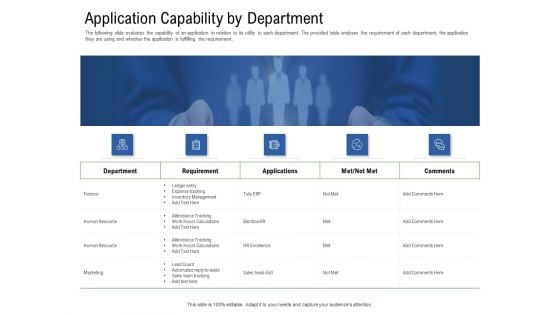
Application Performance Management Application Capability By Department Ppt Pictures Infographic Template PDF
Deliver an awe inspiring pitch with this creative application performance management application capability by department ppt pictures infographic template pdf bundle. Topics like finance, human resource, marketing can be discussed with this completely editable template. It is available for immediate download depending on the needs and requirements of the user.
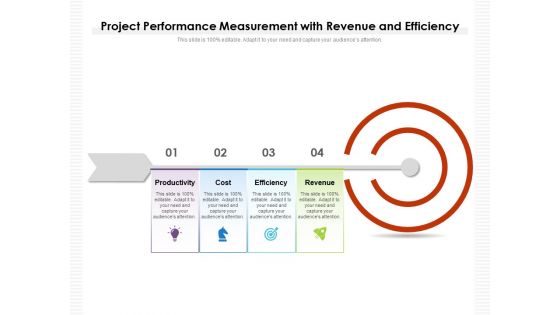
Project Performance Measurement With Revenue And Efficiency Ppt PowerPoint Presentation Infographics Elements PDF
Presenting this set of slides with name project performance measurement with revenue and efficiency ppt powerpoint presentation infographics elements pdf. This is a four stage process. The stages in this process are productivity, cost, efficiency, revenue. This is a completely editable PowerPoint presentation and is available for immediate download. Download now and impress your audience.
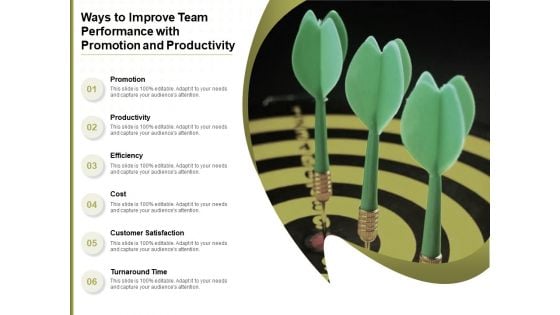
Ways To Improve Team Performance With Promotion And Productivity Ppt PowerPoint Presentation File Objects PDF
Presenting this set of slides with name ways to improve team performance with promotion and productivity ppt powerpoint presentation file objects pdf. This is a six stage process. The stages in this process are promotion, productivity, efficiency, cost, customer satisfaction, turnaround time. This is a completely editable PowerPoint presentation and is available for immediate download. Download now and impress your audience.
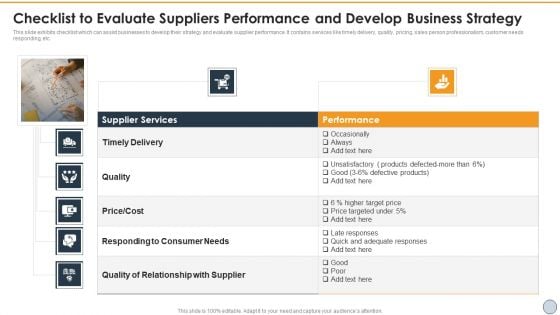
Checklist To Evaluate Suppliers Performance And Develop Business Strategy Portrait PDF
Persuade your audience using this Checklist To Evaluate Suppliers Performance And Develop Business Strategy Portrait PDF. This PPT design covers two stages, thus making it a great tool to use. It also caters to a variety of topics including Quality, Cost, Price. Download this PPT design now to present a convincing pitch that not only emphasizes the topic but also showcases your presentation skills.

Food Company Financial Performance Summary Food Company Balance Sheet With Forecast Introduction PDF
The following slide highlights the balance sheet of the Food company to analyze the financial health of the business at a particular point in time. It includes total shareholders funds, non current liabilities, current liabilities, Fixed assets, and bonus equity share capital. From laying roadmaps to briefing everything in detail, our templates are perfect for you. You can set the stage with your presentation slides. All you have to do is download these easy-to-edit and customizable templates. Food Company Financial Performance Summary Food Company Balance Sheet With Forecast Introduction PDF will help you deliver an outstanding performance that everyone would remember and praise you for. Do download this presentation today.
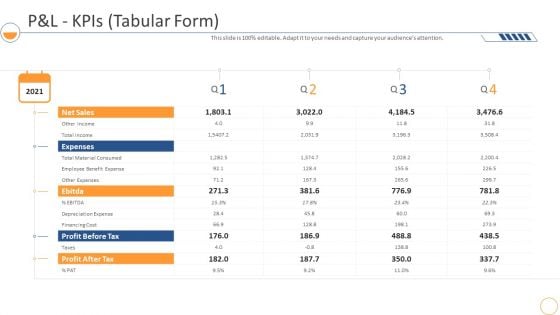
Monthly Company Performance Analysisp And L Kpis Tabular Form Elements PDF
Deliver and pitch your topic in the best possible manner with this monthly company performance analysisp and l kpis tabular form elements pdf. Use them to share invaluable insights on expense, benefit, employee, cost, financing and impress your audience. This template can be altered and modified as per your expectations. So, grab it now.
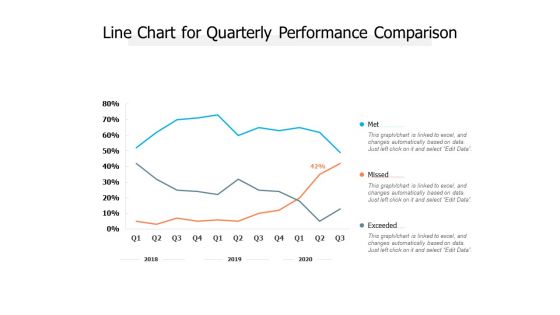
Line Chart For Quarterly Performance Comparison Ppt PowerPoint Presentation Layouts Slide Download
Presenting this set of slides with name line chart for quarterly performance comparison ppt powerpoint presentation layouts slide download. The topics discussed in these slides are met, missed, exceeded. This is a completely editable PowerPoint presentation and is available for immediate download. Download now and impress your audience.
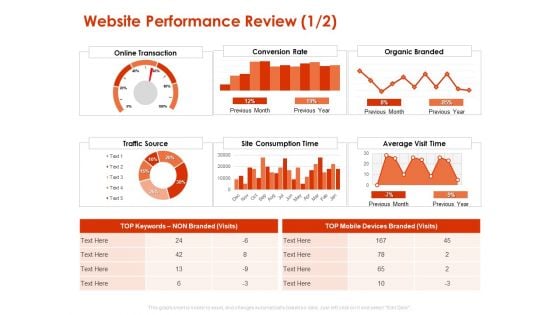
Implementing Agile Marketing In Your Organization Website Performance Review Consumption Ppt Infographics Summary PDF
Presenting this set of slides with name implementing agile marketing in your organization website performance review consumption ppt infographics summary pdf. The topics discussed in these slides are organic branded, average visit time, site consumption time, traffic source, conversion rate. This is a completely editable PowerPoint presentation and is available for immediate download. Download now and impress your audience.
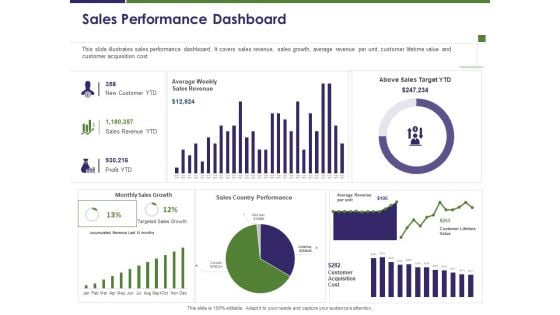
Business Intelligence Report Sales Performance Dashboard Ppt Infographic Template Examples PDF
Presenting this set of slides with name business intelligence report sales performance dashboard ppt infographic template examples pdf. The topics discussed in these slides are new customer, sales revenue, profit, sales target, targeted sales growth. This is a completely editable PowerPoint presentation and is available for immediate download. Download now and impress your audience.
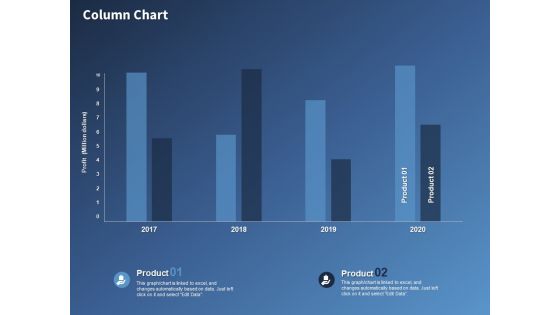
Performance Assessment And Sales Initiative Report Column Chart Ppt Styles Diagrams PDF
Presenting this set of slides with name performance assessment and sales initiative report column chart ppt styles diagrams pdf. The topics discussed in these slide is column chart. This is a completely editable PowerPoint presentation and is available for immediate download. Download now and impress your audience.
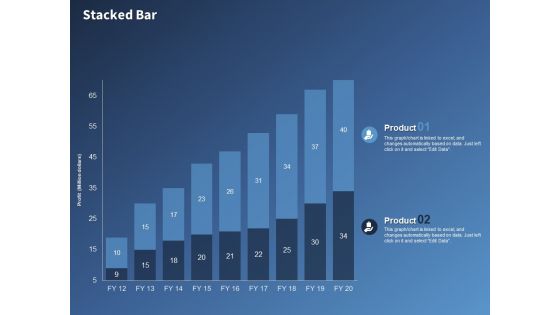
Performance Assessment Sales Initiative Report Stacked Bar Ppt Model Display PDF
Presenting this set of slides with name performance assessment sales initiative report stacked bar ppt model display pdf. The topics discussed in these slide is stacked bar. This is a completely editable PowerPoint presentation and is available for immediate download. Download now and impress your audience.


 Continue with Email

 Home
Home


