It Project Discovery Phase
Incident Management Chart Change Execution Plan Ppt PowerPoint Presentation Icon Diagrams PDF
This slide illustrates the incidents of the transition project. It covers the details such as explanation, status, priority, and resolution of the incident to ensure that technological change is successfully completed in the organization. Deliver and pitch your topic in the best possible manner with this Incident Management Chart Change Execution Plan Ppt PowerPoint Presentation Icon Diagrams PDF. Use them to share invaluable insights on Incident Status Priority, Cyber Attack Sensitive, Added Data Security and impress your audience. This template can be altered and modified as per your expectations. So, grab it now.
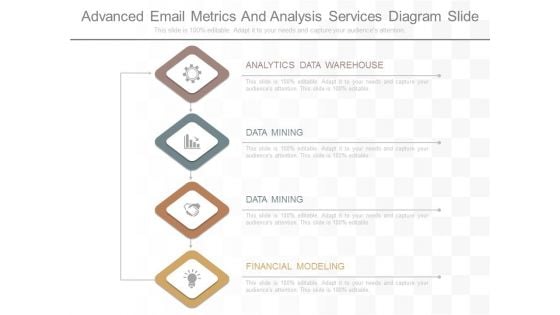
Advanced Email Metrics And Analysis Services Diagram Slide
This is a advanced email metrics and analysis services diagram slide. This is a four stage process. The stages in this process are analytics data warehouse, data mining, financial modeling.
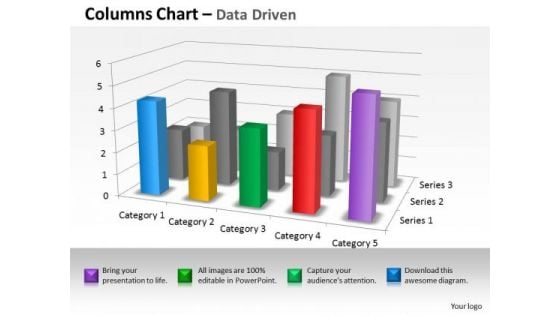
Quantitative Data Analysis 3d Interpretation Of Statistical Quality Control PowerPoint Templates
Land The Idea With Our quantitative data analysis 3d interpretation of statistical quality control Powerpoint Templates . Help It Grow With Your Thoughts.
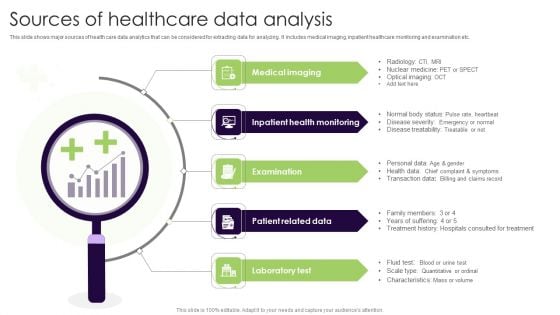
Sources Of Healthcare Data Analysis Rules PDF
This slide shows major sources of health care data analytics that can be considered for extracting data for analyzing. It includes medical imaging, inpatient healthcare monitoring and examination etc. Presenting Sources Of Healthcare Data Analysis Rules PDF to dispense important information. This template comprises five stages. It also presents valuable insights into the topics including Inpatient Health Monitoring, Examination, Patient Related Data. This is a completely customizable PowerPoint theme that can be put to use immediately. So, download it and address the topic impactfully.
Data Mining In Patient Care For Better Customer Relationship Icon Portrait Pdf
Pitch your topic with ease and precision using this Data Mining In Patient Care For Better Customer Relationship Icon Portrait Pdf. This layout presents information on Data Mining Patient Care, Better Customer, Relationship Icon. It is also available for immediate download and adjustment. So, changes can be made in the color, design, graphics or any other component to create a unique layout. Our Data Mining In Patient Care For Better Customer Relationship Icon Portrait Pdf are topically designed to provide an attractive backdrop to any subject. Use them to look like a presentation pro.
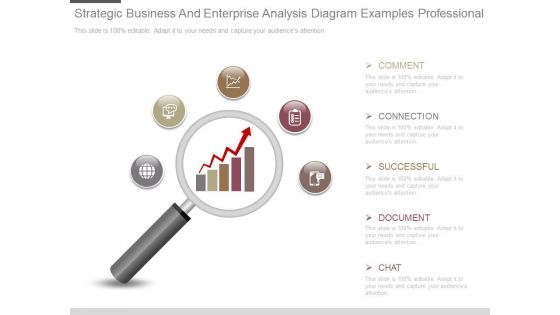
Strategic Business And Enterprise Analysis Diagram Examples Professional
This is a strategic business and enterprise analysis diagram examples professional. This is a five stage process. The stages in this process are comment, connection, successful, document, chat.\n\n\n\n\n\n\n\n
Data Lake Architecture Future Of Data Analysis Architecture Layers Of Centralized Icons PDF
This slide describes the architecture layers of the data lake such as ingestion, distillation, processing, insights and unified operations layer and how they work.Deliver an awe inspiring pitch with this creative Data Lake Architecture Future Of Data Analysis Architecture Layers Of Centralized Icons PDF bundle. Topics like Complex Analytical, Interprets And Transforms, Processing can be discussed with this completely editable template. It is available for immediate download depending on the needs and requirements of the user.
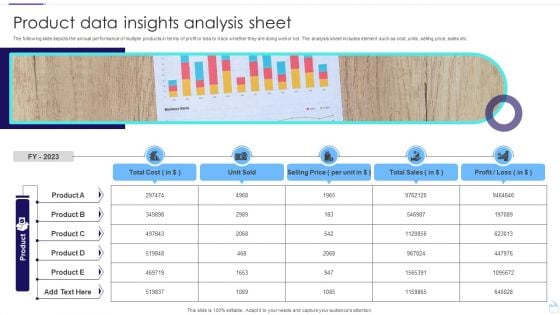
Product Data Insights Analysis Sheet Infographics PDF
The following slide depicts the annual performance of multiple products in terms of profit or loss to track whether they are doing well or not. The analysis sheet includes element such as cost, units, selling price, sales etc. Pitch your topic with ease and precision using this Product Data Insights Analysis Sheet Infographics PDF. This layout presents information on Unit Sold, Selling Price, Total Sales. It is also available for immediate download and adjustment. So, changes can be made in the color, design, graphics or any other component to create a unique layout.
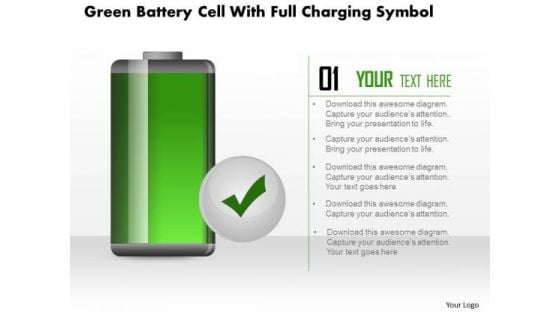
Business Diagram Green Battery Cell With Full Charging Symbol PowerPoint Slide
This business diagram displays full battery charge icon. Use this diagram, in your presentations to display energy saving, battery and technology. Create professional presentations using this diagram slide.
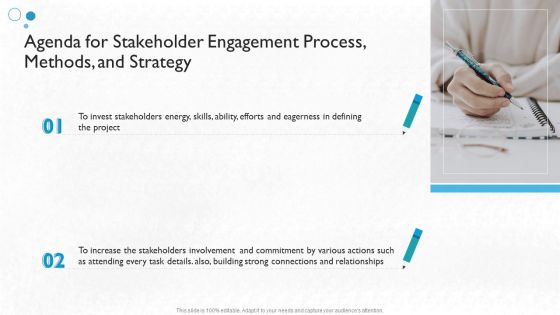
Agenda For Stakeholder Engagement Process Methods And Strategy Themes PDF
This is a agenda for stakeholder engagement process methods and strategy themes pdf template with various stages. Focus and dispense information on two stages using this creative set, that comes with editable features. It contains large content boxes to add your information on topics like stakeholders energy, skills, ability, efforts, project. You can also showcase facts, figures, and other relevant content using this PPT layout. Grab it now.
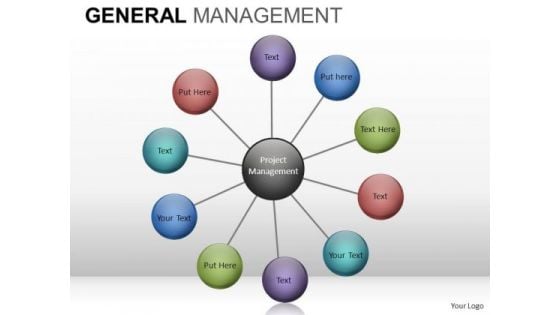
Wheel Chart Diagram PowerPoint Slides And Editable Ppt Templates Download
Wheel_Chart_Diagram_PowerPoint_slides_and_Editable_PPT_templates_Download-These high quality powerpoint pre-designed slides and powerpoint templates have been carefully created by our professional team to help you impress your audience. All slides have been created and are 100% editable in powerpoint. Each and every property of any graphic - color, size, orientation, shading, outline etc. can be modified to help you build an effective powerpoint presentation. Any text can be entered at any point in the powerpoint template or slide. Simply DOWNLOAD, TYPE and PRESENT! These PowerPoint presentation slides can be used to represent themes relating to --Abstract, action, analysis, blank, business, chart, clipart, commerce, concept, conceptual, design, diagram, direction, flow, generic, goals, guide, guidelines, heirarchy, icon, idea, illustration, lingakes, links, manage, management, mba, model, organization, performance, plan, process, project, relationship, representation, resource, steps, strategy, success, tactics, theoretical, theory, tool, workflow-Wheel_Chart_Diagram_PowerPoint_slides_and_Editable_PPT_templates_Download Take on the banter with our Wheel Chart Diagram PowerPoint Slides And Editable Ppt Templates Download. They give you the advantage in any argument.
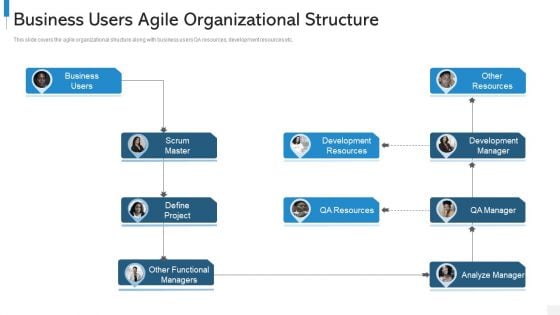
Agile Org Chart It Business Users Agile Organizational Structure Summary PDF
This slide covers the agile organizational structure along with business users QA resources, development resources etc.Presenting agile org chart it business users agile organizational structure summary pdf to provide visual cues and insights. Share and navigate important information on two stages that need your due attention. This template can be used to pitch topics like define project, development resources, development manager. In addtion, this PPT design contains high resolution images, graphics, etc, that are easily editable and available for immediate download.
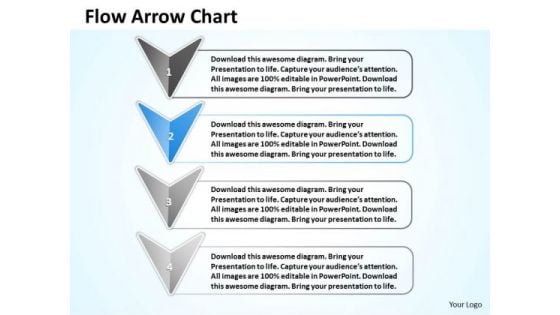
Ppt Stage 2 Continuous Demo Create Flow Chart PowerPoint Arrow Diagram Templates
PPT stage 2 continuous demo create flow chart powerpoint arrow diagram Templates-Use This Linearly Demonstrated PowerPoint Diagram having four steps displaying using arrow pointing towards south direction. It signifies the completion of the procedure and attaining success.-PPT stage 2 continuous demo create flow chart powerpoint arrow diagram Templates-3d, analyze, arrow, assess, background, bullet, business, chart, checkmark, chevron, diagram, drop, eps10, financial, glass, graphic, gray, icon, illustration, improvement, management, point, process, project, reflection, set, shadow, silver, stage, text, transparency, vector Give your team the family feel. Build alliances with our Ppt Stage 2 Continuous Demo Create Flow Chart PowerPoint Arrow Diagram Templates.
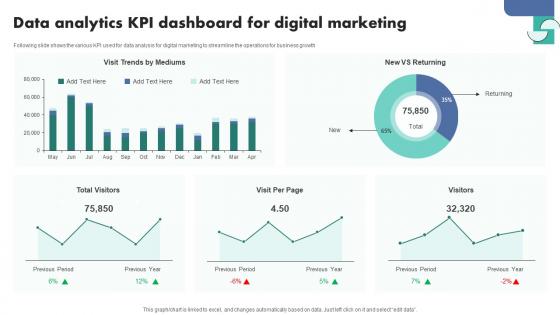
Data Analytics Kpi Dashboard For Digital Marketing Inspiration Pdf
Following slide shows the various KPI used for data analysis for digital marketing to streamline the operations for business growth.Showcasing this set of slides titled Data Analytics Kpi Dashboard For Digital Marketing Inspiration Pdf The topics addressed in these templates are Data Analytics KPI, Dashboard Digital Marketing All the content presented in this PPT design is completely editable. Download it and make adjustments in color, background, font etc. as per your unique business setting. Following slide shows the various KPI used for data analysis for digital marketing to streamline the operations for business growth.
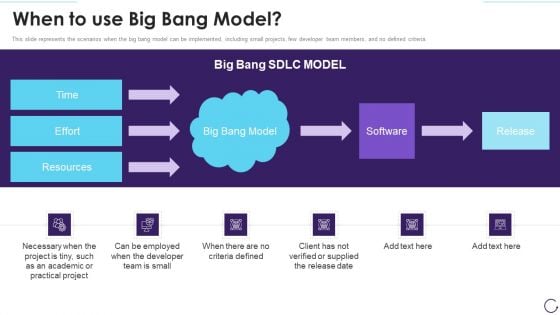
Application Development Life Cycle When To Use Big Bang Model Diagrams PDF
This slide represents the scenarios when the big bang model can be implemented, including small projects, few developer team members, and no defined criteria. Deliver an awe inspiring pitch with this creative application development life cycle when to use big bang model diagrams pdf bundle. Topics like when to use big bang model can be discussed with this completely editable template. It is available for immediate download depending on the needs and requirements of the user.
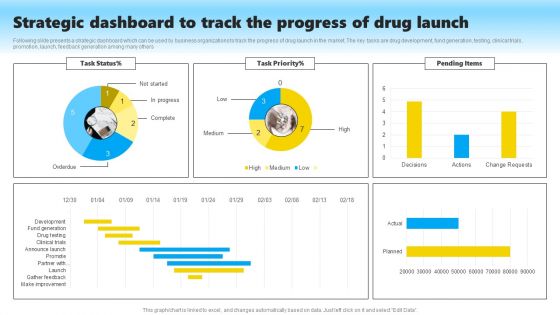
Strategic Dashboard To Track The Progress Of Drug Launch Structure PDF
Following slide presents a strategic dashboard which can be used by business organizations to track the progress of drug launch in the market. The key tasks are drug development, fund generation, testing, clinical trials, promotion, launch, feedback generation among many others. Pitch your topic with ease and precision using this Strategic Dashboard To Track The Progress Of Drug Launch Structure PDF. This layout presents information on Drug Development, Fund Generation, Testing, Clinical Trials, Promotion, Launch, Feedback Generation. It is also available for immediate download and adjustment. So, changes can be made in the color, design, graphics or any other component to create a unique layout.
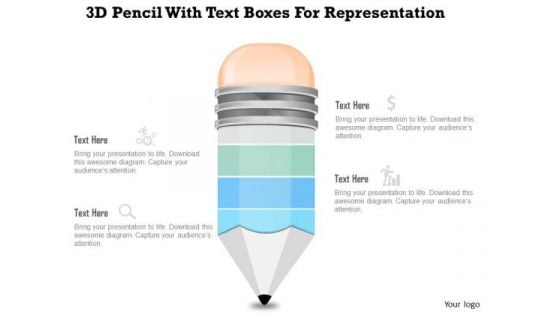
Business Diagram 3d Pencil With Text Boxes For Representation PowerPoint Slide
This Power Point diagram displays graphic of pencil with icons and text spaces. It contains diagram of colorful pencil for data display. Use this diagram to build professional presentations for your viewers.
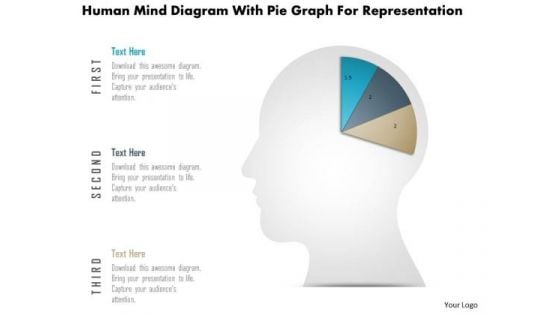
Business Diagram Human Mind Diagram With Pie Graph For Representation PowerPoint Slide
This diagram displays human face graphic divided into sections. This section can be used for data display. Use this diagram to build professional presentations for your viewers.
Business Success PowerPoint Templates Business 3d Jigsaw Circular Pie Chart Ppt Slides
Business Success PowerPoint Templates Business 3d jigsaw circular pie chart PPT Slides-This Circular pie chart is a compelling presentation tool. By piecing together the parts or your project, organization or product in PowerPoint, you help make a critical point to your audience-Business Success PowerPoint Templates 3d jigsaw circular pie chart PPT Slides-This ppt can be used for concepts relating to-Chart, Communication, Concept, Decision, Diagram, Management, Organization, Company Business, Chart, Illustration Etc Our Business Success PowerPoint Templates Business 3d Jigsaw Circular Pie Chart Ppt Slides are never erratic. They are always balanced and steady.

Dynamic System Development Method Tools And Techniques IT Ineffective Communication Guidelines PDF
This slide depicts ineffective communication faced by the company which is causing failures in the development of projects. Deliver and pitch your topic in the best possible manner with this dynamic system development method tools and techniques it ineffective communication guidelines pdf. Use them to share invaluable insights on ineffective communication faced by the company and impress your audience. This template can be altered and modified as per your expectations. So, grab it now.
Social Platforms Data Analysis Influencer Marketing Data Icon Mockup PDF
Persuade your audience using this Social Platforms Data Analysis Influencer Marketing Data Icon Mockup PDF. This PPT design covers three stages, thus making it a great tool to use. It also caters to a variety of topics including Social Platforms Data Analysis, Influencer Marketing Data Icon. Download this PPT design now to present a convincing pitch that not only emphasizes the topic but also showcases your presentation skills.
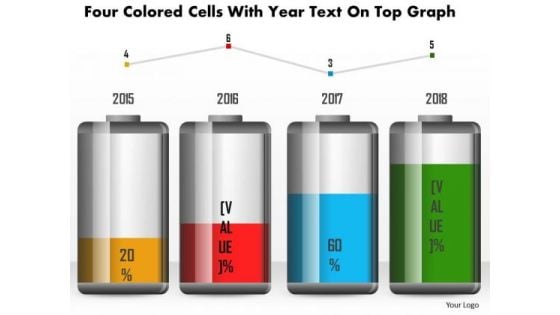
Business Diagram Four Colored Cells With Year Text On Top Graph PowerPoint Slide
This business diagram has been designed with battery cell graphic for business timeline. This slide can be used for business planning and management. Use this diagram for your business and success milestones related presentations.
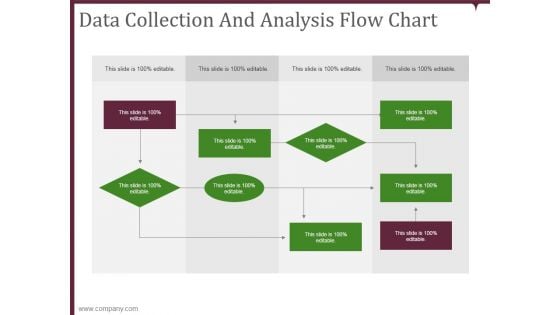
data collection and analysis flow chart ppt powerpoint presentation microsoft
This is a data collection and analysis flow chart ppt powerpoint presentation microsoft. This is a nine stage process. The stages in this process are business, planning, marketing, strategy, management.
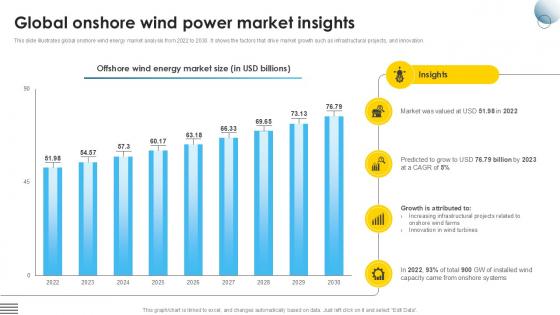
Global Onshore Wind Power Market Global Wind Power Market PPT Slide IR SS V
This slide illustrates global onshore wind energy market analysis from 2022 to 2030. It shows the factors that drive market growth such as infrastructural projects, and innovation. Do you have an important presentation coming up Are you looking for something that will make your presentation stand out from the rest Look no further than Global Onshore Wind Power Market Global Wind Power Market PPT Slide IR SS V. With our professional designs, you can trust that your presentation will pop and make delivering it a smooth process. And with Slidegeeks, you can trust that your presentation will be unique and memorable. So why wait Grab Global Onshore Wind Power Market Global Wind Power Market PPT Slide IR SS V today and make your presentation stand out from the rest This slide illustrates global onshore wind energy market analysis from 2022 to 2030. It shows the factors that drive market growth such as infrastructural projects, and innovation.
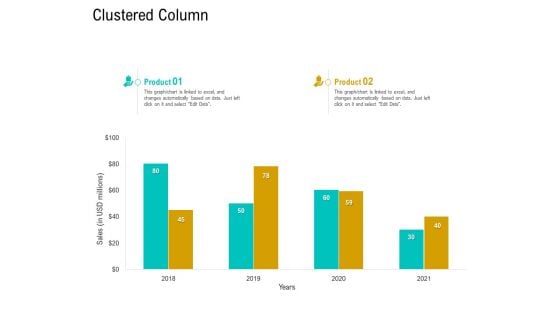
Business Data Analysis Clustered Column Template PDF
Deliver an awe inspiring pitch with this creative business data analysis clustered column template pdf bundle. Topics like clustered column can be discussed with this completely editable template. It is available for immediate download depending on the needs and requirements of the user.
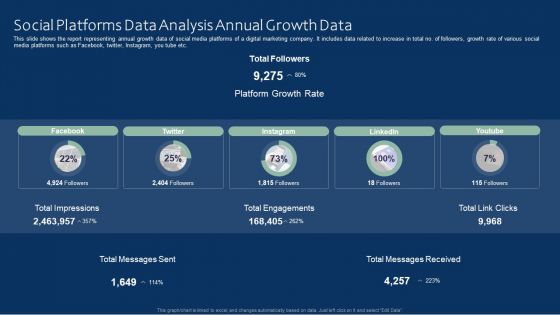
Social Platforms Data Analysis Annual Growth Data Ideas PDF
This slide shows the report representing annual growth data of social media platforms of a digital marketing company. It includes data related to increase in total no. of followers, growth rate of various social media platforms such as Facebook, twitter, Instagram, you tube etc. Pitch your topic with ease and precision using this Social Platforms Data Analysis Annual Growth Data Ideas PDF. This layout presents information on Social Platforms Data Analysis, Annual Growth Data. It is also available for immediate download and adjustment. So, changes can be made in the color, design, graphics or any other component to create a unique layout.

Business Diagram Three Staged Pencil Diagram For Graph Formation PowerPoint Slide
This business diagram displays set of pencils. This Power Point template has been designed to compare and present business data. Download this diagram to represent stages of business growth.
Percentage Variations Showing Performance Analysis Ppt PowerPoint Presentation Icon
This is a percentage variations showing performance analysis ppt powerpoint presentation icon. This is a four stage process. The stages in this process are percentage, analysis, performance, management, strategy.
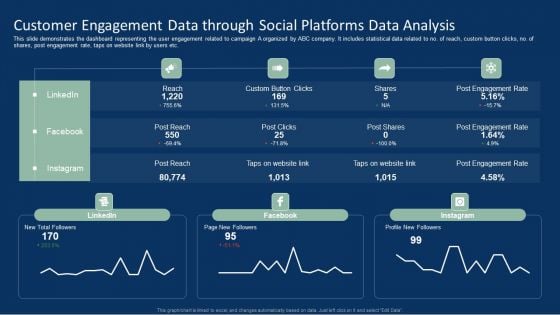
Customer Engagement Data Through Social Platforms Data Analysis Brochure PDF
This slide demonstrates the dashboard representing the user engagement related to campaign A organized by ABC company. It includes statistical data related to no. of reach, custom button clicks, no. of shares, post engagement rate, taps on website link by users etc. Showcasing this set of slides titled Customer Engagement Data Through Social Platforms Data Analysis Brochure PDF. The topics addressed in these templates are Customer Engagement Data, Social Platforms Data Analysis. All the content presented in this PPT design is completely editable. Download it and make adjustments in color, background, font etc. as per your unique business setting.
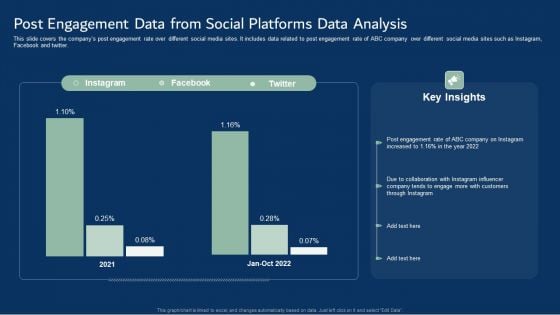
Post Engagement Data From Social Platforms Data Analysis Template PDF
This slide covers the companys post engagement rate over different social media sites. It includes data related to post engagement rate of ABC company over different social media sites such as Instagram, Facebook and twitter. Pitch your topic with ease and precision using this Post Engagement Data From Social Platforms Data Analysis Template PDF. This layout presents information on Post Engagement Data, Social Platforms Data Analysis. It is also available for immediate download and adjustment. So, changes can be made in the color, design, graphics or any other component to create a unique layout.

Business Diagram Three Heads With Pie For Data Driven Technology PowerPoint Slide
This business diagram displays three human faces with pie charts. This Power Point template has been designed to compare and present business data. You may use this diagram to impart professional appearance to your presentations.
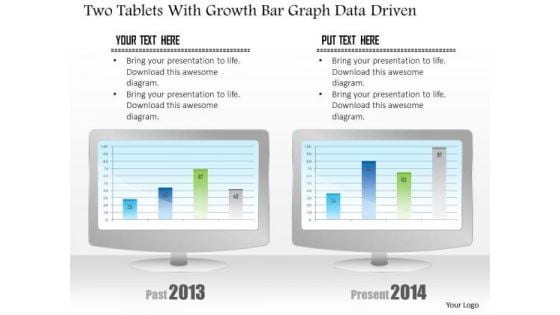
Business Diagram Two Tablets With Growth Bar Graph Data Driven PowerPoint Slide
This business diagram has been designed with comparative charts on tablets. This slide suitable for data representation. You can also use this slide to present business reports and information. Use this diagram to present your views in a wonderful manner.
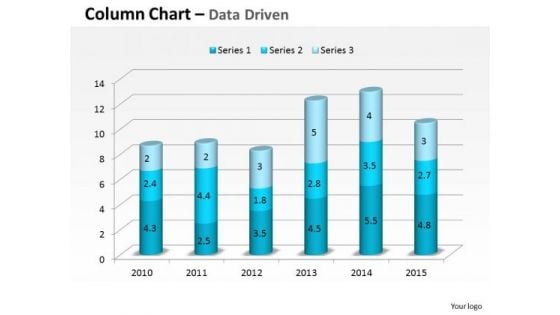
Data Analysis In Excel 3d Compare Yearly Business Performance PowerPoint Templates
Plan For All Contingencies With Our data analysis in excel 3d compare yearly business performance Powerpoint Templates . Douse The Fire Before It Catches.

Data Analysis On Excel Driven Sets Of Business Information PowerPoint Slides Templates
Break The Deadlock With Our data analysis on excel driven sets of business information powerpoint slides Templates . Let The Words Start To Flow.
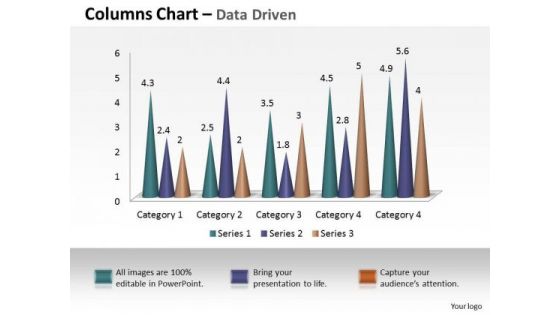
Examples Of Data Analysis Market 3d Business Intelligence And PowerPoint Templates
Our examples of data analysis market 3d business intelligence and Powerpoint Templates Are Dual Purpose. They Help Instruct And Inform At The Same Time.
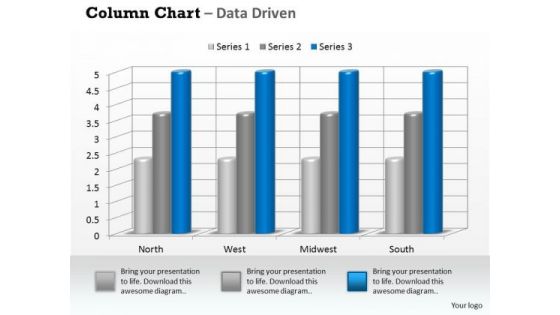
Examples Of Data Analysis Market 3d Business On Regular Intervals PowerPoint Templates
Drum It Out Loud And Clear On Our examples of data analysis market 3d business on regular intervals Powerpoint Templates . Your Words Will Ring In Their Ears.
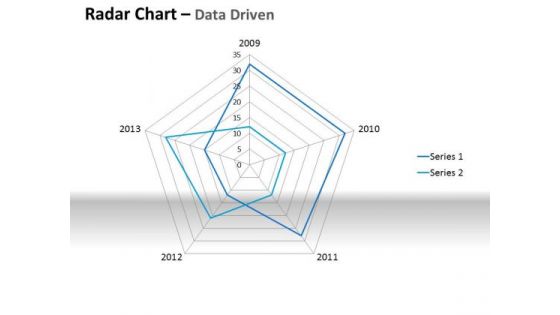
Examples Of Data Analysis Market Driven Plotting The Business Values PowerPoint Slides Templates
Ring The Duck With Our examples of data analysis market driven plotting the business values powerpoint slides Templates . Acquire The Points With Your Ideas.
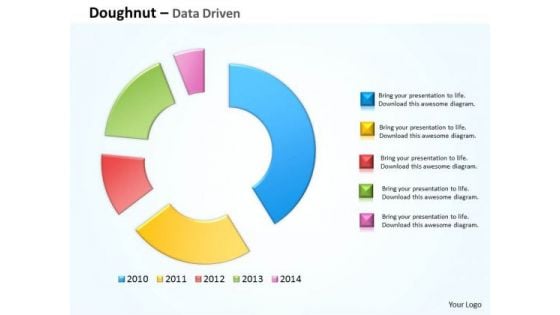
Financial Data Analysis Driven Compare Market Share Of Brand PowerPoint Templates
Doll Up Your Thoughts With Our financial data analysis driven compare market share of brand Powerpoint Templates . They Will Make A Pretty Picture.

Overview Cybersecurity And Data Protection In Digital Transformation DT SS V
This slide presents an overview into the landscape of cybersecurity and data protection with its advantages. It also presents a survey analysis on share of SMEs that have implemented essential and basic IT security initiatives.Find highly impressive Overview Cybersecurity And Data Protection In Digital Transformation DT SS V on Slidegeeks to deliver a meaningful presentation. You can save an ample amount of time using these presentation templates. No need to worry to prepare everything from scratch because Slidegeeks experts have already done a huge research and work for you. You need to download Overview Cybersecurity And Data Protection In Digital Transformation DT SS V for your upcoming presentation. All the presentation templates are 100 percent editable and you can change the color and personalize the content accordingly. Download now This slide presents an overview into the landscape of cybersecurity and data protection with its advantages. It also presents a survey analysis on share of SMEs that have implemented essential and basic IT security initiatives.
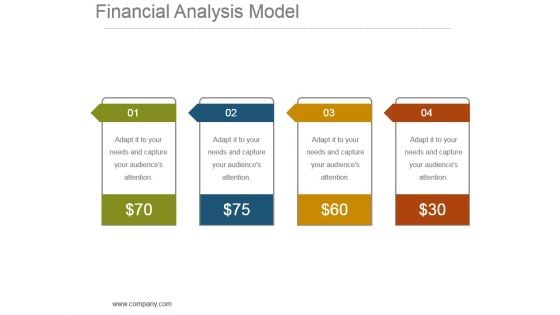
Financial Analysis Model Powerpoint Slide Show
This is a financial analysis model powerpoint slide show. This is a four stage process. The stages in this process are dollar, symbol, business, marketing, finance.
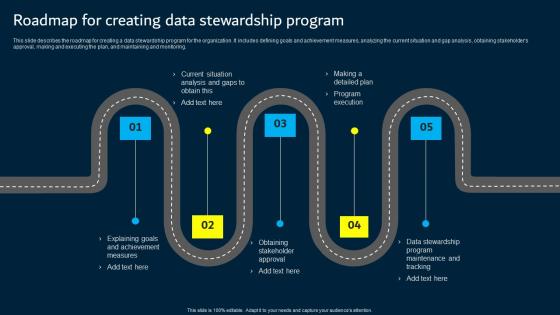
Roadmap For Creating Data Stewardship Program Data Custodianship Introduction Pdf
This slide describes the roadmap for creating a data stewardship program for the organization. It includes defining goals and achievement measures, analyzing the current situation and gap analysis, obtaining stakeholder s approval, making and executing the plan, and maintaining and monitoring. Are you searching for a Roadmap For Creating Data Stewardship Program Data Custodianship Introduction Pdf that is uncluttered, straightforward, and original Its easy to edit, and you can change the colors to suit your personal or business branding. For a presentation that expresses how much effort you have put in, this template is ideal With all of its features, including tables, diagrams, statistics, and lists, its perfect for a business plan presentation. Make your ideas more appealing with these professional slides. Download Roadmap For Creating Data Stewardship Program Data Custodianship Introduction Pdf from Slidegeeks today. This slide describes the roadmap for creating a data stewardship program for the organization. It includes defining goals and achievement measures, analyzing the current situation and gap analysis, obtaining stakeholder s approval, making and executing the plan, and maintaining and monitoring.
Data Analysis With Bar Chart In Magnifying Glass Vector Icon Ppt PowerPoint Presentation File Model PDF
Presenting this set of slides with name data analysis with bar chart in magnifying glass vector icon ppt powerpoint presentation file model pdf. This is a one stage process. The stages in this process is data analysis with bar chart in magnifying glass vector icon. This is a completely editable PowerPoint presentation and is available for immediate download. Download now and impress your audience.
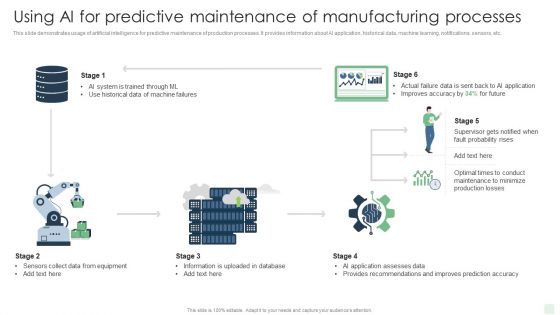
Using Ai For Predictive Maintenance Of Manufacturing Process Deployment Ideas PDF
Retrieve professionally designed Using Ai For Predictive Maintenance Of Manufacturing Process Deployment Ideas PDF to effectively convey your message and captivate your listeners. Save time by selecting pre-made slideshows that are appropriate for various topics, from business to educational purposes. These themes come in many different styles, from creative to corporate, and all of them are easily adjustable and can be edited quickly. Access them as PowerPoint templates or as Google Slides themes. You do not have to go on a hunt for the perfect presentation because Slidegeeks got you covered from everywhere.
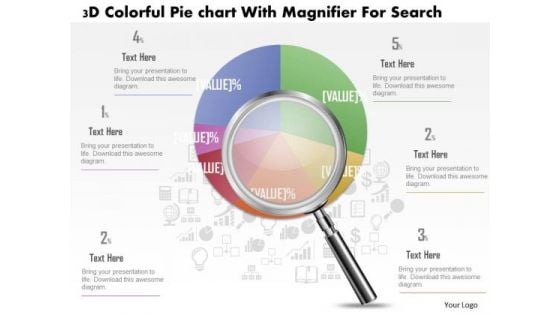
Business Diagram 3d Colorful Pie Graph With Magnifier Data Search PowerPoint Slide
This business slide displays 3d colorful pie graph with magnifier. This diagram is a data visualization tool that gives you a simple way to present statistical information. This slide helps your audience examine and interpret the data you present.
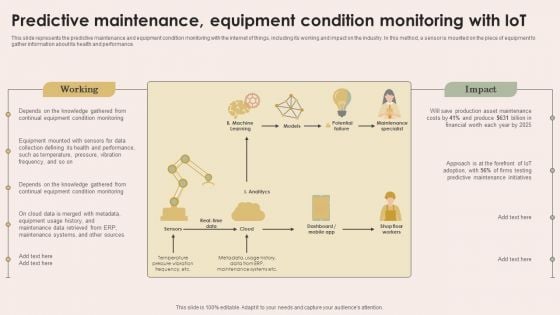
Smart Manufacturing With Iot Predictive Maintenance Equipment Condition Monitoring With Iot Designs PDF
This slide represents the predictive maintenance and equipment condition monitoring with the internet of things, including its working and impact on the industry. In this method, a sensor is mounted on the piece of equipment to gather information about its health and performance. Retrieve professionally designed Smart Manufacturing With Iot Predictive Maintenance Equipment Condition Monitoring With Iot Designs PDF to effectively convey your message and captivate your listeners. Save time by selecting pre-made slideshows that are appropriate for various topics, from business to educational purposes. These themes come in many different styles, from creative to corporate, and all of them are easily adjustable and can be edited quickly. Access them as PowerPoint templates or as Google Slides themes. You do not have to go on a hunt for the perfect presentation because Slidegeeks got you covered from everywhere.
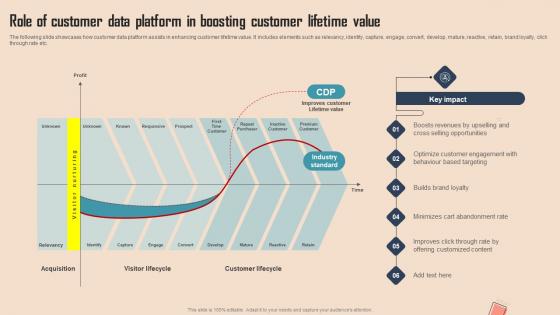
Role Of Customer Data Platform In Boosting Comprehensive CDP Guide For Promoters Elements Pdf
The following slide showcases how customer data platform assists in enhancing customer lifetime value. It includes elements such as relevancy, identity, capture, engage, convert, develop, mature, reactive, retain, brand loyalty, click through rate etc.Retrieve professionally designed Role Of Customer Data Platform In Boosting Comprehensive CDP Guide For Promoters Elements Pdf to effectively convey your message and captivate your listeners. Save time by selecting pre-made slideshows that are appropriate for various topics, from business to educational purposes. These themes come in many different styles, from creative to corporate, and all of them are easily adjustable and can be edited quickly. Access them as PowerPoint templates or as Google Slides themes. You do not have to go on a hunt for the perfect presentation because Slidegeeks got you covered from everywhere. The following slide showcases how customer data platform assists in enhancing customer lifetime value. It includes elements such as relevancy, identity, capture, engage, convert, develop, mature, reactive, retain, brand loyalty, click through rate etc.
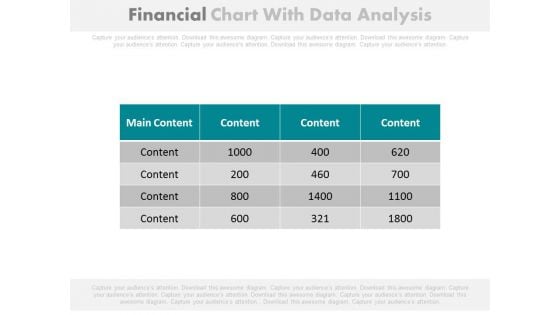
Financial Figures Data Analysis Report Powerpoint Slides
Our above PowerPoint template contains table chart with financial figures. This professional slide may be used to display data analysis report. Enlighten your audience with your breathtaking ideas.
Documents Analysis Icon To Identify Strategic Areas Of Improvement Topics PDF
Presenting Documents Analysis Icon To Identify Strategic Areas Of Improvement Topics PDF to dispense important information. This template comprises Three stages. It also presents valuable insights into the topics including Documents Analysis, Identify Strategic, Areas Of Improvement. This is a completely customizable PowerPoint theme that can be put to use immediately. So, download it and address the topic impactfully.
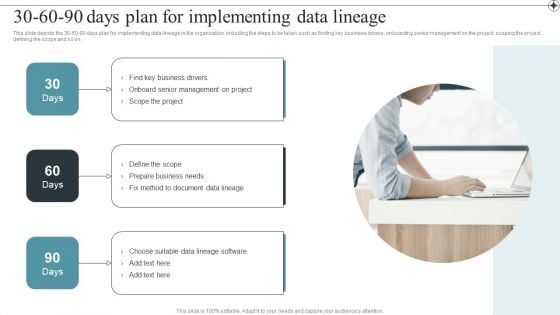
30 60 90 Days Plan For Implementing Data Lineage Themes PDF
This slide depicts the 30 60 90 days plan for implementing data lineage in the organization, including the steps to be taken such as finding key business drivers, onboarding senior management on the project, scoping the project, defining the scope and so on.Presenting this PowerPoint presentation, titled 30 60 90 Days Plan For Implementing Data Lineage Themes PDF, with topics curated by our researchers after extensive research. This editable presentation is available for immediate download and provides attractive features when used. Download now and captivate your audience. Presenting this 30 60 90 Days Plan For Implementing Data Lineage Themes PDF. Our researchers have carefully researched and created these slides with all aspects taken into consideration. This is a completely customizable 30 60 90 Days Plan For Implementing Data Lineage Themes PDF that is available for immediate downloading. Download now and make an impact on your audience. Highlight the attractive features available with our PPTs.
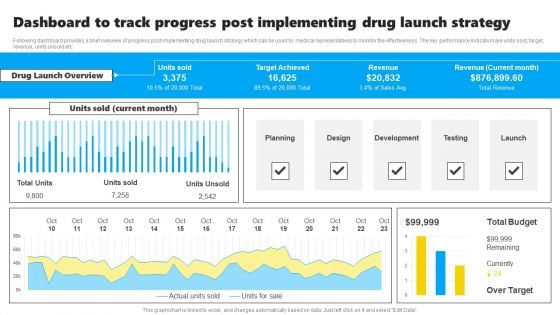
Dashboard To Track Progress Post Implementing Drug Launch Strategy Slides PDF
Following dashboard provides a brief overview of progress post implementing drug launch strategy which can be used by medical representatives to monitor the effectiveness. The key performance indicators are units sold, target, revenue, units unsold etc. Showcasing this set of slides titled Dashboard To Track Progress Post Implementing Drug Launch Strategy Slides PDF. The topics addressed in these templates are Planning, Design, Development, Testing, Launch. All the content presented in this PPT design is completely editable. Download it and make adjustments in color, background, font etc. as per your unique business setting.
Business Diagram Flask And Test Tubes For Data Driven PowerPoint Slide
This data driven diagram has been designed with flask and test tubes. Download this diagram to give your presentations more effective look. It helps in clearly conveying your message to clients and audience.

Sales Outreach Challenges With Effective Solution Themes Pdf
Mentioned slide displays multiple challenges faced by business in sales communication with respective solution to achieve business milestones. It includes challenges such as lead generation, website management, low budget, developing targeting content and obsolete technology. Pitch your topic with ease and precision using this Sales Outreach Challenges With Effective Solution Themes Pdf. This layout presents information on Sales Outreach Challenges, Developing Targeting Content, Obsolete Technology. It is also available for immediate download and adjustment. So, changes can be made in the color, design, graphics or any other component to create a unique layout. Mentioned slide displays multiple challenges faced by business in sales communication with respective solution to achieve business milestones. It includes challenges such as lead generation, website management, low budget, developing targeting content and obsolete technology.
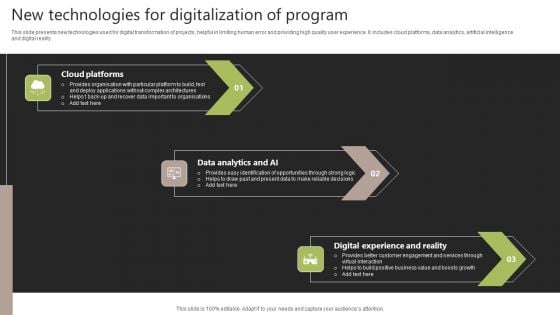
New Technologies For Digitalization Of Program Structure PDF
This slide presents new technologies used for digital transformation of projects, helpful in limiting human error and providing high quality user experience. It includes cloud platforms, data analytics, artificial intelligence and digital reality. Presenting New Technologies For Digitalization Of Program Structure PDF to dispense important information. This template comprises three stages. It also presents valuable insights into the topics including Cloud Platforms, Data Analytics AI, Digital Experience Reality. This is a completely customizable PowerPoint theme that can be put to use immediately. So, download it and address the topic impactfully.
Business Diagram Battery With Alert Sign And Dices Power Technology PowerPoint Slide
This business diagram displays risk alert on battery icon. Use this diagram, in your presentations to display energy saving, battery and technology. Create professional presentations using this diagram slide.
Business Diagram Battery With Empty Sign For Power Generation PowerPoint Slide
This business diagram displays empty sign alert on battery icon. Use this diagram, in your presentations to display energy saving, battery and technology. Create professional presentations using this diagram slide.
Business Diagram Flasks For Data Analysis Presentation Template
This business diagram displays three flasks. You may use this slide for data analysis. Make your mark with this unique slide. Create an impression that will endure.
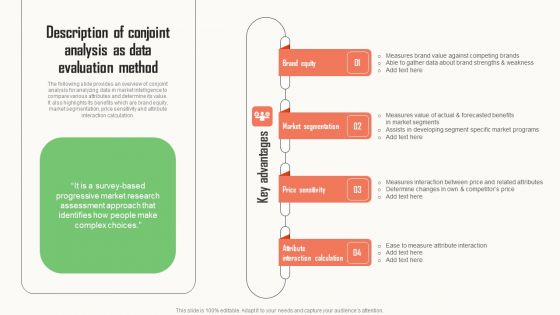
Strategic Market Insight Implementation Guide Description Of Conjoint Analysis As Data Evaluation Method Graphics PDF
The following slide provides an overview of conjoint analysis for analyzing data in market intelligence to compare various attributes and determine its value. It also highlights its benefits which are brand equity, market segmentation, price sensitivity and attribute interaction calculation. Whether you have daily or monthly meetings, a brilliant presentation is necessary. Strategic Market Insight Implementation Guide Description Of Conjoint Analysis As Data Evaluation Method Graphics PDF can be your best option for delivering a presentation. Represent everything in detail using Strategic Market Insight Implementation Guide Description Of Conjoint Analysis As Data Evaluation Method Graphics PDF and make yourself stand out in meetings. The template is versatile and follows a structure that will cater to your requirements. All the templates prepared by Slidegeeks are easy to download and edit. Our research experts have taken care of the corporate themes as well. So, give it a try and see the results.
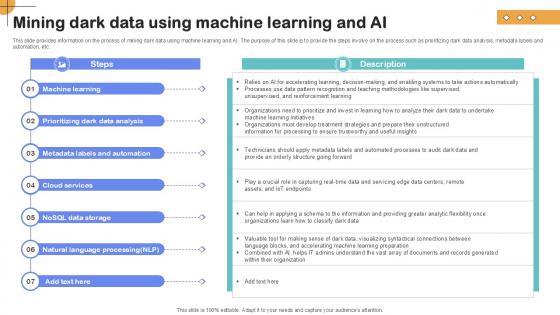
Mining Dark Data Using Machine Importance Of Unstructured Data Ppt PowerPoint
This slide provides information on the process of mining dark data using machine learning and AI. The purpose of this slide is to provide the steps involve on the process such as prioritizing dark data analysis, metadata labels and automation, etc.Retrieve professionally designed Mining Dark Data Using Machine Importance Of Unstructured Data Ppt PowerPoint to effectively convey your message and captivate your listeners. Save time by selecting pre-made slideshows that are appropriate for various topics, from business to educational purposes. These themes come in many different styles, from creative to corporate, and all of them are easily adjustable and can be edited quickly. Access them as PowerPoint templates or as Google Slides themes. You do not have to go on a hunt for the perfect presentation because Slidegeeks got you covered from everywhere. This slide provides information on the process of mining dark data using machine learning and AI. The purpose of this slide is to provide the steps involve on the process such as prioritizing dark data analysis, metadata labels and automation, etc.
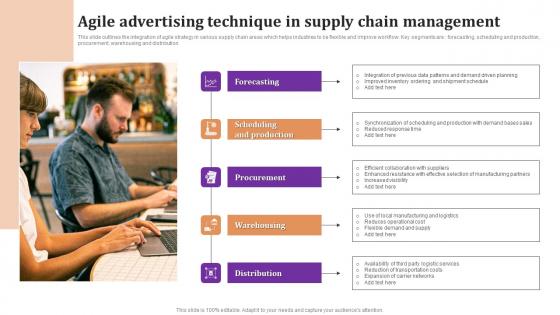
Agile Advertising Technique In Supply Chain Management Themes Pdf
This slide outlines the integration of agile strategy in various supply chain areas which helps industries to be flexible and improve workflow. Key segments are forecasting, scheduling and production, procurement, warehousing and distribution Pitch your topic with ease and precision using this Agile Advertising Technique In Supply Chain Management Themes Pdf This layout presents information on Forecasting, Scheduling And Production, Procurement It is also available for immediate download and adjustment. So, changes can be made in the color, design, graphics or any other component to create a unique layout. This slide outlines the integration of agile strategy in various supply chain areas which helps industries to be flexible and improve workflow. Key segments are forecasting, scheduling and production, procurement, warehousing and distribution
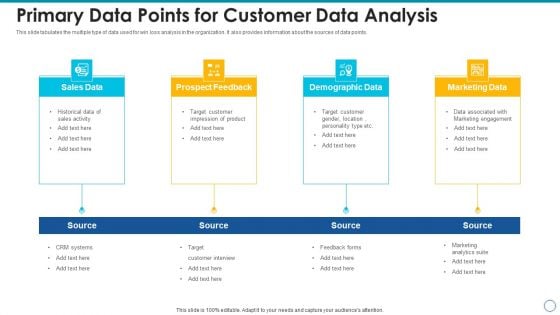
Primary Data Points For Customer Data Analysis Ideas PDF
This slide tabulates the multiple type of data used for win loss analysis in the organization. It also provides information about the sources of data points. Presenting primary data points for customer data analysis ideas pdf to dispense important information. This template comprises four stages. It also presents valuable insights into the topics including sales data, prospect feedback, demographic data, marketing data. This is a completely customizable PowerPoint theme that can be put to use immediately. So, download it and address the topic impactfully.


 Continue with Email

 Home
Home


