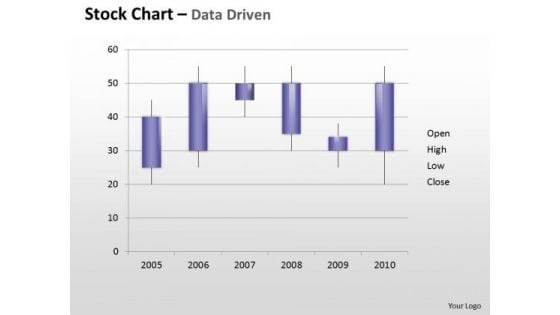
It Project Discovery Phase
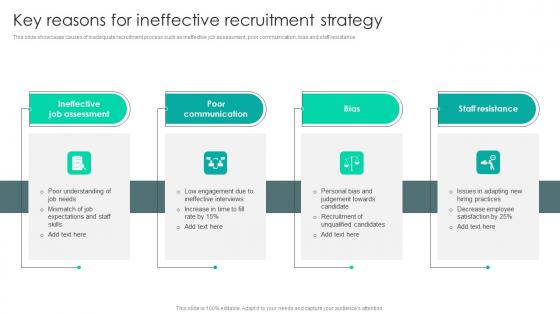
Strategic Staffing Using Data Key Reasons For Ineffective Recruitment Strategy CRP DK SS V
This slide showcases causes of inadequate recruitment process such as ineffective job assessment, poor communication, bias and staff resistance. Are you searching for a Strategic Staffing Using Data Key Reasons For Ineffective Recruitment Strategy CRP DK SS V that is uncluttered, straightforward, and original Its easy to edit, and you can change the colors to suit your personal or business branding. For a presentation that expresses how much effort you have put in, this template is ideal With all of its features, including tables, diagrams, statistics, and lists, its perfect for a business plan presentation. Make your ideas more appealing with these professional slides. Download Strategic Staffing Using Data Key Reasons For Ineffective Recruitment Strategy CRP DK SS V from Slidegeeks today. This slide showcases causes of inadequate recruitment process such as ineffective job assessment, poor communication, bias and staff resistance.
Survey Methods To Calculate Willingness To Pay Ppt Icon Outline Pdf
This slide includes survey-based methods for setting pricing strategies for key market segments or customers with willingness to pay. It includes Gabor granger, van waterdrop, and conjoint analysis. Pitch your topic with ease and precision using this Survey Methods To Calculate Willingness To Pay Ppt Icon Outline Pdf. This layout presents information on Gabor Granger, Van Waterdrop, Conjoint Analysis. It is also available for immediate download and adjustment. So, changes can be made in the color, design, graphics or any other component to create a unique layout. This slide includes survey-based methods for setting pricing strategies for key market segments or customers with willingness to pay. It includes Gabor granger, van waterdrop, and conjoint analysis.
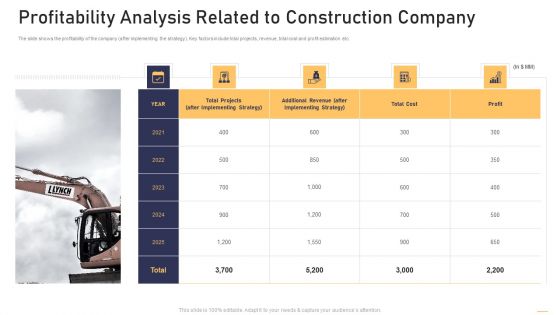
Surge In Construction Faults Lawsuits Case Competition Profitability Analysis Related To Construction Themes PDF
The slide shows the profitability of the company after implementing the strategy. Key factors include total projects, revenue, total cost and profit estimation etc. Deliver and pitch your topic in the best possible manner with this surge in construction faults lawsuits case competition profitability analysis related to construction themes pdf. Use them to share invaluable insights on profitability analysis related to construction company and impress your audience. This template can be altered and modified as per your expectations. So, grab it now.

Business Diagram 3d Lock With Pie Chart And Text Boxes For Business PowerPoint Slide
This Power Point diagram has been crafted with pie chart in shape of lock. It contains diagram of lock pie chart to compare and present data in an effective manner. Use this diagram to build professional presentations for your viewers.

Impact Of Data Integration Process On Organizations Data Integration Strategies For Business
This slide discusses the effects of the data integration process in an organization. The purpose of this slide is to explain the impact of data integration in terms of decision-making, cost efficiency, time-saving, increasing productivity, customer satisfaction, and competitive advancement. Do you know about Slidesgeeks Impact Of Data Integration Process On Organizations Data Integration Strategies For Business These are perfect for delivering any kind od presentation. Using it, create PowerPoint presentations that communicate your ideas and engage audiences. Save time and effort by using our pre-designed presentation templates that are perfect for a wide range of topic. Our vast selection of designs covers a range of styles, from creative to business, and are all highly customizable and easy to edit. Download as a PowerPoint template or use them as Google Slides themes. This slide discusses the effects of the data integration process in an organization. The purpose of this slide is to explain the impact of data integration in terms of decision-making, cost efficiency, time-saving, increasing productivity, customer satisfaction, and competitive advancement.
Social Platforms Data Analysis Sites Data Mining Icon Guidelines PDF
Showcasing this set of slides titled Social Platforms Data Analysis Sites Data Mining Icon Guidelines PDF. The topics addressed in these templates are Social Platforms Data Analysis, Sites Data Mining Icon. All the content presented in this PPT design is completely editable. Download it and make adjustments in color, background, font etc. as per your unique business setting.
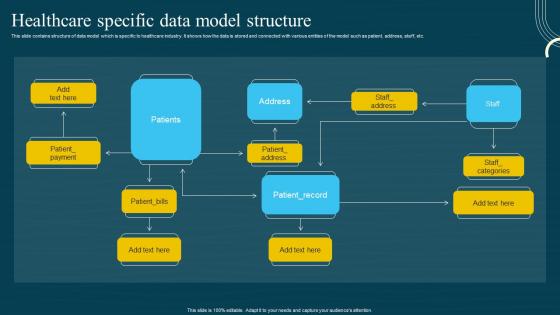
Database Modeling Structures Healthcare Specific Data Model Structure Demonstration Pdf
This slide contains structure of data model which is specific to healthcare industry. It shows how the data is stored and connected with various entities of the model such as patient, address, staff, etc. This Database Modeling Structures Healthcare Specific Data Model Structure Demonstration Pdf is perfect for any presentation, be it in front of clients or colleagues. It is a versatile and stylish solution for organizing your meetings. The Database Modeling Structures Healthcare Specific Data Model Structure Demonstration Pdf features a modern design for your presentation meetings. The adjustable and customizable slides provide unlimited possibilities for acing up your presentation. Slidegeeks has done all the homework before launching the product for you. So, do not wait, grab the presentation templates today This slide contains structure of data model which is specific to healthcare industry. It shows how the data is stored and connected with various entities of the model such as patient, address, staff, etc.

ASIA Pacific Medical Device Market Outlook Surgical Devices Ppt Example IR SS V
The slide represents overview of Asia Pacific medical device industry. The purpose of the slide is to provide comprehensive analysis and forecast, offering insights into market trends, growth opportunities, and key factors influencing the sectors trajectory. It cover countries such as India and China. Create an editable ASIA Pacific Medical Device Market Outlook Surgical Devices Ppt Example IR SS V that communicates your idea and engages your audience. Whether you are presenting a business or an educational presentation, pre-designed presentation templates help save time. ASIA Pacific Medical Device Market Outlook Surgical Devices Ppt Example IR SS V is highly customizable and very easy to edit, covering many different styles from creative to business presentations. Slidegeeks has creative team members who have crafted amazing templates. So, go and get them without any delay. The slide represents overview of Asia Pacific medical device industry. The purpose of the slide is to provide comprehensive analysis and forecast, offering insights into market trends, growth opportunities, and key factors influencing the sectors trajectory. It cover countries such as India and China.
Various Stages For Business Process Evaluation With Icons Ppt PowerPoint Presentation Infographic Template Background Designs PDF
Presenting various stages for business process evaluation with icons ppt powerpoint presentation infographic template background designs pdf to dispense important information. This template comprises eight stages. It also presents valuable insights into the topics including gather background information, discover business objectives, define scope of project, identify stakeholders, evaluate options, business analyst delivery plan. This is a completely customizable PowerPoint theme that can be put to use immediately. So, download it and address the topic impactfully.

Quarterly Strategy Roadmap For Data Analysis Integration To Business Themes
Presenting our innovatively-structured quarterly strategy roadmap for data analysis integration to business themes Template. Showcase your roadmap process in different formats like PDF, PNG, and JPG by clicking the download button below. This PPT design is available in both Standard Screen and Widescreen aspect ratios. It can also be easily personalized and presented with modified font size, font type, color, and shapes to measure your progress in a clear way.
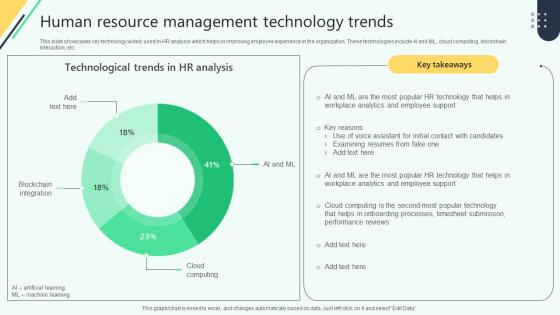
Human Resource Management Technology Trends Analysing Hr Data For Effective Decision Making
This slide showcases key technology widely used in HR analysis which helps in improving employee experience in the organization. These technologies include AI and ML, cloud computing, blockchain interaction, etc. Are you searching for a Human Resource Management Technology Trends Analysing Hr Data For Effective Decision Making that is uncluttered, straightforward, and original Its easy to edit, and you can change the colors to suit your personal or business branding. For a presentation that expresses how much effort you have put in, this template is ideal With all of its features, including tables, diagrams, statistics, and lists, its perfect for a business plan presentation. Make your ideas more appealing with these professional slides. Download Human Resource Management Technology Trends Analysing Hr Data For Effective Decision Making from Slidegeeks today. This slide showcases key technology widely used in HR analysis which helps in improving employee experience in the organization. These technologies include AI and ML, cloud computing, blockchain interaction, etc.
Risk Analysis Vector Icon Ppt Powerpoint Presentation Infographics File Formats
This is a risk analysis vector icon ppt powerpoint presentation infographics file formats. This is a four stage process. The stages in this process are feedback loop icon, evaluation icon, assessment icon.
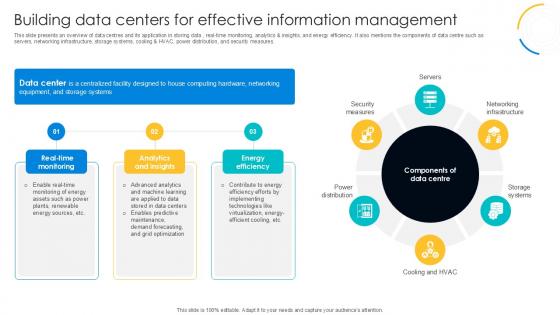
Building Data Centers For Effective Digital Transformation Journey PPT Slide DT SS V
This slide presents an overview of data centres and its application in storing data , real-time monitoring, analytics and insights, and energy efficiency. It also mentions the components of data centre such as servers, networking infrastructure, storage systems, cooling and HVAC, power distribution, and security measures. If you are looking for a format to display your unique thoughts, then the professionally designed Building Data Centers For Effective Digital Transformation Journey PPT Slide DT SS V is the one for you. You can use it as a Google Slides template or a PowerPoint template. Incorporate impressive visuals, symbols, images, and other charts. Modify or reorganize the text boxes as you desire. Experiment with shade schemes and font pairings. Alter, share or cooperate with other people on your work. Download Building Data Centers For Effective Digital Transformation Journey PPT Slide DT SS V and find out how to give a successful presentation. Present a perfect display to your team and make your presentation unforgettable. This slide presents an overview of data centres and its application in storing data , real-time monitoring, analytics and insights, and energy efficiency. It also mentions the components of data centre such as servers, networking infrastructure, storage systems, cooling and HVAC, power distribution, and security measures.
Data Administration Icon Data Collection Business Ppt PowerPoint Presentation Complete Deck
This data administration icon data collection business ppt powerpoint presentation complete deck acts as backup support for your ideas, vision, thoughts, etc. Use it to present a thorough understanding of the topic. This PPT slideshow can be utilized for both in-house and outside presentations depending upon your needs and business demands. Entailing twelve slides with a consistent design and theme, this template will make a solid use case. As it is intuitively designed, it suits every business vertical and industry. All you have to do is make a few tweaks in the content or any other component to design unique presentations. The biggest advantage of this complete deck is that it can be personalized multiple times once downloaded. The color, design, shapes, and other elements are free to modify to add personal touches. You can also insert your logo design in this PPT layout. Therefore a well-thought and crafted presentation can be delivered with ease and precision by downloading this data administration icon data collection business ppt powerpoint presentation complete deck PPT slideshow.
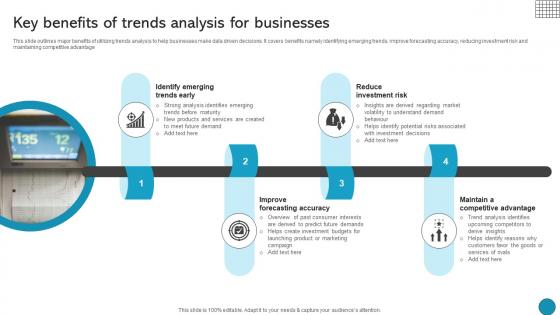
Key Benefits Of Trends Analysis For Businesses Driving Business Success Integrating Product
This slide outlines major benefits of utilizing trends analysis to help businesses make data driven decisions. It covers benefits namely identifying emerging trends, improve forecasting accuracy, reducing investment risk and maintaining competitive advantage Do you know about Slidesgeeks Key Benefits Of Trends Analysis For Businesses Driving Business Success Integrating Product These are perfect for delivering any kind od presentation. Using it, create PowerPoint presentations that communicate your ideas and engage audiences. Save time and effort by using our pre-designed presentation templates that are perfect for a wide range of topic. Our vast selection of designs covers a range of styles, from creative to business, and are all highly customizable and easy to edit. Download as a PowerPoint template or use them as Google Slides themes. This slide outlines major benefits of utilizing trends analysis to help businesses make data driven decisions. It covers benefits namely identifying emerging trends, improve forecasting accuracy, reducing investment risk and maintaining competitive advantage
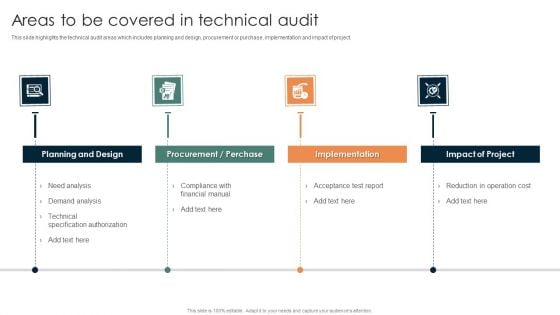
Online Mechanism For Site Areas To Be Covered In Technical Audit Template PDF
This slide highlights the technical audit areas which includes planning and design, procurement or purchase, implementation and impact of project. Find a pre-designed and impeccable Online Mechanism For Site Areas To Be Covered In Technical Audit Template PDF. The templates can ace your presentation without additional effort. You can download these easy-to-edit presentation templates to make your presentation stand out from others. So, what are you waiting for Download the template from Slidegeeks today and give a unique touch to your presentation.
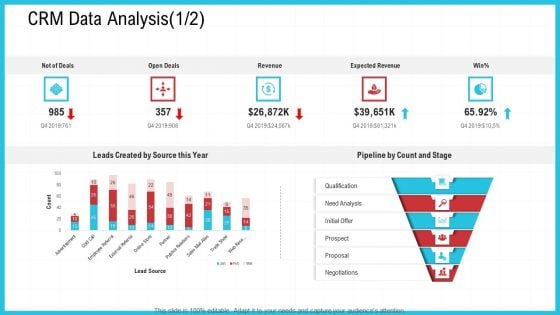
CRM Data Analysis Analysis Ppt Portfolio Inspiration PDF
Deliver and pitch your topic in the best possible manner with this crm data analysis analysis ppt portfolio inspiration pdf. Use them to share invaluable insights on revenue, source, analysis and impress your audience. This template can be altered and modified as per your expectations. So, grab it now.
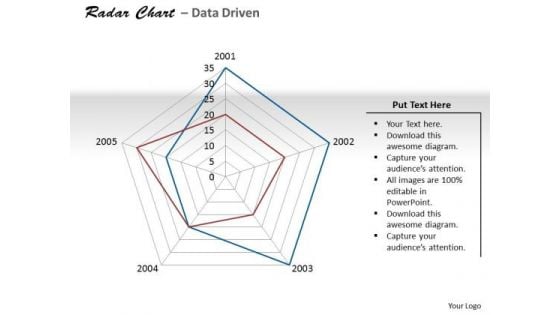
Excel Data Analysis Data Tools Data Methods Statistical Driven PowerPoint Slides Templates
There Is No Subject Too Dull For Our excel data analysis data tools data methods statistical driven powerpoint slides Templates . They Will Always Generate Keenness.
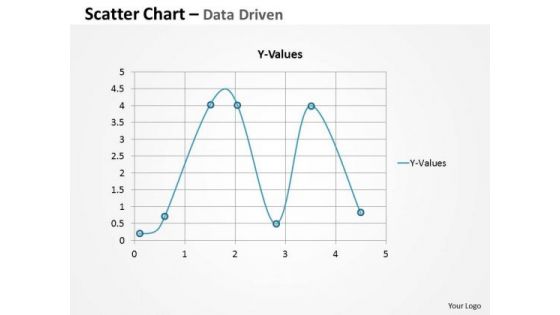
Excel Data Analysis Data Tools Data Methods Statistical Survey Driven PowerPoint Slides Templates
Ask For Assistance From Our excel data analysis data tools data methods statistical survey driven powerpoint slides Templates . You Will Be Duly Satisfied.
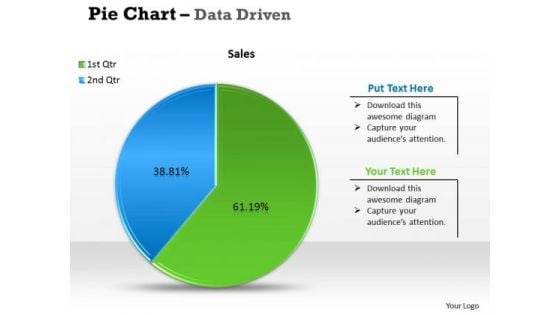
Excel Data Analysis Data Tools Data Methods Statistical Tool Survey PowerPoint Slides Templates
Get Out Of The Dock With Our excel data analysis data tools data methods statistical tool survey powerpoint slides Templates . Your Mind Will Be Set Free.
Area Chart For Data Analysis Ppt PowerPoint Presentation Icon Backgrounds
Presenting this set of slides with name area chart for data analysis ppt powerpoint presentation icon backgrounds. The topics discussed in these slide is area chart for data analysis. This is a completely editable PowerPoint presentation and is available for immediate download. Download now and impress your audience.
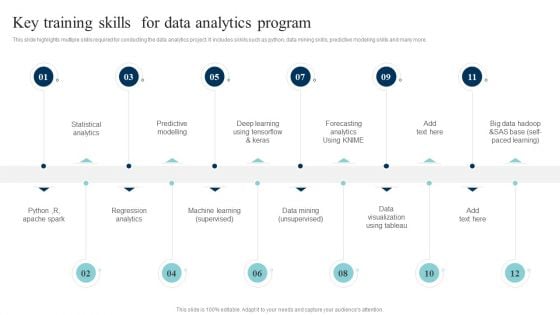
Data Evaluation And Processing Toolkit Key Training Skills For Data Analytics Program Themes PDF
This slide highlights multiple skills required for conducting the data analytics project. It includes skkils such as python, data mining skills, predictive modeling skills and many more. There are so many reasons you need a Data Evaluation And Processing Toolkit Key Training Skills For Data Analytics Program Themes PDF. The first reason is you cant spend time making everything from scratch, Thus, Slidegeeks has made presentation templates for you too. You can easily download these templates from our website easily.
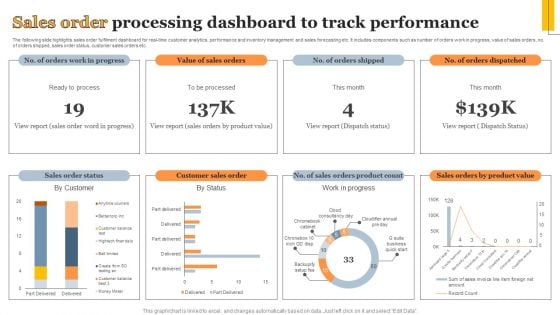
Sales Order Processing Dashboard To Track Performance Information PDF
The following slide highlights sales order fulfilment dashboard for real-time customer analytics, performance and inventory management and sales forecasting etc. It includes components such as number of orders work in progress, value of sales orders, no. of orders shipped, sales order status, customer sales orders etc. Showcasing this set of slides titled Sales Order Processing Dashboard To Track Performance Information PDF. The topics addressed in these templates are Sales Order Status, Customer Sales Order, Work Progress. All the content presented in this PPT design is completely editable. Download it and make adjustments in color, background, font etc. as per your unique business setting.
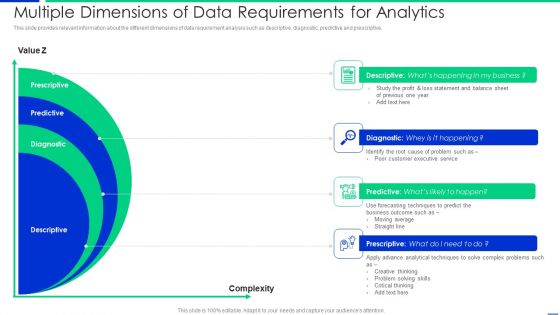
Multiple Dimensions Of Data Requirements For Analytics Slides PDF
This slide provides relevant information about the different dimensions of data requirement analysis such as descriptive, diagnostic, predictive and prescriptive. Presenting multiple dimensions of data requirements for analytics slides pdf to dispense important information. This template comprises four stages. It also presents valuable insights into the topics including average, business, techniques. This is a completely customizable PowerPoint theme that can be put to use immediately. So, download it and address the topic impactfully.
Sales Gap Data Analysis Icon Microsoft PDF
Persuade your audience using this Sales Gap Data Analysis Icon Microsoft PDF. This PPT design covers four stages, thus making it a great tool to use. It also caters to a variety of topics including Sales Gap Data, Analysis Icon. Download this PPT design now to present a convincing pitch that not only emphasizes the topic but also showcases your presentation skills.

Data Analysis In Excel 3d Column Chart To Represent Information PowerPoint Templates
Rake In The Dough With
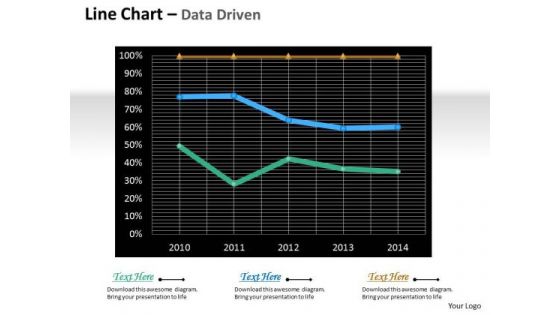
Multivariate Data Analysis Driven Line Chart For Market Survey PowerPoint Slides Templates
Rake In The Dough With
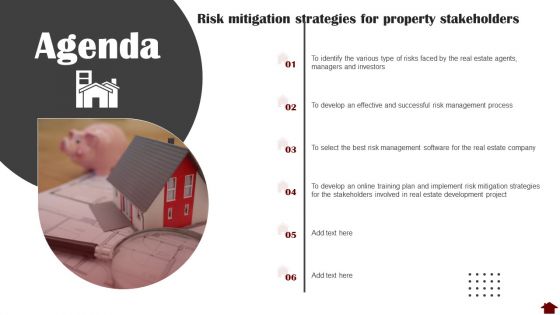
Agenda Risk Mitigation Strategies For Property Diagrams PDF
This is a Agenda Risk Mitigation Strategies For Property Diagrams PDF template with various stages. Focus and dispense information on six stages using this creative set, that comes with editable features. It contains large content boxes to add your information on topics like Risk Management Process, Estate Development Project, Develop. You can also showcase facts, figures, and other relevant content using this PPT layout. Grab it now.
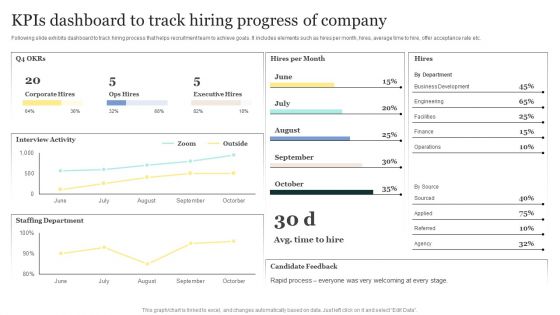
Strategic Approaches To Efficient Candidate Selection Kpis Dashboard To Track Hiring Progress Of Company Pictures PDF
Following slide exhibits dashboard to track hiring process that helps recruitment team to achieve goals. It includes elements such as hires per month, hires, average time to hire, offer acceptance rate etc. Explore a selection of the finest Strategic Approaches To Efficient Candidate Selection Kpis Dashboard To Track Hiring Progress Of Company Pictures PDF here. With a plethora of professionally designed and pre-made slide templates, you can quickly and easily find the right one for your upcoming presentation. You can use our Strategic Approaches To Efficient Candidate Selection Kpis Dashboard To Track Hiring Progress Of Company Pictures PDF to effectively convey your message to a wider audience. Slidegeeks has done a lot of research before preparing these presentation templates. The content can be personalized and the slides are highly editable. Grab templates today from Slidegeeks.
Data Analysis Bar Chart With Magnifying Glass Icon Ppt PowerPoint Presentation Icon Layouts PDF
Presenting this set of slides with name data analysis bar chart with magnifying glass icon ppt powerpoint presentation icon layouts pdf. This is a three stage process. The stages in this process are data analysis bar chart with magnifying glass icon. This is a completely editable PowerPoint presentation and is available for immediate download. Download now and impress your audience.
Kanban And Lean Management Agile Development Process Icons PDF
This slide covers agile development lifecycle including integration and tests, iterations, review, feedbacks and finally release in markets.This is a Kanban And Lean Management Agile Development Process Icons PDF template with various stages. Focus and dispense information on one stage using this creative set, that comes with editable features. It contains large content boxes to add your information on topics like Initiate Project, Continuous Visibility, Requirements You can also showcase facts, figures, and other relevant content using this PPT layout. Grab it now.
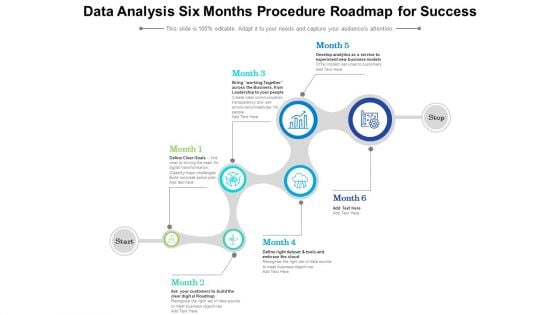
Data Analysis Six Months Procedure Roadmap For Success Ideas
Presenting our innovatively structured data analysis six months procedure roadmap for success ideas Template. Showcase your roadmap process in different formats like PDF, PNG, and JPG by clicking the download button below. This PPT design is available in both Standard Screen and Widescreen aspect ratios. It can also be easily personalized and presented with modified font size, font type, color, and shapes to measure your progress in a clear way.
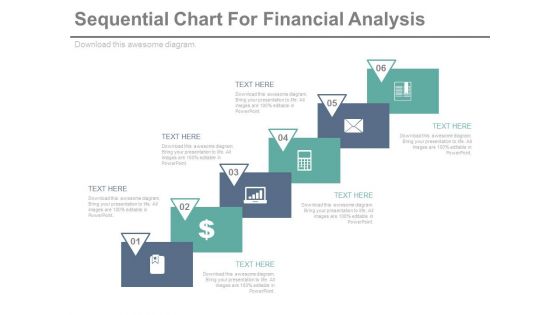
Sequential Steps Chart For Data Analysis Powerpoint Slides
This PowerPoint template has been designed sequential steps chart with icons. This PPT slide can be used to display corporate level financial strategy. You can download finance PowerPoint template to prepare awesome presentations.
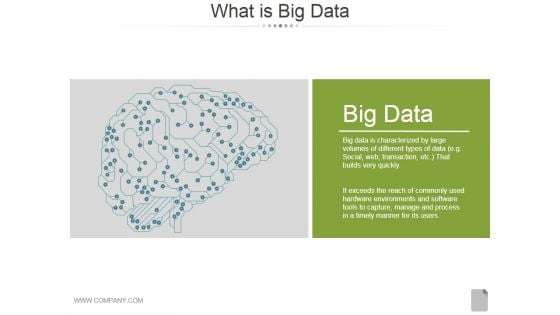
What Is Big Data Ppt PowerPoint Presentation Diagrams
This is a what is big data ppt powerpoint presentation diagrams. This is a one stage process. The stages in this process are big data, business, analysis, management, marketing.
Business Diagram Hour Glass With 3d Man And Icons PowerPoint Slide
This diagram displays 3d man with hour glass and icons. This diagram contains concept of communication and technology. Use this diagram to display business process workflows in any presentations.
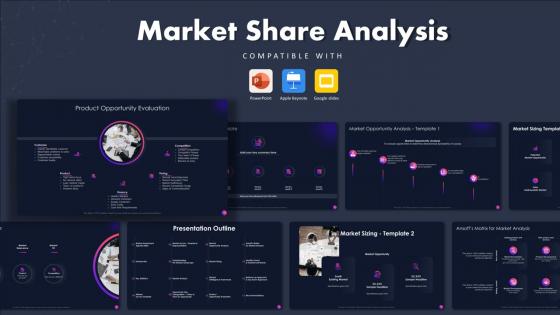
Market Share Analysis Powerpoint Presentation
This Market Share Analysis Powerpoint Presentation is designed to help you retain your audiences attention. This content-ready PowerPoint Template enables you to take your audience on a journey and share information in a way that is easier to recall. It helps you highlight the crucial parts of your work so that the audience does not get saddled with information download. This Market Share Analysis,Market Assessment,Market analysis-slide PPT Deck comes prepared with the graphs and charts you could need to showcase your information through visuals. You only need to enter your own data in them. Download this editable PowerPoint Theme and walk into that meeting with confidence. Market Share Analysis PowerPoint Presentation Slides helps you showcase your organizations market reach. This market share assessment PPT theme is useful for marketers to explain the assessment agenda of their organization. Exploit the design of market share evaluation PowerPoint slideshow to illustrate key statistics using impactful data visualization techniques. Further, you can also use market share research PPT template to graphically represent the market survey results. Communicate the market landscape to your audience by the means of infographics included in this market share review PowerPoint theme. Utilize the market analysis Venn diagram given in market intelligence PPT slideshow to demonstrate market relevance, market opportunities, and market fit. Showcase market sizing and market opportunity analysis by incorporating data visualization tools given in this visually appealing PowerPoint presentation. So, download this market size estimation PPT deck to portray product opportunity analysis through various key performance indicators.
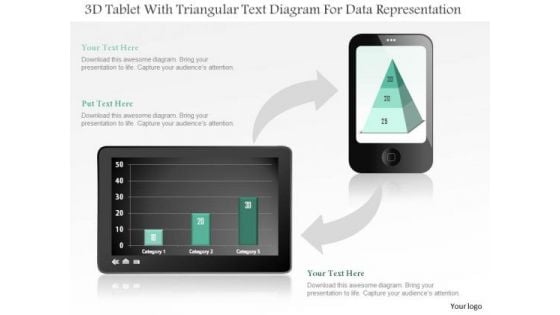
Business Diagram 3d Tablet With Triangular Text Diagram For Data Representation PowerPoint Slide
This business diagram displays bar graph on tablet and pyramid chart on mobile phone. Use this diagram, to make reports for interactive business presentations. Create professional presentations using this diagram.
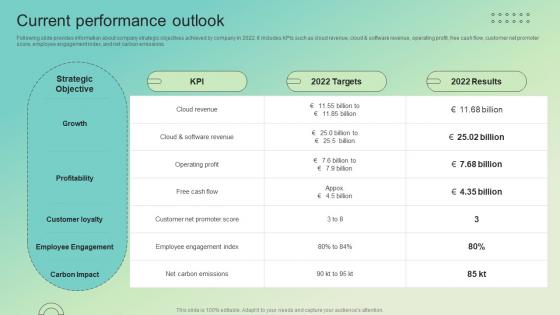
Current Performance Outlook Enterprise Software Solution Providing Company Profile CP SS V
Following slide provides information about company strategic objectives achieved by company in 2022. It includes KPIs such as cloud revenue, cloud and software revenue, operating profit, free cash flow, customer net promoter score, employee engagement index, and net carbon emissions.If you are looking for a format to display your unique thoughts, then the professionally designed Current Performance Outlook Enterprise Software Solution Providing Company Profile CP SS V is the one for you. You can use it as a Google Slides template or a PowerPoint template. Incorporate impressive visuals, symbols, images, and other charts. Modify or reorganize the text boxes as you desire. Experiment with shade schemes and font pairings. Alter, share or cooperate with other people on your work. Download Current Performance Outlook Enterprise Software Solution Providing Company Profile CP SS V and find out how to give a successful presentation. Present a perfect display to your team and make your presentation unforgettable. Following slide provides information about company strategic objectives achieved by company in 2022. It includes KPIs such as cloud revenue, cloud and software revenue, operating profit, free cash flow, customer net promoter score, employee engagement index, and net carbon emissions.

Kanban And Lean Management Diagram Requirements For The Initial Sprint Ideas PDF
This slide covers the second stage of agile software development lifecycle such as after identification of project, work with stakeholders to determine requirements.Deliver an awe inspiring pitch with this creative Kanban And Lean Management Diagram Requirements For The Initial Sprint Ideas PDF bundle. Topics like Diagram Requirements For The Initial Sprint can be discussed with this completely editable template. It is available for immediate download depending on the needs and requirements of the user.
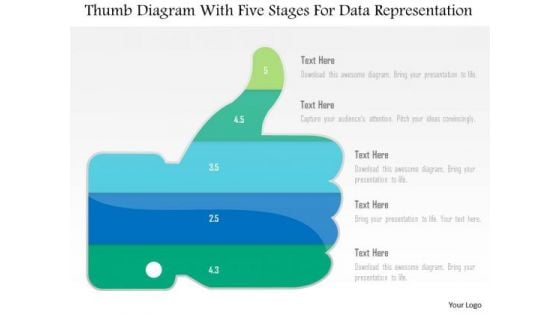
Business Diagram Thumb Diagram With Five Stages For Data Representation PowerPoint Slide
This business diagram displays thumb up with five stages. This diagram contains text boxes for data representation. Use this diagram to display business process workflows in any presentations.
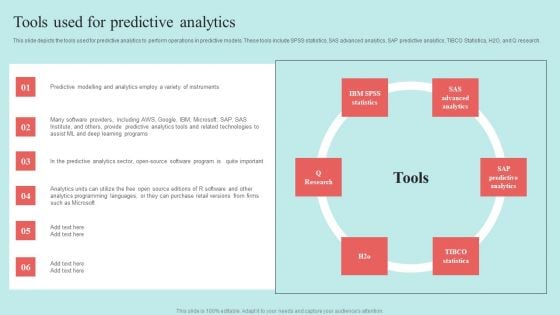
Predictive Data Model Tools Used For Predictive Analytics Download PDF
Reinforcement Learning Techniques And Applications Performance Tracking Dashboard Reinforcement Diagrams PDF
This slide shows the roadmap for the reinforcement learning project, including the list of tasks to be performed from March 2023 to February 2024. The tasks include initializing the values table, observing the current state, choosing an action for that state, and so on. Formulating a presentation can take up a lot of effort and time, so the content and message should always be the primary focus. The visuals of the PowerPoint can enhance the presenters message, so our Reinforcement Learning Techniques And Applications Performance Tracking Dashboard Reinforcement Diagrams PDF was created to help save time. Instead of worrying about the design, the presenter can concentrate on the message while our designers work on creating the ideal templates for whatever situation is needed. Slidegeeks has experts for everything from amazing designs to valuable content, we have put everything into Reinforcement Learning Techniques And Applications Performance Tracking Dashboard Reinforcement Diagrams PDF
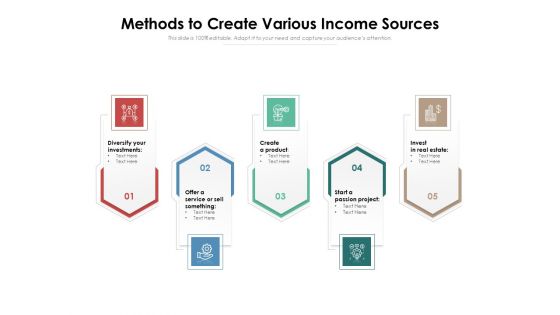
Methods To Create Various Income Sources Ppt PowerPoint Presentation Gallery Introduction PDF
Presenting methods to create various income sources ppt powerpoint presentation gallery introduction pdf to dispense important information. This template comprises nine stages. It also presents valuable insights into the topics including investments, product, project. This is a completely customizable PowerPoint theme that can be put to use immediately. So, download it and address the topic impactfully.
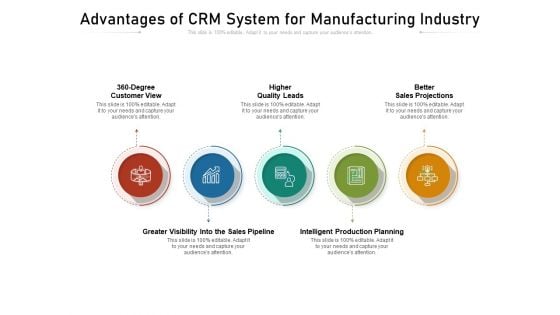
Advantages Of CRM System For Manufacturing Industry Ppt PowerPoint Presentation Gallery Design Ideas PDF
Presenting advantages of crm system for manufacturing industry ppt powerpoint presentation gallery design ideas pdf to dispense important information. This template comprises five stages. It also presents valuable insights into the topics including higher quality leads, better sales projections, intelligent production planning. This is a completely customizable PowerPoint theme that can be put to use immediately. So, download it and address the topic impactfully.
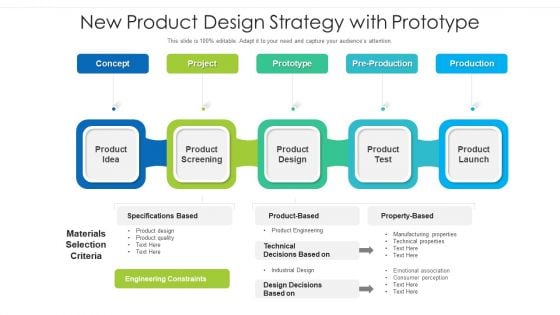
New Product Design Strategy With Prototype Ppt Summary Portrait PDF
Presenting new product design strategy with prototype ppt summary portrait pdf to dispense important information. This template comprises five stages. It also presents valuable insights into the topics including concept, project, prototype, pre production, production. This is a completely customizable PowerPoint theme that can be put to use immediately. So, download it and address the topic impactfully.
Checklist For Data Collection Executing Competitors Strategies To Assess Organizational Performance Icons Pdf
The following slide showcases various information to be gathered for understanding rivalry business and perform competitor analysis. It showcases components such as employee count, founding year, investors, number of customers, merger and acquisitions, market share and business strength and weakness. Coming up with a presentation necessitates that the majority of the effort goes into the content and the message you intend to convey. The visuals of a PowerPoint presentation can only be effective if it supplements and supports the story that is being told. Keeping this in mind our experts created Checklist For Data Collection Executing Competitors Strategies To Assess Organizational Performance Icons Pdf to reduce the time that goes into designing the presentation. This way, you can concentrate on the message while our designers take care of providing you with the right template for the situation. The following slide showcases various information to be gathered for understanding rivalry business and perform competitor analysis. It showcases components such as employee count, founding year, investors, number of customers, merger and acquisitions, market share and business strength and weakness.
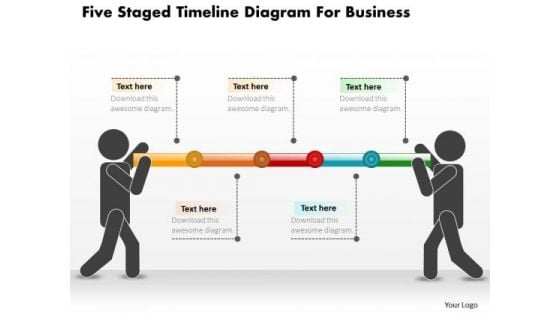
Business Diagram Five Staged Timeline Diagram For Business PowerPoint Slide
This PowerPoint template displays five points timeline diagram. This business diagram has been designed with graphic of timeline with five points, text space and start, end points. Use this diagram, in your presentations to display process steps, stages, timelines and business management. Make wonderful presentations using this business slide.
DAD Framework Maximizing Stakeholders Value By Minimizing Risk Icons PDF
This graph includes various factors that deal with the disciplined agile delivery resulting decrease in risk and increase in value throughout the project. Deliver an awe inspiring pitch with this creative DAD framework maximizing stakeholders value by minimizing risk icons pdf bundle. Topics like stakeholder vision, production ready, proven architecture, delighted stakeholders, regular development of a potentially consumable solution can be discussed with this completely editable template. It is available for immediate download depending on the needs and requirements of the user.
Due Diligence For M And A Analysis Icon Ppt Inspiration Graphic Images PDF
Persuade your audience using this Due Diligence For M And A Analysis Icon Ppt Inspiration Graphic Images PDF. This PPT design covers three stages, thus making it a great tool to use. It also caters to a variety of topics including Due Diligence, M And A, Analysis Icon. Download this PPT design now to present a convincing pitch that not only emphasizes the topic but also showcases your presentation skills.
System Analysis And Design Running On Browser Icon Ppt Styles Images PDF
Persuade your audience using this System Analysis And Design Running On Browser Icon Ppt Styles Images PDF. This PPT design covers three stages, thus making it a great tool to use. It also caters to a variety of topics including System, Analysis And Design, Running Browser Icon. Download this PPT design now to present a convincing pitch that not only emphasizes the topic but also showcases your presentation skills.
Business Data Analysis Target Icons PDF
Presenting business data analysis target icons pdf to provide visual cues and insights. Share and navigate important information on four stages that need your due attention. This template can be used to pitch topics like target. In addtion, this PPT design contains high resolution images, graphics, etc, that are easily editable and available for immediate download.

Dynamic Systems Development Approach Modelling Technique Of Dynamic System Development Guidelines PDF
This slide depicts modelling as a technique of DSDM which helps in the visualization of various elements of the project. Presenting Dynamic Systems Development Approach Modelling Technique Of Dynamic System Development Guidelines PDF to provide visual cues and insights. Share and navigate important information on four stages that need your due attention. This template can be used to pitch topics like Data Connections, Business Rules, Solution Area. In addtion, this PPT design contains high resolution images, graphics, etc, that are easily editable and available for immediate download.
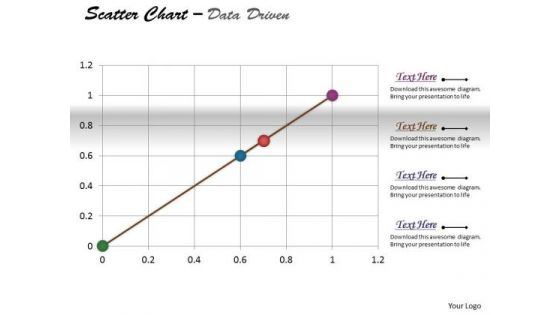
Excel Data Analysis Data Methods Statistical Tool Survey Driven PowerPoint Slides Templates
Be The Duke Of The Dais With Our excel data analysis data methods statistical tool survey driven powerpoint slides Templates . Acquire Royalty Status With Your Thoughts.
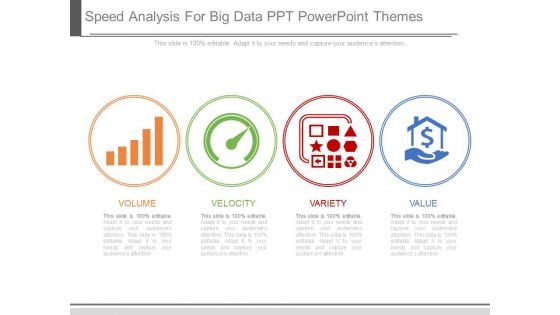
Speed Analysis For Big Data Ppt Powerpoint Themes
This is a speed analysis for big data ppt powerpoint themes. This is a four stage process. The stages in this process are volume, velocity, variety, value.
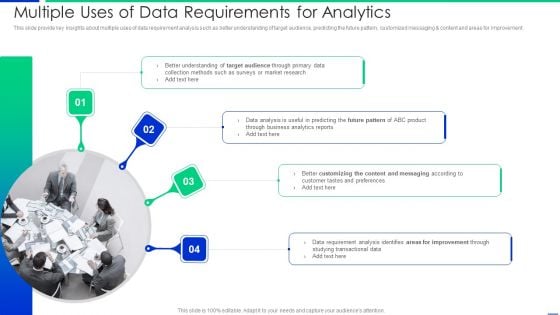
Multiple Uses Of Data Requirements For Analytics Pictures PDF
This slide provide key insights about multiple uses of data requirement analysis such as better understanding of target audience, predicting the future pattern, customized messaging and content and areas for improvement. Presenting multiple uses of data requirements for analytics pictures pdf to dispense important information. This template comprises four stages. It also presents valuable insights into the topics including analysis, customer, requirement. This is a completely customizable PowerPoint theme that can be put to use immediately. So, download it and address the topic impactfully.
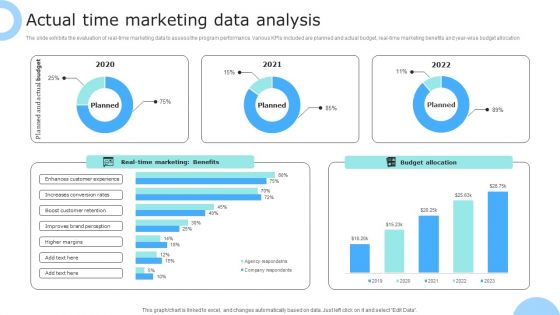
Actual Time Marketing Data Analysis Ppt PowerPoint Presentation Gallery Pictures PDF
The slide exhibits the evaluation of real-time marketing data to assess the program performance. Various KPIs included are planned and actual budget, real-time marketing benefits and year-wise budget allocation. Showcasing this set of slides titled Actual Time Marketing Data Analysis Ppt PowerPoint Presentation Gallery Pictures PDF. The topics addressed in these templates are Planned, Actual Budget, Budget Allocation, Real Time Marketing, Benefits. All the content presented in this PPT design is completely editable. Download it and make adjustments in color, background, font etc. as per your unique business setting.
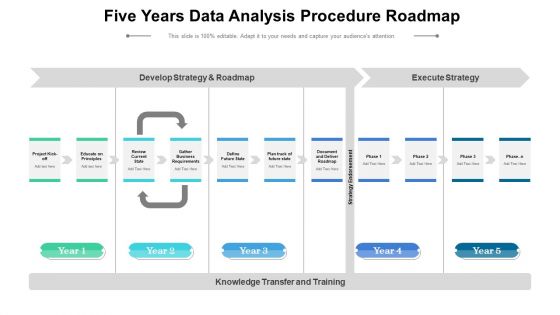
Five Years Data Analysis Procedure Roadmap Infographics
Introducing our five years data analysis procedure roadmap infographics. This PPT presentation is Google Slides compatible, therefore, you can share it easily with the collaborators for measuring the progress. Also, the presentation is available in both standard screen and widescreen aspect ratios. So edit the template design by modifying the font size, font type, color, and shapes as per your requirements. As this PPT design is fully editable it can be presented in PDF, JPG and PNG formats.
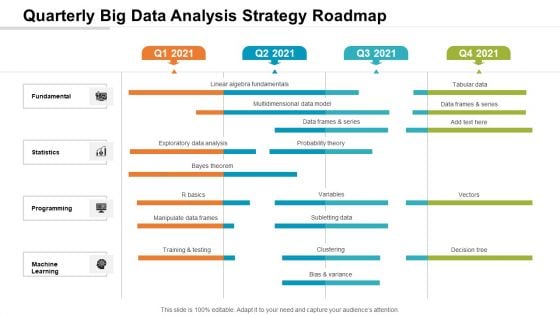
Quarterly Big Data Analysis Strategy Roadmap Infographics
Presenting our jaw-dropping quarterly big data analysis strategy roadmap infographics. You can alternate the color, font size, font type, and shapes of this PPT layout according to your strategic process. This PPT presentation is compatible with Google Slides and is available in both standard screen and widescreen aspect ratios. You can also download this well-researched PowerPoint template design in different formats like PDF, JPG, and PNG. So utilize this visually-appealing design by clicking the download button given below.
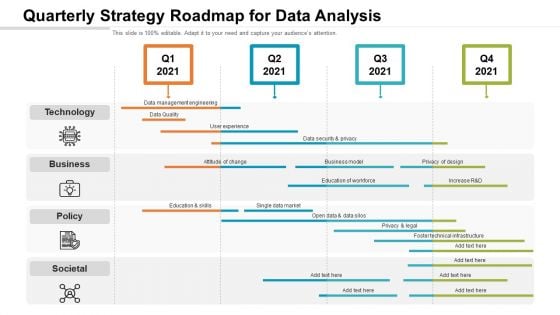
Quarterly Strategy Roadmap For Data Analysis Microsoft
Introducing our quarterly strategy roadmap for data analysis microsoft. This PPT presentation is Google Slides compatible, therefore, you can share it easily with the collaborators for measuring the progress. Also, the presentation is available in both standard screen and widescreen aspect ratios. So edit the template design by modifying the font size, font type, color, and shapes as per your requirements. As this PPT design is fully editable it can be presented in PDF, JPG and PNG formats.


 Continue with Email

 Home
Home


