It Project Discovery Phase
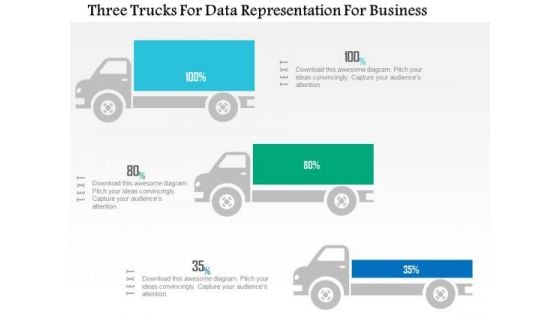
Business Diagram Three Trucks For Data Representation For Business PowerPoint Slide
This business diagram displays three trucks graphic. This diagram contains trucks for percentage value growth. Use this diagram to display business growth over a period of time.
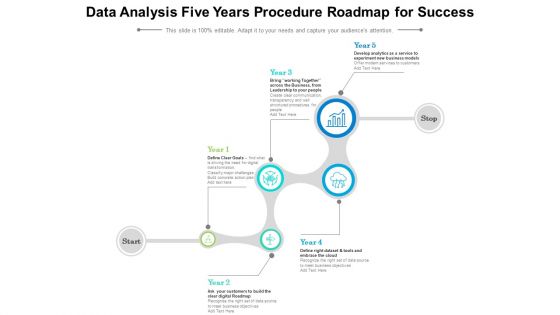
Data Analysis Five Years Procedure Roadmap For Success Slides
We present our data analysis five years procedure roadmap for success slides. This PowerPoint layout is easy to edit so you can change the font size, font type, color, and shape conveniently. In addition to this, the PowerPoint layout is Google Slides compatible, so you can share it with your audience and give them access to edit it. Therefore, download and save this well researched data analysis five years procedure roadmap for success slides in different formats like PDF, PNG, and JPG to smoothly execute your business plan.
Agenda For Disciplined Agile Distribution Responsibilities Ppt Icon Display PDF
This is a agenda for disciplined agile distribution responsibilities ppt icon display pdf template with various stages. Focus and dispense information on six stages using this creative set, that comes with editable features. It contains large content boxes to add your information on topics like software development, process, organization, implementation, project. You can also showcase facts, figures, and other relevant content using this PPT layout. Grab it now.
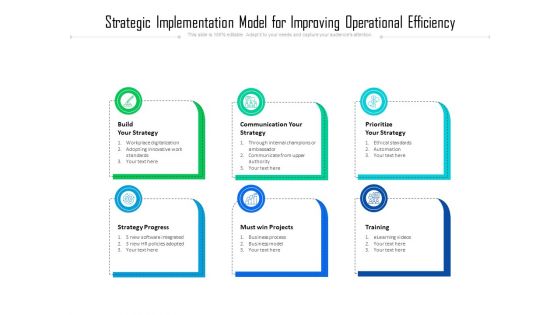
Strategic Implementation Model For Improving Operational Efficiency Ppt PowerPoint Presentation Styles Clipart Images PDF
Presenting strategic implementation model for improving operational efficiency ppt powerpoint presentation styles clipart images pdf to dispense important information. This template comprises six stages. It also presents valuable insights into the topics including build your strategy, communication your strategy, prioritize your strategy, strategy progress, must win projects. This is a completely customizable PowerPoint theme that can be put to use immediately. So, download it and address the topic impactfully.
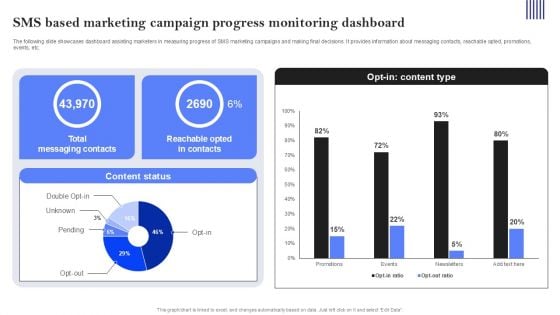
SMS Based Marketing Campaign Progress Monitoring Dashboard Ppt PowerPoint Presentation File Background Images PDF
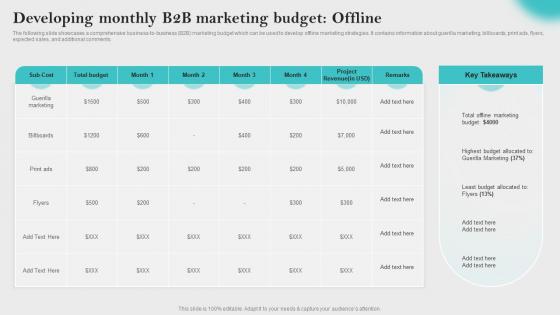
Developing Monthly Marketing Innovative Business Promotion Ideas Diagrams Pdf
The following slide showcases a comprehensive business to business B2B marketing budget which can be used to develop offline marketing strategies. It contains information about guerilla marketing, billboards, print ads, flyers, expected sales, and additional comments. Are you in need of a template that can accommodate all of your creative concepts This one is crafted professionally and can be altered to fit any style. Use it with Google Slides or PowerPoint. Include striking photographs, symbols, depictions, and other visuals. Fill, move around, or remove text boxes as desired. Test out color palettes and font mixtures. Edit and save your work, or work with colleagues. Download Developing Monthly Marketing Innovative Business Promotion Ideas Diagrams Pdf and observe how to make your presentation outstanding. Give an impeccable presentation to your group and make your presentation unforgettable. The following slide showcases a comprehensive business to business B2B marketing budget which can be used to develop offline marketing strategies. It contains information about guerilla marketing, billboards, print ads, flyers, expected sales, and additional comments.
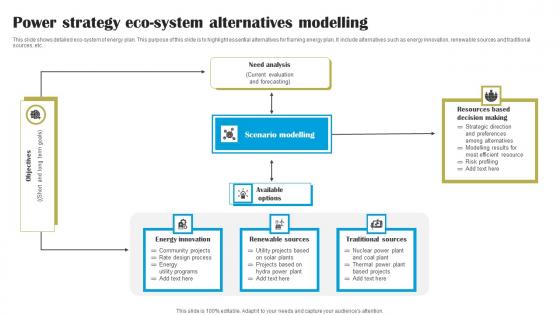
Power Strategy Eco System Alternatives Modelling Diagrams Pdf
This slide shows detailed eco system of energy plan. This purpose of this slide is to highlight essential alternatives for framing energy plan. It include alternatives such as energy innovation, renewable sources and traditional sources, etc.Showcasing this set of slides titled Power Strategy Eco System Alternatives Modelling Diagrams Pdf The topics addressed in these templates are Community Projects, Renewable Sources, Traditional Sources All the content presented in this PPT design is completely editable. Download it and make adjustments in color, background, font etc. as per your unique business setting. This slide shows detailed eco system of energy plan. This purpose of this slide is to highlight essential alternatives for framing energy plan. It include alternatives such as energy innovation, renewable sources and traditional sources, etc.
Magnifying Glass Big Data Analysis Ppt PowerPoint Presentation Diagram Templates
Presenting this set of slides with name magnifying glass big data analysis ppt powerpoint presentation diagram templates. This is a four stage process. The stages in this process are technology, marketing, planning, business, management. This is a completely editable PowerPoint presentation and is available for immediate download. Download now and impress your audience.
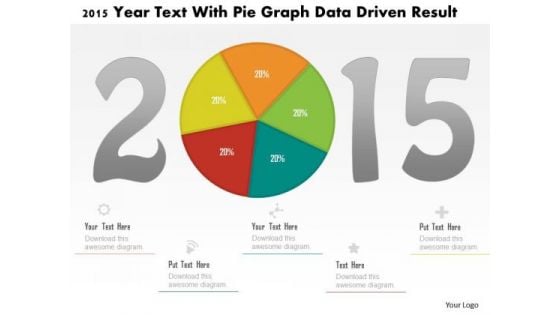
Business Diagram 2015 Year Text With Pie Graph Data Driven Result PowerPoint Slide
This business diagram displays 2015 year numbers with pie chart. This diagram is suitable to display business strategy for year 2015. Download this professional slide to present information in an attractive manner
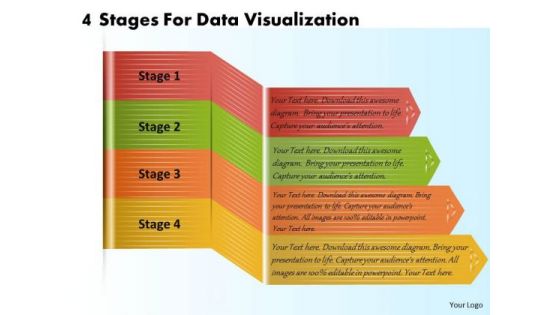
Business Plan And Strategy 4 Stages For Data Visualization Strategic Planning Template Ppt Slide
Your Listeners Will Never Doodle. Our business plan and strategy 4 stages for data visualization strategic planning template ppt slide Powerpoint Templates Will Hold Their Concentration. Do The One Thing With Your Thoughts. Uphold Custom With Our Process and Flows Powerpoint Templates.
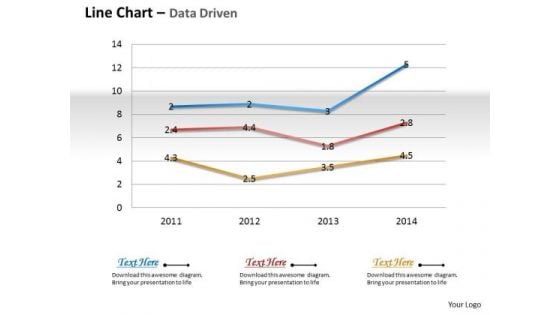
Business Data Analysis Chart Shows Changes Over The Time PowerPoint Templates
Document The Process On Our business data analysis chart shows changes over the time Powerpoint Templates. Make A Record Of Every Detail.
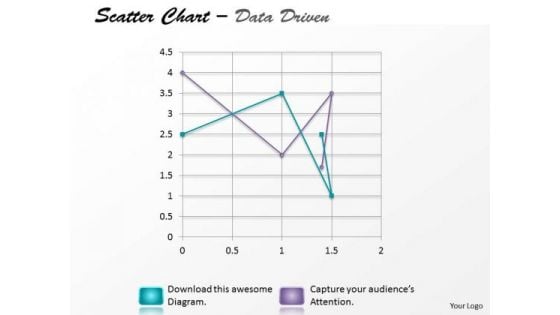
Data Analysis Excel Driven Multiple Series Scatter Chart PowerPoint Slides Templates
Your Listeners Will Never Doodle. Our data analysis excel driven multiple series scatter chart powerpoint slides Templates Will Hold Their Concentration.
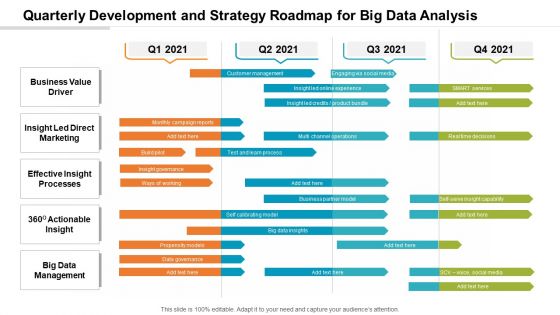
Quarterly Development And Strategy Roadmap For Big Data Analysis Designs
We present our quarterly development and strategy roadmap for big data analysis designs. This PowerPoint layout is easy-to-edit so you can change the font size, font type, color, and shape conveniently. In addition to this, the PowerPoint layout is Google Slides compatible, so you can share it with your audience and give them access to edit it. Therefore, download and save this well-researched quarterly development and strategy roadmap for big data analysis designs in different formats like PDF, PNG, and JPG to smoothly execute your business plan.

Toolkit For Data Science And Analytics Transition Data Analytics Value Stream Chain Pictures PDF
This slide illustrates the series of activities required for analyzing the data. It contains information such as data preparation, exploratory analysis, and predictive analytics etc. If you are looking for a format to display your unique thoughts, then the professionally designed Toolkit For Data Science And Analytics Transition Data Analytics Value Stream Chain Pictures PDF is the one for you. You can use it as a Google Slides template or a PowerPoint template. Incorporate impressive visuals, symbols, images, and other charts. Modify or reorganize the text boxes as you desire. Experiment with shade schemes and font pairings. Alter, share or cooperate with other people on your work. Download Toolkit For Data Science And Analytics Transition Data Analytics Value Stream Chain Pictures PDF and find out how to give a successful presentation. Present a perfect display to your team and make your presentation unforgettable.
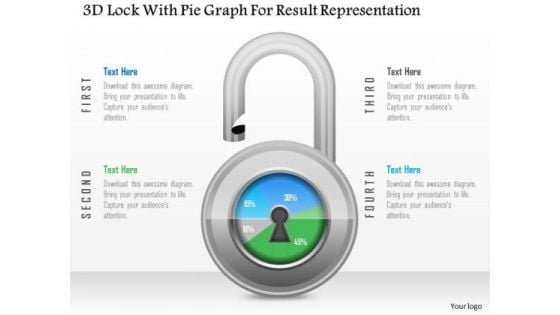
Business Diagram 3d Lock With Pie Graph For Result Representation PowerPoint Slide
This Power Point diagram has been crafted with pie chart in shape of lock. It contains diagram of lock pie chart to compare and present data in an effective manner. Use this diagram to build professional presentations for your viewers.
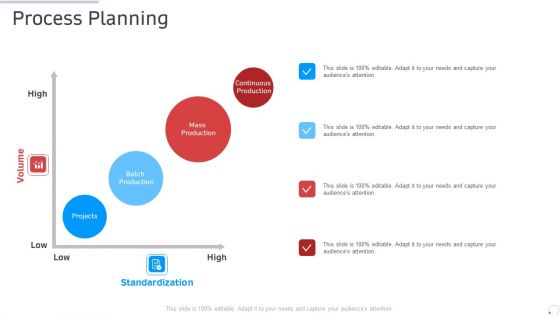
Process Planning Manufacturing Control Ppt Layouts Diagrams PDF
This is a process planning manufacturing control ppt layouts diagrams pdf template with various stages. Focus and dispense information on four stages using this creative set, that comes with editable features. It contains large content boxes to add your information on topics like projects, batch production, mass production, continuous production. You can also showcase facts, figures, and other relevant content using this PPT layout. Grab it now.

Data Mining Types Of Data Using Data Mining Tools To Optimize Processes AI SS V
This slide showcases various types of data which is potentially mined during data mining process, can be referred by various industrial experts. It provides details about data such as multimedia, text, web, spatiotemporal, etc. Retrieve professionally designed Data Mining Types Of Data Using Data Mining Tools To Optimize Processes AI SS V to effectively convey your message and captivate your listeners. Save time by selecting pre-made slideshows that are appropriate for various topics, from business to educational purposes. These themes come in many different styles, from creative to corporate, and all of them are easily adjustable and can be edited quickly. Access them as PowerPoint templates or as Google Slides themes. You do not have to go on a hunt for the perfect presentation because Slidegeeks got you covered from everywhere. This slide showcases various types of data which is potentially mined during data mining process, can be referred by various industrial experts. It provides details about data such as multimedia, text, web, spatiotemporal, etc.
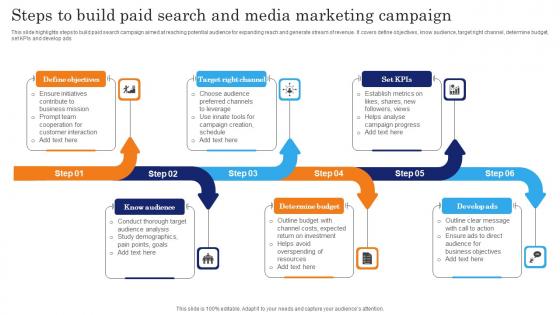
Steps To Build Paid Search And Media Marketing Campaign Themes Pdf
This slide highlights steps to build paid search campaign aimed at reaching potential audience for expanding reach and generate stream of revenue. It covers define objectives, know audience, target right channel, determine budget, set KPIs and develop ads Pitch your topic with ease and precision using this Steps To Build Paid Search And Media Marketing Campaign Themes Pdf. This layout presents information on Define Objectives, Right Channel, Determine Budget. It is also available for immediate download and adjustment. So, changes can be made in the color, design, graphics or any other component to create a unique layout. This slide highlights steps to build paid search campaign aimed at reaching potential audience for expanding reach and generate stream of revenue. It covers define objectives, know audience, target right channel, determine budget, set KPIs and develop ads
Data And Analysis Ppt PowerPoint Presentation Icon Diagrams
This is a Data And Analysis Ppt PowerPoint Presentation Icon Diagrams. This is a six stage process. The stages in this process are root cause analysis, opportunity analysis, timeline analysis, force field analysis.
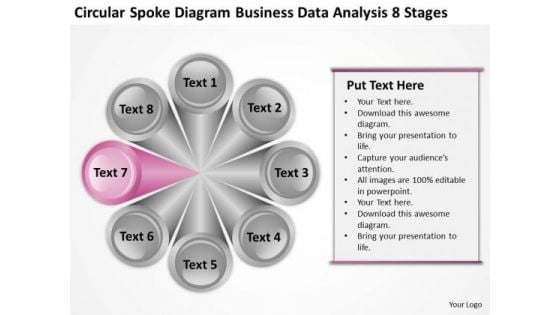
Spoke Diagram Business Data Analysis 8 Stages Plan PowerPoint Templates
We present our spoke diagram business data analysis 8 stages plan PowerPoint templates.Present our Finance PowerPoint Templates because You can Double your output with our PowerPoint Templates and Slides. They make beating deadlines a piece of cake. Download our Leadership PowerPoint Templates because Our PowerPoint Templates and Slides are aesthetically designed to attract attention. We gaurantee that they will grab all the eyeballs you need. Download our Circle Charts PowerPoint Templates because Our PowerPoint Templates and Slides will let your words and thoughts hit bullseye everytime. Use our Business PowerPoint Templates because It will mark the footprints of your journey. Illustrate how they will lead you to your desired destination. Use our Process and Flows PowerPoint Templates because Our PowerPoint Templates and Slides offer you the widest possible range of options.Use these PowerPoint slides for presentations relating to Chart, segmented, pie, hub, wheel, isolated, divided, business, communication, diagram, circle, graphic, process, element, tire, graph, marketing, illustration, icon, circular, round, clipart, design, success, set, spoke, button. The prominent colors used in the PowerPoint template are Purple, White, Gray. Ideas flow from our Spoke Diagram Business Data Analysis 8 Stages Plan PowerPoint Templates. They have the ability to be creative.
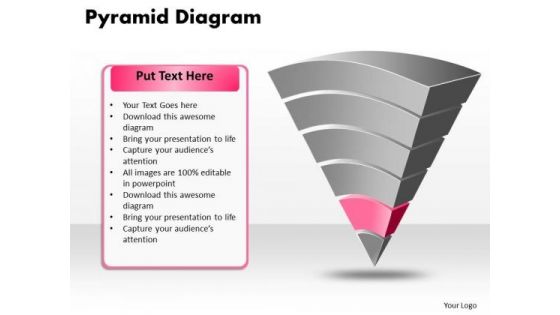
Ppt Pyramid Diagram Design PowerPoint Presentation Layout Templates
PPT pyramid diagram design powerpoint presentation layout Templates-Your ideas are fundamentally stable with a broad base of workable possibilities. Illustrate these thoughts with this slide. Discuss each one and slowly but surely move up the pyramid narrowing down to the best and most success oriented project.-PPT pyramid diagram design powerpoint presentation layout Templates-Business, Chart, Color, Data Pyramid, Diagram, Graph, Group, Growth, Hierarchy, Illustration, Layer, Layered, Layered Pyramid, Level, Multicolor, Object, Performance, Presentation, Progress, Pyramid, Rank, Seam, Segment, Set, Shape, Stage, Structure, Symbol, System, Top Foster good ethics with our Ppt Pyramid Diagram Design PowerPoint Presentation Layout Templates. Your thoughts will set an impeccable example.
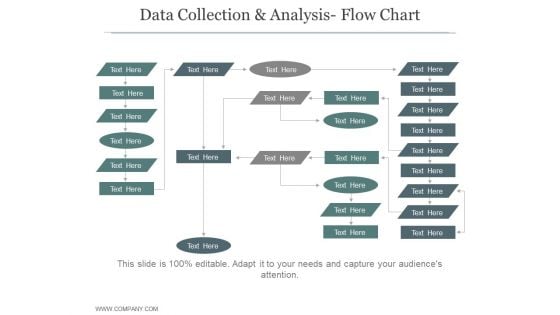
Data Collection And Analysis Flow Chart Ppt PowerPoint Presentation Sample
This is a data collection and analysis flow chart ppt powerpoint presentation sample. This is a five stage process. The stages in this process are business, strategy, marketing, process, growth strategy, finance.
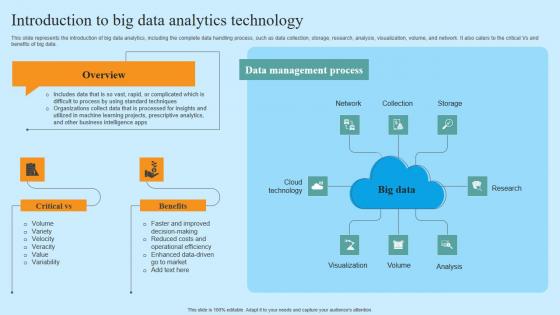
Introduction To Big Data Analytics Technology Hyper Automation Solutions Designs Pdf
This slide represents the introduction of big data analytics, including the complete data handling process, such as data collection, storage, research, analysis, visualization, volume, and network. It also caters to the critical Vs and benefits of big data. Retrieve professionally designed Introduction To Big Data Analytics Technology Hyper Automation Solutions Designs Pdf to effectively convey your message and captivate your listeners. Save time by selecting pre-made slideshows that are appropriate for various topics, from business to educational purposes. These themes come in many different styles, from creative to corporate, and all of them are easily adjustable and can be edited quickly. Access them as PowerPoint templates or as Google Slides themes. You do not have to go on a hunt for the perfect presentation because Slidegeeks got you covered from everywhere. This slide represents the introduction of big data analytics, including the complete data handling process, such as data collection, storage, research, analysis, visualization, volume, and network. It also caters to the critical Vs and benefits of big data.
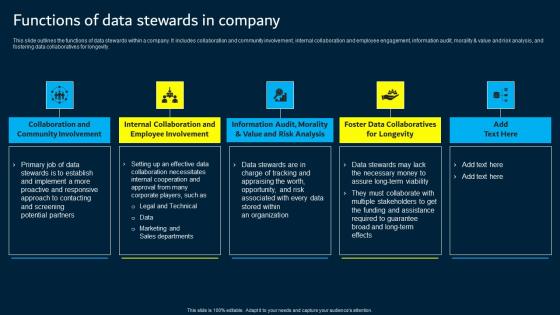
Functions Of Data Stewards In Company Data Custodianship Elements Pdf
This slide outlines the functions of data stewards within a company. It includes collaboration and community involvement, internal collaboration and employee engagement, information audit, morality and value and risk analysis, and fostering data collaboratives for longevity. Whether you have daily or monthly meetings, a brilliant presentation is necessary. Functions Of Data Stewards In Company Data Custodianship Elements Pdf can be your best option for delivering a presentation. Represent everything in detail using Functions Of Data Stewards In Company Data Custodianship Elements Pdf and make yourself stand out in meetings. The template is versatile and follows a structure that will cater to your requirements. All the templates prepared by Slidegeeks are easy to download and edit. Our research experts have taken care of the corporate themes as well. So, give it a try and see the results. This slide outlines the functions of data stewards within a company. It includes collaboration and community involvement, internal collaboration and employee engagement, information audit, morality and value and risk analysis, and fostering data collaboratives for longevity.
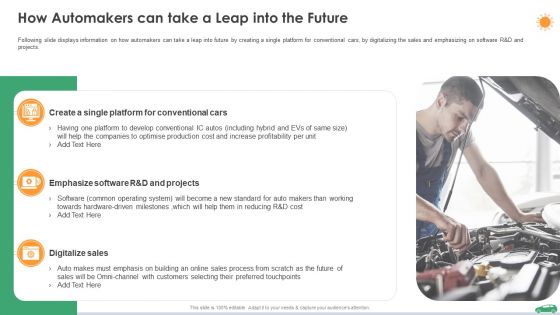
How Automakers Can Take A Leap Into The Future Ppt Pictures Objects PDF
Following slide displays information on how automakers can take a leap into future by creating a single platform for conventional cars, by digitalizing the sales and emphasizing on software R and D and projects. Deliver an awe inspiring pitch with this creative how automakers can take a leap into the future ppt pictures objects pdf bundle. Topics like software, develop, cost, process, customers can be discussed with this completely editable template. It is available for immediate download depending on the needs and requirements of the user.
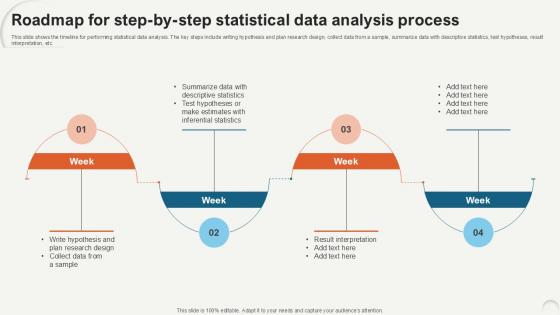
Roadmap For Step By Step Statistical Data Analytics For Informed Decision Ppt PowerPoint
This slide shows the timeline for performing statistical data analysis. The key steps include writing hypothesis and plan research design, collect data from a sample, summarize data with descriptive statistics, test hypotheses, result interpretation, etc. Retrieve professionally designed Roadmap For Step By Step Statistical Data Analytics For Informed Decision Ppt PowerPoint to effectively convey your message and captivate your listeners. Save time by selecting pre-made slideshows that are appropriate for various topics, from business to educational purposes. These themes come in many different styles, from creative to corporate, and all of them are easily adjustable and can be edited quickly. Access them as PowerPoint templates or as Google Slides themes. You do not have to go on a hunt for the perfect presentation because Slidegeeks got you covered from everywhere. This slide shows the timeline for performing statistical data analysis. The key steps include writing hypothesis and plan research design, collect data from a sample, summarize data with descriptive statistics, test hypotheses, result interpretation, etc.
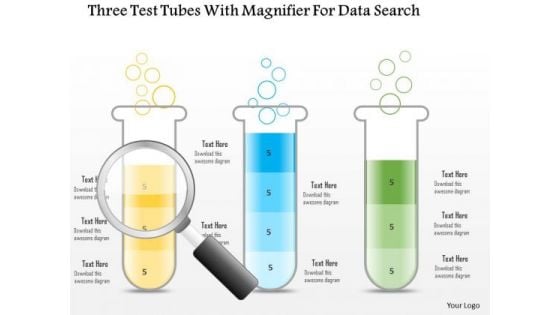
Business Diagram Three Test Tubes With Magnifier For Data Search PowerPoint Slide
This business diagram displays three test tubes with magnifying glass. This diagram is suitable to depict flow of business activities or steps. Download this professional slide to present information in an attractive manner.
Business Analysis Data Monitoring Vector Icon Ppt Powerpoint Presentation Ideas Design Ideas
This is a business analysis data monitoring vector icon ppt powerpoint presentation ideas design ideas. This is a one stage process. The stages in this process are feedback loop icon, evaluation icon, assessment icon.
Future Outlook For Islamic Financing A Detailed Knowledge Of Islamic Finance Icons Pdf
This slide covers the details related to Islamic financing and its positive outlook, with the industry expected to continue growing and expanding in the coming years. It consists of information related to technology, population growth, etc. Formulating a presentation can take up a lot of effort and time, so the content and message should always be the primary focus. The visuals of the PowerPoint can enhance the presenters message, so our Future Outlook For Islamic Financing A Detailed Knowledge Of Islamic Finance Icons Pdf was created to help save time. Instead of worrying about the design, the presenter can concentrate on the message while our designers work on creating the ideal templates for whatever situation is needed. Slidegeeks has experts for everything from amazing designs to valuable content, we have put everything into Future Outlook For Islamic Financing A Detailed Knowledge Of Islamic Finance Icons Pdf This slide covers the details related to Islamic financing and its positive outlook, with the industry expected to continue growing and expanding in the coming years. It consists of information related to technology, population growth, etc.
Six Steps Of Bidding Process With Icons Ppt PowerPoint Presentation Pictures Guide
Presenting this set of slides with name six steps of bidding process with icons ppt powerpoint presentation pictures guide. This is a six stage process. The stages in this process are develop bid specifications, qualifying vendors, develop bid summary, present bid summary to board, award the project. This is a completely editable PowerPoint presentation and is available for immediate download. Download now and impress your audience.

Data Mining Techniques Clustering Method Using Data Mining Tools To Optimize Processes AI SS V
This slide showcases clustering data mining technique to help data experts ease their data sorting tasks to get actionable insights. It provides details about partitioning, hierarchal, density, grid, etc. Are you searching for a Data Mining Techniques Clustering Method Using Data Mining Tools To Optimize Processes AI SS V that is uncluttered, straightforward, and original Its easy to edit, and you can change the colors to suit your personal or business branding. For a presentation that expresses how much effort you have put in, this template is ideal With all of its features, including tables, diagrams, statistics, and lists, its perfect for a business plan presentation. Make your ideas more appealing with these professional slides. Download Data Mining Techniques Clustering Method Using Data Mining Tools To Optimize Processes AI SS V from Slidegeeks today. This slide showcases clustering data mining technique to help data experts ease their data sorting tasks to get actionable insights. It provides details about partitioning, hierarchal, density, grid, etc.
Real Estate Asset Management US Housing Market Predictions Ppt Icon Show PDF
Presenting real estate asset management us housing market predictions ppt icon show pdf to provide visual cues and insights. Share and navigate important information on two stages that need your due attention. This template can be used to pitch topics like new construction, millennials are driving the market. In addtion, this PPT design contains high resolution images, graphics, etc, that are easily editable and available for immediate download.

Third Approach Streaming Data Integration Data Integration Strategies For Business
This slide talks about the streaming data integration process. The purpose of this slide is to explain the third method used in data extraction, here, data is continuously transferred in real-time from sources to target without any batch loading hence saving time. Whether you have daily or monthly meetings, a brilliant presentation is necessary. Third Approach Streaming Data Integration Data Integration Strategies For Business can be your best option for delivering a presentation. Represent everything in detail using Third Approach Streaming Data Integration Data Integration Strategies For Business and make yourself stand out in meetings. The template is versatile and follows a structure that will cater to your requirements. All the templates prepared by Slidegeeks are easy to download and edit. Our research experts have taken care of the corporate themes as well. So, give it a try and see the results. This slide talks about the streaming data integration process. The purpose of this slide is to explain the third method used in data extraction, here, data is continuously transferred in real-time from sources to target without any batch loading hence saving time.
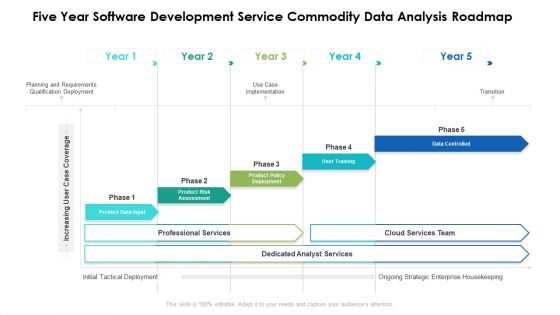
Five Year Software Development Service Commodity Data Analysis Roadmap Clipart
Presenting our innovatively structured five year software development service commodity data analysis roadmap clipart Template. Showcase your roadmap process in different formats like PDF, PNG, and JPG by clicking the download button below. This PPT design is available in both Standard Screen and Widescreen aspect ratios. It can also be easily personalized and presented with modified font size, font type, color, and shapes to measure your progress in a clear way.
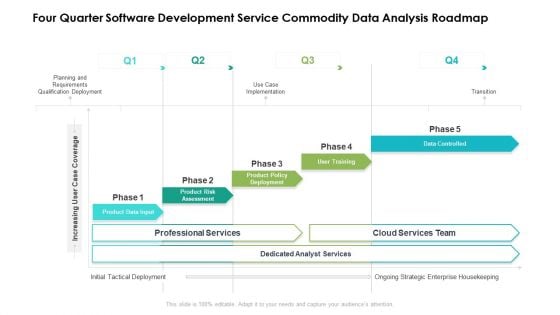
Four Quarter Software Development Service Commodity Data Analysis Roadmap Brochure
Presenting our innovatively structured four quarter software development service commodity data analysis roadmap brochure Template. Showcase your roadmap process in different formats like PDF, PNG, and JPG by clicking the download button below. This PPT design is available in both Standard Screen and Widescreen aspect ratios. It can also be easily personalized and presented with modified font size, font type, color, and shapes to measure your progress in a clear way.
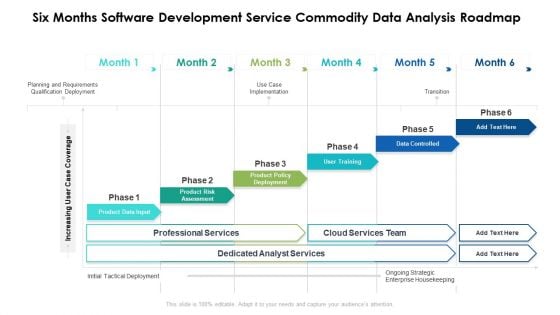
Six Months Software Development Service Commodity Data Analysis Roadmap Introduction
Presenting our innovatively structured six months software development service commodity data analysis roadmap introduction Template. Showcase your roadmap process in different formats like PDF, PNG, and JPG by clicking the download button below. This PPT design is available in both Standard Screen and Widescreen aspect ratios. It can also be easily personalized and presented with modified font size, font type, color, and shapes to measure your progress in a clear way.
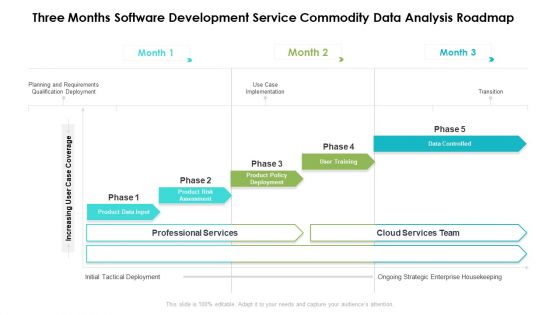
Three Months Software Development Service Commodity Data Analysis Roadmap Clipart
Presenting our innovatively structured three months software development service commodity data analysis roadmap clipart Template. Showcase your roadmap process in different formats like PDF, PNG, and JPG by clicking the download button below. This PPT design is available in both Standard Screen and Widescreen aspect ratios. It can also be easily personalized and presented with modified font size, font type, color, and shapes to measure your progress in a clear way.
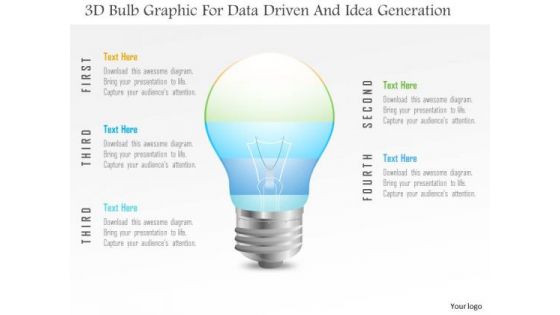
Business Diagram 3d Bulb Graphic For Data Driven And Idea Generation PowerPoint Slide
This Power Point template has been designed with 3d bulb graphic. Use this slide to represent technology idea and strategy concepts. Download this diagram for your business presentations and get exclusive comments on your efforts.
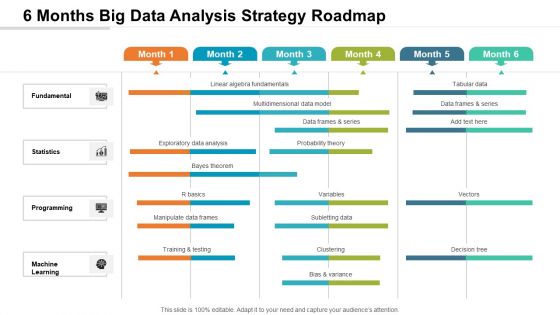
6 Months Big Data Analysis Strategy Roadmap Diagrams
We present our 6 months big data analysis strategy roadmap diagrams. This PowerPoint layout is easy-to-edit so you can change the font size, font type, color, and shape conveniently. In addition to this, the PowerPoint layout is Google Slides compatible, so you can share it with your audience and give them access to edit it. Therefore, download and save this well-researched 6 months big data analysis strategy roadmap diagrams in different formats like PDF, PNG, and JPG to smoothly execute your business plan.

Comparative Analysis Of Quantitative And Qualitative Data Analysis Pictures PDF
Presenting Comparative Analysis Of Quantitative And Qualitative Data Analysis Pictures PDF to dispense important information. This template comprises five stages. It also presents valuable insights into the topics including Data Format, Analysis, Definition. This is a completely customizable PowerPoint theme that can be put to use immediately. So, download it and address the topic impactfully.
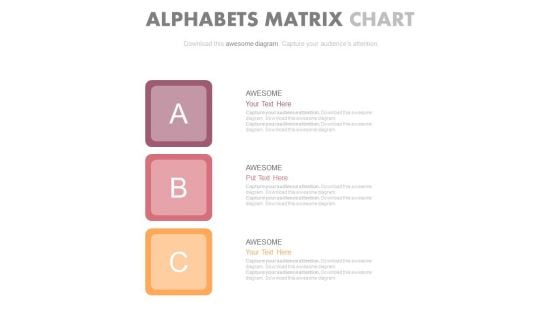
Abc Steps Chart For Data Analysis Powerpoint Slides
Our above PPT slide contains graphics of ABC steps chart. This business diagram helps to depict business information for strategic management. Use this diagram to impart more clarity to data and to create more sound impact on viewers.
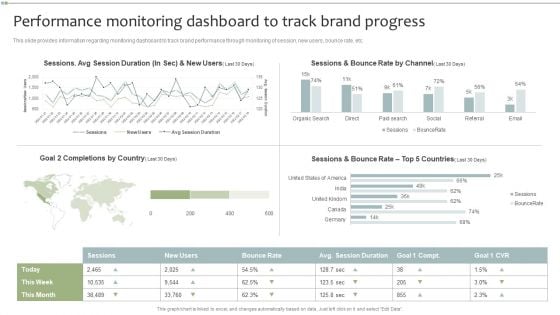
Brand Maintenance Toolkit Performance Monitoring Dashboard To Track Brand Progress Elements PDF
This slide provides information regarding monitoring dashboard to track brand performance through monitoring of session, new users, bounce rate, etc. Deliver an awe inspiring pitch with this creative Brand Maintenance Toolkit Performance Monitoring Dashboard To Track Brand Progress Elements PDF bundle. Topics like Performance Monitoring Dashboard, Track Brand Progress can be discussed with this completely editable template. It is available for immediate download depending on the needs and requirements of the user.
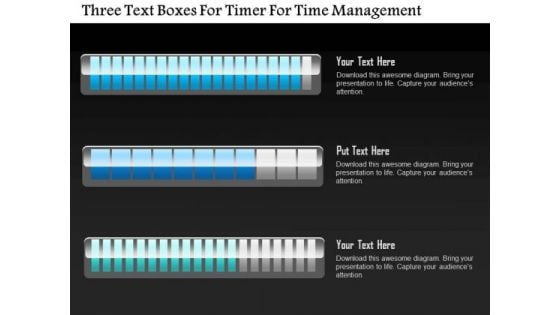
Business Diagram Three Text Boxes For Timer For Time Management PowerPoint Slide
This business diagram displays three text boxes. This diagram contains text boxes for data representation. Use this diagram to display business process workflows in any presentations.
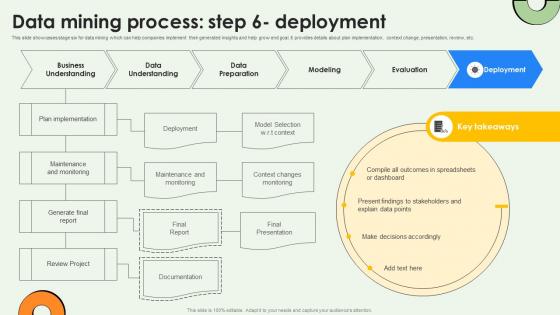
Data Mining Process Step 6 Deployment Data Warehousing And Data Mining Guide AI SS V
This slide showcases stage six for data mining which can help companies implement their generated insights and help grow end goal. It provides details about plan implementation, context change, presentation, review, etc. Whether you have daily or monthly meetings, a brilliant presentation is necessary. Data Mining Process Step 6 Deployment Data Warehousing And Data Mining Guide AI SS V can be your best option for delivering a presentation. Represent everything in detail using Data Mining Process Step 6 Deployment Data Warehousing And Data Mining Guide AI SS V and make yourself stand out in meetings. The template is versatile and follows a structure that will cater to your requirements. All the templates prepared by Slidegeeks are easy to download and edit. Our research experts have taken care of the corporate themes as well. So, give it a try and see the results. This slide showcases stage six for data mining which can help companies implement their generated insights and help grow end goal. It provides details about plan implementation, context change, presentation, review, etc.
Identify Value Impacting Deliverables Icons PDF
This template covers the guidelines for identifying and validating the top three to five value-added IT services apps or projects. Presenting identify value impacting deliverables icons pdf to provide visual cues and insights. Share and navigate important information on three stages that need your due attention. This template can be used to pitch topics like transaction systems, optimization, service, risk mitigation, revenue impact. In addtion, this PPT design contains high resolution images, graphics, etc, that are easily editable and available for immediate download.
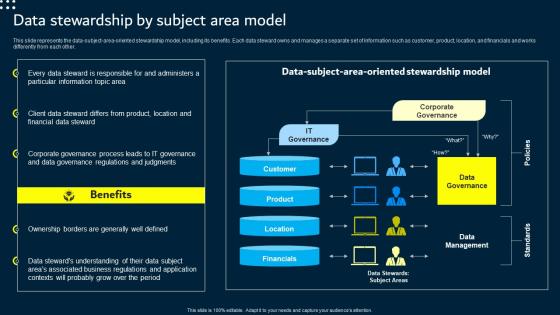
Data Stewardship By Subject Area Model Data Custodianship Infographics Pdf
This slide represents the data subject area oriented stewardship model, including its benefits. Each data steward owns and manages a separate set of information such as customer, product, location, and financials and works differently from each other. Do you know about Slidesgeeks Data Stewardship By Subject Area Model Data Custodianship Infographics Pdf These are perfect for delivering any kind od presentation. Using it, create PowerPoint presentations that communicate your ideas and engage audiences. Save time and effort by using our pre designed presentation templates that are perfect for a wide range of topic. Our vast selection of designs covers a range of styles, from creative to business, and are all highly customizable and easy to edit. Download as a PowerPoint template or use them as Google Slides themes. This slide represents the data subject area oriented stewardship model, including its benefits. Each data steward owns and manages a separate set of information such as customer, product, location, and financials and works differently from each other.
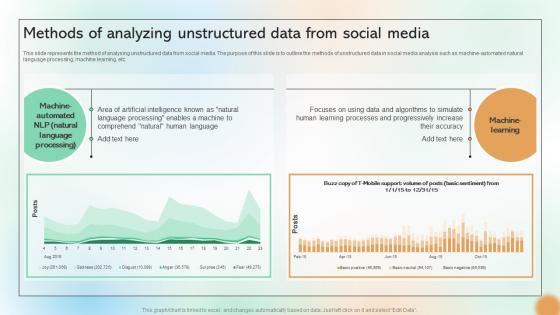
Methods Of Analyzing Unstructured Data From Social Media Cracking The Code Of Social Media
This slide represents the method of analysing unstructured data from social media. The purpose of this slide is to outline the methods of unstructured data in social media analysis such as machine automated natural language processing, machine learning, etc. Want to ace your presentation in front of a live audience Our Methods Of Analyzing Unstructured Data From Social Media Cracking The Code Of Social Media can help you do that by engaging all the users towards you. Slidegeeks experts have put their efforts and expertise into creating these impeccable powerpoint presentations so that you can communicate your ideas clearly. Moreover, all the templates are customizable, and easy-to-edit and downloadable. Use these for both personal and commercial use. This slide represents the method of analysing unstructured data from social media. The purpose of this slide is to outline the methods of unstructured data in social media analysis such as machine automated natural language processing, machine learning, etc.
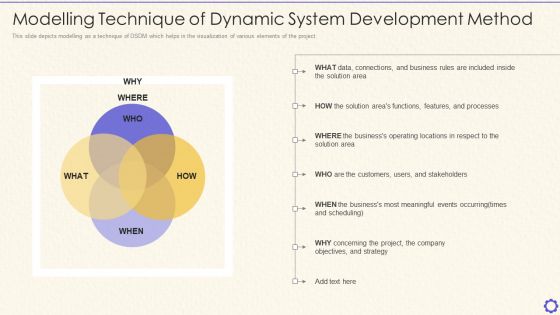
Dynamic System Development Method Tools And Techniques IT Modelling Technique Of Dynamic Structure PDF
This slide depicts modelling as a technique of DSDM which helps in the visualization of various elements of the project. This is a dynamic system development method tools and techniques it modelling technique of dynamic structure pdf template with various stages. Focus and dispense information on four stages using this creative set, that comes with editable features. It contains large content boxes to add your information on topics like connections, business, operating, locations, stakeholders. You can also showcase facts, figures, and other relevant content using this PPT layout. Grab it now.

Prescriptive Analytics Software Tool Tableau Data Analytics SS V
This slide provides overview of Tableau as a data analytics tools providing data visualization features. It covers details of Tableau regarding description, features and pricing plans.Retrieve professionally designed Prescriptive Analytics Software Tool Tableau Data Analytics SS V to effectively convey your message and captivate your listeners. Save time by selecting pre-made slideshows that are appropriate for various topics, from business to educational purposes. These themes come in many different styles, from creative to corporate, and all of them are easily adjustable and can be edited quickly. Access them as PowerPoint templates or as Google Slides themes. You do not have to go on a hunt for the perfect presentation because Slidegeeks got you covered from everywhere. This slide provides overview of Tableau as a data analytics tools providing data visualization features. It covers details of Tableau regarding description, features and pricing plans.
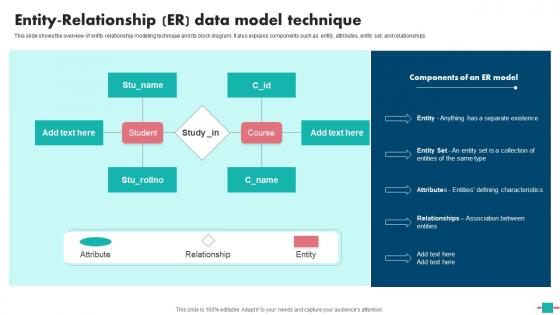
Database Modeling Entity Relationship ER Data Model Technique Guidelines Pdf
This slide shows the overview of entity relationship modeling technique and its block diagram. It also explains components such as entity, attributes, entity set, and relationships. Get a simple yet stunning designed Database Modeling Entity Relationship ER Data Model Technique Guidelines Pdf. It is the best one to establish the tone in your meetings. It is an excellent way to make your presentations highly effective. So, download this PPT today from Slidegeeks and see the positive impacts. Our easy to edit Database Modeling Entity Relationship ER Data Model Technique Guidelines Pdf can be your go to option for all upcoming conferences and meetings. So, what are you waiting for Grab this template today. This slide shows the overview of entity relationship modeling technique and its block diagram. It also explains components such as entity, attributes, entity set, and relationships.
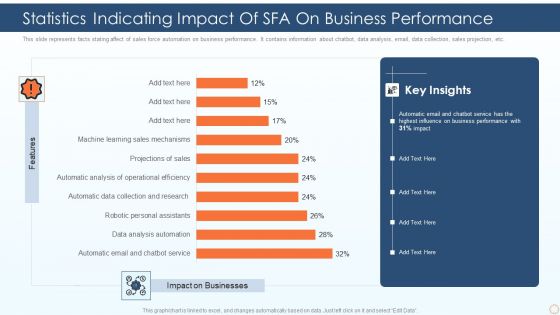
Statistics Indicating Impact Of SFA On Business Performance Ppt PowerPoint Presentation Gallery Outfit PDF
This slide represents facts stating affect of sales force automation on business performance. It contains information about chatbot, data analysis, email, data collection, sales projection, etc. Pitch your topic with ease and precision using this statistics indicating impact of sfa on business performance ppt powerpoint presentation gallery outfit pdf. This layout presents information on automatic email and chatbot service, data analysis automation, robotic personal assistants. It is also available for immediate download and adjustment. So, changes can be made in the color, design, graphics or any other component to create a unique layout.
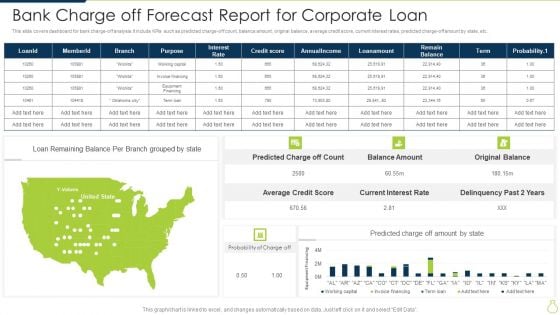
Bank Charge Off Forecast Report For Corporate Loan Diagrams PDF
This slide covers dashboard for bank charge-off analysis. It include KPIs such as predicted charge-off count, balance amount, original balance, average credit score, current interest rates, predicted charge off amount by state, etc. Showcasing this set of slides titled Bank Charge Off Forecast Report For Corporate Loan Diagrams PDF. The topics addressed in these templates are Balance Amount, Original Balance, Delinquency Past. All the content presented in this PPT design is completely editable. Download it and make adjustments in color, background, font etc. as per your unique business setting.
IT Security Analysis Icon With Magnifying Glass Introduction PDF
Presenting IT Security Analysis Icon With Magnifying Glass Introduction PDF to dispense important information. This template comprises three stages. It also presents valuable insights into the topics including IT Security Analysis Icon, Magnifying Glass. This is a completely customizable PowerPoint theme that can be put to use immediately. So, download it and address the topic impactfully.
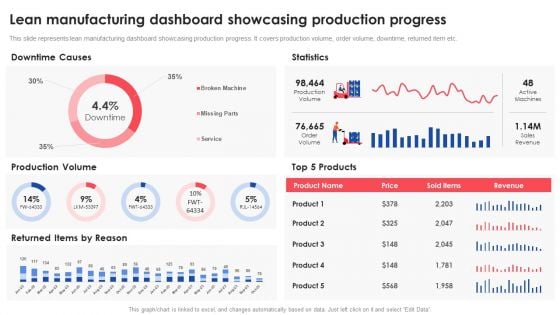
Lean Manufacturing Dashboard Showcasing Production Progress Deploying And Managing Lean Professional PDF
This slide represents lean manufacturing dashboard showcasing production progress. It covers production volume, order volume, downtime, returned item etc.Deliver and pitch your topic in the best possible manner with this Lean Manufacturing Dashboard Showcasing Production Progress Deploying And Managing Lean Professional PDF. Use them to share invaluable insights on Production Volume, Downtime Causes, Returned Items and impress your audience. This template can be altered and modified as per your expectations. So, grab it now.
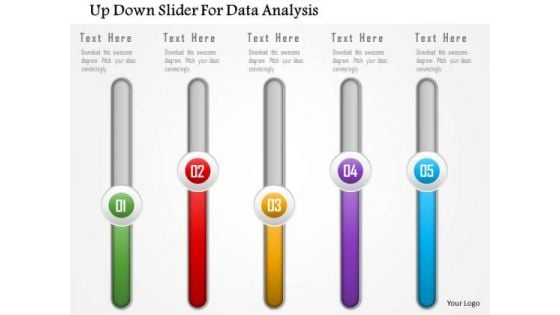
Business Diagram Up Down Slider For Data Analysis Presentation Template
This business diagram has been designed with graphics of slider. You may download this professional slide to display data trends. Transmit your thoughts via this slide.
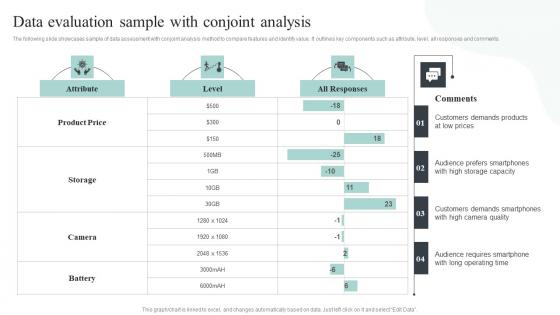
Competitive Intelligence Guide To Determine Market Data Evaluation Sample With Conjoint Information Pdf
The following slide showcases sample of data assessment with conjoint analysis method to compare features and identify value. It outlines key components such as attribute, level, all responses and comments. From laying roadmaps to briefing everything in detail, our templates are perfect for you. You can set the stage with your presentation slides. All you have to do is download these easy-to-edit and customizable templates. Competitive Intelligence Guide To Determine Market Data Evaluation Sample With Conjoint Information Pdf will help you deliver an outstanding performance that everyone would remember and praise you for. Do download this presentation today. The following slide showcases sample of data assessment with conjoint analysis method to compare features and identify value. It outlines key components such as attribute, level, all responses and comments.
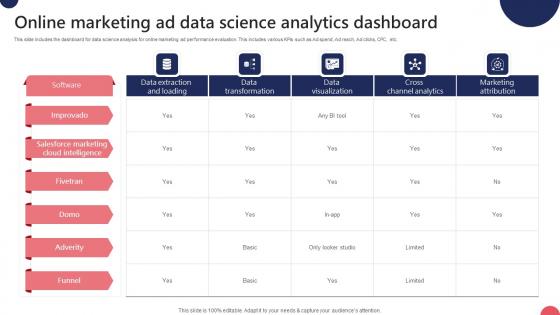
Online Marketing Ad Data Science Analytics Dashboard Ppt Inspiration Guidelines Pdf
This slide includes the dashboard for data science analysis for online marketing ad performance evaluation. This includes various KPIs such as Ad spend, Ad reach, Ad clicks, CPC, etc. Pitch your topic with ease and precision using this Online Marketing Ad Data Science Analytics Dashboard Ppt Inspiration Guidelines Pdf. This layout presents information on Ad Spend, Cost Per Thousand, Cost Per Click. It is also available for immediate download and adjustment. So, changes can be made in the color, design, graphics or any other component to create a unique layout. This slide includes the dashboard for data science analysis for online marketing ad performance evaluation. This includes various KPIs such as Ad spend, Ad reach, Ad clicks, CPC, etc.
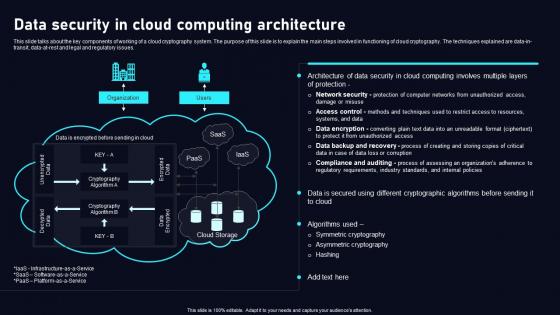
Data Security In Cloud Computing Cloud Data Security Using Cryptography Formats Pdf
This slide talks about the key components of working of a cloud cryptography system. The purpose of this slide is to explain the main steps involved in functioning of cloud cryptography. The techniques explained are data in transit, data at rest and legal and regulatory issues. Retrieve professionally designed Data Security In Cloud Computing Cloud Data Security Using Cryptography Formats Pdf to effectively convey your message and captivate your listeners. Save time by selecting pre made slideshows that are appropriate for various topics, from business to educational purposes. These themes come in many different styles, from creative to corporate, and all of them are easily adjustable and can be edited quickly. Access them as PowerPoint templates or as Google Slides themes. You do not have to go on a hunt for the perfect presentation because Slidegeeks got you covered from everywhere. This slide talks about the key components of working of a cloud cryptography system. The purpose of this slide is to explain the main steps involved in functioning of cloud cryptography. The techniques explained are data in transit, data at rest and legal and regulatory issues.
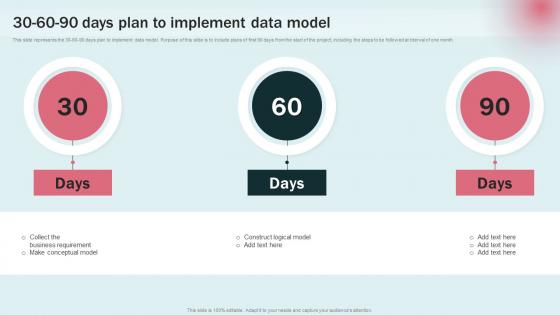
30 60 90 Days Plan To Implement Data Modeling Approaches For Modern Analytics Guidelines Pdf
This slide represents the 30 60 90 days plan to implement data model. Purpose of this slide is to include plans of first 90 days from the start of the project, including the steps to be followed at interval of one month. Find a pre designed and impeccable 30 60 90 Days Plan To Implement Data Modeling Approaches For Modern Analytics Guidelines Pdf. The templates can ace your presentation without additional effort. You can download these easy to edit presentation templates to make your presentation stand out from others. So, what are you waiting for Download the template from Slidegeeks today and give a unique touch to your presentation. This slide represents the 30 60 90 days plan to implement data model. Purpose of this slide is to include plans of first 90 days from the start of the project, including the steps to be followed at interval of one month.
Macro Environmental Level Threat Detection And Analysis Icon Demonstration PDF
Presenting Macro Environmental Level Threat Detection And Analysis Icon Demonstration PDF to dispense important information. This template comprises three stages. It also presents valuable insights into the topics including Macro Environmental, Level Threat, Detection And Analysis. This is a completely customizable PowerPoint theme that can be put to use immediately. So, download it and address the topic impactfully.


 Continue with Email

 Home
Home


