Kpi Dashboard
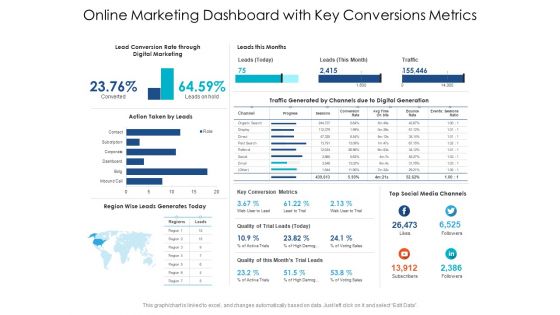
Online Marketing Dashboard With Key Conversions Metrics Ppt PowerPoint Presentation Gallery File Formats PDF
Presenting this set of slides with name online marketing dashboard with key conversions metrics ppt powerpoint presentation gallery file formats pdf. The topics discussed in these slides are Lead Conversion Rate through Digital Marketing, Leads this Months, Action Taken by Leads, Key Conversion Metrics, Quality of Trial Leads, Quality of this Months Trial leads. This is a completely editable PowerPoint presentation and is available for immediate download. Download now and impress your audience.
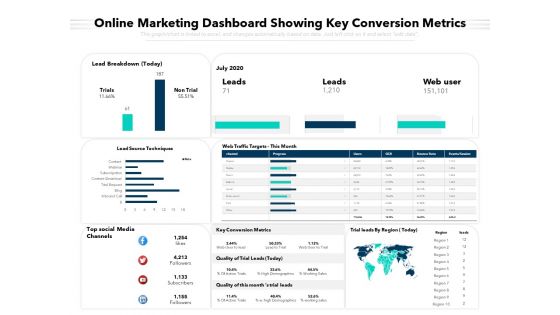
Online Marketing Dashboard Showing Key Conversion Metrics Ppt PowerPoint Presentation Outline Example Topics PDF
Pitch your topic with ease and precision using this online marketing dashboard showing key conversion metrics ppt powerpoint presentation outline example topics pdf. This layout presents information on lead breakdown, leads, web user, top social media channels, key conversion metrics, trial leads by region. It is also available for immediate download and adjustment. So, changes can be made in the color, design, graphics or any other component to create a unique layout.
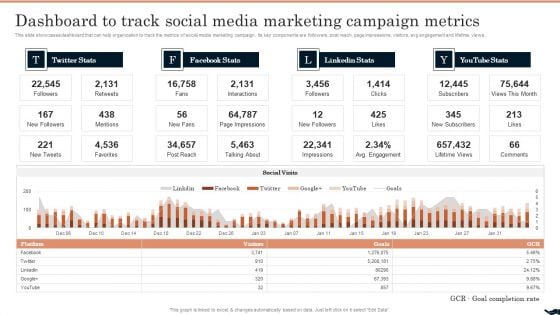
Generating Leads Through Dashboard To Track Social Media Marketing Campaign Metrics Pictures PDF
This slide showcases dashboard that can help organization to track the metrics of social media marketing campaign. Its key components are followers, post reach, page impressions, visitors, avg engagement and lifetime views. Present like a pro with Generating Leads Through Dashboard To Track Social Media Marketing Campaign Metrics Pictures PDF Create beautiful presentations together with your team, using our easy-to-use presentation slides. Share your ideas in real-time and make changes on the fly by downloading our templates. So whether youre in the office, on the go, or in a remote location, you can stay in sync with your team and present your ideas with confidence. With Slidegeeks presentation got a whole lot easier. Grab these presentations today.
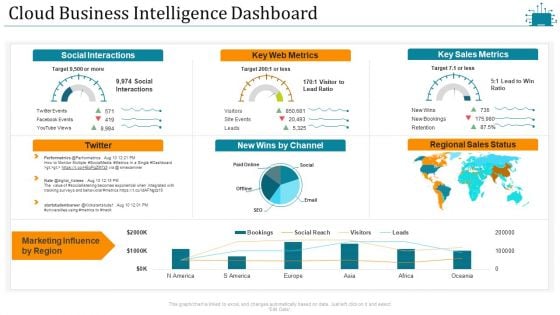
Cloud Intelligence Framework For Application Consumption Cloud Business Intelligence Dashboard Slides PDF
Deliver an awe inspiring pitch with this creative cloud intelligence framework for application consumption cloud business intelligence dashboard slides pdf bundle. Topics like social interactions, key web metrics, key sales metrics, marketing influence by region can be discussed with this completely editable template. It is available for immediate download depending on the needs and requirements of the user.
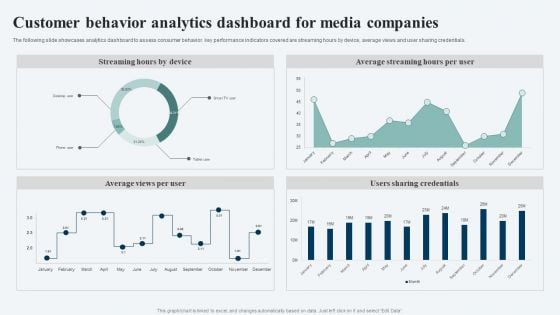
Customer Behavior Analytics Dashboard For Media Companies Ppt Ideas Visuals PDF
The following slide showcases analytics dashboard to assess consumer behavior. key performance indicators covered are streaming hours by device, average views and user sharing credentials. Showcasing this set of slides titled Customer Behavior Analytics Dashboard For Media Companies Ppt Ideas Visuals PDF. The topics addressed in these templates are Streaming Hours Device, Average Streaming Hours, Per User, Users Sharing Credentials. All the content presented in this PPT design is completely editable. Download it and make adjustments in color, background, font etc. as per your unique business setting.
Shipping And Logistics Tracking Dashboard With Shipments And Fleet Status Elements PDF
This slide covers Key performance indicators to track the automation system of the company. This dashboard includes Logistics Efficiency Status, delivery time accuracy etc. Take your projects to the next level with our ultimate collection of Shipping And Logistics Tracking Dashboard With Shipments And Fleet Status Elements PDF. Slidegeeks has designed a range of layouts that are perfect for representing task or activity duration, keeping track of all your deadlines at a glance. Tailor these designs to your exact needs and give them a truly corporate look with your own brand colors they ll make your projects stand out from the rest.
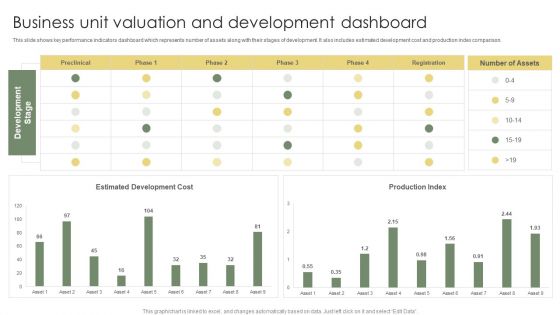
Business Unit Valuation And Development Dashboard Ppt Professional Graphic Tips PDF
This slide shows key performance indicators dashboard which represents number of assets along with their stages of development. It also includes estimated development cost and production index comparison. Pitch your topic with ease and precision using this Business Unit Valuation And Development Dashboard Ppt Professional Graphic Tips PDF. This layout presents information on Estimated Development Cost, Production Index, Development Stage. It is also available for immediate download and adjustment. So, changes can be made in the color, design, graphics or any other component to create a unique layout.
Robotic Process Automation Shipping And Logistics Tracking Dashboard With Shipments Clipart PDF
This slide covers Key performance indicators to track the automation system of the company. This dashboard includes Logistics Efficiency Status, delivery time accuracy etc. If your project calls for a presentation, then Slidegeeks is your go-to partner because we have professionally designed, easy-to-edit templates that are perfect for any presentation. After downloading, you can easily edit Robotic Process Automation Shipping And Logistics Tracking Dashboard With Shipments Clipart PDF and make the changes accordingly. You can rearrange slides or fill them with different images. Check out all the handy templates
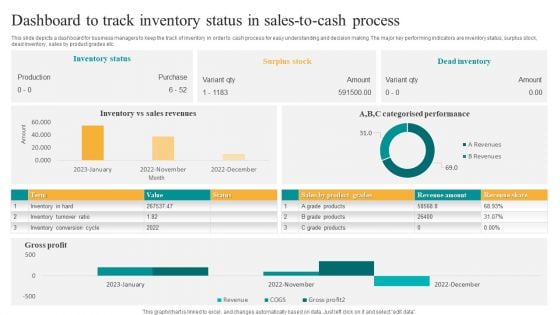
Dashboard To Track Inventory Status In Sales To Cash Process Themes PDF
This slide depicts a dashboard for business managers to keep the track of inventory in order to cash process for easy understanding and decision making. The major key performing indicators are inventory status, surplus stock, dead inventory, sales by product grades etc. Showcasing this set of slides titled Dashboard To Track Inventory Status In Sales To Cash Process Themes PDF. The topics addressed in these templates are Inventory Status, Surplus Stock, Dead Inventory. All the content presented in this PPT design is completely editable. Download it and make adjustments in color, background, font etc. as per your unique business setting.
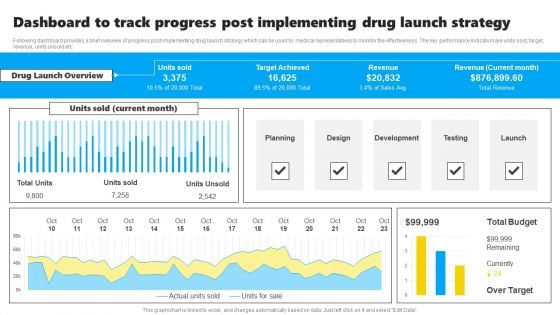
Dashboard To Track Progress Post Implementing Drug Launch Strategy Slides PDF
Following dashboard provides a brief overview of progress post implementing drug launch strategy which can be used by medical representatives to monitor the effectiveness. The key performance indicators are units sold, target, revenue, units unsold etc. Showcasing this set of slides titled Dashboard To Track Progress Post Implementing Drug Launch Strategy Slides PDF. The topics addressed in these templates are Planning, Design, Development, Testing, Launch. All the content presented in this PPT design is completely editable. Download it and make adjustments in color, background, font etc. as per your unique business setting.
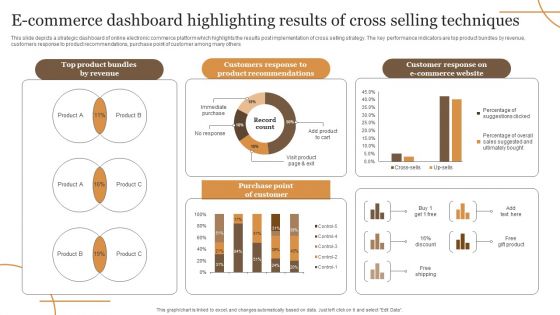
E Commerce Dashboard Highlighting Results Of Cross Selling Techniques Elements PDF
This slide depicts a strategic dashboard of online electronic commerce platform which highlights the results post implementation of cross selling strategy. The key performance indicators are top product bundles by revenue, customers response to product recommendations, purchase point of customer among many others. Showcasing this set of slides titled E Commerce Dashboard Highlighting Results Of Cross Selling Techniques Elements PDF. The topics addressed in these templates are Revenue, E Commerce Website, Purchase. All the content presented in this PPT design is completely editable. Download it and make adjustments in color, background, font etc. as per your unique business setting.
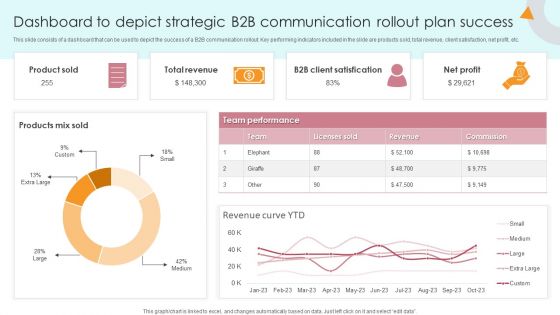
Dashboard To Depict Strategic B2B Communication Rollout Plan Success Portrait PDF
This slide consists of a dashboard that can be used to depict the success of a B2B communication rollout. Key performing indicators included in the slide are products sold, total revenue, client satisfaction, net profit, etc. Showcasing this set of slides titled Dashboard To Depict Strategic B2B Communication Rollout Plan Success Portrait PDF. The topics addressed in these templates are Product Sold, Total Revenue, B2b Client Satisfication. All the content presented in this PPT design is completely editable. Download it and make adjustments in color, background, font etc. as per your unique business setting.
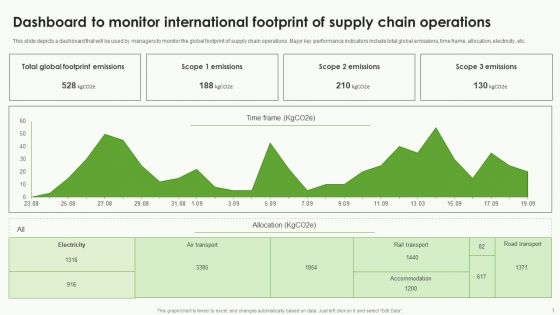
Dashboard To Monitor International Footprint Of Supply Chain Operations Brochure PDF
This slide depicts a dashboard that will be used by managers to monitor the global footprint of supply chain operations. Major key performance indicators include total global emissions, time frame, allocation, electricity, etc. Showcasing this set of slides titled Dashboard To Monitor International Footprint Of Supply Chain Operations Brochure PDF. The topics addressed in these templates are Electricity, Footprint Emissions, Allocation. All the content presented in this PPT design is completely editable. Download it and make adjustments in color, background, font etc. as per your unique business setting.
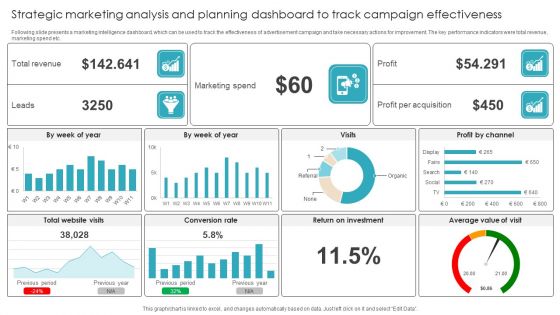
Strategic Marketing Analysis And Planning Dashboard To Track Campaign Effectiveness Summary PDF
Following slide presents a marketing intelligence dashboard, which can be used to track the effectiveness of advertisement campaign and take necessary actions for improvement. The key performance indicators were total revenue, marketing spend etc. Showcasing this set of slides titled Strategic Marketing Analysis And Planning Dashboard To Track Campaign Effectiveness Summary PDF. The topics addressed in these templates are Marketing Spend, Conversion Rate, Return Investment. All the content presented in this PPT design is completely editable. Download it and make adjustments in color, background, font etc. as per your unique business setting.

Business Performance Review Dashboard To Measure Overall Business Performance Formats PDF
The following slide highlights a comprehensive quarterly business review QBR dashboard which can be used by the organization to evaluate business performance. The metrics used for review are total revenue, new customers, gross profit, overall costs, sales comparison, sales by different products and top performing channels. Showcasing this set of slides titled Business Performance Review Dashboard To Measure Overall Business Performance Formats PDF. The topics addressed in these templates are Sales Comparison, Sales Product, High Performing. All the content presented in this PPT design is completely editable. Download it and make adjustments in color, background, font etc. as per your unique business setting.
Business To Business Digital Channel Management B2B Sales Performance Tracking Dashboard Template PDF
This slide represents metric dashboard to track sales performance on e-commerce website. It cover performance indicators such as sales breakdown, order breakdown, recurring sales etc. Take your projects to the next level with our ultimate collection of Business To Business Digital Channel Management B2B Sales Performance Tracking Dashboard Template PDF. Slidegeeks has designed a range of layouts that are perfect for representing task or activity duration, keeping track of all your deadlines at a glance. Tailor these designs to your exact needs and give them a truly corporate look with your own brand colors they will make your projects stand out from the rest.
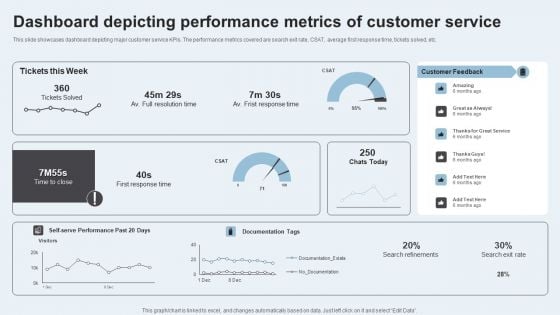
Action Plan To Enhance Client Service Dashboard Depicting Performance Metrics Sample PDF
This slide showcases dashboard depicting major customer service KPIs. The performance metrics covered are search exit rate, CSAT, average first response time, tickets solved, etc. Retrieve professionally designed Action Plan To Enhance Client Service Dashboard Depicting Performance Metrics Sample PDF to effectively convey your message and captivate your listeners. Save time by selecting pre made slideshows that are appropriate for various topics, from business to educational purposes. These themes come in many different styles, from creative to corporate, and all of them are easily adjustable and can be edited quickly. Access them as PowerPoint templates or as Google Slides themes. You do not have to go on a hunt for the perfect presentation because Slidegeeks got you covered from everywhere.
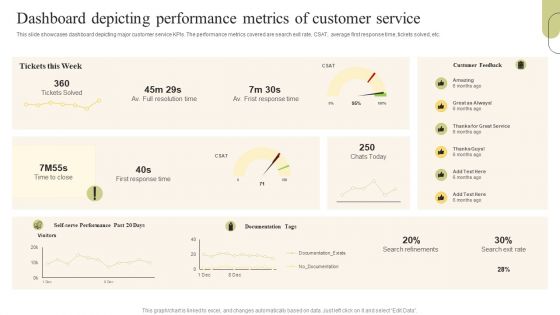
Customer Support Services Dashboard Depicting Performance Metrics Of Customer Designs PDF
This slide showcases dashboard depicting major customer service KPIs. The performance metrics covered are search exit rate, CSAT, average first response time, tickets solved, etc. Coming up with a presentation necessitates that the majority of the effort goes into the content and the message you intend to convey. The visuals of a PowerPoint presentation can only be effective if it supplements and supports the story that is being told. Keeping this in mind our experts created Customer Support Services Dashboard Depicting Performance Metrics Of Customer Designs PDF to reduce the time that goes into designing the presentation. This way, you can concentrate on the message while our designers take care of providing you with the right template for the situation.
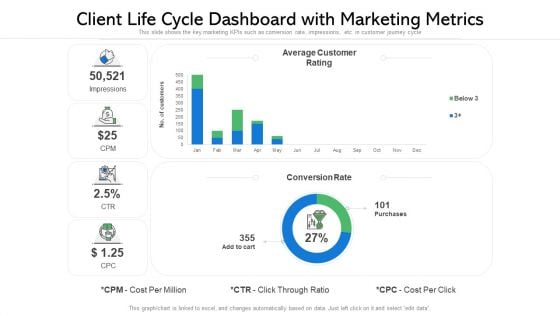
Client Life Cycle Dashboard With Marketing Metrics Ppt File Format PDF
This slide shows the key marketing KPIs such as conversion rate, impressions, etc. in customer journey cycle Showcasing this set of slides titled client life cycle dashboard with marketing metrics ppt file format pdf. The topics addressed in these templates are average customer rating, conversion rate, purchases. All the content presented in this PPT design is completely editable. Download it and make adjustments in color, background, font etc. as per your unique business setting.
Finance Metrics Dashboard Illustrating Gross And Operating Profit Margin Icons PDF
This graph or chart is linked to excel, and changes automatically based on data. Just left click on it and select edit data. Showcasing this set of slides titled Finance Metrics Dashboard Illustrating Gross And Operating Profit Margin Icons PDF. The topics addressed in these templates are Gross Profit Margin, Operating Profit Margin, Net Profit Margin. All the content presented in this PPT design is completely editable. Download it and make adjustments in color, background, font etc. as per your unique business setting.
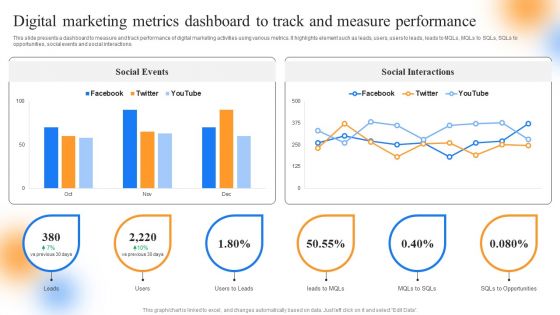
Strategic Guide To Perform Marketing Digital Marketing Metrics Dashboard To Track Diagrams PDF
This slide presents a dashboard to measure and track performance of digital marketing activities using various metrics. It highlights element such as leads, users, users to leads, leads to MQLs, MQLs to SQLs, SQLs to opportunities, social events and social interactions. Retrieve professionally designed Strategic Guide To Perform Marketing Digital Marketing Metrics Dashboard To Track Diagrams PDF to effectively convey your message and captivate your listeners. Save time by selecting pre-made slideshows that are appropriate for various topics, from business to educational purposes. These themes come in many different styles, from creative to corporate, and all of them are easily adjustable and can be edited quickly. Access them as PowerPoint templates or as Google Slides themes. You dont have to go on a hunt for the perfect presentation because Slidegeeks got you covered from everywhere.
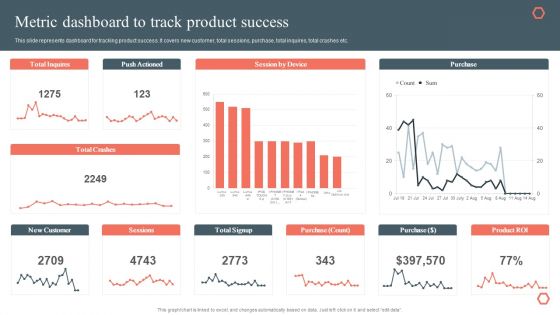
Metric Dashboard To Track Product Success Product Development And Management Plan Portrait PDF
This slide represents product development timeline. It covers gathering resources, strategy development, performance validation, prototyping etc.If you are looking for a format to display your unique thoughts, then the professionally designed Metric Dashboard To Track Product Success Product Development And Management Plan Portrait PDF is the one for you. You can use it as a Google Slides template or a PowerPoint template. Incorporate impressive visuals, symbols, images, and other charts. Modify or reorganize the text boxes as you desire. Experiment with shade schemes and font pairings. Alter, share or cooperate with other people on your work. Download Metric Dashboard To Track Product Success Product Development And Management Plan Portrait PDF and find out how to give a successful presentation. Present a perfect display to your team and make your presentation unforgettable.
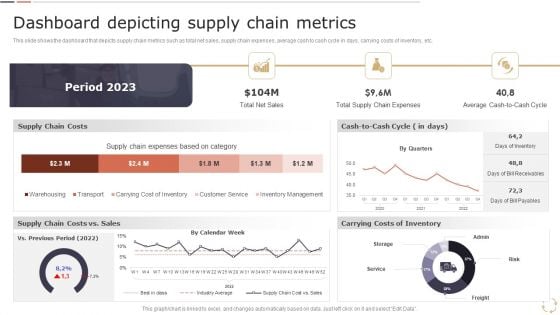
Optimizing Logistics Models To Enhance Supply Chain Management Dashboard Depicting Supply Chain Metrics Download PDF
This slide shows the dashboard that depicts supply chain metrics such as total net sales, supply chain expenses, average cash to cash cycle in days, carrying costs of inventory, etc. Coming up with a presentation necessitates that the majority of the effort goes into the content and the message you intend to convey. The visuals of a PowerPoint presentation can only be effective if it supplements and supports the story that is being told. Keeping this in mind our experts created Optimizing Logistics Models To Enhance Supply Chain Management Dashboard Depicting Supply Chain Metrics Download PDF to reduce the time that goes into designing the presentation. This way, you can concentrate on the message while our designers take care of providing you with the right template for the situation.
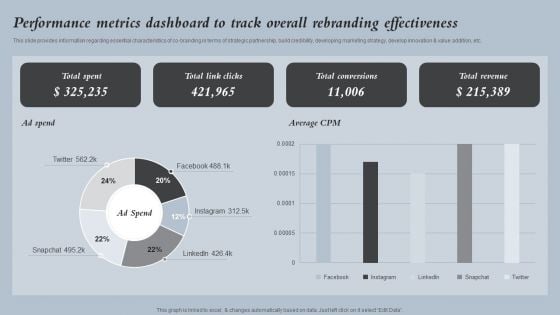
Performance Metrics Dashboard To Track Overall Strategies For Rebranding Without Losing Ideas PDF
This slide provides information regarding essential characteristics of co branding in terms of strategic partnership, build credibility, developing marketing strategy, develop innovation and value addition, etc. Whether you have daily or monthly meetings, a brilliant presentation is necessary. Performance Metrics Dashboard To Track Overall Strategies For Rebranding Without Losing Ideas PDF can be your best option for delivering a presentation. Represent everything in detail using Performance Metrics Dashboard To Track Overall Strategies For Rebranding Without Losing Ideas PDF and make yourself stand out in meetings. The template is versatile and follows a structure that will cater to your requirements. All the templates prepared by Slidegeeks are easy to download and edit. Our research experts have taken care of the corporate themes as well. So, give it a try and see the results.
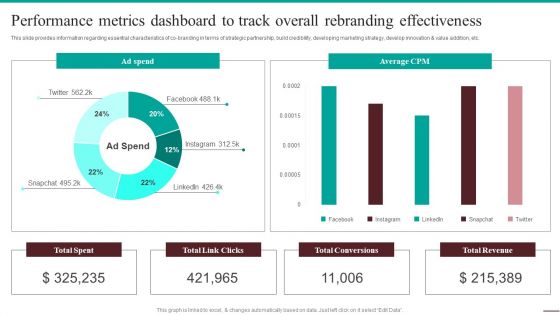
Guide For Systematic Performance Metrics Dashboard To Track Overall Rebranding Background PDF
This slide provides information regarding essential characteristics of co-branding in terms of strategic partnership, build credibility, developing marketing strategy, develop innovation and value addition, etc. Formulating a presentation can take up a lot of effort and time, so the content and message should always be the primary focus. The visuals of the PowerPoint can enhance the presenters message, so our Guide For Systematic Performance Metrics Dashboard To Track Overall Rebranding Background PDF was created to help save time. Instead of worrying about the design, the presenter can concentrate on the message while our designers work on creating the ideal templates for whatever situation is needed. Slidegeeks has experts for everything from amazing designs to valuable content, we have put everything into Guide For Systematic Performance Metrics Dashboard To Track Overall Rebranding Background PDF.
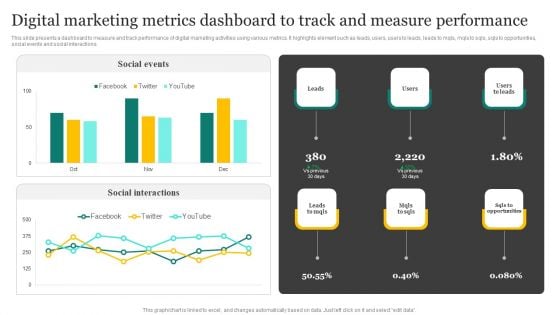
Strategic Promotion Plan Development Stages Digital Marketing Metrics Dashboard To Track Structure PDF
This slide presents a dashboard to measure and track performance of digital marketing activities using various metrics. It highlights element such as leads, users, users to leads, leads to mqls, mqls to sqls, sqls to opportunities, social events and social interactions. Are you in need of a template that can accommodate all of your creative concepts This one is crafted professionally and can be altered to fit any style. Use it with Google Slides or PowerPoint. Include striking photographs, symbols, depictions, and other visuals. Fill, move around, or remove text boxes as desired. Test out color palettes and font mixtures. Edit and save your work, or work with colleagues. Download Strategic Promotion Plan Development Stages Digital Marketing Metrics Dashboard To Track Structure PDF and observe how to make your presentation outstanding. Give an impeccable presentation to your group and make your presentation unforgettable.
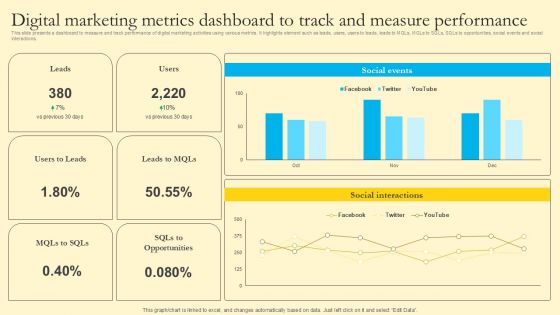
Comprehensive Guide For Sales And Advertising Processes Digital Marketing Metrics Dashboard To Track Measure Clipart PDF
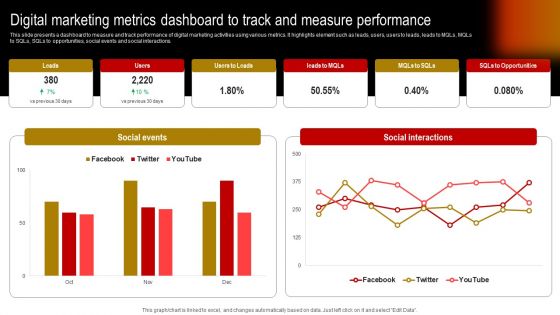
Digital Marketing Metrics Dashboard To Track And Measure Performance Graphics PDF
This slide presents a dashboard to measure and track performance of digital marketing activities using various metrics. It highlights element such as leads, users, users to leads, leads to MQLs, MQLs to SQLs, SQLs to opportunities, social events and social interactions. Want to ace your presentation in front of a live audience Our Digital Marketing Metrics Dashboard To Track And Measure Performance Graphics PDF can help you do that by engaging all the users towards you. Slidegeeks experts have put their efforts and expertise into creating these impeccable powerpoint presentations so that you can communicate your ideas clearly. Moreover, all the templates are customizable, and easy to edit and downloadable. Use these for both personal and commercial use.
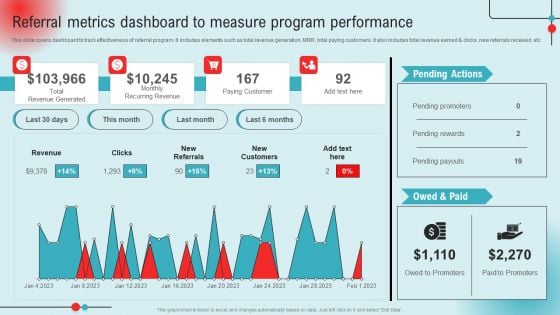
Referral Metrics Dashboard To Measure Program Performance Ppt PowerPoint Presentation Diagram Lists PDF
This slide covers dashboard to track effectiveness of referral program. It includes elements such as total revenue generation, MRR, total paying customers. It also includes total revenue earned and clicks, new referrals received, etc. This Referral Metrics Dashboard To Measure Program Performance Ppt PowerPoint Presentation Diagram Lists PDF from Slidegeeks makes it easy to present information on your topic with precision. It provides customization options, so you can make changes to the colors, design, graphics, or any other component to create a unique layout. It is also available for immediate download, so you can begin using it right away. Slidegeeks has done good research to ensure that you have everything you need to make your presentation stand out. Make a name out there for a brilliant performance.
Shipping And Logistics Tracking Dashboard With Shipments And Fleet Status Ideas PDF
This slide covers Key performance indicators to track the automation system of the company. This dashboard includes Logistics Efficiency Status, delivery time accuracy etc. Get a simple yet stunning designed Shipping And Logistics Tracking Dashboard With Shipments And Fleet Status Ideas PDF. It is the best one to establish the tone in your meetings. It is an excellent way to make your presentations highly effective. So, download this PPT today from Slidegeeks and see the positive impacts. Our easy to edit Shipping And Logistics Tracking Dashboard With Shipments And Fleet Status Ideas PDF can be your go to option for all upcoming conferences and meetings. So, what are you waiting for Grab this template today.
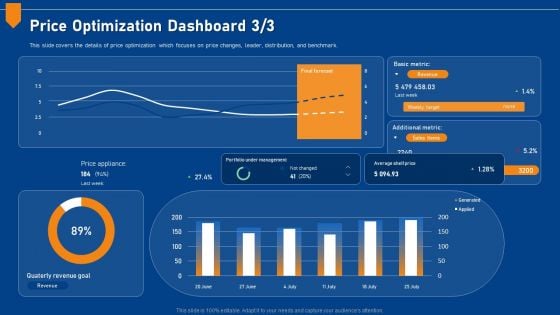
Evaluating Price Efficiency In Organization Price Optimization Dashboard Metric Designs PDF
This slide covers the details of price optimization which focuses on price changes, leader, distribution, and benchmark. Deliver and pitch your topic in the best possible manner with this evaluating price efficiency in organization price optimization dashboard metric designs pdf. Use them to share invaluable insights on portfolio, management, price, revenue, target and impress your audience. This template can be altered and modified as per your expectations. So, grab it now.
Developing Brand Awareness To Gain Customer Attention Different Brands Performance Tracking Dashboard Introduction PDF
This slide provides information regarding different brands performance tracking dashboard in terms of brand metric, brand commitment, advertising metrics, and purchase metrics. Make sure to capture your audiences attention in your business displays with our gratis customizable Developing Brand Awareness To Gain Customer Attention Different Brands Performance Tracking Dashboard Introduction PDF. These are great for business strategies, office conferences, capital raising or task suggestions. If you desire to acquire more customers for your tech business and ensure they stay satisfied, create your own sales presentation with these plain slides.
Brand Plan Toolkit For Marketers Overall Brand Performance Tracking Dashboard Rules PDF
This slide provides information regarding brand performance tracking dashboard capturing KPIs such as brand metric, brand commitment, advertising metrics, and purchase metrics. From laying roadmaps to briefing everything in detail, our templates are perfect for you. You can set the stage with your presentation slides. All you have to do is download these easy to edit and customizable templates. Brand Plan Toolkit For Marketers Overall Brand Performance Tracking Dashboard Rules PDF will help you deliver an outstanding performance that everyone would remember and praise you for. Do download this presentation today.
Instructions For Brand Performance Management Team Overall Brand Performance Tracking Dashboard Formats PDF
This slide provides information regarding brand performance tracking dashboard capturing KPIs such as brand metric, brand commitment, advertising metrics, and purchase metrics. Present like a pro with Instructions For Brand Performance Management Team Overall Brand Performance Tracking Dashboard Formats PDF Create beautiful presentations together with your team, using our easy to use presentation slides. Share your ideas in real time and make changes on the fly by downloading our templates. So whether you are in the office, on the go, or in a remote location, you can stay in sync with your team and present your ideas with confidence. With Slidegeeks presentation got a whole lot easier. Grab these presentations today.
Toolkit To Administer Tactical Overall Brand Performance Tracking Dashboard Mockup PDF
This slide provides information regarding brand performance tracking dashboard capturing KPIs such as brand metric, brand commitment, advertising metrics, and purchase metrics. The best PPT templates are a great way to save time, energy, and resources. Slidegeeks have 100 percent editable powerpoint slides making them incredibly versatile. With these quality presentation templates, you can create a captivating and memorable presentation by combining visually appealing slides and effectively communicating your message. Download Toolkit To Administer Tactical Overall Brand Performance Tracking Dashboard Mockup PDF from Slidegeeks and deliver a wonderful presentation.
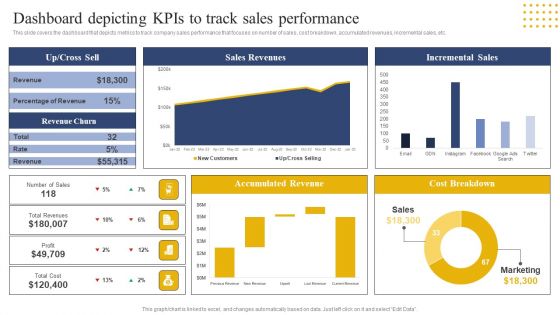
Transition Plan For Business Management Dashboard Depicting Kpis To Track Sales Performance Template PDF
This slide covers the dashboard that depicts metrics to track company sales performance that focuses on number of sales, cost breakdown, accumulated revenues, incremental sales, etc. From laying roadmaps to briefing everything in detail, our templates are perfect for you. You can set the stage with your presentation slides. All you have to do is download these easy-to-edit and customizable templates. Transition Plan For Business Management Dashboard Depicting Kpis To Track Sales Performance Template PDF will help you deliver an outstanding performance that everyone would remember and praise you for. Do download this presentation today.
Implementing Change Management Strategy To Transform Business Processes Dashboard Depicting Kpis To Track Icons PDF
This slide covers the dashboard that depicts metrics to track company sales performance that focuses on number of sales, cost breakdown, accumulated revenues, incremental sales, etc. Boost your pitch with our creative Implementing Change Management Strategy To Transform Business Processes Dashboard Depicting Kpis To Track Icons PDF. Deliver an awe-inspiring pitch that will mesmerize everyone. Using these presentation templates you will surely catch everyones attention. You can browse the ppts collection on our website. We have researchers who are experts at creating the right content for the templates. So you do not have to invest time in any additional work. Just grab the template now and use them.
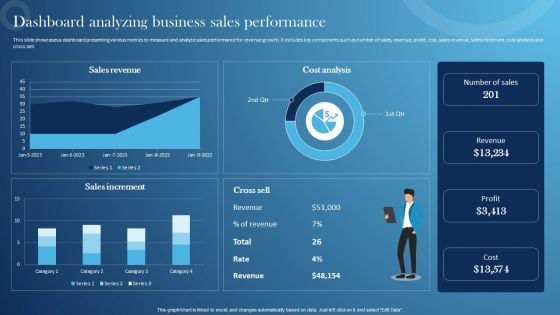
Inspecting Sales Optimization Areas Dashboard Analyzing Business Sales Performance Slides PDF
This slide showcases a dashboard presenting various metrics to measure and analyze sales performance for revenue growth. It includes key components such as number of sales, revenue, profit, cost, sales revenue, sales increment, cost analysis and cross sell. Create an editable Inspecting Sales Optimization Areas Dashboard Analyzing Business Sales Performance Slides PDF that communicates your idea and engages your audience. Whether youre presenting a business or an educational presentation, pre-designed presentation templates help save time. Inspecting Sales Optimization Areas Dashboard Analyzing Business Sales Performance Slides PDF is highly customizable and very easy to edit, covering many different styles from creative to business presentations. Slidegeeks has creative team members who have crafted amazing templates. So, go and get them without any delay.
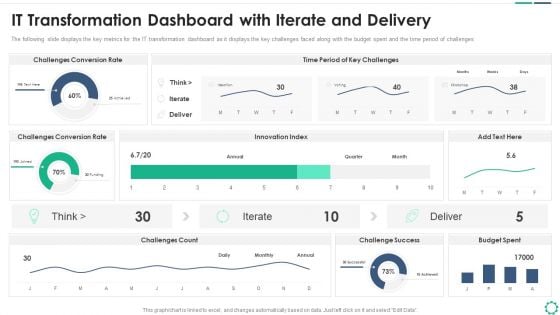
Digitalization Plan For Business Modernization IT Transformation Dashboard With Iterate And Delivery Infographics PDF
The following slide displays the key metrics for the IT transformation dashboard as it displays the key challenges faced along with the budget spent and the time period of challenges. Deliver an awe inspiring pitch with this creative digitalization plan for business modernization it transformation dashboard with iterate and delivery infographics pdf bundle. Topics like challenges conversion rate, innovation index, challenges count, challenge success, budget spent, time period of key challenges can be discussed with this completely editable template. It is available for immediate download depending on the needs and requirements of the user.
Efficient Administration Of Product Business And Umbrella Branding Corporate Branding Performance Tracking Dashboard Elements PDF
This slide provides information regarding corporate branding performance tracking dashboard in terms of leads, conversion metrics, web traffic, etc. Crafting an eye catching presentation has never been more straightforward. Let your presentation shine with this tasteful yet straightforward Efficient Administration Of Product Business And Umbrella Branding Corporate Branding Performance Tracking Dashboard Elements PDF template. It offers a minimalistic and classy look that is great for making a statement. The colors have been employed intelligently to add a bit of playfulness while still remaining professional. Construct the ideal Efficient Administration Of Product Business And Umbrella Branding Corporate Branding Performance Tracking Dashboard Elements PDF that effortlessly grabs the attention of your audience Begin now and be certain to wow your customers.
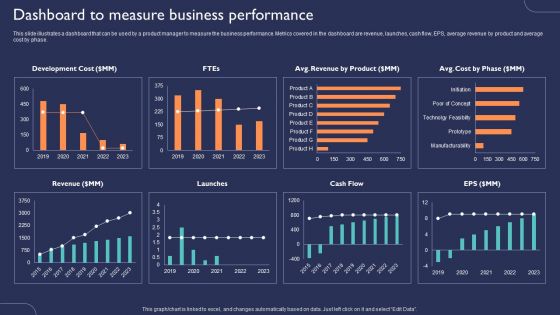
Introduction To New Product Portfolio Dashboard To Measure Business Performance Ppt Ideas Clipart Images PDF
This slide illustrates a dashboard that can be used by a product manager to measure the business performance. Metrics covered in the dashboard are revenue, launches, cash flow, EPS, average revenue by product and average cost by phase. Are you in need of a template that can accommodate all of your creative concepts. This one is crafted professionally and can be altered to fit any style. Use it with Google Slides or PowerPoint. Include striking photographs, symbols, depictions, and other visuals. Fill, move around, or remove text boxes as desired. Test out color palettes and font mixtures. Edit and save your work, or work with colleagues. Download Introduction To New Product Portfolio Dashboard To Measure Business Performance Ppt Ideas Clipart Images PDF and observe how to make your presentation outstanding. Give an impeccable presentation to your group and make your presentation unforgettable.
Strategic Toolkit For Brand Performance Enhancement Overall Brand Performance Tracking Dashboard Professional PDF
This slide provides information regarding brand performance tracking dashboard capturing KPIs such as brand metric, brand commitment, advertising metrics, and purchase metrics. Whether you have daily or monthly meetings, a brilliant presentation is necessary. Strategic Toolkit For Brand Performance Enhancement Overall Brand Performance Tracking Dashboard Professional PDF can be your best option for delivering a presentation. Represent everything in detail using Strategic Toolkit For Brand Performance Enhancement Overall Brand Performance Tracking Dashboard Professional PDF and make yourself stand out in meetings. The template is versatile and follows a structure that will cater to your requirements. All the templates prepared by Slidegeeks are easy to download and edit. Our research experts have taken care of the corporate themes as well. So, give it a try and see the results.
Corporate Branding Performance Tracking Dashboard Corporate Branding Strategy To Revitalize Business Identity Slides PDF
This slide provides information regarding corporate branding performance tracking dashboard in terms of leads, conversion metrics, web traffic, etc. If you are looking for a format to display your unique thoughts, then the professionally designed Corporate Branding Performance Tracking Dashboard Corporate Branding Strategy To Revitalize Business Identity Slides PDF is the one for you. You can use it as a Google Slides template or a PowerPoint template. Incorporate impressive visuals, symbols, images, and other charts. Modify or reorganize the text boxes as you desire. Experiment with shade schemes and font pairings. Alter, share or cooperate with other people on your work. Download Corporate Branding Performance Tracking Dashboard Corporate Branding Strategy To Revitalize Business Identity Slides PDF and find out how to give a successful presentation. Present a perfect display to your team and make your presentation unforgettable.
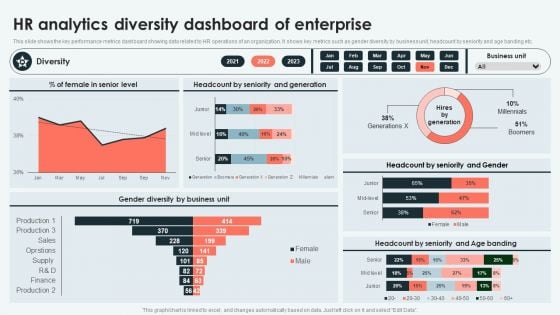
Analyzing And Deploying HR Analytics Diversity Dashboard Of Enterprise Inspiration PDF
This slide shows the key performance metrics dashboard showing data related to HR operations of an organization. It shows key metrics such as gender diversity by business unit, headcount by seniority and age banding etc. Want to ace your presentation in front of a live audience Our Analyzing And Deploying HR Analytics Diversity Dashboard Of Enterprise Inspiration PDF can help you do that by engaging all the users towards you. Slidegeeks experts have put their efforts and expertise into creating these impeccable powerpoint presentations so that you can communicate your ideas clearly. Moreover, all the templates are customizable, and easy-to-edit and downloadable. Use these for both personal and commercial use.
Improving Brand Recognition To Boost Different Brands Performance Tracking Dashboard Ideas PDF
This slide provides information regarding different brands performance tracking dashboard in terms of brand metric, brand commitment, advertising metrics, and purchase metrics. Crafting an eye-catching presentation has never been more straightforward. Let your presentation shine with this tasteful yet straightforward Improving Brand Recognition To Boost Different Brands Performance Tracking Dashboard Ideas PDF template. It offers a minimalistic and classy look that is great for making a statement. The colors have been employed intelligently to add a bit of playfulness while still remaining professional. Construct the ideal Improving Brand Recognition To Boost Different Brands Performance Tracking Dashboard Ideas PDF that effortlessly grabs the attention of your audience Begin now and be certain to wow your customers.
How To Boost Brand Recognition Different Brands Performance Tracking Dashboard Pictures PDF
This slide provides information regarding different brands performance tracking dashboard in terms of brand metric, brand commitment, advertising metrics, and purchase metrics. Do you have to make sure that everyone on your team knows about any specific topic I yes, then you should give How To Boost Brand Recognition Different Brands Performance Tracking Dashboard Pictures PDF a try. Our experts have put a lot of knowledge and effort into creating this impeccable How To Boost Brand Recognition Different Brands Performance Tracking Dashboard Pictures PDF. You can use this template for your upcoming presentations, as the slides are perfect to represent even the tiniest detail. You can download these templates from the Slidegeeks website and these are easy to edit. So grab these today.
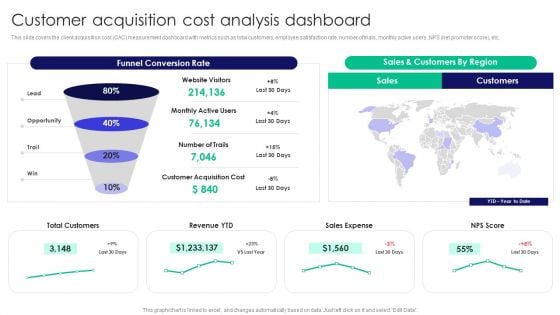
Guide To Business Customer Acquisition Customer Acquisition Cost Analysis Dashboard Download PDF
This slide covers the client acquisition cost CAC measurement dashboard with metrics such as total customers, employee satisfaction rate, number of trials, monthly active users, NPS net promoter score, etc. Make sure to capture your audiences attention in your business displays with our gratis customizable Guide To Business Customer Acquisition Customer Acquisition Cost Analysis Dashboard Download PDF. These are great for business strategies, office conferences, capital raising or task suggestions. If you desire to acquire more customers for your tech business and ensure they stay satisfied, create your own sales presentation with these plain slides.
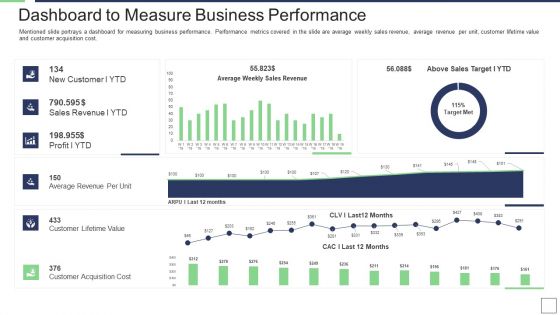
IT Service Incorporation And Administration Dashboard To Measure Business Performance Portrait PDF
Mentioned slide portrays a dashboard for measuring business performance. Performance metrics covered in the slide are average weekly sales revenue, average revenue per unit, customer lifetime value and customer acquisition cost. Deliver and pitch your topic in the best possible manner with this it service incorporation and administration dashboard to measure business performance portrait pdf. Use them to share invaluable insights on sales, revenue, target, acquisition cost and impress your audience. This template can be altered and modified as per your expectations. So, grab it now.
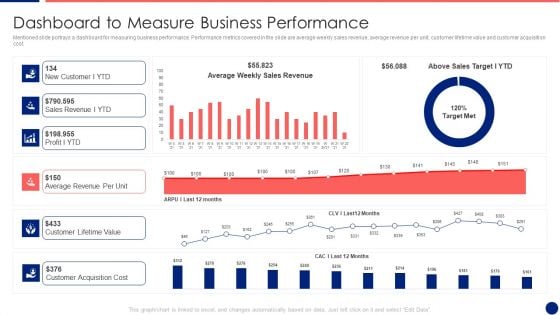
Information Technology Service Integration Post Acquisition Merger Dashboard To Measure Business Pictures PDF
Mentioned slide portrays a dashboard for measuring business performance. Performance metrics covered in the slide are average weekly sales revenue, average revenue per unit, customer lifetime value and customer acquisition cost. Deliver and pitch your topic in the best possible manner with this information technology service integration post acquisition merger dashboard to measure business pictures pdf. Use them to share invaluable insights on sales revenue, average, cost and impress your audience. This template can be altered and modified as per your expectations. So, grab it now.
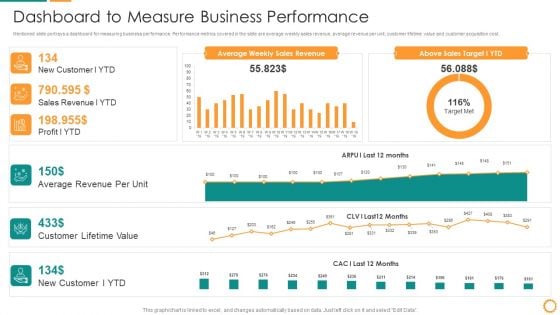
IT Consolidation Post Mergers And Acquisition Dashboard To Measure Business Performance Clipart PDF
Mentioned slide portrays a dashboard for measuring business performance. Performance metrics covered in the slide are average weekly sales revenue, average revenue per unit, customer lifetime value and customer acquisition cost. Deliver and pitch your topic in the best possible manner with this IT Consolidation Post Mergers And Acquisition Dashboard To Measure Business Performance Clipart PDF. Use them to share invaluable insights on Average Revenue, Customer Lifetime Value, Sales Revenue, Sales Target and impress your audience. This template can be altered and modified as per your expectations. So, grab it now.
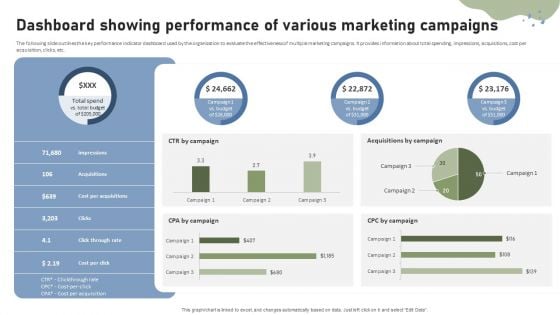
Brand Building Techniques Enhance Customer Engagement Loyalty Dashboard Showing Performance Rules PDF
The following slide outlines the key performance indicator dashboard used by the organization to evaluate the effectiveness of multiple marketing campaigns. It provides information about total spending, impressions, acquisitions, cost per acquisition, clicks, etc. Slidegeeks is one of the best resources for PowerPoint templates. You can download easily and regulate Brand Building Techniques Enhance Customer Engagement Loyalty Dashboard Showing Performance Rules PDF for your personal presentations from our wonderful collection. A few clicks is all it takes to discover and get the most relevant and appropriate templates. Use our Templates to add a unique zing and appeal to your presentation and meetings. All the slides are easy to edit and you can use them even for advertisement purposes.
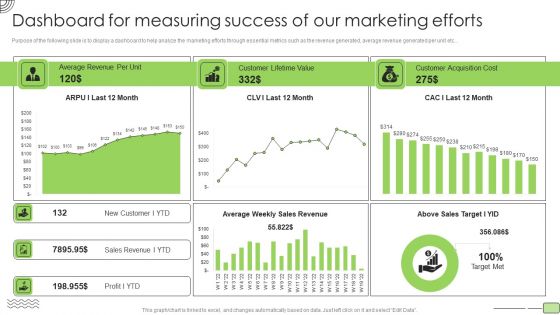
Organic Business Growth Strategies Dashboard For Measuring Success Of Our Marketing Efforts Diagrams PDF
Purpose of the following slide is to display a dashboard to help analyze the marketing efforts through essential metrics such as the revenue generated, average revenue generated per unit etc. Deliver an awe inspiring pitch with this creative Organic Business Growth Strategies Dashboard For Measuring Success Of Our Marketing Efforts Diagrams PDF bundle. Topics like Average Revenue, Customer Lifetime Value, Customer Acquisition Cost can be discussed with this completely editable template. It is available for immediate download depending on the needs and requirements of the user.
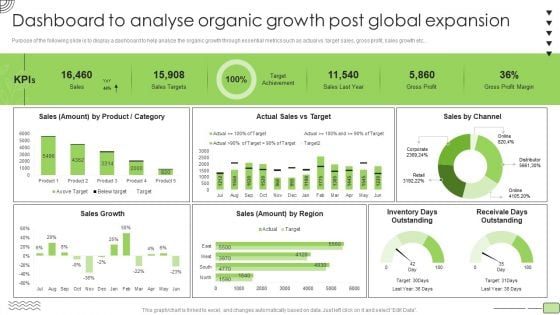
Organic Business Growth Strategies Dashboard To Analyse Organic Growth Post Global Expansion Background PDF
Purpose of the following slide is to display a dashboard to help analyze the organic growth through essential metrics such as actual vs. target sales, gross profit, sales growth etc. Deliver and pitch your topic in the best possible manner with this Organic Business Growth Strategies Dashboard To Analyse Organic Growth Post Global Expansion Background PDF. Use them to share invaluable insights on Sales, Product, Target and impress your audience. This template can be altered and modified as per your expectations. So, grab it now.
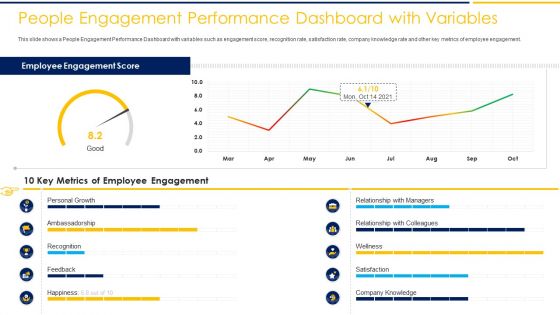
People Engagement Performance Dashboard With Variables Growth Ppt Summary Example PDF
This slide shows a People Engagement Performance Dashboard with variables such as engagement score, recognition rate, satisfaction rate, company knowledge rate and other key metrics of employee engagement. Deliver and pitch your topic in the best possible manner with this people engagement performance dashboard with variables growth ppt summary example pdf. Use them to share invaluable insights on 10 key metrics of employee engagement, employee engagement score and impress your audience. This template can be altered and modified as per your expectations. So, grab it now.
Actively Influencing Customers Dashboard For Tracking Marketing Activities At Social Guidelines PDF
This slide covers information regarding the dashboard for tracking essential marketing activities at social media platform in terms of social traffic and conversion, referral traffic by site, key social media metrics. Deliver and pitch your topic in the best possible manner with this Actively Influencing Customers Dashboard For Tracking Marketing Activities At Social Guidelines PDF. Use them to share invaluable insights on Social Events, Social Traffic And Conversion, Referral Traffic By Site, Key Social Metrics and impress your audience. This template can be altered and modified as per your expectations. So, grab it now.
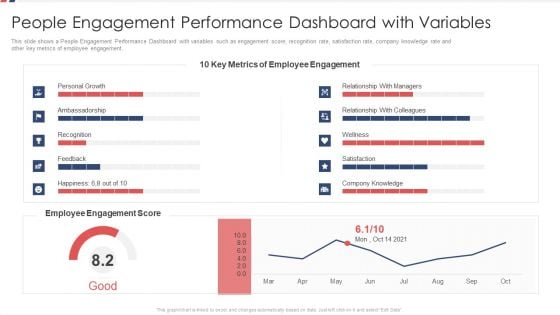
People Engagement Performance Dashboard With Variables Ppt Gallery Example File PDF
This slide shows a People Engagement Performance Dashboard with variables such as engagement score, recognition rate, satisfaction rate, company knowledge rate and other key metrics of employee engagement. Deliver and pitch your topic in the best possible manner with this people engagement performance dashboard with variables ppt gallery example file pdf. Use them to share invaluable insights on personal growth, employee engagement score, employee engagement metrics and impress your audience. This template can be altered and modified as per your expectations. So, grab it now.
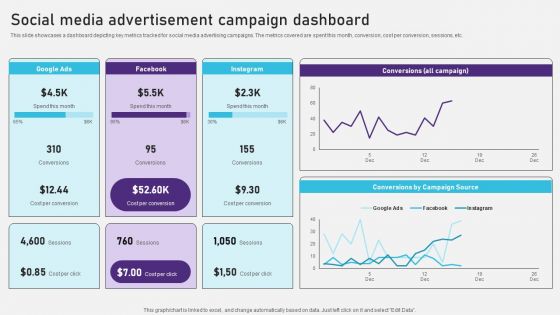
Advertising Campaign Optimization Process Social Media Advertisement Campaign Dashboard Graphics PDF
This slide showcases a dashboard depicting key metrics tracked for social media advertising campaigns. The metrics covered are spent this month, conversion, cost per conversion, sessions, etc. Do you have to make sure that everyone on your team knows about any specific topic I yes, then you should give Advertising Campaign Optimization Process Social Media Advertisement Campaign Dashboard Graphics PDF a try. Our experts have put a lot of knowledge and effort into creating this impeccable Advertising Campaign Optimization Process Social Media Advertisement Campaign Dashboard Graphics PDF. You can use this template for your upcoming presentations, as the slides are perfect to represent even the tiniest detail. You can download these templates from the Slidegeeks website and these are easy to edit. So grab these today.
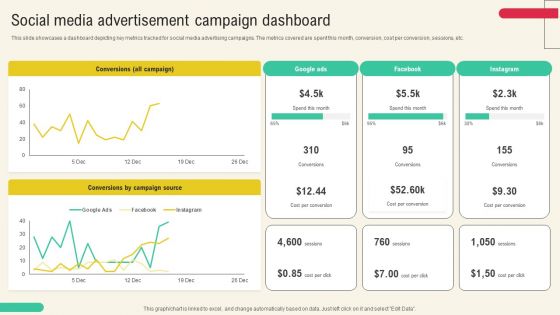
Client Acquisition Through Marketing Campaign Social Media Advertisement Campaign Dashboard Clipart PDF
This slide showcases a dashboard depicting key metrics tracked for social media advertising campaigns. The metrics covered are spent this month, conversion, cost per conversion, sessions, etc. Get a simple yet stunning designed Client Acquisition Through Marketing Campaign Social Media Advertisement Campaign Dashboard Clipart PDF. It is the best one to establish the tone in your meetings. It is an excellent way to make your presentations highly effective. So, download this PPT today from Slidegeeks and see the positive impacts. Our easy to edit Client Acquisition Through Marketing Campaign Social Media Advertisement Campaign Dashboard Clipart PDF can be your go to option for all upcoming conferences and meetings. So, what are you waiting for Grab this template today.
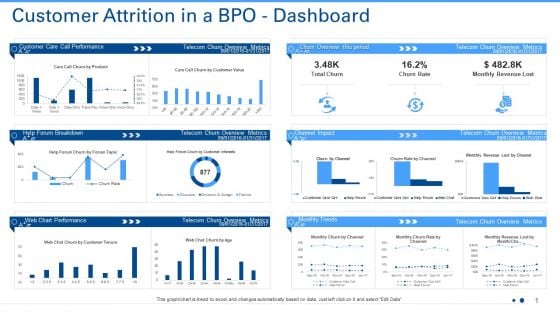
Customer Attrition In A BPO Dashboard Ppt Show File Formats PDF
Deliver an awe-inspiring pitch with this creative customer attrition in a bpo dashboard ppt show file formats pdf. bundle. Topics like customer care call performance, telecom churn overview metrics, telecom churn overview metrics can be discussed with this completely editable template. It is available for immediate download depending on the needs and requirements of the user.
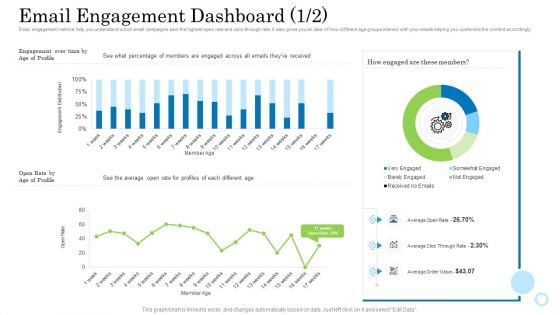
Customer Behavioral Data And Analytics Email Engagement Dashboard Rate Designs PDF
Email engagement metrics help you understand which email campaigns saw the highest open rate and click-through rate. It also gives you an idea of how different age groups interact with your emails helping you customize the content accordingly. Deliver an awe inspiring pitch with this creative customer behavioral data and analytics email engagement dashboard rate designs pdf bundle. Topics like email engagement dashboard can be discussed with this completely editable template. It is available for immediate download depending on the needs and requirements of the user.


 Continue with Email

 Home
Home


