Kpi Dashboard

Funding Pitch On Key Financial Metrics Dashboard Ppt Ideas Deck PDF
This slide illustrates facts and figures related to important financial metrics It includes cash flow, DSO, ROCE, EPS diluted for Q4 FY21, Q3 FY22 and Q4 FY22 etc. Showcasing this set of slides titled Funding Pitch On Key Financial Metrics Dashboard Ppt Ideas Deck PDF. The topics addressed in these templates are Cash Flow, EPS Diluted, ROCE. All the content presented in this PPT design is completely editable. Download it and make adjustments in color, background, font etc. as per your unique business setting.
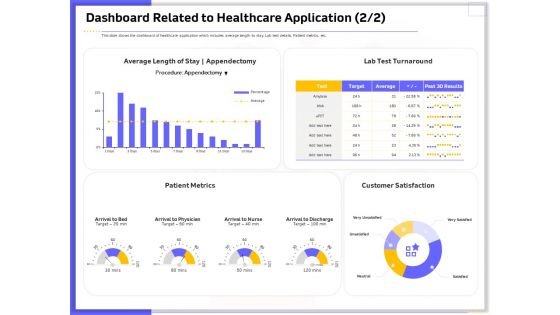
Developing Deploying Android Applications Dashboard Related To Healthcare Application Topics PDF
Presenting this set of slides with name developing deploying android applications dashboard related to healthcare application topics pdf. The topics discussed in these slides are patient metrics, appendectomy, turnaround, customer satisfaction. This is a completely editable PowerPoint presentation and is available for immediate download. Download now and impress your audience.
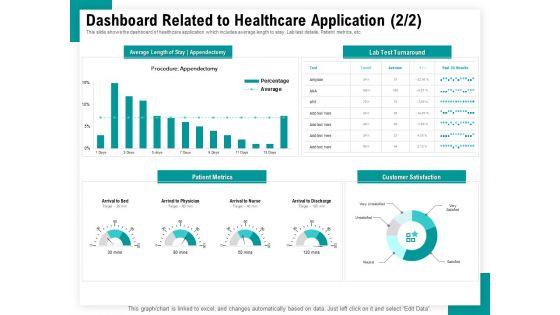
Android Framework For Apps Development And Deployment Dashboard Related To Healthcare Application Customer Topics PDF
Presenting this set of slides with name android framework for apps development and deployment dashboard related to healthcare application customer topics pdf. The topics discussed in these slides are procedure appendectomy, lab test turnaround, average length of stay appendectomy, customer satisfaction, patient metrics. This is a completely editable PowerPoint presentation and is available for immediate download. Download now and impress your audience.
Improving Retention Rate By Implementing Acquisition Strategy Google Analytics Dashboard For User Tracking Inspiration PDF
Presenting this set of slides with name improving retention rate by implementing acquisition strategy google analytics dashboard for user tracking inspiration pdf. The topics discussed in these slides are target, metrics, analytics, goals. This is a completely editable PowerPoint presentation and is available for immediate download. Download now and impress your audience.
Winning New Customers Acquisition Strategies Google Analytics Dashboard For User Tracking Background PDF
Presenting this set of slides with name winning new customers acquisition strategies google analytics dashboard for user tracking background pdf. The topics discussed in these slides are target, metrics, analytics, goals. This is a completely editable PowerPoint presentation and is available for immediate download. Download now and impress your audience.
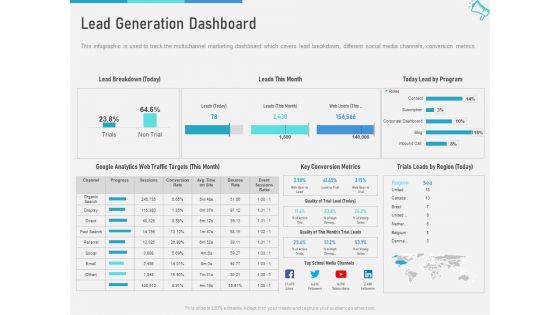
Multi Channel Marketing To Maximize Brand Exposure Lead Generation Dashboard Infographics PDF
Deliver and pitch your topic in the best possible manner with this multi channel marketing to maximize brand exposure lead generation dashboard infographics pdf. Use them to share invaluable insights on metrics, traffic, targets, analytics, media channels and impress your audience. This template can be altered and modified as per your expectations. So, grab it now.

Strategy For Managing Ecommerce Returns Reverse Logistics Dashboard Days Template PDF
Deliver an awe inspiring pitch with this creative strategy for managing ecommerce returns reverse logistics dashboard days template pdf bundle. Topics like global, financial, performance, metric, inventory can be discussed with this completely editable template. It is available for immediate download depending on the needs and requirements of the user.
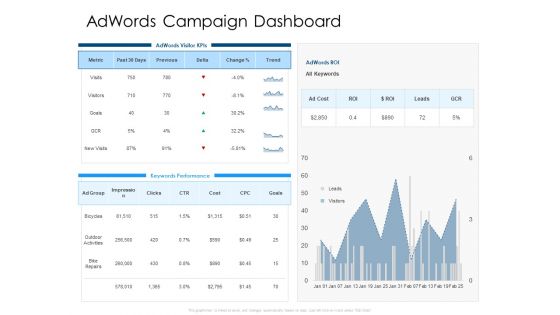
Developing Implementing Organization Marketing Promotional Strategies Adwords Campaign Dashboard Diagrams PDF
Deliver and pitch your topic in the best possible manner with this developing implementing organization marketing promotional strategies adwords campaign dashboard diagrams pdf. Use them to share invaluable insights on goals, impression, performance, metric, costs and impress your audience. This template can be altered and modified as per your expectations. So, grab it now.
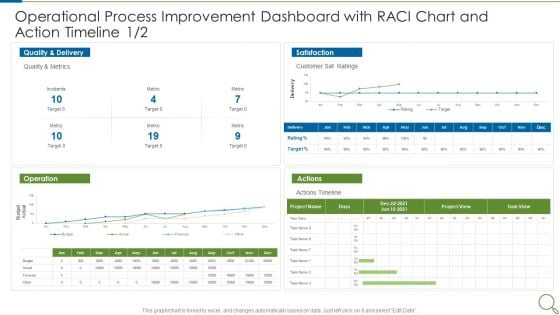
Operational Process Improvement Dashboard With RACI Chart And Action Timeline Target Summary PDF
Deliver and pitch your topic in the best possible manner with this operational process improvement dashboard with raci chart and action timeline target summary pdf. Use them to share invaluable insights on quality, metrics, customer and impress your audience. This template can be altered and modified as per your expectations. So, grab it now.
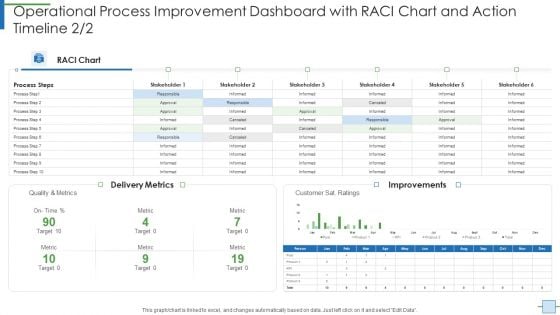
Operational Process Improvement Dashboard With RACI Chart And Action Timeline Matrix Guidelines PDF
Deliver and pitch your topic in the best possible manner with this operational process improvement dashboard with raci chart and action timeline matrix guidelines pdf. Use them to share invaluable insights on delivery metrics, target, customer and impress your audience. This template can be altered and modified as per your expectations. So, grab it now.
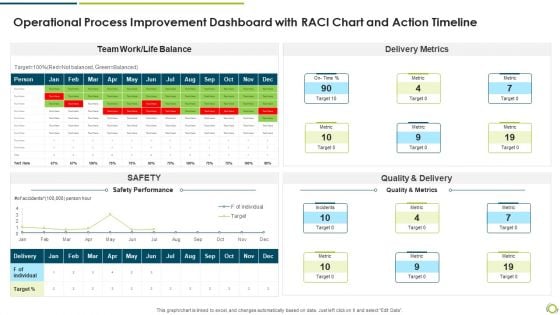
Operational Process Improvement Dashboard With RACI Chart And Action Timeline Themes PDF
Deliver an awe inspiring pitch with this creative operational process improvement dashboard with raci chart and action timeline themes pdf bundle. Topics like quality and delivery, delivery metrics, safety performance can be discussed with this completely editable template. It is available for immediate download depending on the needs and requirements of the user.
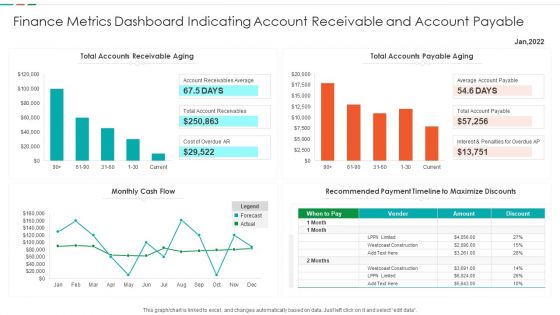
Finance Metrics Dashboard Indicating Account Receivable And Account Payable Demonstration PDF
This graph or chart is linked to excel, and changes automatically based on data. Just left click on it and select edit data. Showcasing this set of slides titled Finance Metrics Dashboard Indicating Account Receivable And Account Payable Demonstration PDF. The topics addressed in these templates are Total Accounts Receivable, Total Accounts Payable, Recommended Payment Timeline, Monthly Cash Flow. All the content presented in this PPT design is completely editable. Download it and make adjustments in color, background, font etc. as per your unique business setting.
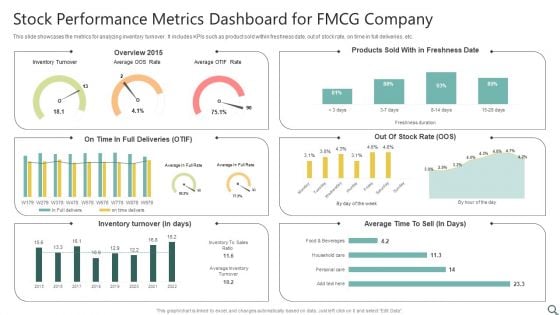
Stock Performance Metrics Dashboard For FMCG Company Ppt Ideas Design Inspiration PDF
This slide showcases the metrics for analyzing inventory turnover. It includes KPIs such as product sold within freshness date, out of stock rate, on time in full deliveries, etc. Showcasing this set of slides titled Stock Performance Metrics Dashboard For FMCG Company Ppt Ideas Design Inspiration PDF. The topics addressed in these templates are Inventory Turnover, Overview 2015, Inventory Turnover. All the content presented in this PPT design is completely editable. Download it and make adjustments in color, background, font etc. as per your unique business setting.
Cloud Performance Tracking Dashboard Cloud Computing Complexities And Solutions Structure PDF
This slide covers the Key performance indicators for tracking performance of the cloud such as violations break down, sources, rules and severity. Are you searching for a xxxxxxxxxxxxxxxxxxxxxx that is uncluttered, straightforward, and original Its easy to edit, and you can change the colors to suit your personal or business branding. For a presentation that expresses how much effort you ve put in, this template is ideal With all of its features, including tables, diagrams, statistics, and lists, its perfect for a business plan presentation. Make your ideas more appealing with these professional slides. Download Cloud Performance Tracking Dashboard Cloud Computing Complexities And Solutions Structure PDF from Slidegeeks today.
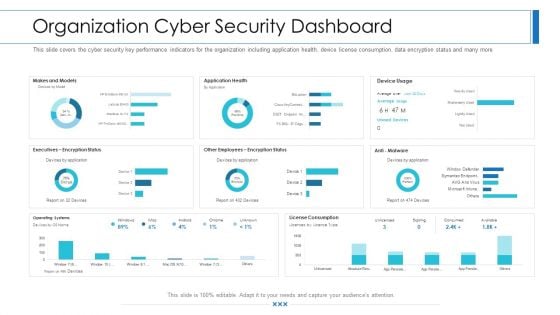
Workforce Security Realization Coaching Plan Organization Cyber Security Dashboard Template PDF
This slide covers the cyber security key performance indicators for the organization including application health, device license consumption, data encryption status and many more. Deliver an awe-inspiring pitch with this creative workforce security realization coaching plan organization cyber security dashboard template pdf bundle. Topics like makes and models, operating systems, encryption status, application health, license consumption can be discussed with this completely editable template. It is available for immediate download depending on the needs and requirements of the user.
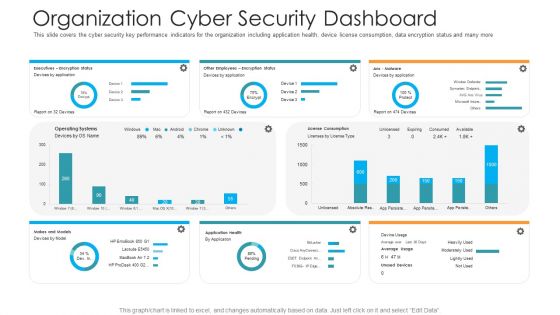
Organization Cyber Security Dashboard Hacking Prevention Awareness Training For IT Security Professional PDF
This slide covers the cyber security key performance indicators for the organization including application health, device license consumption, data encryption status and many more. Deliver and pitch your topic in the best possible manner with this organization cyber security dashboard hacking prevention awareness training for it security professional pdf. Use them to share invaluable insights on executives, license consumption, operating systems and impress your audience. This template can be altered and modified as per your expectations. So, grab it now.
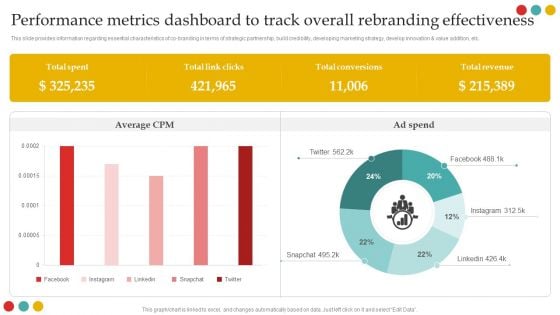
Successful Rebranding Guide Performance Metrics Dashboard To Track Overall Rebranding Effectiveness Guidelines PDF
This slide provides information regarding essential characteristics of co-branding in terms of strategic partnership, build credibility, developing marketing strategy, develop innovation value addition, etc.Want to ace your presentation in front of a live audience Our Successful Rebranding Guide Performance Metrics Dashboard To Track Overall Rebranding Effectiveness Guidelines PDF can help you do that by engaging all the users towards you. Slidegeeks experts have put their efforts and expertise into creating these impeccable powerpoint presentations so that you can communicate your ideas clearly. Moreover, all the templates are customizable, and easy-to-edit and downloadable. Use these for both personal and commercial use.
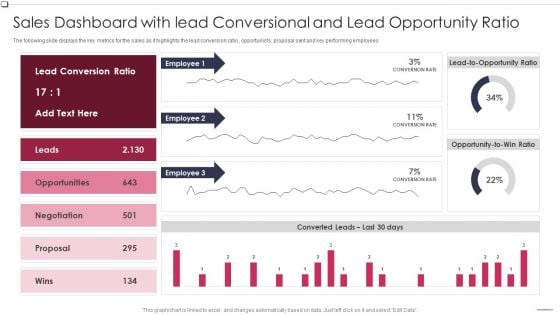
Sales Dashboard With Lead Conversional Ratio Business To Business Promotion Sales Lead Slides PDF
The following slide displays the key metrics for the sales as it highlights the lead conversion ratio , opportunists, proposal sent and key performing employees. Deliver an awe inspiring pitch with this creative Sales Dashboard With Lead Conversional Ratio Business To Business Promotion Sales Lead Slides PDF bundle. Topics like Opportunity Ratio, Converted Leads, Conversional can be discussed with this completely editable template. It is available for immediate download depending on the needs and requirements of the user.
Content Marketing Dashboard For Effective Tracking Marketing Tactics To Enhance Business Guidelines PDF
Purpose of the following slide is to show key metrics that can help the organization to track their content marketing efforts, these metrics are ad cost, visits, cost per click etc. Whether you have daily or monthly meetings, a brilliant presentation is necessary. Content Marketing Dashboard For Effective Tracking Marketing Tactics To Enhance Business Guidelines PDF can be your best option for delivering a presentation. Represent everything in detail using Content Marketing Dashboard For Effective Tracking Marketing Tactics To Enhance Business Guidelines PDF and make yourself stand out in meetings. The template is versatile and follows a structure that will cater to your requirements. All the templates prepared by Slidegeeks are easy to download and edit. Our research experts have taken care of the corporate themes as well. So, give it a try and see the results.
Target Audience Strategy For B2B And B2C Business Content Marketing Dashboard For Effective Tracking Mockup PDF
Purpose of the following slide is to show key metrics that can help the organization to track their content marketing efforts, these metrics are ad cost, visits, cost per click etc.. Do you have an important presentation coming up Are you looking for something that will make your presentation stand out from the rest Look no further than Target Audience Strategy For B2B And B2C Business Content Marketing Dashboard For Effective Tracking Mockup PDF. With our professional designs, you can trust that your presentation will pop and make delivering it a smooth process. And with Slidegeeks, you can trust that your presentation will be unique and memorable. So why wait Grab Target Audience Strategy For B2B And B2C Business Content Marketing Dashboard For Effective Tracking Mockup PDF today and make your presentation stand out from the rest
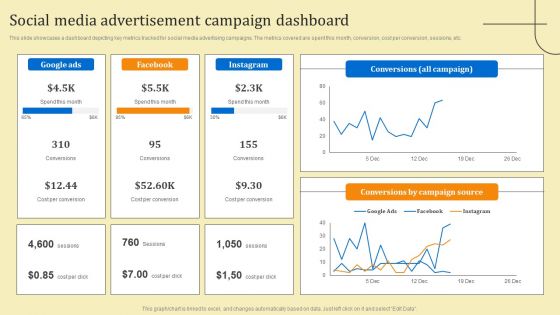
Business Sales Optimization Advertisement Campaign Social Media Advertisement Campaign Dashboard Graphics PDF
This slide showcases a dashboard depicting key metrics tracked for social media advertising campaigns. The metrics covered are spent this month, conversion, cost per conversion, sessions, etc. This modern and well arranged Business Sales Optimization Advertisement Campaign Social Media Advertisement Campaign Dashboard Graphics PDF provides lots of creative possibilities. It is very simple to customize and edit with the Powerpoint Software. Just drag and drop your pictures into the shapes. All facets of this template can be edited with Powerpoint no extra software is necessary. Add your own material, put your images in the places assigned for them, adjust the colors, and then you can show your slides to the world, with an animated slide included.
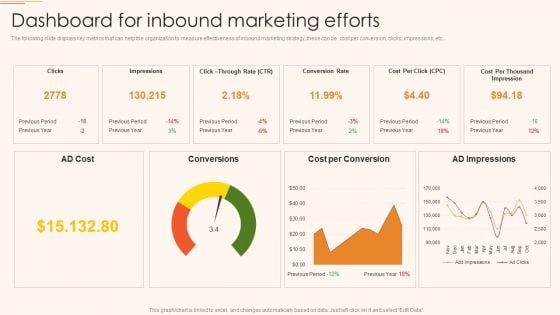
B2C And B2B Business Promotion Strategy Dashboard For Inbound Marketing Efforts Diagrams PDF
The following slide displays key metrics that can help the organization to measure effectiveness of inbound marketing strategy, these can be cost per conversion, clicks, impressions, etc. Deliver an awe inspiring pitch with this creative B2C And B2B Business Promotion Strategy Dashboard For Inbound Marketing Efforts Diagrams PDF bundle. Topics like Conversion Rate, Cost per Conversion, AD Impressions can be discussed with this completely editable template. It is available for immediate download depending on the needs and requirements of the user.

Adwords Campaign Dashboard Internet Marketing Strategies To Grow Your Business Structure PDF
Analyze the performance your AdWords campaigns by seeing which keywords resulted in the most clicks, impressions, leads, and Cost Per Click. Deliver an awe inspiring pitch with this creative adwords campaign dashboard internet marketing strategies to grow your business structure pdf bundle. Topics like performance, trend, metric, goals can be discussed with this completely editable template. It is available for immediate download depending on the needs and requirements of the user.
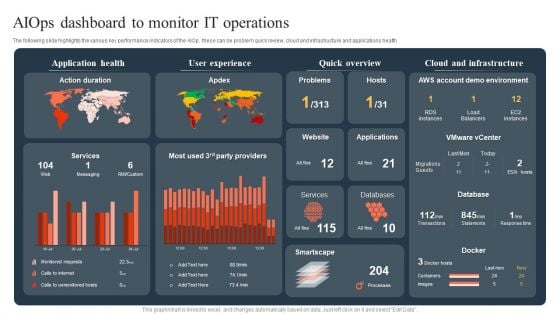
Ml And Big Data In Information Technology Processes Aiops Dashboard To Monitor IT Operations Sample PDF
The following slide highlights the various key performance indicators of the AIOp, these can be problem quick review, cloud and infrastructure and applications health If you are looking for a format to display your unique thoughts, then the professionally designed Ml And Big Data In Information Technology Processes Aiops Dashboard To Monitor IT Operations Sample PDF is the one for you. You can use it as a Google Slides template or a PowerPoint template. Incorporate impressive visuals, symbols, images, and other charts. Modify or reorganize the text boxes as you desire. Experiment with shade schemes and font pairings. Alter, share or cooperate with other people on your work. Download Ml And Big Data In Information Technology Processes Aiops Dashboard To Monitor IT Operations Sample PDF and find out how to give a successful presentation. Present a perfect display to your team and make your presentation unforgettable.
Using Social Media Platforms To Enhance Dashboard For Tracking Social Media Kpis Formats PDF
This slide shows dashboard for tracking social media key performance indicators KPIs. It provides details about average social engagement, reactions, comments, shares, clicks, thumbnail, platform, post message, etc. Are you in need of a template that can accommodate all of your creative concepts This one is crafted professionally and can be altered to fit any style. Use it with Google Slides or PowerPoint. Include striking photographs, symbols, depictions, and other visuals. Fill, move around, or remove text boxes as desired. Test out color palettes and font mixtures. Edit and save your work, or work with colleagues. Download Using Social Media Platforms To Enhance Dashboard For Tracking Social Media Kpis Formats PDF and observe how to make your presentation outstanding. Give an impeccable presentation to your group and make your presentation unforgettable.
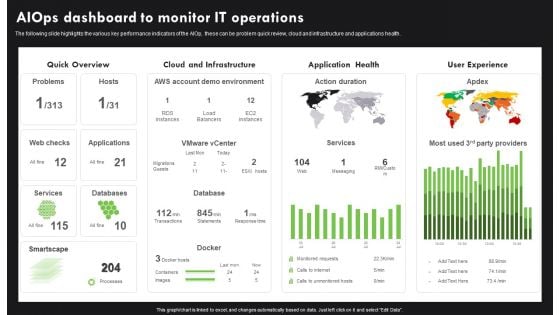
AI Deployment In IT Process Aiops Dashboard To Monitor IT Operations Infographics PDF
The following slide highlights the various key performance indicators of the AIOp, these can be problem quick review, cloud and infrastructure and applications health. If you are looking for a format to display your unique thoughts, then the professionally designed AI Deployment In IT Process Aiops Dashboard To Monitor IT Operations Infographics PDF is the one for you. You can use it as a Google Slides template or a PowerPoint template. Incorporate impressive visuals, symbols, images, and other charts. Modify or reorganize the text boxes as you desire. Experiment with shade schemes and font pairings. Alter, share or cooperate with other people on your work. Download AI Deployment In IT Process Aiops Dashboard To Monitor IT Operations Infographics PDF and find out how to give a successful presentation. Present a perfect display to your team and make your presentation unforgettable.
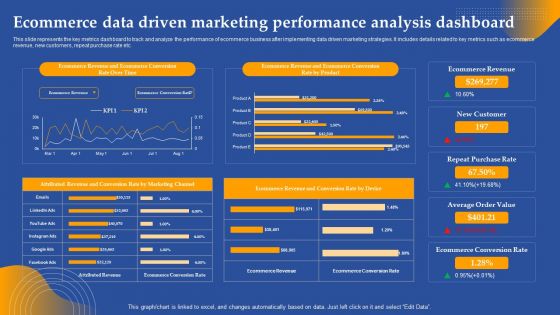
Ecommerce Data Driven Marketing Performance Analysis Dashboard Ppt Visual Aids Styles PDF
This slide represents the key metrics dashboard to track and analyze the performance of ecommerce business after implementing data driven marketing strategies. It includes details related to key metrics such as ecommerce revenue, new customers, repeat purchase rate etc. Slidegeeks has constructed Ecommerce Data Driven Marketing Performance Analysis Dashboard Ppt Visual Aids Styles PDF after conducting extensive research and examination. These presentation templates are constantly being generated and modified based on user preferences and critiques from editors. Here, you will find the most attractive templates for a range of purposes while taking into account ratings and remarks from users regarding the content. This is an excellent jumping off point to explore our content and will give new users an insight into our top notch PowerPoint Templates.
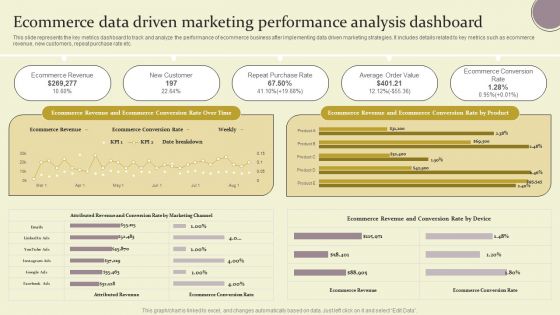
Ecommerce Data Driven Marketing Performance Analysis Dashboard Ppt Pictures Demonstration PDF
This slide represents the key metrics dashboard to track and analyze the performance of ecommerce business after implementing data driven marketing strategies. It includes details related to key metrics such as ecommerce revenue, new customers, repeat purchase rate etc. Slidegeeks has constructed Ecommerce Data Driven Marketing Performance Analysis Dashboard Ppt Pictures Demonstration PDF after conducting extensive research and examination. These presentation templates are constantly being generated and modified based on user preferences and critiques from editors. Here, you will find the most attractive templates for a range of purposes while taking into account ratings and remarks from users regarding the content. This is an excellent jumping off point to explore our content and will give new users an insight into our top notch PowerPoint Templates.
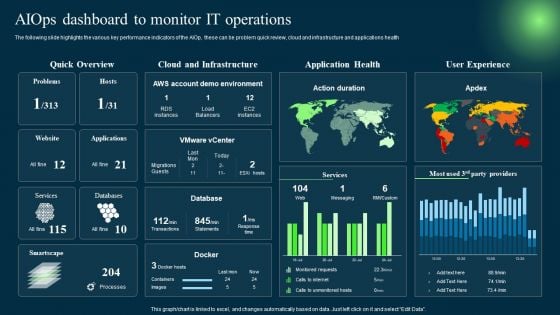
Introduction To Artificial Intelligence In Operation Management Industry Aiops Dashboard To Monitor IT Operations Clipart PDF
The following slide highlights the various key performance indicators of the AIOp, these can be problem quick review, cloud and infrastructure and applications health. Create an editable Introduction To Artificial Intelligence In Operation Management Industry Aiops Dashboard To Monitor IT Operations Clipart PDF that communicates your idea and engages your audience. Whether you are presenting a business or an educational presentation, pre-designed presentation templates help save time. Introduction To Artificial Intelligence In Operation Management Industry Aiops Dashboard To Monitor IT Operations Clipart PDF is highly customizable and very easy to edit, covering many different styles from creative to business presentations. Slidegeeks has creative team members who have crafted amazing templates. So, go and get them without any delay.
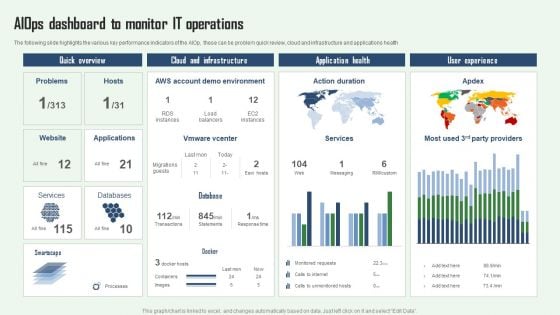
Aiops Dashboard To Monitor IT Operations Aiops Integration Summary Report Clipart PDF
The following slide highlights the various key performance indicators of the AIOp, these can be problem quick review, cloud and infrastructure and applications health. If you are looking for a format to display your unique thoughts, then the professionally designed Aiops Dashboard To Monitor IT Operations Aiops Integration Summary Report Clipart PDF is the one for you. You can use it as a Google Slides template or a PowerPoint template. Incorporate impressive visuals, symbols, images, and other charts. Modify or reorganize the text boxes as you desire. Experiment with shade schemes and font pairings. Alter, share or cooperate with other people on your work. Download Aiops Dashboard To Monitor IT Operations Aiops Integration Summary Report Clipart PDF and find out how to give a successful presentation. Present a perfect display to your team and make your presentation unforgettable.
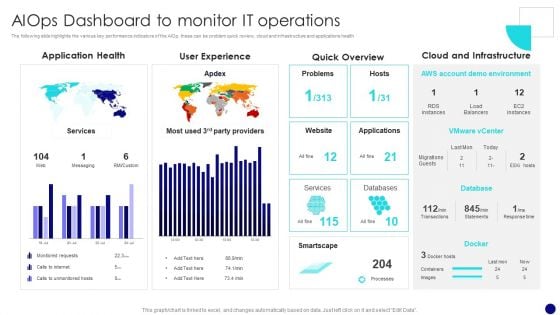
Information Technology Operations Administration With ML Aiops Dashboard To Monitor Diagrams PDF
The following slide highlights the various key performance indicators of the AIOp, these can be problem quick review, cloud and infrastructure and applications health. If you are looking for a format to display your unique thoughts, then the professionally designed Information Technology Operations Administration With ML Aiops Dashboard To Monitor Diagrams PDF is the one for you. You can use it as a Google Slides template or a PowerPoint template. Incorporate impressive visuals, symbols, images, and other charts. Modify or reorganize the text boxes as you desire. Experiment with shade schemes and font pairings. Alter, share or cooperate with other people on your work. Download Information Technology Operations Administration With ML Aiops Dashboard To Monitor Diagrams PDF and find out how to give a successful presentation. Present a perfect display to your team and make your presentation unforgettable.

Operational Strategy For ML In IT Sector Aiops Dashboard To Monitor IT Operations Diagrams PDF
The following slide highlights the various key performance indicators of the AIOps, these can be problem quick review, cloud and infrastructure and applications health If you are looking for a format to display your unique thoughts, then the professionally designed Operational Strategy For ML In IT Sector Aiops Dashboard To Monitor IT Operations Diagrams PDF is the one for you. You can use it as a Google Slides template or a PowerPoint template. Incorporate impressive visuals, symbols, images, and other charts. Modify or reorganize the text boxes as you desire. Experiment with shade schemes and font pairings. Alter, share or cooperate with other people on your work. Download Operational Strategy For ML In IT Sector Aiops Dashboard To Monitor IT Operations Diagrams PDF and find out how to give a successful presentation. Present a perfect display to your team and make your presentation unforgettable.
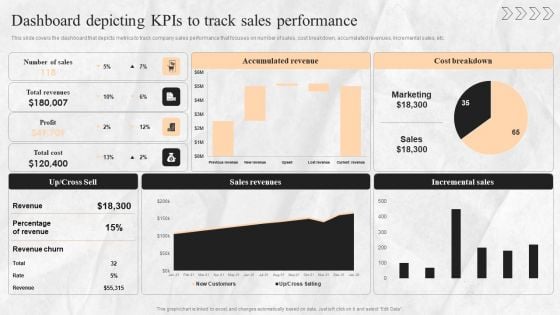
Digital Transition Plan For Managing Business Dashboard Depicting Kpis To Track Sales Performance Guidelines PDF
This slide covers the dashboard that depicts metrics to track company sales performance that focuses on number of sales, cost breakdown, accumulated revenues, incremental sales, etc. Are you in need of a template that can accommodate all of your creative concepts This one is crafted professionally and can be altered to fit any style. Use it with Google Slides or PowerPoint. Include striking photographs, symbols, depictions, and other visuals. Fill, move around, or remove text boxes as desired. Test out color palettes and font mixtures. Edit and save your work, or work with colleagues. Download Digital Transition Plan For Managing Business Dashboard Depicting Kpis To Track Sales Performance Guidelines PDF and observe how to make your presentation outstanding. Give an impeccable presentation to your group and make your presentation unforgettable.

Dashboard To Measure Performance Of Social Media Retail Business Growth Marketing Techniques Ideas PDF
This following slide displays the key metrics that can help an organization to measure effectiveness of social media strategies. These can be leads generated, leads by region, web traffic targets etc If you are looking for a format to display your unique thoughts, then the professionally designed Dashboard To Measure Performance Of Social Media Retail Business Growth Marketing Techniques Ideas PDF is the one for you. You can use it as a Google Slides template or a PowerPoint template. Incorporate impressive visuals, symbols, images, and other charts. Modify or reorganize the text boxes as you desire. Experiment with shade schemes and font pairings. Alter, share or cooperate with other people on your work. Download Dashboard To Measure Performance Of Social Media Retail Business Growth Marketing Techniques Ideas PDF and find out how to give a successful presentation. Present a perfect display to your team and make your presentation unforgettable.
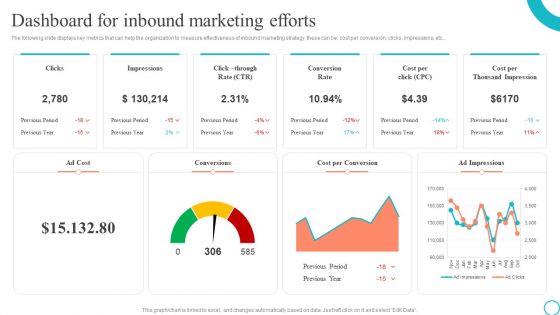
Dashboard For Inbound Marketing Efforts Marketing Tactics To Enhance Business Graphics PDF
The following slide displays key metrics that can help the organization to measure effectiveness of inbound marketing strategy, these can be cost per conversion, clicks, impressions, etc. If you are looking for a format to display your unique thoughts, then the professionally designed Dashboard For Inbound Marketing Efforts Marketing Tactics To Enhance Business Graphics PDF is the one for you. You can use it as a Google Slides template or a PowerPoint template. Incorporate impressive visuals, symbols, images, and other charts. Modify or reorganize the text boxes as you desire. Experiment with shade schemes and font pairings. Alter, share or cooperate with other people on your work. Download Dashboard For Inbound Marketing Efforts Marketing Tactics To Enhance Business Graphics PDF and find out how to give a successful presentation. Present a perfect display to your team and make your presentation unforgettable.
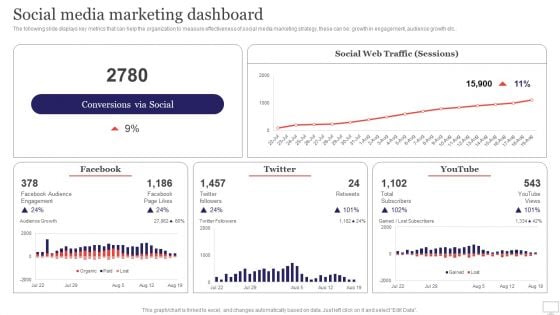
Target Audience Strategy For B2B And B2C Business Social Media Marketing Dashboard Designs PDF
The following slide displays key metrics that can help the organization to measure effectiveness of social media marketing strategy, these can be growth in engagement, audience growth etc.. Do you have an important presentation coming up Are you looking for something that will make your presentation stand out from the rest Look no further than Target Audience Strategy For B2B And B2C Business Social Media Marketing Dashboard Designs PDF. With our professional designs, you can trust that your presentation will pop and make delivering it a smooth process. And with Slidegeeks, you can trust that your presentation will be unique and memorable. So why wait Grab Target Audience Strategy For B2B And B2C Business Social Media Marketing Dashboard Designs PDF today and make your presentation stand out from the rest
Different Brands Performance Tracking Dashboard Comprehensive Guide For Brand Recognition Themes PDF
This slide provides information regarding different brands performance tracking dashboard in terms of brand metric, brand commitment, advertising metrics, and purchase metrics. Are you in need of a template that can accommodate all of your creative concepts This one is crafted professionally and can be altered to fit any style. Use it with Google Slides or PowerPoint. Include striking photographs, symbols, depictions, and other visuals. Fill, move around, or remove text boxes as desired. Test out color palettes and font mixtures. Edit and save your work, or work with colleagues. Download Different Brands Performance Tracking Dashboard Comprehensive Guide For Brand Recognition Themes PDF and observe how to make your presentation outstanding. Give an impeccable presentation to your group and make your presentation unforgettable.
Improving Brand Mentions For Customer Different Brands Performance Tracking Dashboard Formats PDF
This slide provides information regarding different brands performance tracking dashboard in terms of brand metric, brand commitment, advertising metrics, and purchase metrics. Are you in need of a template that can accommodate all of your creative concepts This one is crafted professionally and can be altered to fit any style. Use it with Google Slides or PowerPoint. Include striking photographs, symbols, depictions, and other visuals. Fill, move around, or remove text boxes as desired. Test out color palettes and font mixtures. Edit and save your work, or work with colleagues. Download Improving Brand Mentions For Customer Different Brands Performance Tracking Dashboard Formats PDF and observe how to make your presentation outstanding. Give an impeccable presentation to your group and make your presentation unforgettable.
Content Marketing Dashboard For Effective Tracking Ppt PowerPoint Presentation File Outline PDF
Purpose of the following slide is to show key metrics that can help the organization to track their content marketing efforts, these metrics are ad cost, visits, cost per click etc.. Do you have an important presentation coming up Are you looking for something that will make your presentation stand out from the rest Look no further than Content Marketing Dashboard For Effective Tracking Ppt PowerPoint Presentation File Outline PDF. With our professional designs, you can trust that your presentation will pop and make delivering it a smooth process. And with Slidegeeks, you can trust that your presentation will be unique and memorable. So why wait Grab Content Marketing Dashboard For Effective Tracking Ppt PowerPoint Presentation File Outline PDF today and make your presentation stand out from the rest.
Brand Positioning Through Successful Content Marketing Dashboard For Effective Tracking Infographics PDF
Purpose of the following slide is to show key metrics that can help the organization to track their content marketing efforts, these metrics are ad cost, visits, cost per click etc. Create an editable Brand Positioning Through Successful Content Marketing Dashboard For Effective Tracking Infographics PDF that communicates your idea and engages your audience. Whether you are presenting a business or an educational presentation, pre designed presentation templates help save time. Brand Positioning Through Successful Content Marketing Dashboard For Effective Tracking Infographics PDF is highly customizable and very easy to edit, covering many different styles from creative to business presentations. Slidegeeks has creative team members who have crafted amazing templates. So, go and get them without any delay.
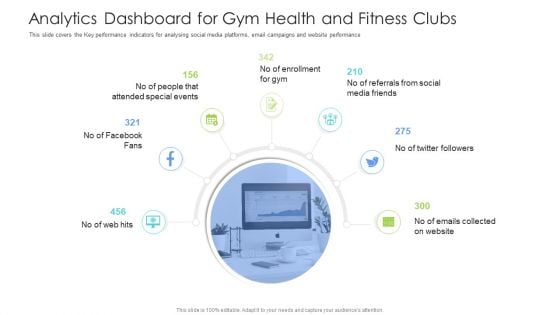
Well Being Gymnasium Sector Analytics Dashboard For Gym Health And Fitness Clubs Clipart PDF
This slide covers the Key performance indicators for analysing social media platforms, email campaigns and website performance. This is a well being gymnasium sector analytics dashboard for gym health and fitness clubs clipart pdf template with various stages. Focus and dispense information on seven stages using this creative set, that comes with editable features. It contains large content boxes to add your information on topics like special events, social media, enrollment, key performance, email campaigns. You can also showcase facts, figures, and other relevant content using this PPT layout. Grab it now.
Content Marketing Dashboard For Effective Tracking B2B Electronic Commerce Startup Information PDF
Purpose of the following slide is to show key metrics that can help the organization to track their content marketing efforts, these metrics are ad cost, visits, cost per click etc. Find highly impressive Content Marketing Dashboard For Effective Tracking B2B Electronic Commerce Startup Information PDF on Slidegeeks to deliver a meaningful presentation. You can save an ample amount of time using these presentation templates. No need to worry to prepare everything from scratch because Slidegeeks experts have already done a huge research and work for you. You need to download Content Marketing Dashboard For Effective Tracking B2B Electronic Commerce Startup Information PDF for your upcoming presentation. All the presentation templates are 100 percent editable and you can change the color and personalize the content accordingly. Download now.
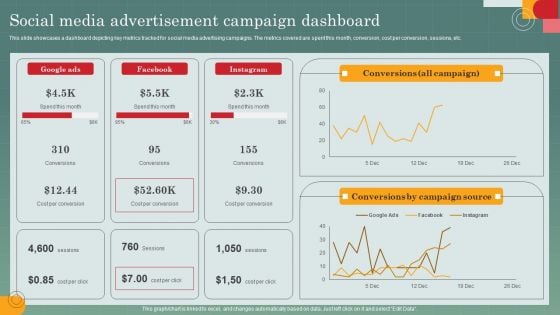
Advertising Programs Management Techniques Social Media Advertisement Campaign Dashboard Diagrams PDF
This slide showcases a dashboard depicting key metrics tracked for social media advertising campaigns. The metrics covered are spent this month, conversion, cost per conversion, sessions, etc. This modern and well arranged Advertising Programs Management Techniques Social Media Advertisement Campaign Dashboard Diagrams PDF provides lots of creative possibilities. It is very simple to customize and edit with the Powerpoint Software. Just drag and drop your pictures into the shapes. All facets of this template can be edited with Powerpoint no extra software is necessary. Add your own material, put your images in the places assigned for them, adjust the colors, and then you can show your slides to the world, with an animated slide included.
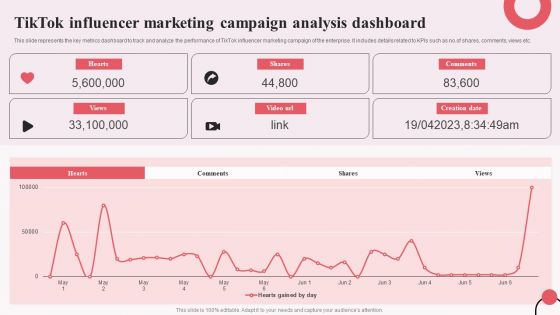
Tiktok Digital Marketing Campaign Tiktok Influencer Marketing Campaign Analysis Dashboard Brochure PDF
This slide represents the key metrics dashboard to track and analyze the performance of TikTok influencer marketing campaign of the enterprise. It includes details related to KPIs such as no.of shares, comments, views etc. The Tiktok Digital Marketing Campaign Tiktok Influencer Marketing Campaign Analysis Dashboard Brochure PDF is a compilation of the most recent design trends as a series of slides. It is suitable for any subject or industry presentation, containing attractive visuals and photo spots for businesses to clearly express their messages. This template contains a variety of slides for the user to input data, such as structures to contrast two elements, bullet points, and slides for written information. Slidegeeks is prepared to create an impression.
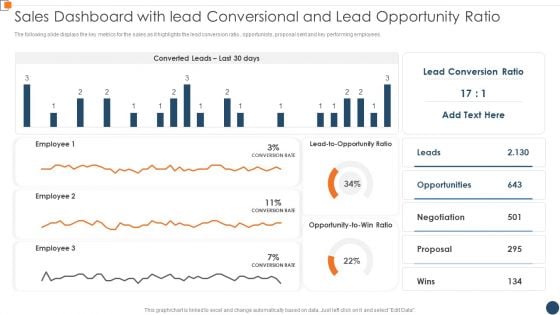
BANT Sales Lead Qualification Model Sales Dashboard With Lead Conversional And Lead Infographics PDF
The following slide displays the key metrics for the sales as it highlights the lead conversion ratio , opportunists, proposal sent and key performing employees. Deliver and pitch your topic in the best possible manner with this BANT Sales Lead Qualification Model Sales Dashboard With Lead Conversional And Lead Infographics PDF. Use them to share invaluable insights on Converted Leads, Lead Conversion, Employee Leads and impress your audience. This template can be altered and modified as per your expectations. So, grab it now.
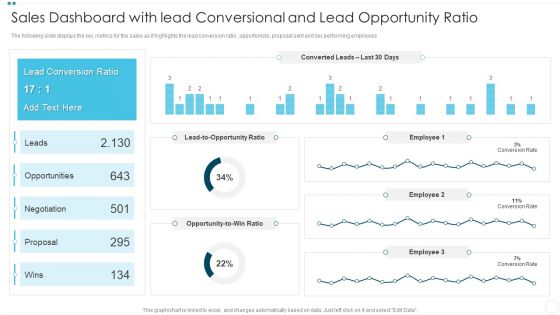
Sales Dashboard With Lead Conversional And Lead Opportunity Ratio Company Qualification Procedure Information PDF
The following slide displays the key metrics for the sales as it highlights the lead conversion ratio , opportunists, proposal sent and key performing employees.Deliver and pitch your topic in the best possible manner with this Sales Dashboard With Lead Conversional And Lead Opportunity Ratio Company Qualification Procedure Information PDF Use them to share invaluable insights on Lead Conversion, Opportunities, Negotiation and impress your audience. This template can be altered and modified as per your expectations. So, grab it now.
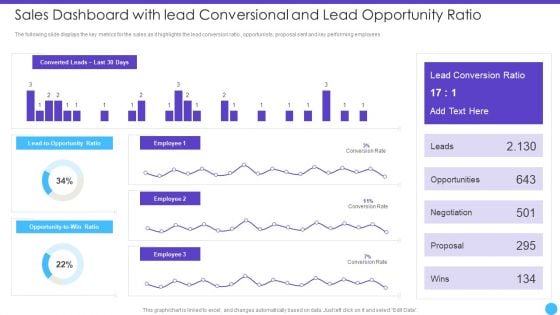
Sales Lead Qualification Rating Framework Sales Dashboard With Lead Conversional And Lead Opportunity Ratio Structure PDF
The following slide displays the key metrics for the sales as it highlights the lead conversion ratio , opportunists, proposal sent and key performing employees.Deliver an awe inspiring pitch with this creative Sales Lead Qualification Rating Framework Sales Dashboard With Lead Conversional And Lead Opportunity Ratio Structure PDF bundle. Topics like Opportunities, Negotiation, Proposal can be discussed with this completely editable template. It is available for immediate download depending on the needs and requirements of the user.
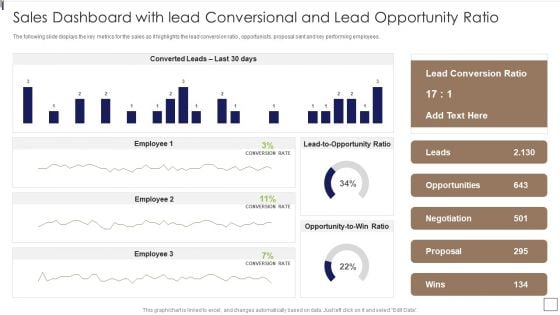
Sales Lead Qualification Procedure And Parameter Sales Dashboard With Lead Conversional Graphics PDF
The following slide displays the key metrics for the sales as it highlights the lead conversion ratio , opportunists, proposal sent and key performing employees.Deliver an awe inspiring pitch with this creative Sales Lead Qualification Procedure And Parameter Sales Dashboard With Lead Conversional Graphics PDF bundle. Topics like Lead Conversion, Opportunities, Negotiation can be discussed with this completely editable template. It is available for immediate download depending on the needs and requirements of the user.
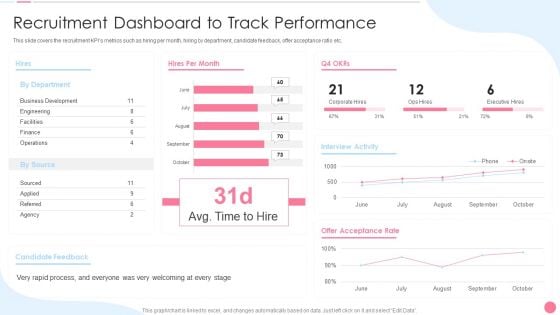
Social Media Hiring Approach Recruitment Dashboard To Track Performance Formats PDF
This slide covers the recruitment KPIs metrics such as hiring per month, hiring by department, candidate feedback, offer acceptance ratio etc. Deliver and pitch your topic in the best possible manner with this Social Media Hiring Approach Recruitment Dashboard To Track Performance Formats PDF. Use them to share invaluable insights on Business Development, Engineering, Acceptance Rate and impress your audience. This template can be altered and modified as per your expectations. So, grab it now.
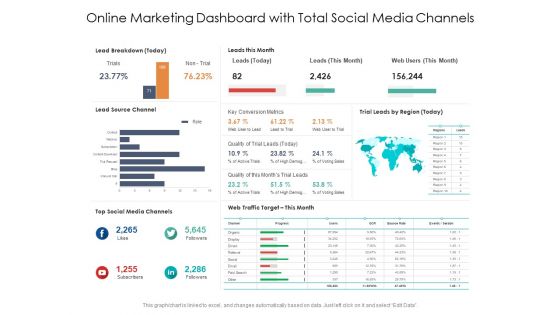
Online Marketing Dashboard With Total Social Media Channels Ppt PowerPoint Presentation Show Maker PDF
Presenting this set of slides with name online marketing dashboard with total social media channels ppt powerpoint presentation show maker pdf. The topics discussed in these slides are lead breakdown, leads this month, key conversion metrics, quality of trial leads, web traffic target, top social media channels, lead source channel. This is a completely editable PowerPoint presentation and is available for immediate download. Download now and impress your audience.
Remarketing Techniques Dashboard For Tracking Social Media Retargeting Campaigns Background PDF
This slide covers metrics for analyzing the social media retargeting campaign results. It includes KPIs such as user acquisitions, organic installs, inorganic installs, cost, etc. Deliver an awe inspiring pitch with this creative Remarketing Techniques Dashboard For Tracking Social Media Retargeting Campaigns Background PDF bundle. Topics like Non Organic Installs, Organic Installs, Media Source can be discussed with this completely editable template. It is available for immediate download depending on the needs and requirements of the user.
Remarketing Techniques Dashboard For Tracking Twitter Retargeting Campaign Tracking Infographics PDF
This slide covers metrics for analysing the results of Twitter retargeting campaigns. It includes KPIs such as click-through rate, impressions, conversion rate, cost, cost per click, etc. Deliver an awe inspiring pitch with this creative Remarketing Techniques Dashboard For Tracking Twitter Retargeting Campaign Tracking Infographics PDF bundle. Topics like Conversion Rate Cost, Cost Per Click, Platform Breakdown, Top Campaign can be discussed with this completely editable template. It is available for immediate download depending on the needs and requirements of the user.
Consumer Retargeting Techniques Dashboard For Tracking Social Media Retargeting Campaigns Icons PDF
This slide covers metrics for analyzing the social media retargeting campaign results. It includes KPIs such as user acquisitions, organic installs, inorganic installs, cost, etc. Deliver an awe inspiring pitch with this creative Consumer Retargeting Techniques Dashboard For Tracking Social Media Retargeting Campaigns Icons PDF bundle. Topics like Organic Installs, Retargeting, Attribution can be discussed with this completely editable template. It is available for immediate download depending on the needs and requirements of the user.
Consumer Retargeting Techniques Dashboard For Tracking Twitter Retargeting Campaign Tracking Guidelines PDF
This slide covers metrics for analysing the results of Twitter retargeting campaigns. It includes KPIs such as click-through rate, impressions, conversion rate, cost, cost per click, etc. Deliver and pitch your topic in the best possible manner with this Consumer Retargeting Techniques Dashboard For Tracking Twitter Retargeting Campaign Tracking Guidelines PDF. Use them to share invaluable insights on Rate Impressions, Conversion Rate, Cost Per and impress your audience. This template can be altered and modified as per your expectations. So, grab it now.
Strategies To Attract Customers And Lead Generation Dashboard For Tracking Social Media Retargeting Campaigns Themes PDF
This slide covers metrics for analyzing the social media retargeting campaign results. It includes KPIs such as user acquisitions, organic installs, inorganic installs, cost, etc. Deliver and pitch your topic in the best possible manner with this Strategies To Attract Customers And Lead Generation Dashboard For Tracking Social Media Retargeting Campaigns Themes PDF. Use them to share invaluable insights on Revenue, Cost, Media Source and impress your audience. This template can be altered and modified as per your expectations. So, grab it now.
Effective Company Event Communication Plan Dashboard For Tracking Event Gross Revenue Portrait PDF
This slide covers metrics for analyzing gross revenue generated throughout the event. It includes a graphical and tabular representation of revenue generated via promo codes and tracking links. Deliver an awe inspiring pitch with this creative Effective Company Event Communication Plan Dashboard For Tracking Event Gross Revenue Portrait PDF bundle. Topics like Gross Revenue, Promo Codes, Tracking Links can be discussed with this completely editable template. It is available for immediate download depending on the needs and requirements of the user.
Effective Company Event Communication Tactics Dashboard For Tracking Event Gross Revenue Introduction PDF
This slide covers metrics for analyzing gross revenue generated throughout the event. It includes a graphical and tabular representation of revenue generated via promo codes and tracking links. Deliver an awe inspiring pitch with this creative Effective Company Event Communication Tactics Dashboard For Tracking Event Gross Revenue Introduction PDF bundle. Topics like Discount Claimed, Gross Revenue, Codes Tracking can be discussed with this completely editable template. It is available for immediate download depending on the needs and requirements of the user.
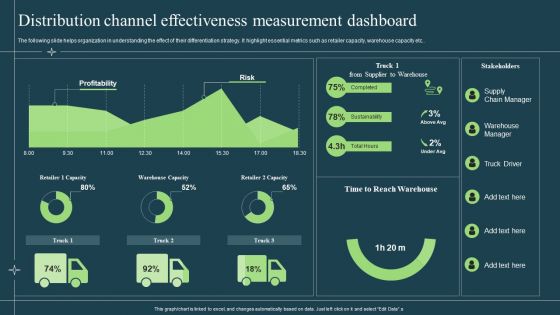
Differentiation Techniques Ways To Surpass Competitors Distribution Channel Effectiveness Measurement Dashboard Ideas PDF
The following slide helps organization in understanding the effect of their differentiation strategy. It highlight essential metrics such as retailer capacity, warehouse capacity etc. Deliver an awe inspiring pitch with this creative Differentiation Techniques Ways To Surpass Competitors Distribution Channel Effectiveness Measurement Dashboard Ideas PDF bundle. Topics like Profitability, Risk, Retailer can be discussed with this completely editable template. It is available for immediate download depending on the needs and requirements of the user.
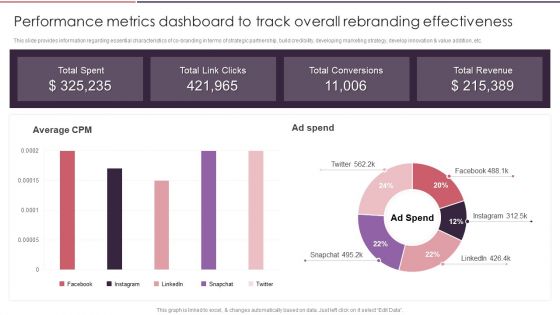
Rebranding Brand Fresh Face Development Performance Metrics Dashboard To Track Overall Rules PDF
This slide provides information regarding essential characteristics of co-branding in terms of strategic partnership, build credibility, developing marketing strategy, develop innovation and value addition, etc. Coming up with a presentation necessitates that the majority of the effort goes into the content and the message you intend to convey. The visuals of a PowerPoint presentation can only be effective if it supplements and supports the story that is being told. Keeping this in mind our experts created Rebranding Brand Fresh Face Development Performance Metrics Dashboard To Track Overall Rules PDF to reduce the time that goes into designing the presentation. This way, you can concentrate on the message while our designers take care of providing you with the right template for the situation.
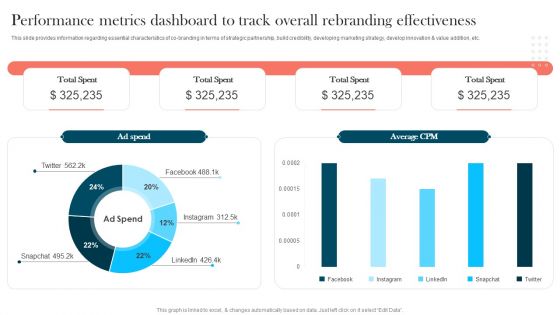
Strengthening Brand Performance Metrics Dashboard To Track Overall Rebranding Themes PDF
This slide provides information regarding essential characteristics of co-branding in terms of strategic partnership, build credibility, developing marketing strategy, develop innovation and value addition, etc. Coming up with a presentation necessitates that the majority of the effort goes into the content and the message you intend to convey. The visuals of a PowerPoint presentation can only be effective if it supplements and supports the story that is being told. Keeping this in mind our experts created Strengthening Brand Performance Metrics Dashboard To Track Overall Rebranding Themes PDF to reduce the time that goes into designing the presentation. This way, you can concentrate on the message while our designers take care of providing you with the right template for the situation.


 Continue with Email

 Home
Home


