Kpi
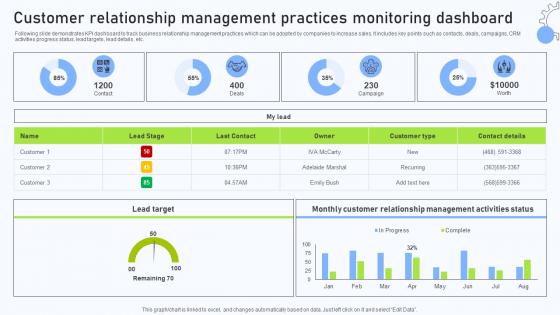
A83 Relationship Management Automation Software Customer Relationship Management
Following slide demonstrates KPI dashboard to track business relationship management practices which can be adopted by companies to increase sales. It includes key points such as contacts, deals, campaigns, CRM activities progress status, lead targets, lead details, etc. Find a pre-designed and impeccable A83 Relationship Management Automation Software Customer Relationship Management. The templates can ace your presentation without additional effort. You can download these easy-to-edit presentation templates to make your presentation stand out from others. So, what are you waiting for Download the template from Slidegeeks today and give a unique touch to your presentation. Following slide demonstrates KPI dashboard to track business relationship management practices which can be adopted by companies to increase sales. It includes key points such as contacts, deals, campaigns, CRM activities progress status, lead targets, lead details, etc.
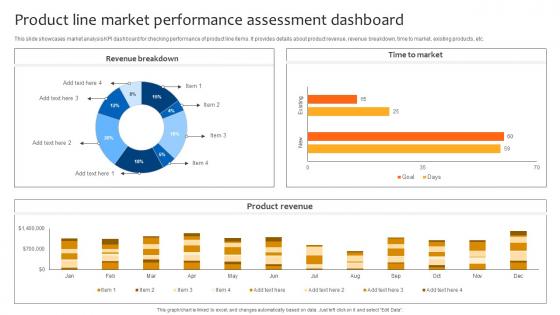
Deploying Strategies For Business Product Line Market Performance Assessment Dashboard Strategy SS V
This slide showcases market analysis KPI dashboard for checking performance of product line items. It provides details about product revenue, revenue breakdown, time to market, existing products, etc. Take your projects to the next level with our ultimate collection of Deploying Strategies For Business Product Line Market Performance Assessment Dashboard Strategy SS V. Slidegeeks has designed a range of layouts that are perfect for representing task or activity duration, keeping track of all your deadlines at a glance. Tailor these designs to your exact needs and give them a truly corporate look with your own brand colors they will make your projects stand out from the rest This slide showcases market analysis KPI dashboard for checking performance of product line items. It provides details about product revenue, revenue breakdown, time to market, existing products, etc.

Company Profit And Loss Dashboard With Income Statement Strategic Approaches To Corporate Financial
This slide provides a KPI dashboard that enables an organization to track revenue, expenses, and profit incurred in a specific period. It includes gross profit margin, OPEX ratio, operating profit margin, and net profit margin. Want to ace your presentation in front of a live audience Our Company Profit And Loss Dashboard With Income Statement Strategic Approaches To Corporate Financial can help you do that by engaging all the users towards you. Slidegeeks experts have put their efforts and expertise into creating these impeccable powerpoint presentations so that you can communicate your ideas clearly. Moreover, all the templates are customizable, and easy-to-edit and downloadable. Use these for both personal and commercial use. This slide provides a KPI dashboard that enables an organization to track revenue, expenses, and profit incurred in a specific period. It includes gross profit margin, OPEX ratio, operating profit margin, and net profit margin.
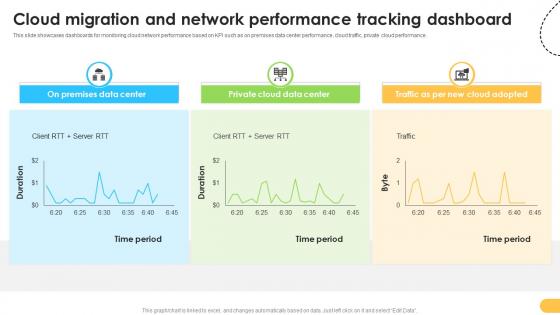
Cloud Migration And Network Performance Data Migration From On Premises
This slide showcases dashboards for monitoring cloud network performance based on KPI such as on premises data center performance, cloud traffic, private cloud performance. Present like a pro with Cloud Migration And Network Performance Data Migration From On Premises. Create beautiful presentations together with your team, using our easy-to-use presentation slides. Share your ideas in real-time and make changes on the fly by downloading our templates. So whether you are in the office, on the go, or in a remote location, you can stay in sync with your team and present your ideas with confidence. With Slidegeeks presentation got a whole lot easier. Grab these presentations today. This slide showcases dashboards for monitoring cloud network performance based on KPI such as on premises data center performance, cloud traffic, private cloud performance.
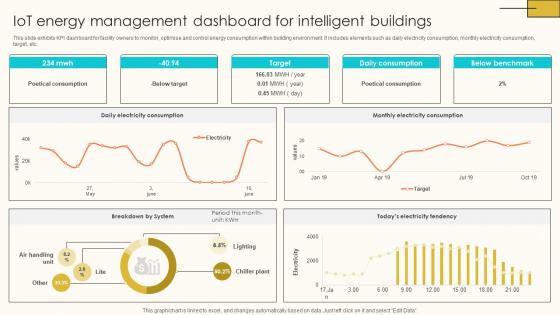
IoT Energy Management Dashboard For Internet Of Things Solutions To Enhance Energy IoT SS V
This slide exhibits KPI dashboard for facility owners to monitor, optimise and control energy consumption within building environment. It includes elements such as daily electricity consumption, monthly electricity consumption, target, etc. This modern and well-arranged IoT Energy Management Dashboard For Internet Of Things Solutions To Enhance Energy IoT SS V provides lots of creative possibilities. It is very simple to customize and edit with the Powerpoint Software. Just drag and drop your pictures into the shapes. All facets of this template can be edited with Powerpoint, no extra software is necessary. Add your own material, put your images in the places assigned for them, adjust the colors, and then you can show your slides to the world, with an animated slide included. This slide exhibits KPI dashboard for facility owners to monitor, optimise and control energy consumption within building environment. It includes elements such as daily electricity consumption, monthly electricity consumption, target, etc.

B2B Marketing Techniques Social Media Marketing Campaign Objectives To Drive Sales
This slide showcases SMART objectives for social media marketing campaign based on customer journey stages. It provides information regarding buyer journey, activities, social media objectives and KPI metrics. Explore a selection of the finest B2B Marketing Techniques Social Media Marketing Campaign Objectives To Drive Sales here. With a plethora of professionally designed and pre-made slide templates, you can quickly and easily find the right one for your upcoming presentation. You can use our B2B Marketing Techniques Social Media Marketing Campaign Objectives To Drive Sales to effectively convey your message to a wider audience. Slidegeeks has done a lot of research before preparing these presentation templates. The content can be personalized and the slides are highly editable. Grab templates today from Slidegeeks. This slide showcases SMART objectives for social media marketing campaign based on customer journey stages. It provides information regarding buyer journey, activities, social media objectives and KPI metrics.
Strategic Supplier Evaluation Supplier Audit Strategy Selection For Managing
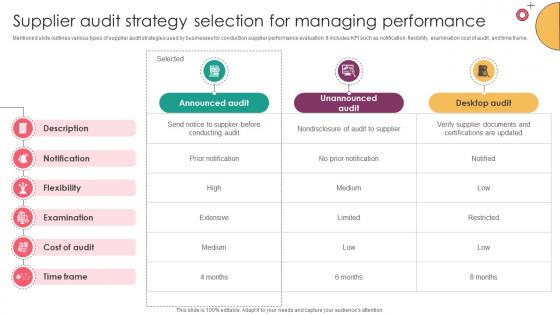
Mentioned slide outlines various types of supplier audit strategies used by businesses for conduction supplier performance evaluation. It includes KPI such as notification, flexibility, examination cost of audit, and time frame. The Strategic Supplier Evaluation Supplier Audit Strategy Selection For Managing is a compilation of the most recent design trends as a series of slides. It is suitable for any subject or industry presentation, containing attractive visuals and photo spots for businesses to clearly express their messages. This template contains a variety of slides for the user to input data, such as structures to contrast two elements, bullet points, and slides for written information. Slidegeeks is prepared to create an impression. Mentioned slide outlines various types of supplier audit strategies used by businesses for conduction supplier performance evaluation. It includes KPI such as notification, flexibility, examination cost of audit, and time frame.
Working Procedure Of Microloans In Microfinance Aiding Complete Guide To Microfinance Fin SS V
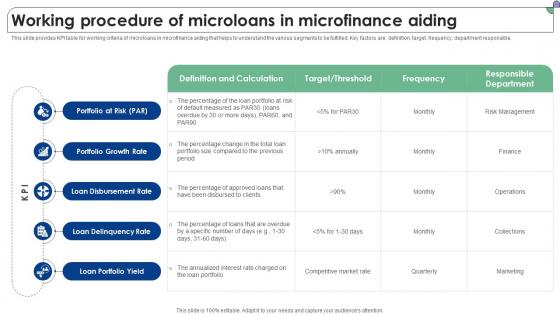
This slide provides KPI table for working criteria of microloans in microfinance aiding that helps to understand the various segments to be fulfilled. Key factors are definition, target, frequency, department responsible. This Working Procedure Of Microloans In Microfinance Aiding Complete Guide To Microfinance Fin SS V is perfect for any presentation, be it in front of clients or colleagues. It is a versatile and stylish solution for organizing your meetings. The Working Procedure Of Microloans In Microfinance Aiding Complete Guide To Microfinance Fin SS V features a modern design for your presentation meetings. The adjustable and customizable slides provide unlimited possibilities for acing up your presentation. Slidegeeks has done all the homework before launching the product for you. So, do not wait, grab the presentation templates today This slide provides KPI table for working criteria of microloans in microfinance aiding that helps to understand the various segments to be fulfilled. Key factors are definition, target, frequency, department responsible.
Brand Extension Techniques Product Line Market Performance Assessment Dashboard Strategy SS V
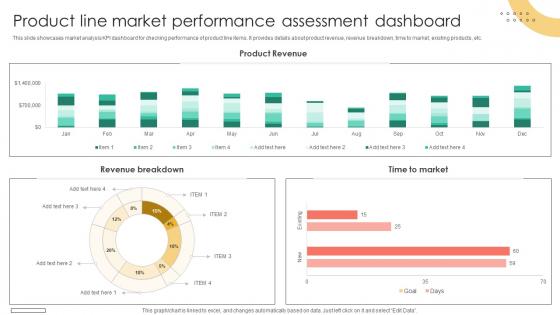
This slide showcases market analysis KPI dashboard for checking performance of product line items. It provides details about product revenue, revenue breakdown, time to market, existing products, etc. This Brand Extension Techniques Product Line Market Performance Assessment Dashboard Strategy SS V from Slidegeeks makes it easy to present information on your topic with precision. It provides customization options, so you can make changes to the colors, design, graphics, or any other component to create a unique layout. It is also available for immediate download, so you can begin using it right away. Slidegeeks has done good research to ensure that you have everything you need to make your presentation stand out. Make a name out there for a brilliant performance. This slide showcases market analysis KPI dashboard for checking performance of product line items. It provides details about product revenue, revenue breakdown, time to market, existing products, etc.

Strategies For Stabilizing Corporate Company Profit And Loss Dashboard With Income Statement
This slide provides a KPI dashboard that enables an organization to track revenue, expenses, and profit incurred in a specific period. It includes gross profit margin, OPEX ratio, operating profit margin, and net profit margin. There are so many reasons you need a Strategies For Stabilizing Corporate Company Profit And Loss Dashboard With Income Statement. The first reason is you can not spend time making everything from scratch, Thus, Slidegeeks has made presentation templates for you too. You can easily download these templates from our website easily. This slide provides a KPI dashboard that enables an organization to track revenue, expenses, and profit incurred in a specific period. It includes gross profit margin, OPEX ratio, operating profit margin, and net profit margin.
Prescriptive Analytics Dashboard To Track Website Sales Data Analytics SS V
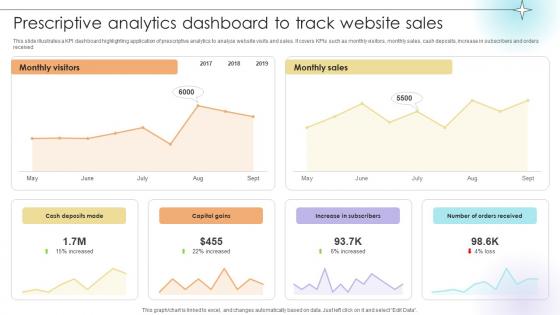
This slide illustrates a KPI dashboard highlighting application of prescriptive analytics to analyze website visits and sales. It covers KPIs such as monthly visitors, monthly sales, cash deposits, increase in subscribers and orders received.This modern and well-arranged Prescriptive Analytics Dashboard To Track Website Sales Data Analytics SS V provides lots of creative possibilities. It is very simple to customize and edit with the Powerpoint Software. Just drag and drop your pictures into the shapes. All facets of this template can be edited with Powerpoint, no extra software is necessary. Add your own material, put your images in the places assigned for them, adjust the colors, and then you can show your slides to the world, with an animated slide included. This slide illustrates a KPI dashboard highlighting application of prescriptive analytics to analyze website visits and sales. It covers KPIs such as monthly visitors, monthly sales, cash deposits, increase in subscribers and orders received.
Effective Data Migration Cloud Migration And Network Performance Tracking
This slide showcases dashboards for monitoring cloud network performance based on KPI such as on premises data center performance, cloud traffic, private cloud performance. Present like a pro with Effective Data Migration Cloud Migration And Network Performance Tracking. Create beautiful presentations together with your team, using our easy-to-use presentation slides. Share your ideas in real-time and make changes on the fly by downloading our templates. So whether you are in the office, on the go, or in a remote location, you can stay in sync with your team and present your ideas with confidence. With Slidegeeks presentation got a whole lot easier. Grab these presentations today. This slide showcases dashboards for monitoring cloud network performance based on KPI such as on premises data center performance, cloud traffic, private cloud performance.
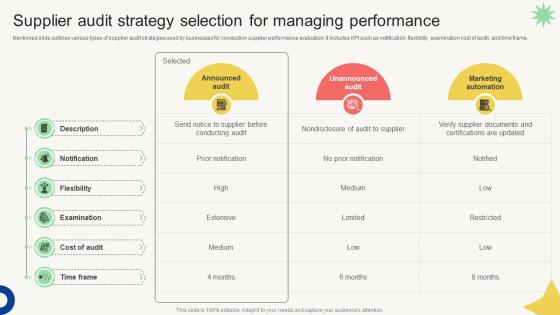
Vendor Management Audit Supplier Audit Strategy Selection For Managing Performance
Mentioned slide outlines various types of supplier audit strategies used by businesses for conduction supplier performance evaluation. It includes KPI such as notification, flexibility, examination cost of audit, and time frame. Retrieve professionally designed Vendor Management Audit Supplier Audit Strategy Selection For Managing Performance to effectively convey your message and captivate your listeners. Save time by selecting pre-made slideshows that are appropriate for various topics, from business to educational purposes. These themes come in many different styles, from creative to corporate, and all of them are easily adjustable and can be edited quickly. Access them as PowerPoint templates or as Google Slides themes. You do not have to go on a hunt for the perfect presentation because Slidegeeks got you covered from everywhere. Mentioned slide outlines various types of supplier audit strategies used by businesses for conduction supplier performance evaluation. It includes KPI such as notification, flexibility, examination cost of audit, and time frame.
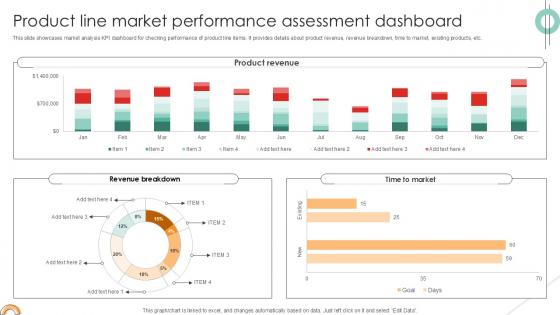
Product Line Market Performance Implementing Product Diversification PPT Sample Strategy SS V
This slide showcases market analysis KPI dashboard for checking performance of product line items. It provides details about product revenue, revenue breakdown, time to market, existing products, etc. Do you know about Slidesgeeks Product Line Market Performance Implementing Product Diversification PPT Sample Strategy SS V. These are perfect for delivering any kind od presentation. Using it, create PowerPoint presentations that communicate your ideas and engage audiences. Save time and effort by using our pre-designed presentation templates that are perfect for a wide range of topic. Our vast selection of designs covers a range of styles, from creative to business, and are all highly customizable and easy to edit. Download as a PowerPoint template or use them as Google Slides themes. This slide showcases market analysis KPI dashboard for checking performance of product line items. It provides details about product revenue, revenue breakdown, time to market, existing products, etc.

Measuring Customer Satisfaction Improving Customer Retention PPT Template
The following slide covers KPI dashboard to evaluate customer satisfaction score. It includes elements such as requests answered, total revenue, service level, cost per support, retention rate, average time taken to resolve an issue etc. This modern and well-arranged Measuring Customer Satisfaction Improving Customer Retention PPT Template provides lots of creative possibilities. It is very simple to customize and edit with the Powerpoint Software. Just drag and drop your pictures into the shapes. All facets of this template can be edited with Powerpoint, no extra software is necessary. Add your own material, put your images in the places assigned for them, adjust the colors, and then you can show your slides to the world, with an animated slide included. The following slide covers KPI dashboard to evaluate customer satisfaction score. It includes elements such as requests answered, total revenue, service level, cost per support, retention rate, average time taken to resolve an issue etc.
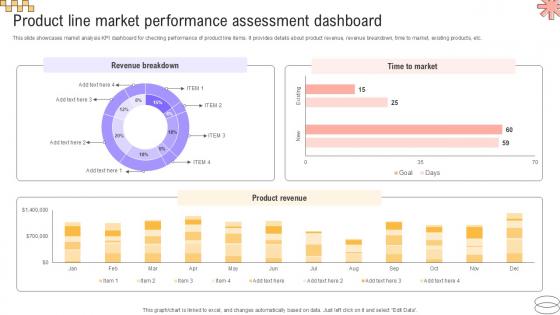
Product Line Market Performance Implementing Geographic Extension PPT Slide Strategy SS V
This slide showcases market analysis KPI dashboard for checking performance of product line items. It provides details about product revenue, revenue breakdown, time to market, existing products, etc. Take your projects to the next level with our ultimate collection of Product Line Market Performance Implementing Geographic Extension PPT Slide Strategy SS V. Slidegeeks has designed a range of layouts that are perfect for representing task or activity duration, keeping track of all your deadlines at a glance. Tailor these designs to your exact needs and give them a truly corporate look with your own brand colors they will make your projects stand out from the rest This slide showcases market analysis KPI dashboard for checking performance of product line items. It provides details about product revenue, revenue breakdown, time to market, existing products, etc.

Measuring Customer Satisfaction Enhancing Customer Experience Ppt Sample
The following slide covers KPI dashboard to evaluate customer satisfaction score. It includes elements such as requests answered, total revenue, service level, cost per support, retention rate, average time taken to resolve an issue etc. This modern and well-arranged Measuring Customer Satisfaction Enhancing Customer Experience Ppt Sample provides lots of creative possibilities. It is very simple to customize and edit with the Powerpoint Software. Just drag and drop your pictures into the shapes. All facets of this template can be edited with Powerpoint, no extra software is necessary. Add your own material, put your images in the places assigned for them, adjust the colors, and then you can show your slides to the world, with an animated slide included. The following slide covers KPI dashboard to evaluate customer satisfaction score. It includes elements such as requests answered, total revenue, service level, cost per support, retention rate, average time taken to resolve an issue etc.
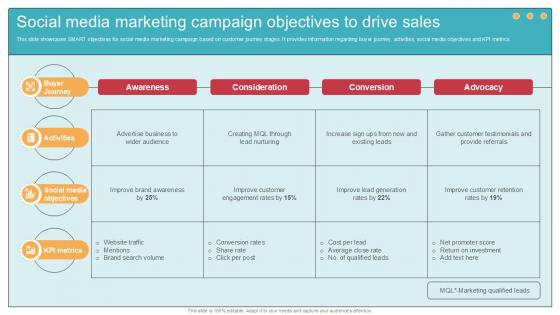
Social Media Marketing Campaign Comprehensive Guide To Wholesale Ppt Example
This slide showcases SMART objectives for social media marketing campaign based on customer journey stages. It provides information regarding buyer journey, activities, social media objectives and KPI metrics. Here you can discover an assortment of the finest PowerPoint and Google Slides templates. With these templates, you can create presentations for a variety of purposes while simultaneously providing your audience with an eye-catching visual experience. Download Social Media Marketing Campaign Comprehensive Guide To Wholesale Ppt Example to deliver an impeccable presentation. These templates will make your job of preparing presentations much quicker, yet still, maintain a high level of quality. Slidegeeks has experienced researchers who prepare these templates and write high-quality content for you. Later on, you can personalize the content by editing the Social Media Marketing Campaign Comprehensive Guide To Wholesale Ppt Example. This slide showcases SMART objectives for social media marketing campaign based on customer journey stages. It provides information regarding buyer journey, activities, social media objectives and KPI metrics.

Key Performance Indicators For Staff Growth Topics PDF
The following slide highlights the key performance Indicators for staff growth illustrating KPI and score for four domains which includes teamwork, communication, customer service and job functions Pitch your topic with ease and precision using this Key Performance Indicators For Staff Growth Topics PDF This layout presents information on Customer Engagement, Responsiveness, Problem Handling It is also available for immediate download and adjustment. So, changes can be made in the color, design, graphics or any other component to create a unique layout.
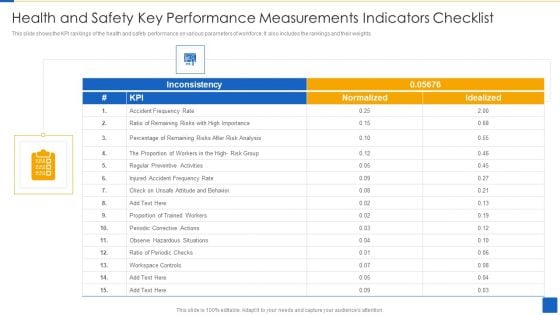
Health And Safety Key Performance Measurements Indicators Checklist Brochure PDF
This slide shows the KPI rankings of the health and safety performance on various parameters of workforce. It also includes the rankings and their weights. Pitch your topic with ease and precision using this Health And Safety Key Performance Measurements Indicators Checklist Brochure PDF This layout presents information on Injured Accident, Inconsistency, Proportion Trained Workers It is also available for immediate download and adjustment. So, changes can be made in the color, design, graphics or any other component to create a unique layout.
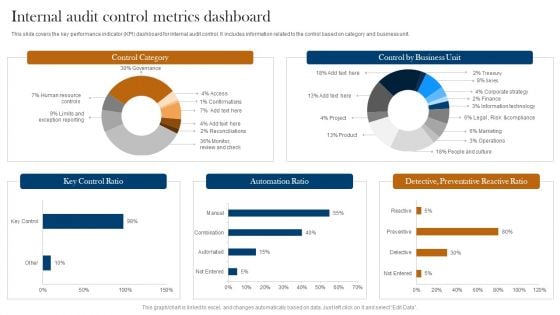
Internal Audit Control Metrics Dashboard Ppt Professional Design Templates PDF
This slide covers the key performance indicator KPI dashboard for internal audit control. It includes information related to the control based on category and business unit. Showcasing this set of slides titled Internal Audit Control Metrics Dashboard Ppt Professional Design Templates PDF. The topics addressed in these templates are Control Category, Key Control Ratio, Automation Ratio. All the content presented in this PPT design is completely editable. Download it and make adjustments in color, background, font etc. as per your unique business setting.
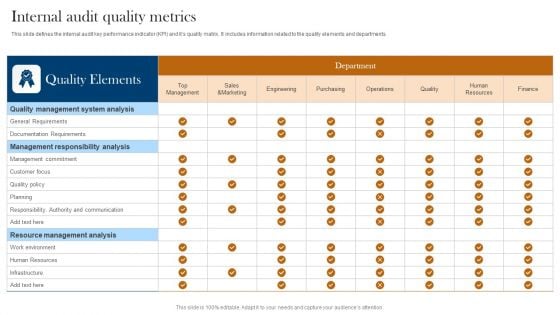
Internal Audit Quality Metrics Ppt Pictures Clipart Images PDF
This slide defines the internal audit key performance indicator KPI and its quality matrix. It includes information related to the quality elements and departments. Showcasing this set of slides titled Internal Audit Quality Metrics Ppt Pictures Clipart Images PDF. The topics addressed in these templates are Quality Elements, Department, Management Responsibility Analysis. All the content presented in this PPT design is completely editable. Download it and make adjustments in color, background, font etc. as per your unique business setting.
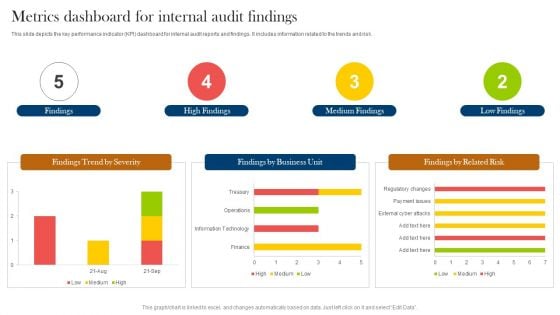
Metrics Dashboard For Internal Audit Findings Ppt Styles Gallery PDF
This slide depicts the key performance indicator KPI dashboard for internal audit reports and findings. It includes information related to the trends and risk. Pitch your topic with ease and precision using this Metrics Dashboard For Internal Audit Findings Ppt Styles Gallery PDF. This layout presents information on Findings, High Findings, Medium Findings, Low Findings. It is also available for immediate download and adjustment. So, changes can be made in the color, design, graphics or any other component to create a unique layout.
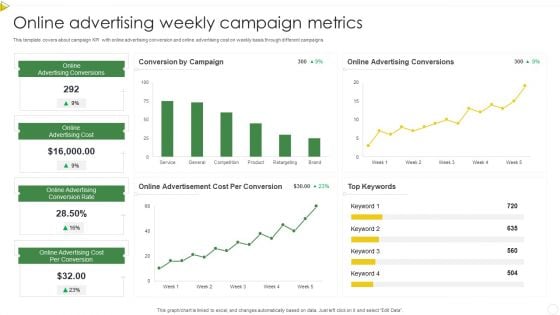
Online Advertising Weekly Campaign Metrics Designs PDF
This template covers about campaign KPI with online advertising conversion and online advertising cost on weekly basis through different campaigns. Showcasing this set of slides titled Online Advertising Weekly Campaign Metrics Designs PDF. The topics addressed in these templates are Online Advertising Cost, Online Advertising Conversions. All the content presented in this PPT design is completely editable. Download it and make adjustments in color, background, font etc. as per your unique business setting.

Monthly Financial Metrics Dashboard With Revenue And Expenditure Rules PDF
This slide showcases KPI dashboard for monitoring financial health of business to ensure smooth flow of business operations. It includes details such as COGS, net profit, cost breakdown, etc. Showcasing this set of slides titled Monthly Financial Metrics Dashboard With Revenue And Expenditure Rules PDF. The topics addressed in these templates are Net Profit, Costs, Expenditure. All the content presented in this PPT design is completely editable. Download it and make adjustments in color, background, font etc. as per your unique business setting.
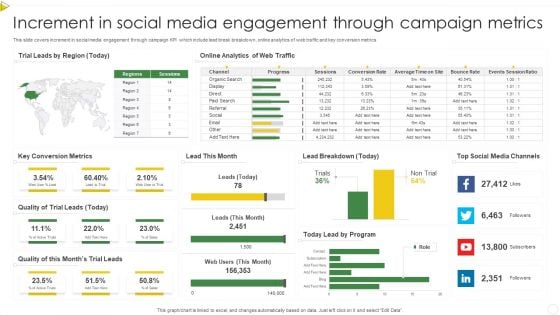
Increment In Social Media Engagement Through Campaign Metrics Professional PDF
This slide covers increment in social media engagement through campaign KPI which include lead break breakdown, online analytics of web traffic and key conversion metrics. Pitch your topic with ease and precision using this Increment In Social Media Engagement Through Campaign Metrics Professional PDF. This layout presents information on Quality, Key Conversion Metrics, Social Media. It is also available for immediate download and adjustment. So, changes can be made in the color, design, graphics or any other component to create a unique layout.
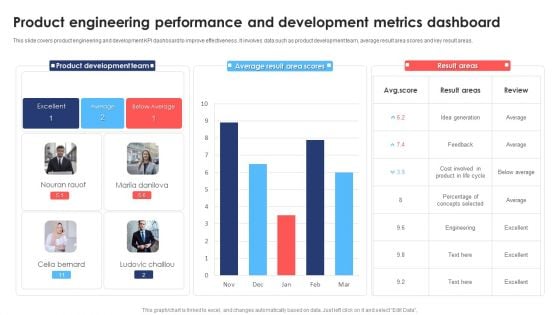
Product Engineering Performance And Development Metrics Dashboard Topics PDF
This slide covers product engineering and development KPI dashboard to improve effectiveness. It involves data such as product development team, average result area scores and key result areas. Showcasing this set of slides titled Product Engineering Performance And Development Metrics Dashboard Topics PDF. The topics addressed in these templates are Product Development Team, Average, Cost. All the content presented in this PPT design is completely editable. Download it and make adjustments in color, background, font etc. as per your unique business setting.
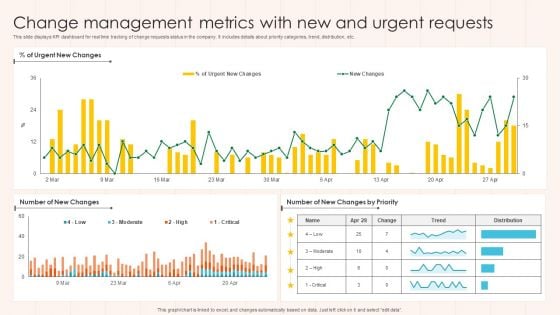
Change Management Metrics With New And Urgent Requests Summary PDF
This slide displays KPI dashboard for real time tracking of change requests status in the company. It includes details about priority categories, trend, distribution, etc. Showcasing this set of slides titled Change Management Metrics With New And Urgent Requests Summary PDF The topics addressed in these templates are Urgent Requests, Priority, Changes. All the content presented in this PPT design is completely editable. Download it and make adjustments in color, background, font etc. as per your unique business setting.
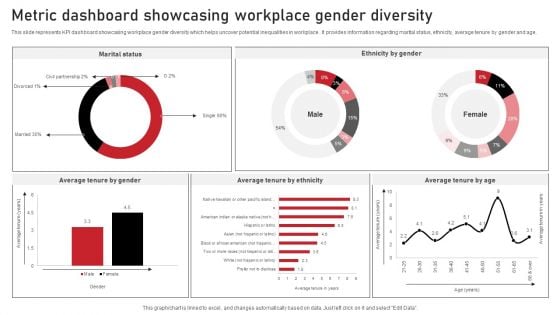
Metric Dashboard Showcasing Workplace Gender Diversity Microsoft PDF
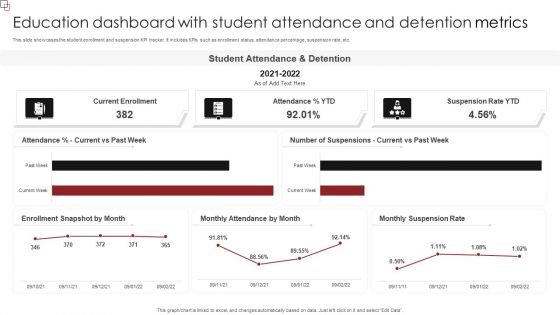
Education Dashboard With Student Attendance And Detention Metrics Inspiration PDF
This slide showcases the student enrollment and suspension KPI tracker. It includes KPIs such as enrollment status, attendance percentage, suspension rate, etc. Pitch your topic with ease and precision using this Education Dashboard With Student Attendance And Detention Metrics Inspiration PDF. This layout presents information on Student Attendance, Suspension Rate YTD, Current Enrollment. It is also available for immediate download and adjustment. So, changes can be made in the color, design, graphics or any other component to create a unique layout.
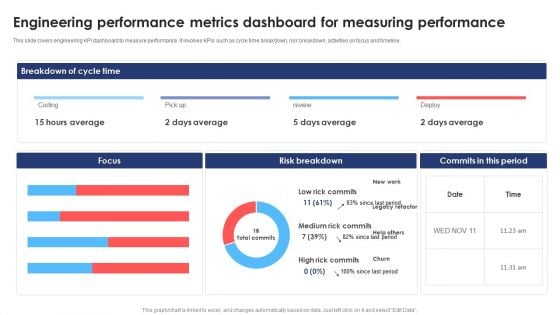
Engineering Performance Metrics Dashboard For Measuring Performance Download PDF
This slide covers engineering KPI dashboard to measure performance. It involves KPIs such as cycle time breakdown, risk breakdown, activities on focus and timeline. Pitch your topic with ease and precision using this Engineering Performance Metrics Dashboard For Measuring Performance Download PDF. This layout presents information on Average, Risk Breakdown, Measuring Performance. It is also available for immediate download and adjustment. So, changes can be made in the color, design, graphics or any other component to create a unique layout.
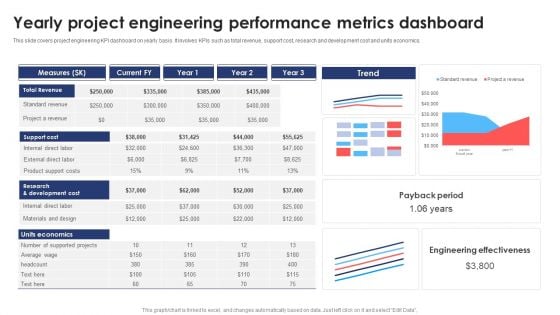
Yearly Project Engineering Performance Metrics Dashboard Information PDF
This slide covers project engineering KPI dashboard on yearly basis. It involves KPIs such as total revenue, support cost, research and development cost and units economics. Pitch your topic with ease and precision using this Yearly Project Engineering Performance Metrics Dashboard Information PDF. This layout presents information on Support Cost, Revenue, Measures. It is also available for immediate download and adjustment. So, changes can be made in the color, design, graphics or any other component to create a unique layout.
Project Tracking Dashboard With Multiple Metrics Pictures PDF
The following slide highlights the KPI of project management to avoid deviations. It includes elements such as schedule, tasks, issue assessment, budget and risk analysis etc. Pitch your topic with ease and precision using this Project Tracking Dashboard With Multiple Metrics Pictures PDF. This layout presents information on Projected Budget Analysis, Risk Analysis, Quality Affirmation. It is also available for immediate download and adjustment. So, changes can be made in the color, design, graphics or any other component to create a unique layout.
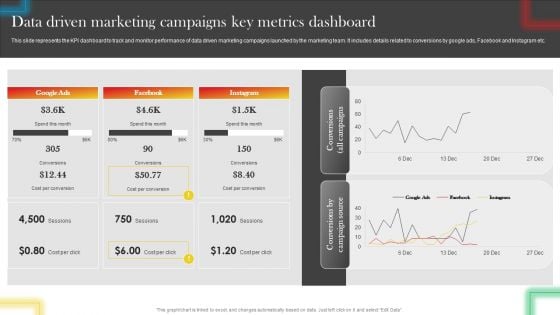
Data Driven Marketing Campaigns Key Metrics Dashboard Microsoft PDF
This slide represents the KPI dashboard to track and monitor performance of data driven marketing campaigns launched by the marketing team. It includes details related to conversions by google ads, Facebook and Instagram etc. There are so many reasons you need a Data Driven Marketing Campaigns Key Metrics Dashboard Microsoft PDF. The first reason is you can not spend time making everything from scratch, Thus, Slidegeeks has made presentation templates for you too. You can easily download these templates from our website easily.

Internal Audit Metrics Flowchart Ppt Infographic Template Example Introduction PDF
This slide depicts the flowchart for the internal audit KPI metrics. It includes the information related to steps involved in the audit process and planning. Presenting Internal Audit Metrics Flowchart Ppt Infographic Template Example Introduction PDF to dispense important information. This template comprises one stages. It also presents valuable insights into the topics including Audit Members, Risk Assessment, Audit Scheduling. This is a completely customizable PowerPoint theme that can be put to use immediately. So, download it and address the topic impactfully.
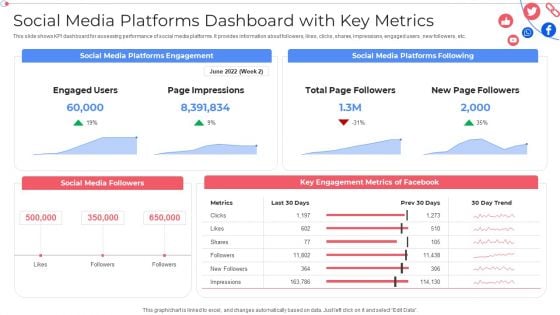
Social Media Platforms Dashboard With Key Metrics Customer Group Engagement Through Social Media Channels Infographics PDF
This slide shows KPI dashboard for assessing performance of social media platforms. It provides information about followers, likes, clicks, shares, impressions, engaged users , new followers, etc. Deliver an awe inspiring pitch with this creative Social Media Platforms Dashboard With Key Metrics Customer Group Engagement Through Social Media Channels Infographics PDF bundle. Topics like Social Media Followers, Key Engagement Metrics can be discussed with this completely editable template. It is available for immediate download depending on the needs and requirements of the user.
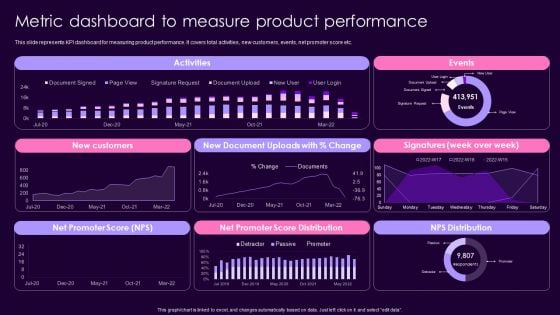
Product Management Techniques Metric Dashboard To Measure Product Performance Microsoft PDF
This slide represents KPI dashboard for measuring product performance. It covers total activities, new customers, events, net promoter score etc. Deliver and pitch your topic in the best possible manner with this Product Management Techniques Metric Dashboard To Measure Product Performance Microsoft PDF. Use them to share invaluable insights on Activities, New Customers, Net Promoter Score and impress your audience. This template can be altered and modified as per your expectations. So, grab it now.
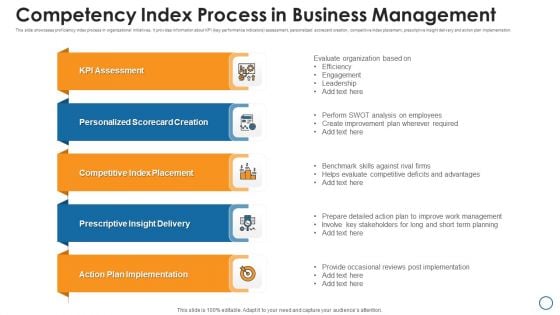
Competency Index Process In Business Management Mockup PDF
This slide showcases proficiency index process in organizational initiatives. It provides information about KPI key performance indicators assessment, personalized scorecard creation, competitive index placement, prescriptive insight delivery and action plan implementation. Presenting competency index process in business management mockup pdf to dispense important information. This template comprises five stages. It also presents valuable insights into the topics including evaluate, analysis, plan. This is a completely customizable PowerPoint theme that can be put to use immediately. So, download it and address the topic impactfully.
Email Marketing Campaign Kpis Tracking Dashboard Graphics PDF
This slide shows key performance indicators KPI dashboard for measuring effectiveness of email campaigns. It provides information about sent, delivered, opens, clicks, unsubscribed, bounces, complaints, etc. Pitch your topic with ease and precision using this Email Marketing Campaign Kpis Tracking Dashboard Graphics PDF. This layout presents information on Email Marketing Campaign, Tracking Dashboard. It is also available for immediate download and adjustment. So, changes can be made in the color, design, graphics or any other component to create a unique layout.
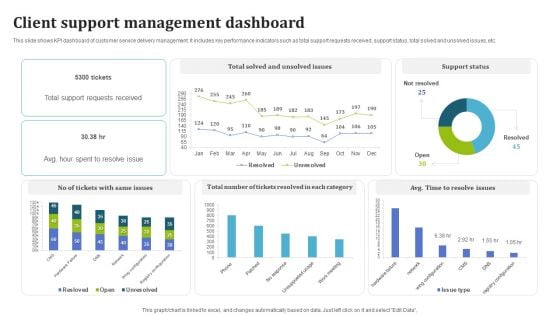
Client Support Management Dashboard Designs PDF
This slide shows KPI dashboard of customer service delivery management. It includes key performance indicators such as total support requests received, support status, total solved and unsolved issues, etc. Pitch your topic with ease and precision using this Client Support Management Dashboard Designs PDF. This layout presents information on Client Support, Management Dashboard. It is also available for immediate download and adjustment. So, changes can be made in the color, design, graphics or any other component to create a unique layout.
Client Support Satisfaction Dashboard Icons PDF
This slide shows KPI dashboard which can be used to track customer satisfaction level. It includes key performance indicators such as total requests, cases by channel, customer satisfaction by subject, etc. Showcasing this set of slides titled Client Support Satisfaction Dashboard Icons PDF. The topics addressed in these templates are Client Support, Satisfaction Dashboard. All the content presented in this PPT design is completely editable. Download it and make adjustments in color, background, font etc. as per your unique business setting.
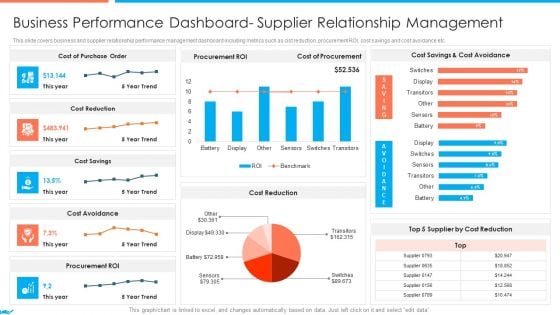
Supplier Association Management Techniques Business Performance Dashboard Portrait PDF
This slide covers business and supplier relationship performance management dashboard including metrics such as cist reduction, procurement ROI, cost savings and cost avoidance etc. Deliver an awe inspiring pitch with this creative icons slide for supplier association management techniques introduction pdf bundle. Topics like supplier association management techniques supplier performance management kpi dashboards guidelines pdf can be discussed with this completely editable template. It is available for immediate download depending on the needs and requirements of the user.
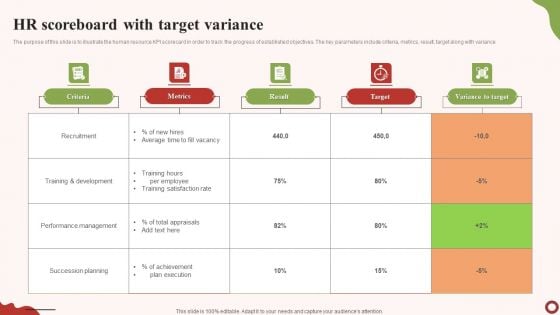
HR Scoreboard With Target Variance Inspiration PDF
The purpose of this slide is to illustrate the human resource KPI scorecard in order to track the progress of established objectives. The key parameters include criteria, metrics, result, target along with variance. Showcasing this set of slides titled HR Scoreboard With Target Variance Inspiration PDF. The topics addressed in these templates are Criteria, Metrics, Result. All the content presented in this PPT design is completely editable. Download it and make adjustments in color, background, font etc. as per your unique business setting.
Dashboard For Tracking Social Media Platforms Icons PDF
This slide covers the KPI dashboard for analyzing social media channels. It includes metrics such as social media followers, Facebook daily reach, Facebook engaged users and page impressions, etc. Deliver an awe inspiring pitch with this creative Dashboard For Tracking Social Media Platforms Icons PDF bundle. Topics like Social Media Followers, Metrics, Awareness can be discussed with this completely editable template. It is available for immediate download depending on the needs and requirements of the user.
Dashboard For Tracking Social Media Platforms Background PDF
This slide covers the KPI dashboard for analyzing social media channels. It includes metrics such as social media followers, Facebook daily reach, Facebook engaged users and page impressions, etc. Deliver an awe inspiring pitch with this creative Dashboard For Tracking Social Media Platforms Background PDF bundle. Topics like Linkedin Key Metrics, Social Media Followers, Awareness can be discussed with this completely editable template. It is available for immediate download depending on the needs and requirements of the user.
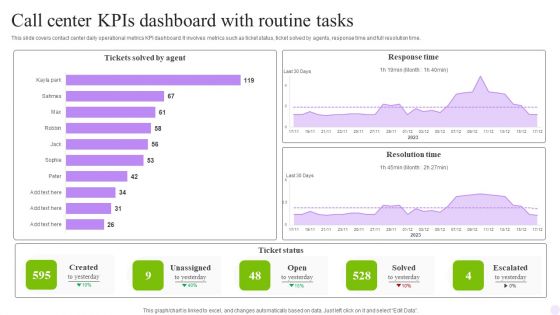
Call Center Kpis Dashboard With Routine Tasks Structure PDF
This slide covers contact center daily operational metrics KPI dashboard. It involves metrics such as ticket status, ticket solved by agents, response time and full resolution time. Pitch your topic with ease and precision using this Call Center Kpis Dashboard With Routine Tasks Structure PDF. This layout presents information on Agent, Response Time, Routine Tasks. It is also available for immediate download and adjustment. So, changes can be made in the color, design, graphics or any other component to create a unique layout.
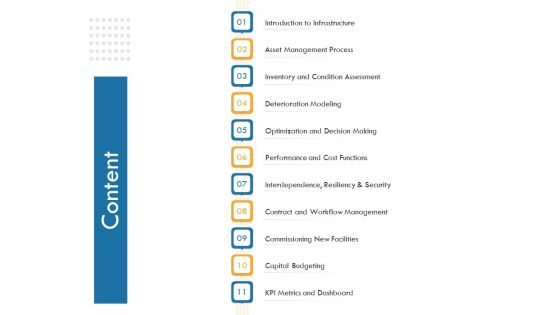
IT Infrastructure Governance Content Ppt Slides Graphic Tips PDF
Deliver an awe inspiring pitch with this creative it infrastructure governance content ppt slides graphic tips pdf. bundle. Topics like introduction to infrastructure, asset management process, inventory and condition assessment, contract and workflow management, commissioning new facilities, capital budgeting, kpi metrics and dashboard can be discussed with this completely editable template. It is available for immediate download depending on the needs and requirements of the user.
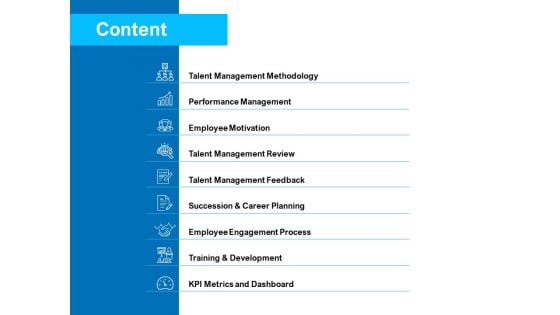
Strategic Talent Management Content Ppt PowerPoint Presentation Design Templates PDF
Deliver an awe-inspiring pitch with this creative strategic talent management content ppt powerpoint presentation design templates pdf bundle. Topics like talent management methodology, performance management, employee motivation, talent management review, talent management feedback, succession and career planning, employee engagement process, training and development, kpi metrics and dashboard can be discussed with this completely editable template. It is available for immediate download depending on the needs and requirements of the user.
Workforce Planning System Content Ppt PowerPoint Presentation Icon Slide Portrait PDF
Deliver an awe-inspiring pitch with this creative workforce planning system content ppt powerpoint presentation icon slide portrait pdf bundle. Topics like talent management methodology, performance management, employee motivation, talent management review, talent management feedback, succession and career planning, employee engagement process, training and development, kpi metrics and dashboard can be discussed with this completely editable template. It is available for immediate download depending on the needs and requirements of the user.
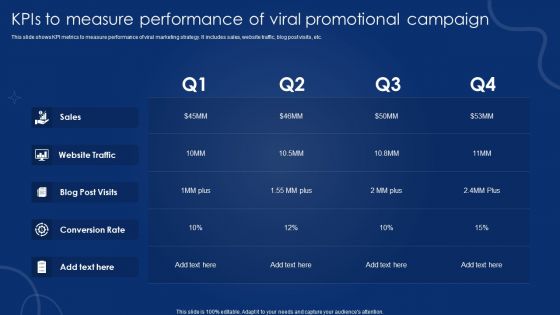
Kpis To Measure Performance Of Viral Promotional Campaign Topics PDF
This slide shows KPI metrics to measure performance of viral marketing strategy. It includes sales, website traffic, blog post visits, etc. Showcasing this set of slides titled Kpis To Measure Performance Of Viral Promotional Campaign Topics PDF. The topics addressed in these templates are Website Traffic, Sales, Blog Post Visits, Conversion Rate. All the content presented in this PPT design is completely editable. Download it and make adjustments in color, background, font etc. as per your unique business setting.
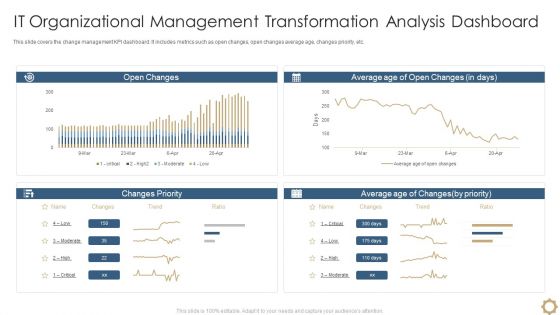
It Organizational Management Transformation Analysis Dashboard Download PDF
This slide covers the change management KPI dashboard. It includes metrics such as open changes, open changes average age, changes priority, etc. Showcasing this set of slides titled It Organizational Management Transformation Analysis Dashboard Download PDF. The topics addressed in these templates are It Organizational Management, Transformation Analysis Dashboard. All the content presented in this PPT design is completely editable. Download it and make adjustments in color, background, font etc. as per your unique business setting.
Consumer Journey Mapping Techniques Dashboard For Tracking Website Performance Graphics PDF
This slide covers the KPI dashboard for analyzing the company website. It includes metrics such as conversions, conversion rate, sessions, stickiness, bounce rate, engagement, etc. Showcasing this set of slides titled Consumer Journey Mapping Techniques Dashboard For Tracking Website Performance Graphics PDF. The topics addressed in these templates are Bounce Rate, Organic, Conversions Rate. All the content presented in this PPT design is completely editable. Download it and make adjustments in color, background, font etc. as per your unique business setting.
E Commerce Transactions Performance Tracking Dashboard Topics PDF
This slide displays KPI dashboard to help company in tracking and monitoring total online purchases made. It includes metrics such as revenue, customers, average price, top articles sold, etc. Showcasing this set of slides titled E Commerce Transactions Performance Tracking Dashboard Topics PDF. The topics addressed in these templates are Total Customers, Division, Revenue. All the content presented in this PPT design is completely editable. Download it and make adjustments in color, background, font etc. as per your unique business setting.
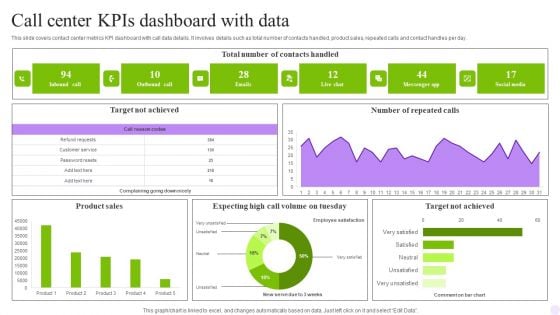
Call Center Kpis Dashboard With Data Graphics PDF
This slide covers contact center team performance metrics KPI dashboard. It involves details such as resolutions, response time, call data management and daily response time. Showcasing this set of slides titled Call Center Kpis Dashboard With Data Graphics PDF. The topics addressed in these templates are Response Time, Data Management, Resolution Rate. All the content presented in this PPT design is completely editable. Download it and make adjustments in color, background, font etc. as per your unique business setting.
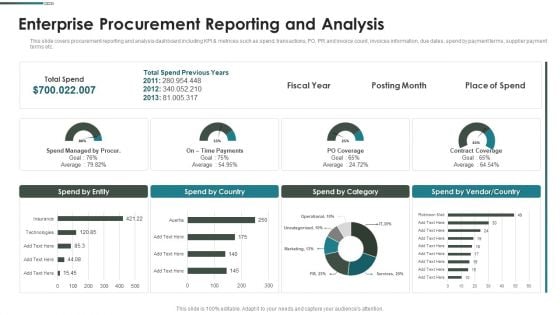
Purchase Assessment Process Enterprise Procurement Reporting And Analysis Infographics PDF
This slide covers procurement reporting and analysis dashboard including KPI metrices such as spend, transactions, PO, PR and invoice count, invoices information, due dates, spend by payment terms, supplier payment terms etc. Deliver an awe inspiring pitch with this creative Purchase Assessment Process Enterprise Procurement Reporting And Analysis Infographics PDF bundle. Topics like Spend Entity, Spend Country, Spend Category can be discussed with this completely editable template. It is available for immediate download depending on the needs and requirements of the user.
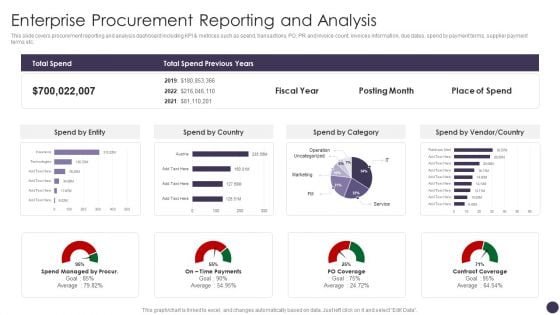
Enterprise Procurement Reporting And Analysis Formats PDF
This slide covers procurement reporting and analysis dashboard including KPI and metrices such as spend, transactions, PO, PR and invoice count, invoices information, due dates, spend by payment terms, supplier payment terms etc. Deliver an awe inspiring pitch with this creative Enterprise Procurement Reporting And Analysis Formats PDF bundle. Topics like Spend Entity, Spend Country, Spend Category can be discussed with this completely editable template. It is available for immediate download depending on the needs and requirements of the user.
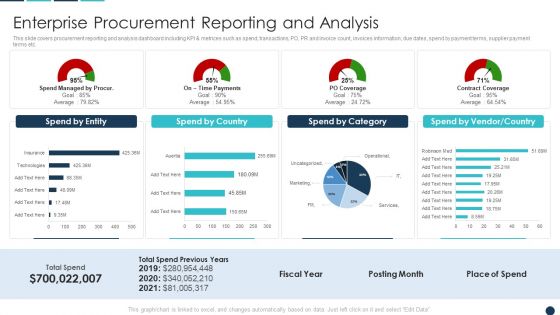
Procurement Analytics Tools And Strategies Enterprise Procurement Reporting Infographics PDF
This slide covers procurement reporting and analysis dashboard including KPI metrices such as spend, transactions, PO, PR and invoice count, invoices information, due dates, spend by payment terms, supplier payment terms etc. Deliver an awe inspiring pitch with this creative Procurement Analytics Tools And Strategies Enterprise Procurement Reporting Infographics PDF bundle. Topics like Spend By Country, Spend Category, Vendor Country can be discussed with this completely editable template. It is available for immediate download depending on the needs and requirements of the user.
Customer Relationship Management CRM Dashboard For Tracking Contract Rate Pictures PDF
This slide covers the KPI dashboard for monitoring the sales teams performance through CRM software. It includes metrics such as outbound calls, demos, contracts closed, average contract value, etc. Deliver and pitch your topic in the best possible manner with this Customer Relationship Management CRM Dashboard For Tracking Contract Rate Pictures PDF. Use them to share invaluable insights on Contracts Closed, Contractvalue, Outbound Calls and impress your audience. This template can be altered and modified as per your expectations. So, grab it now.
Customer Relationship Management CRM Dashboard For Tracking Sales Pipeline Brochure PDF
This slide covers the CRM KPI dashboard for monitoring lead status in the sales funnel. It includes metrics such as open pipeline value, open pipeline by product package, pipeline value forecast, etc. Deliver an awe inspiring pitch with this creative Customer Relationship Management CRM Dashboard For Tracking Sales Pipeline Brochure PDF bundle. Topics like Pipeline Value, Pipeline Value, Product Package can be discussed with this completely editable template. It is available for immediate download depending on the needs and requirements of the user.
Online Customer Interaction Dashboard For Tracking Digital Content Performance Topics PDF
This slide covers the KPI dashboard for analyzing online content. It includes metrics such as blog visitors, pageviews, newsletter conversion rate, new signups, new customers, etc. Deliver an awe inspiring pitch with this creative Online Customer Interaction Dashboard For Tracking Digital Content Performance Topics PDF bundle. Topics like Newsletter Signups, Purchase Amount, Blog Visitors can be discussed with this completely editable template. It is available for immediate download depending on the needs and requirements of the user.


 Continue with Email

 Home
Home


