Line Graph
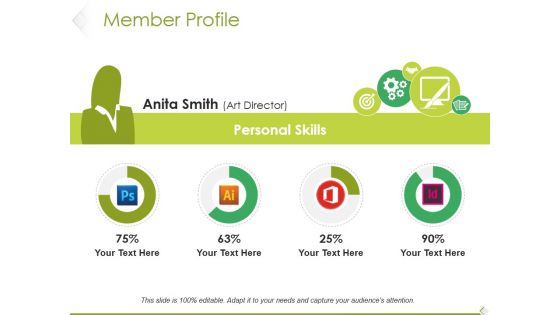
Member Profile Ppt PowerPoint Presentation Layouts Styles
This is a member profile ppt powerpoint presentation layouts styles. This is a four stage process. The stages in this process are art director, personal skills, percentage, finance, icons.
Puzzle Ppt PowerPoint Presentation Professional Brochure
This is a puzzle ppt powerpoint presentation professional brochure. This is a five stage process. The stages in this process are business, puzzle, strategy, management, icon.
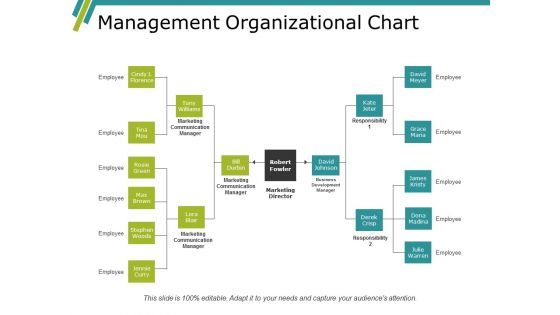
Management Organizational Chart Ppt PowerPoint Presentation Visual Aids Portfolio
This is a management organizational chart ppt powerpoint presentation visual aids portfolio. This is a three stage process. The stages in this process are rosie green, max brown, stephen woods, jennie curry, lora blair.
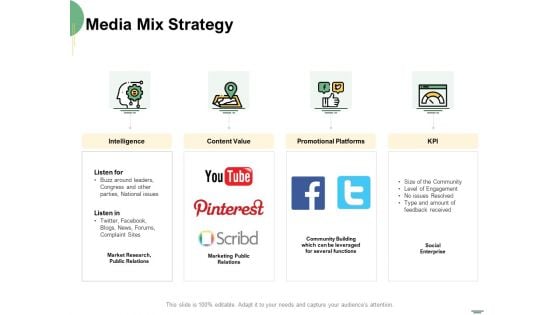
Selecting Media Outlets Media Mix Strategy Ppt Model Vector PDF
Presenting this set of slides with name selecting media outlets media mix strategy ppt model vector pdf. This is a four stage process. The stages in this process are intelligence, content value, promotional platforms. This is a completely editable PowerPoint presentation and is available for immediate download. Download now and impress your audience.
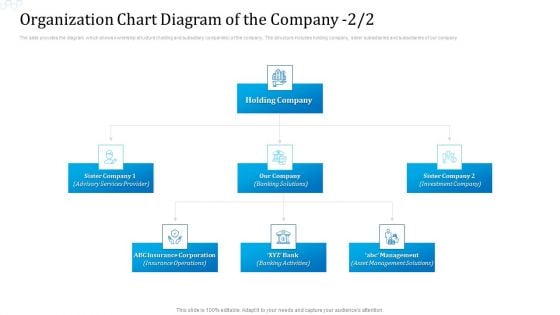
Investor Deck For Procuring Funds From Money Market Organization Chart Diagram Of The Company Gride Professional PDF
The slide provides the diagram which shows ownership structure holding and subsidiary companies of the company. The structure includes holding company, sister subsidiaries and subsidiaries of our company. Presenting investor deck for procuring funds from money market organization chart diagram of the company gride professional pdf to provide visual cues and insights. Share and navigate important information on three stages that need your due attention. This template can be used to pitch topics like organization chart diagram of the company. In addtion, this PPT design contains high resolution images, graphics, etc, that are easily editable and available for immediate download.
Investor Deck For Procuring Funds From Money Market Organization Chart Diagram Of The Company Icon Elements PDF
The slide provides the diagram which shows hierarchy structure relation or reporting of one official to another of the company from N Level to N 2 level. Presenting investor deck for procuring funds from money market organization chart diagram of the company icon elements pdf to provide visual cues and insights. Share and navigate important information on three stages that need your due attention. This template can be used to pitch topics like internal audit, executive name, general counsel board and secretary. In addtion, this PPT design contains high resolution images, graphics, etc, that are easily editable and available for immediate download.
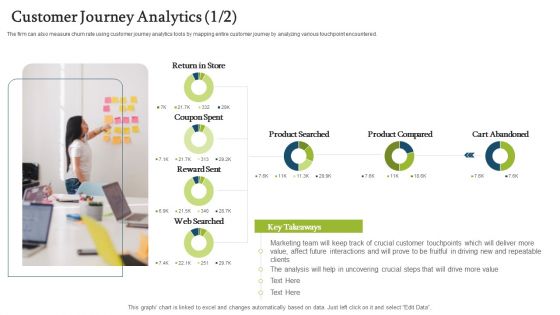
Forecasting And Managing Consumer Attrition For Business Advantage Customer Journey Analytics Searched Formats PDF
Deliver an awe inspiring pitch with this creative forecasting and managing consumer attrition for business advantage customer journey analytics searched formats pdf bundle. Topics like product searched, product compared, cart abandoned can be discussed with this completely editable template. It is available for immediate download depending on the needs and requirements of the user.
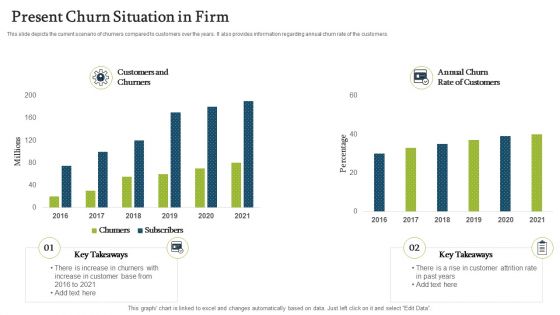
Forecasting And Managing Consumer Attrition For Business Advantage Present Churn Situation In Firm Themes PDF
This slide depicts the current scenario of churners compared to customers over the years. It also provides information regarding annual churn rate of the customers.Deliver and pitch your topic in the best possible manner with this forecasting and managing consumer attrition for business advantage present churn situation in firm themes pdf Use them to share invaluable insights on customers and churners, annual churn rate of customers, key takeaways and impress your audience. This template can be altered and modified as per your expectations. So, grab it now.
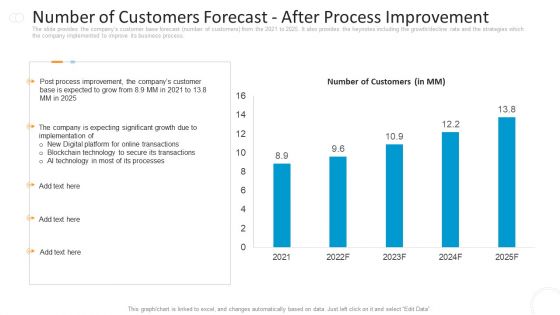
Number Of Customers Forecast After Process Improvement Graphics PDF
Deliver an awe inspiring pitch with this creative number of customers forecast after process improvement graphics pdf bundle. Topics like digital platform for online transactions, blockchain technology to secure its transactions, technology in most of its processes can be discussed with this completely editable template. It is available for immediate download depending on the needs and requirements of the user.
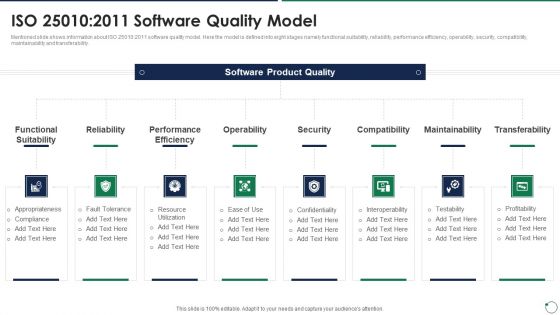
Quality Assurance Templates Set 3 Iso 25010 2011 Software Quality Model Rules PDF
Mentioned slide shows information about ISO 25010 2011 software quality model. Here the model is defined into eight stages namely functional suitability, reliability, performance efficiency, operability, security, compatibility, maintainability and transferability. This is a quality assurance templates set 3 iso 25010 2011 software quality model rules pdf template with various stages. Focus and dispense information on eight stages using this creative set, that comes with editable features. It contains large content boxes to add your information on topics like functional suitability, reliability, performance efficiency, operability, security. You can also showcase facts, figures, and other relevant content using this PPT layout. Grab it now.
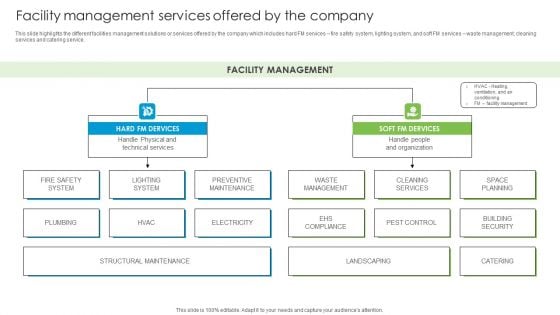
Facility Management Services Offered By The Company Developing Tactical Fm Services Diagrams PDF
Find highly impressive Facility Management Services Offered By The Company Developing Tactical Fm Services Diagrams PDF on Slidegeeks to deliver a meaningful presentation. You can save an ample amount of time using these presentation templates. No need to worry to prepare everything from scratch because Slidegeeks experts have already done a huge research and work for you. You need to download Facility Management Services Offered By The Company Developing Tactical Fm Services Diagrams PDF for your upcoming presentation. All the presentation templates are 100 Precent editable and you can change the color and personalize the content accordingly. Download now.
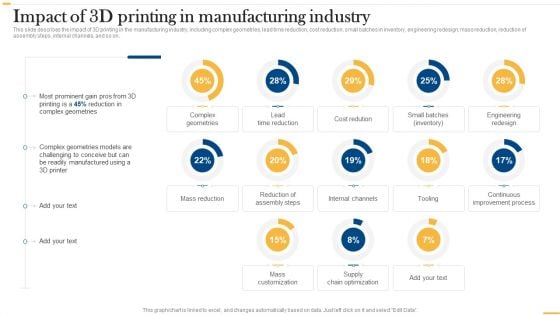
Deploying AI To Enhance Impact Of 3D Printing In Manufacturing Industry Inspiration PDF
This slide describes the impact of 3D printing in the manufacturing industry, including complex geometries, lead time reduction, cost reduction, small batches in inventory, engineering redesign, mass reduction, reduction of assembly steps, internal channels, and so on. Explore a selection of the finest Deploying AI To Enhance Impact Of 3D Printing In Manufacturing Industry Inspiration PDF here. With a plethora of professionally designed and pre-made slide templates, you can quickly and easily find the right one for your upcoming presentation. You can use our Deploying AI To Enhance Impact Of 3D Printing In Manufacturing Industry Inspiration PDF to effectively convey your message to a wider audience. Slidegeeks has done a lot of research before preparing these presentation templates. The content can be personalized and the slides are highly editable. Grab templates today from Slidegeeks.
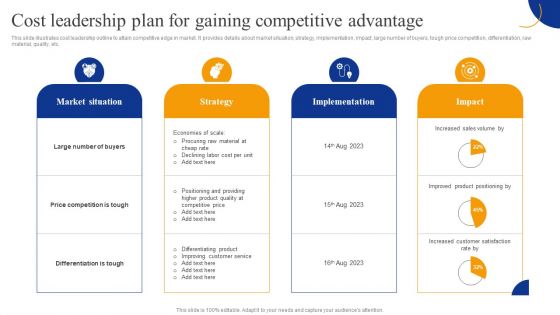
Cost Leadership Plan For Gaining Competitive Advantage Strategic Management For Competitive Summary PDF
This slide illustrates cost leadership outline to attain competitive edge in market. It provides details about market situation, strategy, implementation, impact, large number of buyers, tough price competition, differentiation, raw material, quality, etc. Do you have an important presentation coming up Are you looking for something that will make your presentation stand out from the rest Look no further than Cost Leadership Plan For Gaining Competitive Advantage Strategic Management For Competitive Summary PDF. With our professional designs, you can trust that your presentation will pop and make delivering it a smooth process. And with Slidegeeks, you can trust that your presentation will be unique and memorable. So why wait Grab Cost Leadership Plan For Gaining Competitive Advantage Strategic Management For Competitive Summary PDF today and make your presentation stand out from the rest
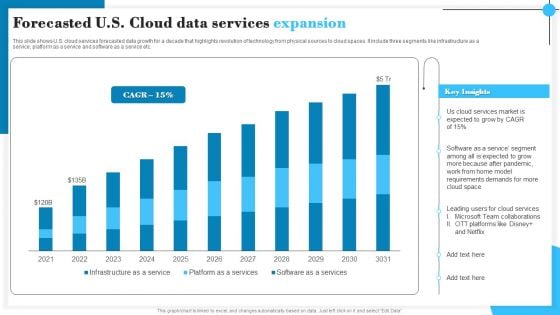
Forecasted U S Cloud Data Services Expansion Demonstration PDF
This slide shows U.S. cloud services forecasted data growth for a decade that highlights revolution of technology from physical sources to cloud spaces. It include three segments like infrastructure as a service, platform as a service and software as a service etc. Presenting Forecasted U S Cloud Data Services Expansion Demonstration PDF to dispense important information. This template comprises six stages. It also presents valuable insights into the topics including Cloud Services, Software, Team Collaborations. This is a completely customizable PowerPoint theme that can be put to use immediately. So, download it and address the topic impactfully.
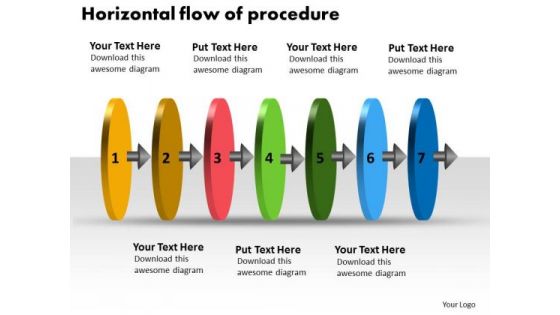
Horizontal Flow Of Procedure Flowchart Symbols PowerPoint Slides
We present our horizontal flow of procedure flowchart symbols PowerPoint Slides.Use our Circle Charts PowerPoint Templates because,To achieve sureshot success you need to come together at the right time, place and manner. Use our Arrows PowerPoint Templates because, You have good reasons to back up the strength of your belief. Use our Shapes PowerPoint Templates because,This one depicts the popular chart. Use our Business PowerPoint Templates because, Infrastructure growth is an obvious requirement of today.Inform your group on how exactly this potential is tailor made for you Use our Process and Flows PowerPoint Templates because,They will Amplify your basic corporate concept and forefront the benefits of overlapping processes to arrive at common goals.Use these PowerPoint slides for presentations relating to Abstract, arrow, blank, business, chart, circular, circulation, concept, conceptual, design, diagram, executive, flow, icon, idea, illustration, linear, management, model, numbers, organization, procedure, process, progression, resource, sequence, sequential, stages, steps, strategy. The prominent colors used in the PowerPoint template are Yellow, Brown, Red. People tell us our horizontal flow of procedure flowchart symbols PowerPoint Slides are Vintage. The feedback we get is that our circulation PowerPoint templates and PPT Slides are Charming. People tell us our horizontal flow of procedure flowchart symbols PowerPoint Slides are Elevated. Presenters tell us our circular PowerPoint templates and PPT Slides will help them to explain complicated concepts. The feedback we get is that our horizontal flow of procedure flowchart symbols PowerPoint Slides are Wonderful. Professionals tell us our concept PowerPoint templates and PPT Slides look good visually. Bask in the energy our Horizontal Flow Of Procedure Flowchart Symbols PowerPoint Slides emit. Your thoughts will acquire the correct complexion.
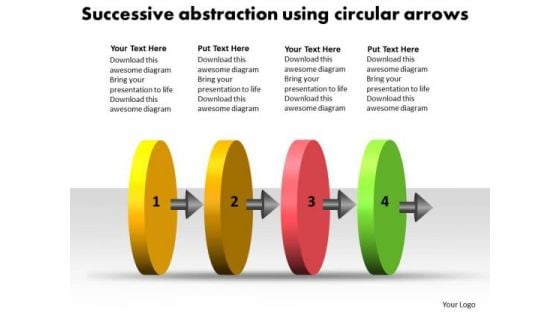
Successive Abstraction Using Circular Arrows Best Flowchart PowerPoint Slides
We present our successive abstraction using circular arrows best flowchart PowerPoint Slides.Use our Circle Charts PowerPoint Templates because,Displaying your ideas and highlighting your ability will accelerate the growth of your company and yours. Use our Arrows PowerPoint Templates because, Spreading the light of knowledge around you will clear the doubts and enlighten the questioning minds with your brilliance and ability. Use our Shapes PowerPoint Templates because,It shows various choices to be made. Use our Business PowerPoint Templates because,This template can project the path to sucess that you have charted. Use our Process and Flows PowerPoint Templates because,It Draws the universal impact to highlight the similarities with your organizational structure and plans.Use these PowerPoint slides for presentations relating to abstract, arrow, blank, business, chart, circular, circulation, concept, conceptual, design, diagram, executive, flow, icon, idea, illustration, linear, management, model, numbers, organization, procedure, process, progression, resource, sequence, sequential, stages, steps, strategy. The prominent colors used in the PowerPoint template are Green, Red, Yellow. People tell us our successive abstraction using circular arrows best flowchart PowerPoint Slides are Royal. The feedback we get is that our circular PowerPoint templates and PPT Slides are Efficacious. People tell us our successive abstraction using circular arrows best flowchart PowerPoint Slides are Pretty. Presenters tell us our conceptual PowerPoint templates and PPT Slides look good visually. The feedback we get is that our successive abstraction using circular arrows best flowchart PowerPoint Slides are Graceful. Professionals tell us our circulation PowerPoint templates and PPT Slides are Striking. Create a consensus with your thoughts. Erase differences with our Successive Abstraction Using Circular Arrows Best Flowchart PowerPoint Slides.
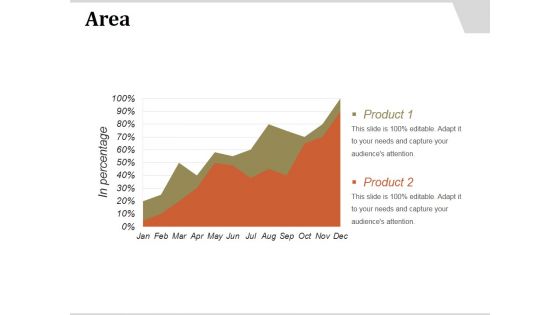
Area Ppt PowerPoint Presentation Show
This is a area ppt powerpoint presentation show. This is a two stage process. The stages in this process are area, bar graph, growth, years, business.
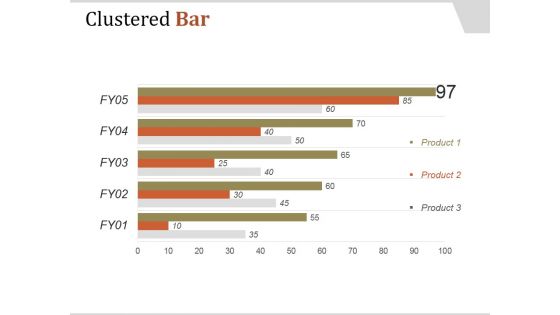
Clustered Bar Ppt PowerPoint Presentation Template
This is a clustered bar ppt powerpoint presentation template. This is a five stage process. The stages in this process are product, clustered bar, business, marketing, bar graph.
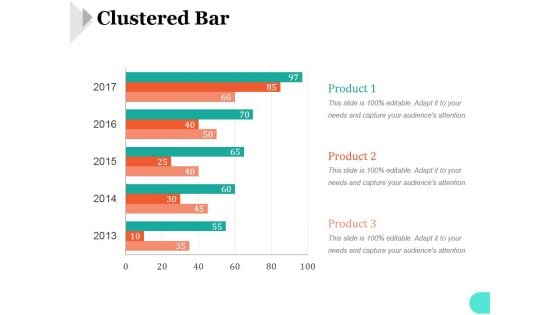
Clustered Bar Ppt PowerPoint Presentation Ideas
This is a clustered bar ppt powerpoint presentation ideas. This is a five stage process. The stages in this process are bar graph, marketing, strategy, analysis, business, success.
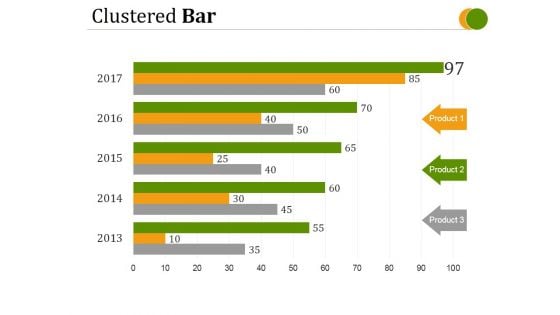
Clustered Bar Ppt PowerPoint Presentation Good
This is a clustered bar ppt powerpoint presentation good. This is a five stage process. The stages in this process are product, circular, business, marketing, bar graph.
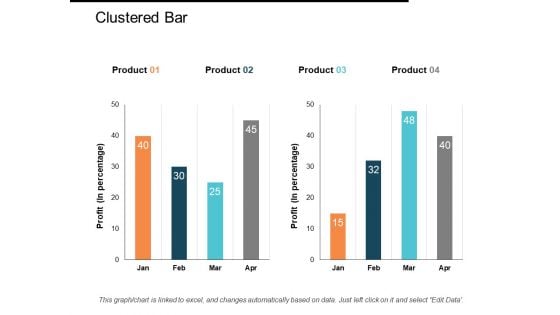
Clustered Bar Ppt PowerPoint Presentation Gallery Inspiration
This is a clustered bar ppt powerpoint presentation gallery inspiration. This is a four stage process. The stages in this process are clustered bar, product, profit, business, bar graph.
Bar Chart Ppt PowerPoint Presentation Icon Design Templates
This is a bar chart ppt powerpoint presentation icon design templates. This is a nine stage process. The stages in this process are sales in percentage, bar graph, business, marketing, growth.
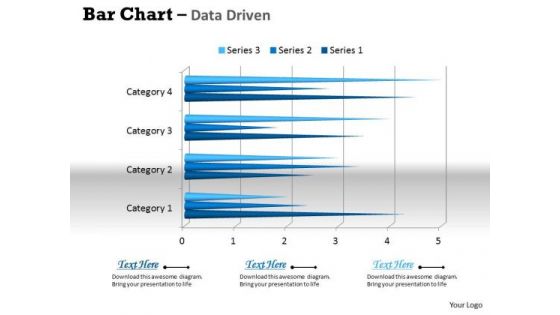
Data Analysis In Excel 3d Bar Chart For Business Trends PowerPoint Templates
Connect The Dots With Our data analysis in excel 3d bar chart for business trends Powerpoint Templates . Watch The Whole Picture Clearly Emerge.
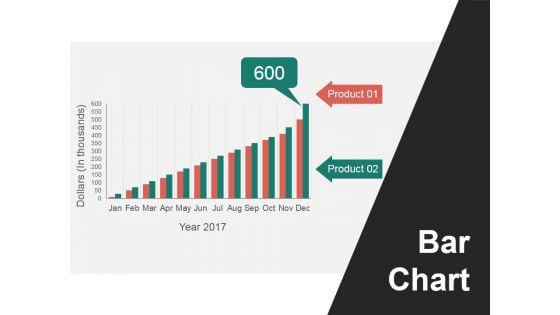
Bar Chart Ppt PowerPoint Presentation Pictures Mockup
This is a bar chart ppt powerpoint presentation pictures mockup. This is a twelve stage process. The stages in this process are dollars, product, bar chart.
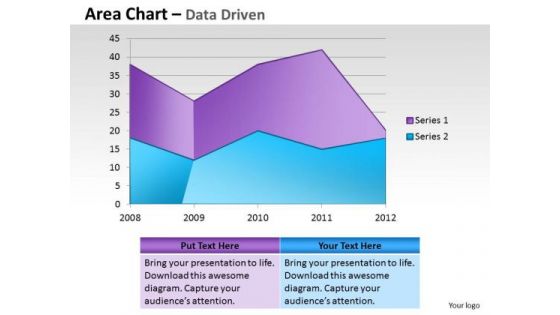
Financial Data Analysis Area Chart For Showing Trends PowerPoint Templates
Document Your Views On Our financial data analysis area chart for showing trends Powerpoint Templates . They Will Create A Strong Impression.
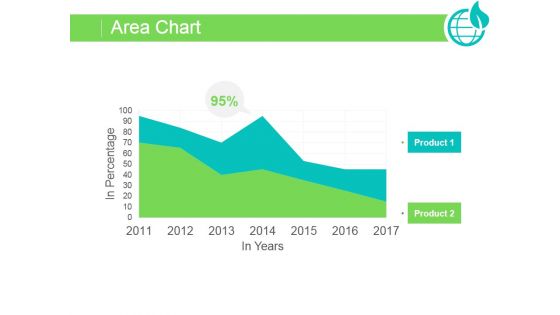
Area Chart Ppt PowerPoint Presentation Backgrounds
This is a area chart ppt powerpoint presentation backgrounds. This is a two stage process. The stages in this process are business, graph, growth, success, marketing.
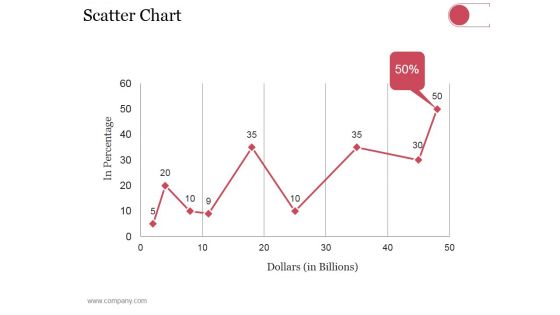
Scatter Chart Ppt PowerPoint Presentation Styles Show
This is a scatter chart ppt powerpoint presentation styles show. This is a nine stage process. The stages in this process are dollars, in percentage, finance, growth strategy.
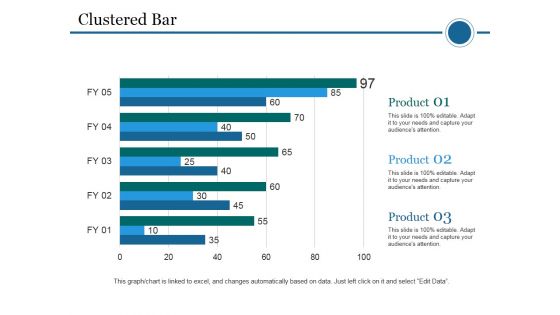
Clustered Bar Ppt PowerPoint Presentation File Topics
This is a clustered bar ppt powerpoint presentation file topics. This is a five stage process. The stages in this process are clustered bar, product, planning, business, marketing.
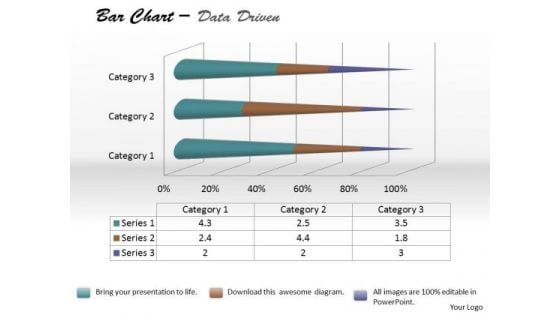
Data Analysis Bar Chart For Foreign Trade PowerPoint Templates
Be The Doer With Our data analysis bar chart for foreign trade Powerpoint Templates. Put Your Thoughts Into Practice.
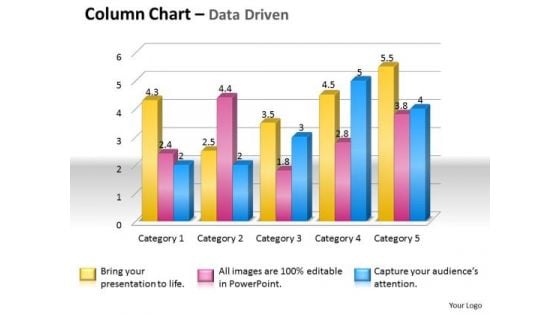
Data Analysis Techniques 3d Grouped Bar Chart PowerPoint Templates
Place The Orders With Your Thoughts. Our data analysis techniques 3d grouped bar chart Powerpoint Templates Know The Drill.
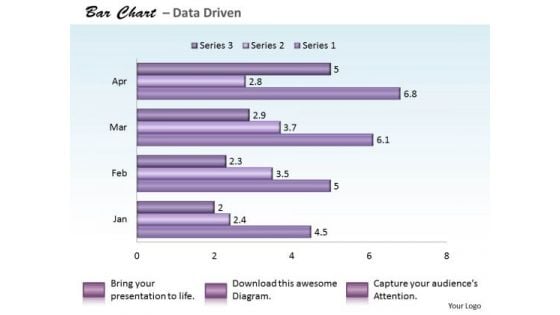
Quantitative Data Analysis Bar Chart For PowerPoint Templates
Reduce The Drag With Our quantitative data analysis bar chart for Powerpoint Templates . Give More Lift To Your Thoughts.
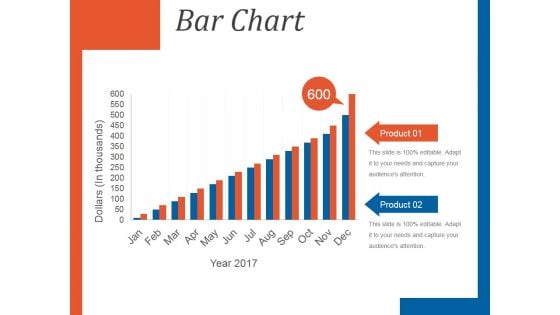
Bar Chart Template 1 Ppt PowerPoint Presentation Background Images
This is a bar chart template 1 ppt powerpoint presentation background images. This is a twelve stage process. The stages in this process are product, bar chart, dollars, year.
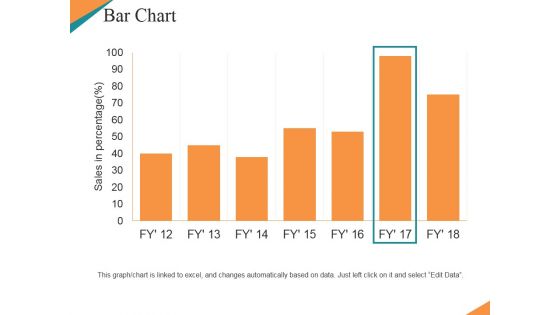
Bar Chart Ppt PowerPoint Presentation Ideas Graphic Tips
This is a bar chart ppt powerpoint presentation ideas graphic tips. This is a seven stage process. The stages in this process are sales in percentage, bar chart, growth, business, marketing.
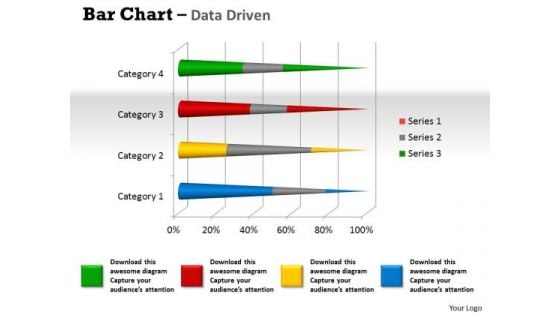
Data Analysis Programs 3d Bar Chart To Dispaly PowerPoint Templates
Lower The Drawbridge With Our data analysis programs 3d bar chart to dispaly Powerpoint Templates . Capture The Minds Of Your Audience.
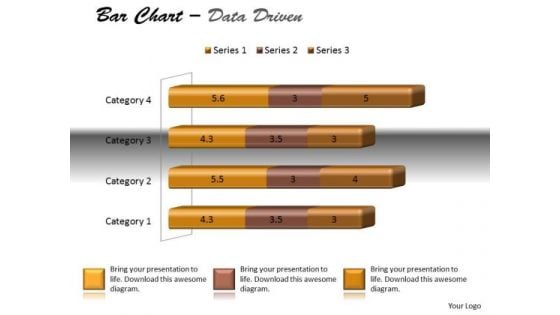
Data Analysis Techniques 3d Bar Chart For Modification PowerPoint Templates
Dreams Generate Thoughts, Thoughts Generate Ideas. Give Them Life With Our data analysis techniques 3d bar chart for modification Powerpoint Templates .
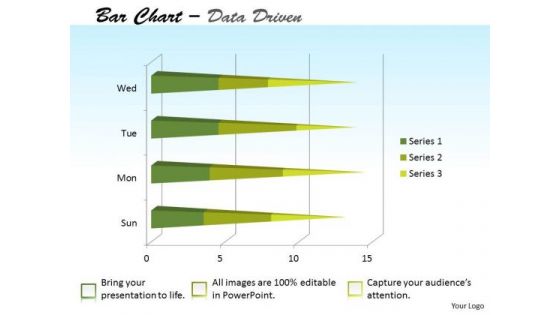
Data Analysis Template Forex Market Bar Chart PowerPoint Templates
Attract A Crowd With Our data analysis template forex market bar chart Powerpoint Templates . They Will Drop It All And Come To Hear You.
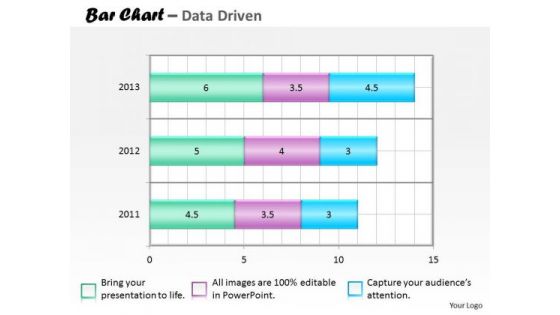
Financial Data Analysis Bar Chart For Collection Of PowerPoint Templates
Our financial data analysis bar chart for collection of Powerpoint Templates Team Are A Dogged Lot. They Keep At It Till They Get It Right.
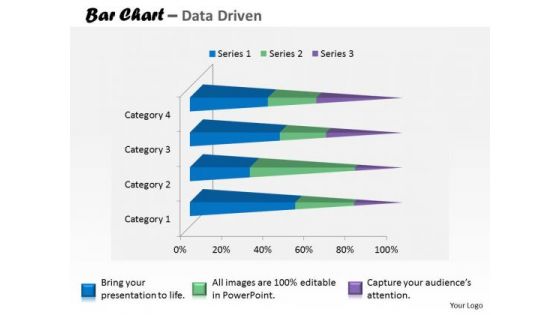
Financial Data Analysis Currency Trading Bar Chart PowerPoint Templates
Put In A Dollop Of Our financial data analysis currency trading bar chart Powerpoint Templates . Give Your Thoughts A Distinctive Flavor.

Microsoft Excel Data Analysis Bar Chart To Handle PowerPoint Templates
Our microsoft excel data analysis bar chart to handle Powerpoint Templates And Your Ideas Make A Great Doubles Pair. Play The Net With Assured Hands.
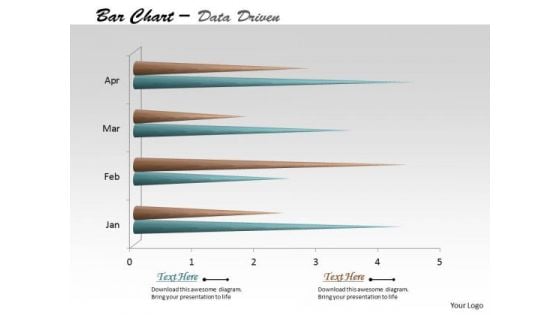
Multivariate Data Analysis Time Based Bar Chart PowerPoint Templates
Edit Your Work With Our multivariate data analysis time based bar chart Powerpoint Templates . They Will Help You Give The Final Form.
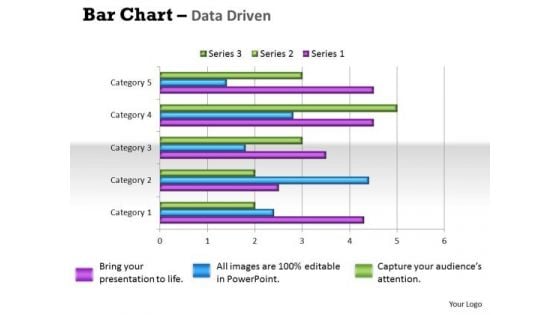
Quantitative Data Analysis Bar Chart For Different Categories PowerPoint Templates
Make Some Dough With Our quantitative data analysis bar chart for different categories Powerpoint Templates . Your Assets Will Rise Significantly.
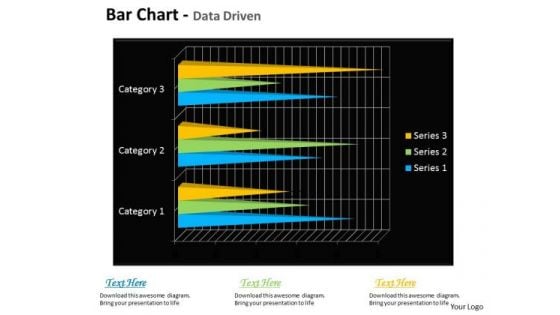
Quantitative Data Analysis Bar Chart For Financial Markets PowerPoint Templates
Draft It Out On Our quantitative data analysis bar chart for financial markets Powerpoint Templates . Give The Final Touches With Your Ideas.
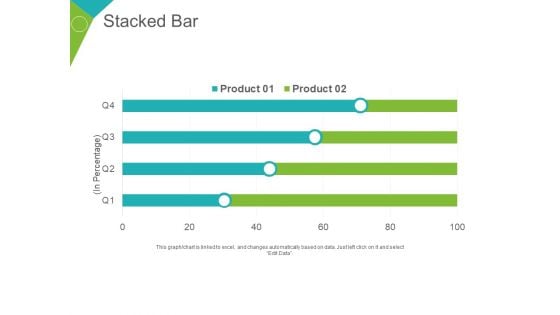
Stacked Bar Ppt PowerPoint Presentation Summary Portfolio
This is a stacked bar ppt powerpoint presentation summary portfolio. This is a two stage process. The stages in this process are product, business, planning, marketing, in percentage.
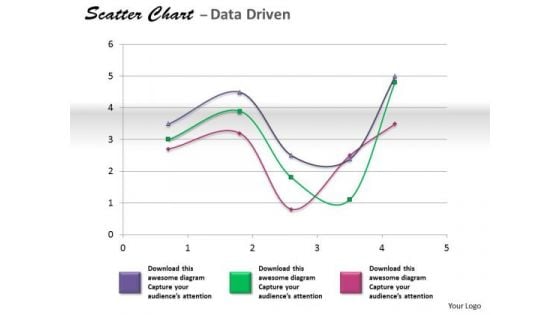
Financial Data Analysis Coordinate With Scatter Chart PowerPoint Templates
Get The Doers Into Action. Activate Them With Our financial data analysis coordinate with scatter chart Powerpoint Templates .

Business Growth Year Americana PowerPoint Templates Ppt Backgrounds For Slides 1212
We present our Business Growth Year Americana PowerPoint Templates PPT Backgrounds For Slides 1212.Download and present our Arrows PowerPoint Templates because our template will help pinpoint their viability. Present our Americana PowerPoint Templates because by using this slide you can Heighten the anticipation of your audience listing . Present our Money PowerPoint Templates because Our PowerPoint Templates and Slides will bullet point your ideas. See them fall into place one by one. Use our Finance PowerPoint Templates because let this slide illustrates others piggyback on you to see well over the horizon. Use our Business PowerPoint Templates because your fledgling career is in the chrysallis stage. Nurture it and watch it grow into a beautiful butterfly.Use these PowerPoint slides for presentations relating to 2013 bar graph with dollars, Arrows, Americana, Money, Business, Finance. The prominent colors used in the PowerPoint template are Red, Blue, Yellow. You can be sure our Business Growth Year Americana PowerPoint Templates PPT Backgrounds For Slides 1212 are Sparkling. We assure you our Arrows PowerPoint templates and PPT Slides are visually appealing. Use our Business Growth Year Americana PowerPoint Templates PPT Backgrounds For Slides 1212 are Tasteful. Customers tell us our Americana PowerPoint templates and PPT Slides are Cheerful. Use our Business Growth Year Americana PowerPoint Templates PPT Backgrounds For Slides 1212 will help them to explain complicated concepts. The feedback we get is that our dollars PowerPoint templates and PPT Slides are Sparkling. Expand the bouquet of your choices. Let new dreams emerge with our Business Growth Year Americana PowerPoint Templates Ppt Backgrounds For Slides 1212.
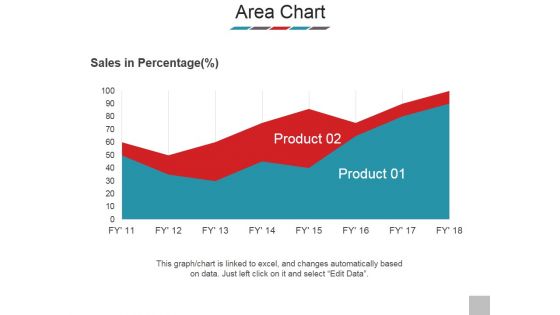
Area Chart Ppt PowerPoint Presentation Styles Images
This is a area chart ppt powerpoint presentation styles images. This is a two stage process. The stages in this process are sales in percentage, product, graph, business, marketing.

Business Growth In Upcoming 2013 Year Success PowerPoint Templates Ppt Backgrounds For Slides 1212
We present our Business Growth In Upcoming 2013 Year Success PowerPoint Templates PPT Backgrounds For Slides 1212.Use our Finance PowerPoint Templates because you envisage some areas of difficulty in the near future. The overall financial situation could be a source of worry. Download and present our Business PowerPoint Templates because a brainwave has occurred to you after review. You know just how to push the graph skyward. Use our Success PowerPoint Templates because your quest has taken you well onto the path of success. Present our Money PowerPoint Templates because it helps you to clearly delegate the different tasks along with their necessary resources and responsibilities. Use our New year PowerPoint Templates because you have the right attitude and great ideas to chart the way in the new year.Use these PowerPoint slides for presentations relating to Business growth in upcoming 2013, business, finance, success, money, new year. The prominent colors used in the PowerPoint template are Green, Red, Black. Customers tell us our Business Growth In Upcoming 2013 Year Success PowerPoint Templates PPT Backgrounds For Slides 1212 are Colorful. Presenters tell us our in PowerPoint templates and PPT Slides are Cheerful. Presenters tell us our Business Growth In Upcoming 2013 Year Success PowerPoint Templates PPT Backgrounds For Slides 1212 are Bold. The feedback we get is that our 2013 PowerPoint templates and PPT Slides are Pleasant. Use our Business Growth In Upcoming 2013 Year Success PowerPoint Templates PPT Backgrounds For Slides 1212 are Amazing. You can be sure our in PowerPoint templates and PPT Slides are designed by professionals Augment your argument with our Business Growth In Upcoming 2013 Year Success PowerPoint Templates Ppt Backgrounds For Slides 1212. Add greater clarity to your thoughts.
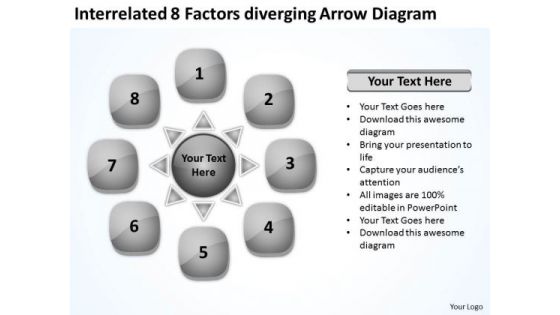
Interrelated 8 Factors Diverging Arrow Diagram Circular Flow Network PowerPoint Slides
We present our interrelated 8 factors diverging arrow diagram Circular Flow Network PowerPoint Slides.Use our Arrows PowerPoint Templates because this can explain the various related aspects of these varied tracks and how they will, on hitting their own targets, cumulatively contribute to hitting GOLD. Present our Business PowerPoint Templates because a brainwave has occurred to you after review. You know just how to push the graph skyward. Download our Signs PowerPoint Templates because you can Break it all down to Key Result Areas. Present our Shapes PowerPoint Templates because our template will help pinpoint their viability. Download our Spheres PowerPoint Templates because so that you can Lead the way to spread good cheer to one and all.Use these PowerPoint slides for presentations relating to Abstract, Arrows, Blank, Business, Central, Centralized, Chart, Circle, Circular, Circulation, Concept, Conceptual, Converging, Design, Diagram, Empty, Executive, Four, Icon, Idea, Illustration, Management, Model, Numbers, Organization, Outwards, Pointing, Procedure, Process, Radial, Radiating, Relationship, Resource, Sequence, Sequential, Square, Strategy. The prominent colors used in the PowerPoint template are Gray, Black, White. Professionals tell us our interrelated 8 factors diverging arrow diagram Circular Flow Network PowerPoint Slides are Dazzling. You can be sure our Central PowerPoint templates and PPT Slides are Royal. Customers tell us our interrelated 8 factors diverging arrow diagram Circular Flow Network PowerPoint Slides are Stunning. Professionals tell us our Central PowerPoint templates and PPT Slides will impress their bosses and teams. People tell us our interrelated 8 factors diverging arrow diagram Circular Flow Network PowerPoint Slides are Splendid. People tell us our Circle PowerPoint templates and PPT Slides are Classic. Enliven the experience with our Interrelated 8 Factors Diverging Arrow Diagram Circular Flow Network PowerPoint Slides. Give more colour to your bright thoughts.
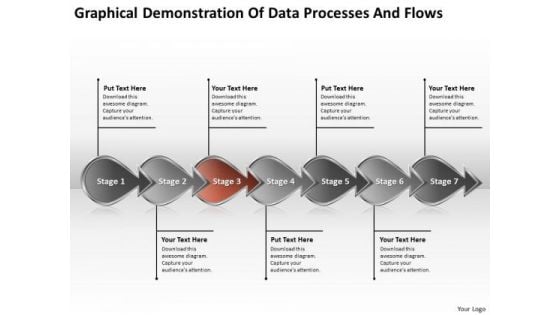
Demonstration Of Data Processes And Flows Business Flowcharting PowerPoint Templates
We present our demonstration of data processes and flows business flowcharting PowerPoint templates.Use our Leadership PowerPoint Templates because you can Raise your Company stocks at the Opening Bell. Present our Business PowerPoint Templates because you can Flutter your wings and enchant the world. Impress them with the innate attractiveness of your thoughts and words. Present our Arrows PowerPoint Templates because with the help of our Slides you can Illustrate your plans to your listeners with the same accuracy. Present our Marketing PowerPoint Templates because you can Determine your targets and sequence them as per your priorities. Present our Process and Flows PowerPoint Templates because our template will illustrate what you want to say.Use these PowerPoint slides for presentations relating to Arrow Arrows Block Business Chart Design Development Diagram Direction Element Flow Flowchart Graph Linear Management Organization Process Program Section Sign Solution Symbol. The prominent colors used in the PowerPoint template are Orange, Gray, Black. Use our demonstration of data processes and flows business flowcharting PowerPoint templates are Nifty. Presenters tell us our Direction PowerPoint templates and PPT Slides are Classic. Presenters tell us our demonstration of data processes and flows business flowcharting PowerPoint templates look good visually. You can be sure our Development PowerPoint templates and PPT Slides are Vintage. PowerPoint presentation experts tell us our demonstration of data processes and flows business flowcharting PowerPoint templates are Enchanting. Professionals tell us our Block PowerPoint templates and PPT Slides are Attractive. Exploit our Demonstration Of Data Processes And Flows Business Flowcharting PowerPoint Templates with your ideas. Extract every inch of space on them.
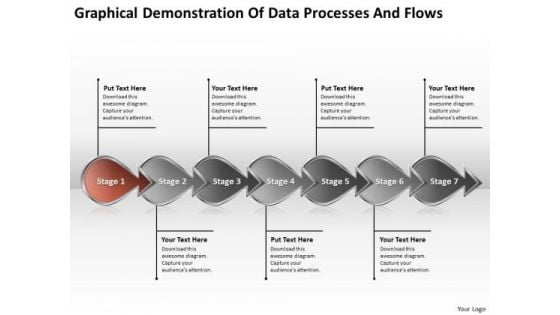
Demonstration Of Data Processes And Flows Production Plan For Business PowerPoint Slides
We present our demonstration of data processes and flows production plan for business PowerPoint Slides.Present our Leadership PowerPoint Templates because Our Template designs are State of the Art. Present our Business PowerPoint Templates because it helps you to project your enthusiasm and single mindedness to your colleagues. Download our Arrows PowerPoint Templates because you have an idea of which you are sure. Use our Marketing PowerPoint Templates because you have the ability to judge Which out of late have been proving to be a hassle. Use our Process and Flows PowerPoint Templates because you have the ideas, you have got a brainwave.Use these PowerPoint slides for presentations relating to Arrow Arrows Block Business Chart Design Development Diagram Direction Element Flow Flowchart Graph Linear Management Organization Process Program Section Sign Solution Symbol. The prominent colors used in the PowerPoint template are Orange, Gray, Black. Use our demonstration of data processes and flows production plan for business PowerPoint Slides are Vintage. Presenters tell us our Block PowerPoint templates and PPT Slides are Fabulous. Presenters tell us our demonstration of data processes and flows production plan for business PowerPoint Slides are Splendid. You can be sure our Design PowerPoint templates and PPT Slides are Nostalgic. PowerPoint presentation experts tell us our demonstration of data processes and flows production plan for business PowerPoint Slides are Dazzling. Professionals tell us our Design PowerPoint templates and PPT Slides are Ultra. Transition to a better presentation with our Demonstration Of Data Processes And Flows Production Plan For Business PowerPoint Slides. Download without worries with our money back guaranteee.
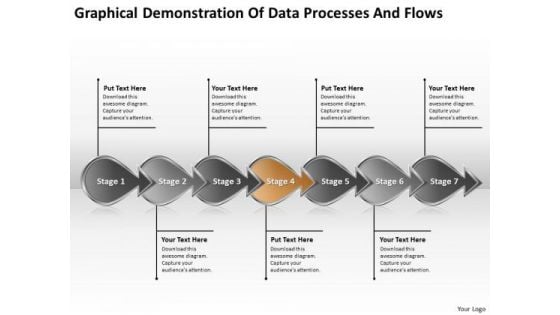
Demonstration Of Data Processes And Flows Chart Flowcharting PowerPoint Templates
We present our demonstration of data processes and flows chart flowcharting PowerPoint templates.Download and present our Leadership PowerPoint Templates because you know what it takes to keep it fit and healthy. Use our Business PowerPoint Templates because this template helps you to grab the attention of your listeners. Download our Arrows PowerPoint Templates because it helps to anticipate the doubts and questions in the minds of your colleagues and enlighten them with your inspired strategy to garner desired success. Download our Marketing PowerPoint Templates because the mind is always whirring with new ideas. Use our Process and Flows PowerPoint Templates because forward thinking is the way to go.Use these PowerPoint slides for presentations relating to Arrow Arrows Block Business Chart Design Development Diagram Direction Element Flow Flowchart Graph Linear Management Organization Process Program Section Sign Solution Symbol. The prominent colors used in the PowerPoint template are Orange, Gray, Black. Use our demonstration of data processes and flows chart flowcharting PowerPoint templates are Gorgeous. Presenters tell us our Block PowerPoint templates and PPT Slides are Radiant. Presenters tell us our demonstration of data processes and flows chart flowcharting PowerPoint templates are Tasteful. You can be sure our Development PowerPoint templates and PPT Slides are Versatile. PowerPoint presentation experts tell us our demonstration of data processes and flows chart flowcharting PowerPoint templates are Clever. Professionals tell us our Block PowerPoint templates and PPT Slides are Second to none. Present like a pro with our Demonstration Of Data Processes And Flows Chart Flowcharting PowerPoint Templates. You will come out on top.
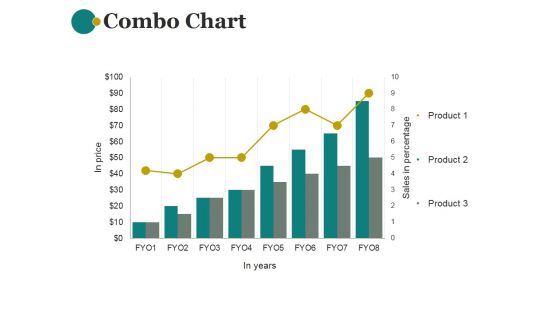
Combo Chart Ppt PowerPoint Presentation Shapes
This is a combo chart ppt powerpoint presentation shapes. This is a eight stage process. The stages in this process are combo chart, business, marketing, sales in percentage, bar graph.
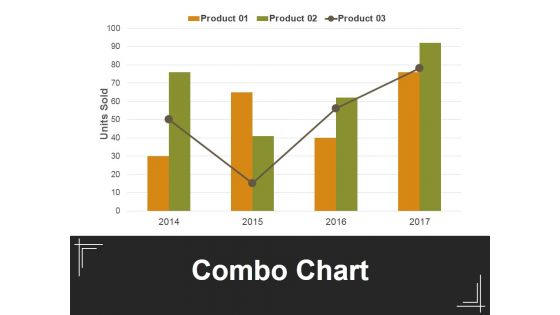
Combo Chart Ppt PowerPoint Presentation Outline Background Image
This is a combo chart ppt powerpoint presentation outline background image. This is a four stage process. The stages in this process are combo chart, units sold, bar graph, business, marketing.
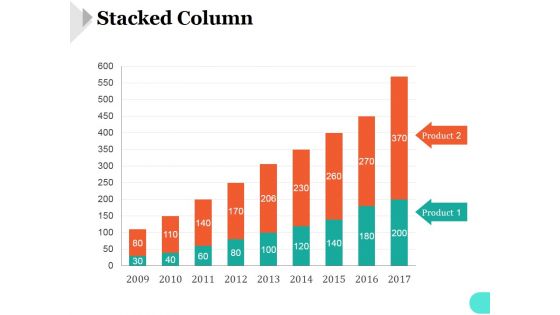
Stacked Column Ppt PowerPoint Presentation Files
This is a stacked column ppt powerpoint presentation files. This is a nine stage process. The stages in this process are bar graph, finance, marketing, analysis, business.
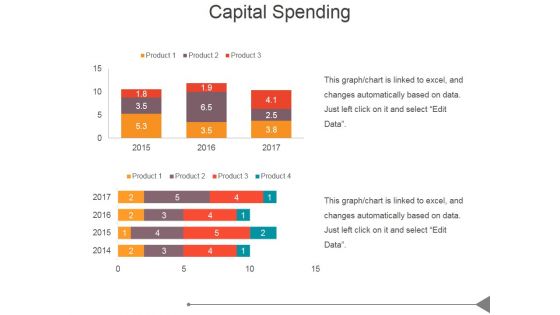
Capital Spending Ppt PowerPoint Presentation Graphics
This is a capital spending ppt powerpoint presentation graphics. This is a two stage process. The stages in this process are business, marketing, success, bar graph, management.
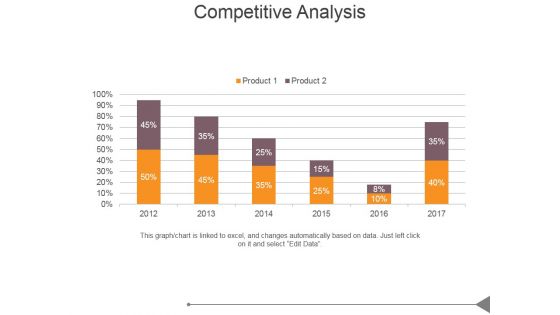
Competitive Analysis Ppt PowerPoint Presentation Sample
This is a competitive analysis ppt powerpoint presentation sample. This is a six stage process. The stages in this process are business, marketing, success, bar graph, management.
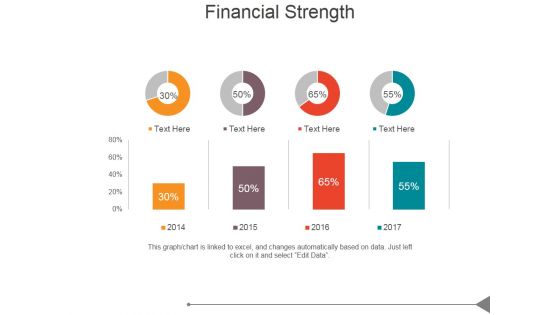
Financial Strength Ppt PowerPoint Presentation Shapes
This is a financial strength ppt powerpoint presentation shapes. This is a four stage process. The stages in this process are business, marketing, success, business plan, bar graph.
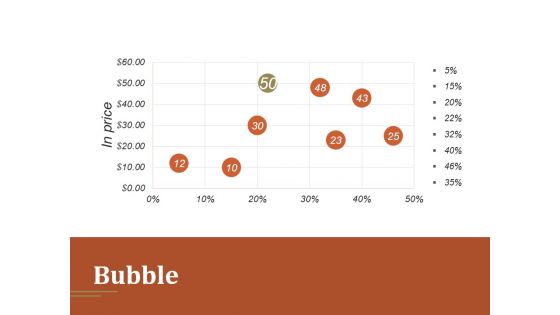
Bubble Ppt PowerPoint Presentation Guidelines
This is a bubble ppt powerpoint presentation guidelines. This is a five stage process. The stages in this process are bubble, business, bar graph, marketing, presentation.
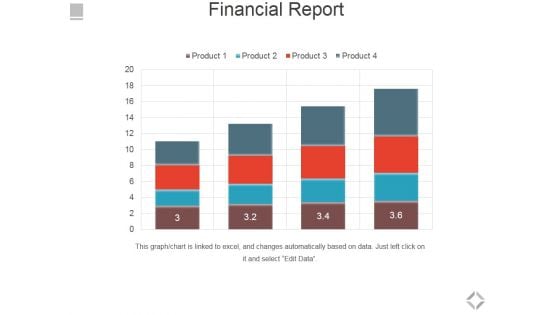
Financial Report Ppt PowerPoint Presentation Styles Skills
This is a financial report ppt powerpoint presentation styles skills. This is a four stage process. The stages in this process are bar graph, business, marketing, success, growth.
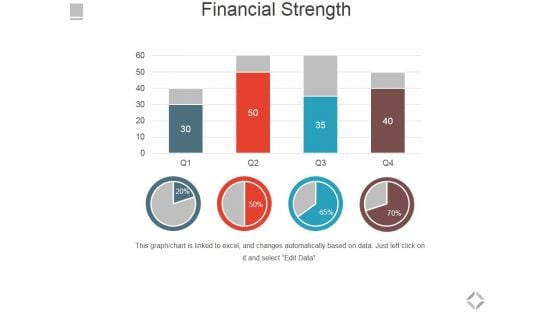
Financial Strength Ppt PowerPoint Presentation Summary Ideas
This is a financial strength ppt powerpoint presentation summary ideas. This is a four stage process. The stages in this process are bar graph, business, marketing, success, growth.


 Continue with Email

 Home
Home


