Line Graph
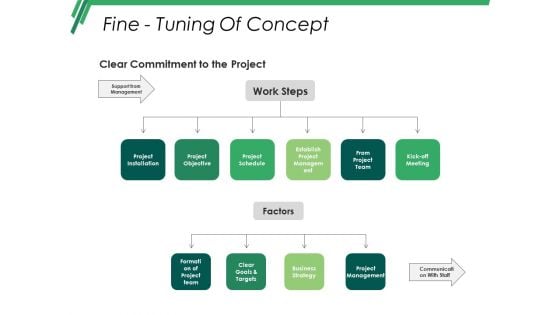
Fine Tuning Of Concept Ppt PowerPoint Presentation Styles Ideas
This is a fine tuning of concept ppt powerpoint presentation styles ideas. This is a two stage process. The stages in this process are refine project plan, determine decision making authority, definition of target processes, interfaces and systems adjustments, data migration plan, composition of project team.
Comparison Ppt PowerPoint Presentation Icon Guide
This is a comparison ppt powerpoint presentation icon guide. This is a four stage process. The stages in this process are business, marketing, planning, strategy, finance.

3d Planning Success In 2013 PowerPoint Templates Ppt Backgrounds For Slides 0113
We present our 3d Planning Success In 2013 PowerPoint Templates PPT Backgrounds For Slides 0113.Use our New year PowerPoint Templates because Our PowerPoint Templates and Slides ensures Effective communication. They help you put across your views with precision and clarity. Download our Success PowerPoint Templates because Our PowerPoint Templates and Slides are specially created by a professional team with vast experience. They diligently strive to come up with the right vehicle for your brilliant Ideas. Present our Shapes PowerPoint Templates because It is Aesthetically crafted by artistic young minds. Our PowerPoint Templates and Slides are designed to display your dexterity. Use our Globe PowerPoint Templates because Our PowerPoint Templates and Slides are specially created by a professional team with vast experience. They diligently strive to come up with the right vehicle for your brilliant Ideas. Download and present our Signs PowerPoint Templates because You can Zap them with our PowerPoint Templates and Slides. See them reel under the impact.Use these PowerPoint slides for presentations relating to Bar graph with 2013, New year, Success, Shapes, Globe, Signs. The prominent colors used in the PowerPoint template are Yellow, Green, Red. Use our 3d Planning Success In 2013 PowerPoint Templates PPT Backgrounds For Slides 0113 are designed by a team of presentation professionals. Use our Success PowerPoint templates and PPT Slides will make you look like a winner. Use our 3d Planning Success In 2013 PowerPoint Templates PPT Backgrounds For Slides 0113 will impress their bosses and teams. People tell us our year PowerPoint templates and PPT Slides are topically designed to provide an attractive backdrop to any subject. The feedback we get is that our 3d Planning Success In 2013 PowerPoint Templates PPT Backgrounds For Slides 0113 help you meet deadlines which are an element of today's workplace. Just browse and pick the slides that appeal to your intuitive senses. Professionals tell us our Shapes PowerPoint templates and PPT Slides will make you look like a winner. Deliver your feedback on our 3d Planning Success In 2013 PowerPoint Templates Ppt Backgrounds For Slides 0113. Your team will comprehend your advice.

Key To Business Global Issues PowerPoint Templates Ppt Backgrounds For Slides 0113
We present our Key To Business Global Issues PowerPoint Templates PPT Backgrounds For Slides 0113.Download and present our Globe PowerPoint Templates because It can Leverage your style with our PowerPoint Templates and Slides. Charm your audience with your ability. Use our Security PowerPoint Templates because you can Set pulses racing with our PowerPoint Templates and Slides. They will raise the expectations of your team. Download and present our Success PowerPoint Templates because Our PowerPoint Templates and Slides will Activate the energies of your audience. Get their creative juices flowing with your words. Use our Signs PowerPoint Templates because You can Create a matrix with our PowerPoint Templates and Slides. Feel the strength of your ideas click into place. Use our Money PowerPoint Templates because Our PowerPoint Templates and Slides are specially created by a professional team with vast experience. They diligently strive to come up with the right vehicle for your brilliant Ideas. Use these PowerPoint slides for presentations relating to Bar graph in key with globe, signs, money, security, success, globe. The prominent colors used in the PowerPoint template are Blue navy, Yellow, Brown. We assure you our Key To Business Global Issues PowerPoint Templates PPT Backgrounds For Slides 0113 will make the presenter successul in his career/life. Professionals tell us our in PowerPoint templates and PPT Slides are designed to make your presentations professional. We assure you our Key To Business Global Issues PowerPoint Templates PPT Backgrounds For Slides 0113 are effectively colour coded to prioritise your plans They automatically highlight the sequence of events you desire. The feedback we get is that our money PowerPoint templates and PPT Slides provide you with a vast range of viable options. Select the appropriate ones and just fill in your text. Customers tell us our Key To Business Global Issues PowerPoint Templates PPT Backgrounds For Slides 0113 provide great value for your money. Be assured of finding the best projection to highlight your words. Customers tell us our globe PowerPoint templates and PPT Slides are specially created by a professional team with vast experience. They diligently strive to come up with the right vehicle for your brilliant Ideas. Put in your every bit with our Key To Business Global Issues PowerPoint Templates Ppt Backgrounds For Slides 0113. They will give it their all.
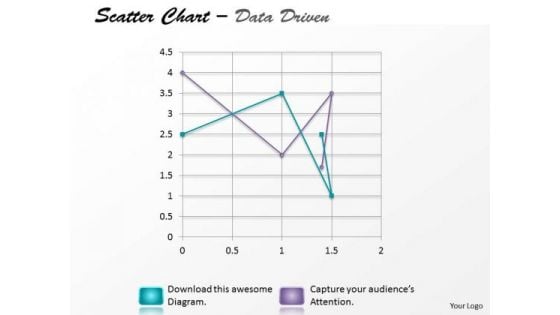
Data Analysis Excel Driven Multiple Series Scatter Chart PowerPoint Slides Templates
Your Listeners Will Never Doodle. Our data analysis excel driven multiple series scatter chart powerpoint slides Templates Will Hold Their Concentration.
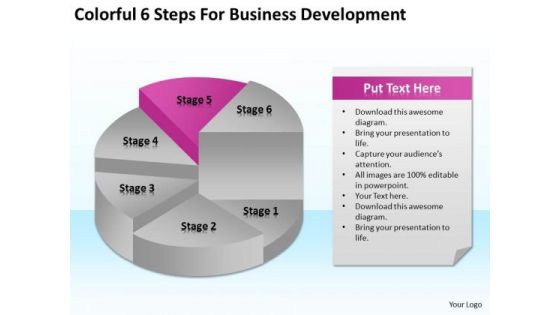
6 Steps For Business Development Ppt How Do Write A Plan PowerPoint Templates
We present our 6 steps for business development ppt how do write a plan PowerPoint templates.Download and present our Process and Flows PowerPoint Templates because Our PowerPoint Templates and Slides will definately Enhance the stature of your presentation. Adorn the beauty of your thoughts with their colourful backgrounds. Present our Success PowerPoint Templates because Our PowerPoint Templates and Slides will let you meet your Deadlines. Download and present our Flow Charts PowerPoint Templates because These PowerPoint Templates and Slides will give the updraft to your ideas. See them soar to great heights with ease. Download and present our Shapes PowerPoint Templates because You can Raise a toast with our PowerPoint Templates and Slides. Spread good cheer amongst your audience. Download and present our Business PowerPoint Templates because Our PowerPoint Templates and Slides will generate and maintain the level of interest you desire. They will create the impression you want to imprint on your audience.Use these PowerPoint slides for presentations relating to Icon, pie, chart, business, profile, white, bar, new, success, symbol, elements, diagram, circle, graphic,data, stock, report, marketing, analyzing, shape, graph, steps, illustration, round, up, aspirations, design, color, growth, backgrounds, progress, part,inspiration, information, improvement, staircase, portion, ideas, exchange. The prominent colors used in the PowerPoint template are Pink, Gray, Blue light. Label your success story with our 6 Steps For Business Development Ppt How Do Write A Plan PowerPoint Templates. Make sure your presentation gets the attention it deserves.
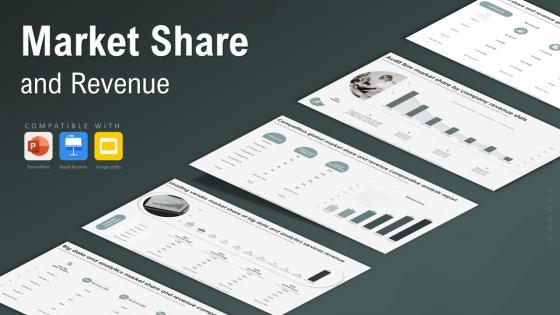
Market Share And Revenue Powerpoint Ppt
This Market Share And Revenue Powerpoint Ppt is designed to help you retain your audiences attention. This content-ready PowerPoint Template enables you to take your audience on a journey and share information in a way that is easier to recall. It helps you highlight the crucial parts of your work so that the audience does not get saddled with information download. This Market Share And Revenue From Sales, Big Data Market Share, Competitors Market Share, Unit Market And Revenue Share-slide PPT Deck comes prepared with the graphs and charts you could need to showcase your information through visuals. You only need to enter your own data in them. Download this editable PowerPoint Theme and walk into that meeting with confidence. The Market Share and Revenue PowerPoint PPT is a dynamic presentation template designed to analyze and showcase a companys market performance. It features visually appealing slides covering market share trends, revenue growth comparisons, and competitive analysis. This template includes charts, graphs, and infographics to clearly communicate key metrics and business insights. Ideal for business analysts, marketing professionals, and executives, it enables users to highlight strategic achievements, performance benchmarks, and growth opportunities effectively.

Application Areas Of Mobile Cloud Computing Ppt Powerpoint Presentation Complete Deck
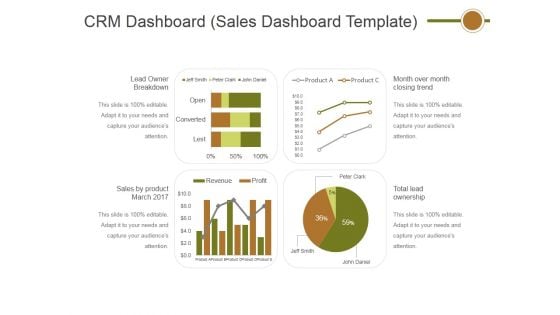
Crm Dashboard Sales Dashboard Template Ppt PowerPoint Presentation Professional Layout
This is a crm dashboard sales dashboard template ppt powerpoint presentation professional layout. This is a four stage process. The stages in this process are lead owner breakdown, sales by product march 2017, total lead ownership, month over month closing trend.

Technology Trends In Online Insurance Ppt Powerpoint Presentation Complete Deck
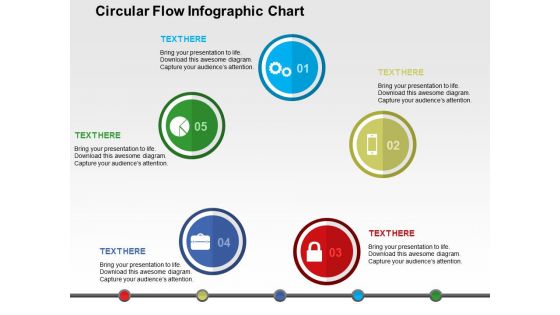
Circular Flow Infographic Chart Powerpoint Templates
Circular infographic has been displayed in this business slide. This business diagram helps to exhibit process of target planning. Use this diagram to build an exclusive presentation.
Colorful Circles With Icons Powerpoint Templates
Circular infographic has been displayed in this business slide. This business diagram helps to exhibit process of strategic planning. Use this diagram to build an exclusive presentation.
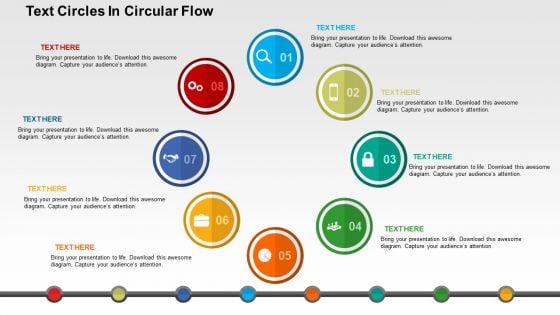
Text Circles In Circular Flow Powerpoint Templates
If anything that can depict a continuous flow of information or data, then it has to be this template which is one of our top rated PowerPoint templates. You can use this multicolored slide to represent various steps involved in a nonstop process. This template can also be perfect choice to denote a continuous process or a process which is repetitive in nature. The diagram is self-explanatory to a lot of extent and with the right icons it is will surely pass the right message in one go. This design can be your perfect solution to depict a loop in anything ranging from a business organization to a communication process.
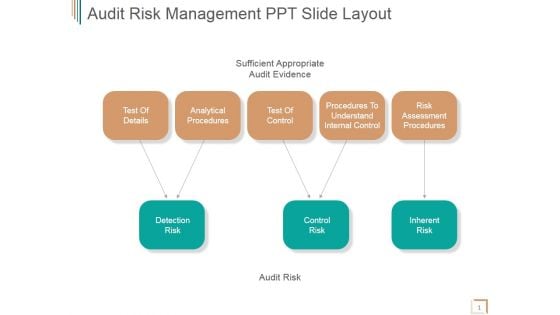
Audit Risk Management Ppt PowerPoint Presentation Slide
This is a audit risk management ppt powerpoint presentation slide. This is a three stage process. The stages in this process are test of details, analytical procedures, test of control, procedures to understand internal control, risk assessment procedures, inherent risk, control risk, detection risk.

Rescue Statistics Business PowerPoint Templates And PowerPoint Themes 1112
Rescue Statistics Business PowerPoint Templates And PowerPoint Themes 1112-This PowerPoint Template contains an image of lifesaver and multicolored bar graphs which depict the concept of rescue statistics. Use our Success PowerPoint Templates because; amplify your thoughts via our appropriate templates. Use our Business PowerPoint Templates because, Business Template: - There is a vision, a need you can meet. Present your views using our innovative slides and be assured of leaving a lasting impression.-Rescue Statistics Business PowerPoint Templates And PowerPoint Themes 1112-This PowerPoint template can be used for presentations relating to-Rescue Statistics, Business, Security, Marketing, Finance, Abstract Make sure your audience learns with our Rescue Statistics Business PowerPoint Templates And PowerPoint Themes 1112. Make sure your presentation gets the attention it deserves.
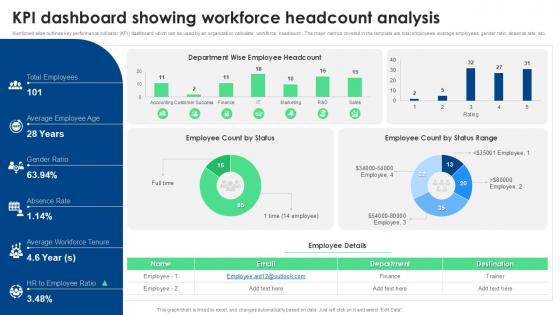
KPI Dashboard Snapshot Showing Workforce Headcount Analysis
From laying roadmaps to briefing everything in detail, our templates are perfect for you. You can set the stage with your presentation slides. All you have to do is download these easy-to-edit and customizable templates. KPI Dashboard Snapshot Showing Workforce Headcount Analysis will help you deliver an outstanding performance that everyone would remember and praise you for. Do download this presentation today. The KPI Dashboard Snapshot Showing Workforce Headcount Analysis is a visually compelling PowerPoint template designed to present key metrics related to workforce composition. It includes dynamic charts and graphs showcasing headcount trends, department breakdowns, gender ratios, and more. This template is perfect for HR teams and executives who need a concise overview of workforce analytics for strategic decision-making and operational efficiency.
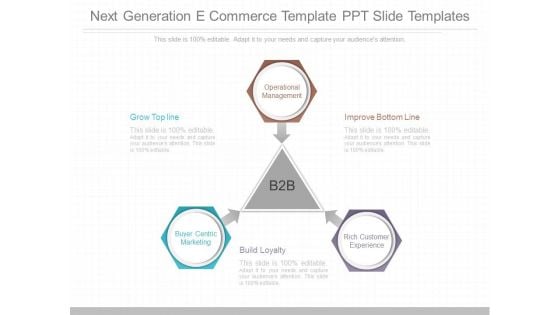
Next Generation E Commerce Template Ppt Slide Templates
This is a next generation e commerce template ppt slide templates. This is a three stage process. The stages in this process are b2b, operational management, buyer centric marketing, rich customer experience, grow top line, build loyalty, improve bottom line.
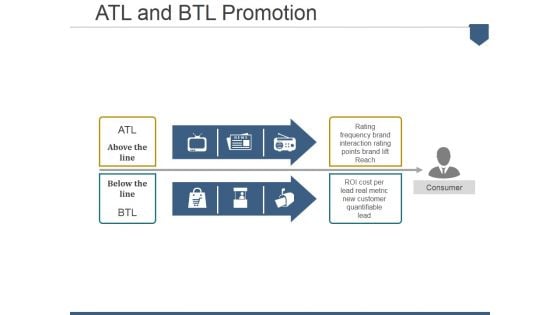
Atl And Btl Promotion Ppt PowerPoint Presentation Gallery Show
This is a atl and btl promotion ppt powerpoint presentation gallery show. This is a three stage process. The stages in this process are above the line, below the line, consumer.
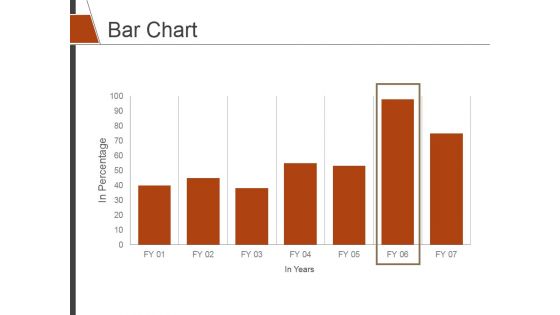
Bar Chart Ppt PowerPoint Presentation Slides Shapes
This is a bar chart ppt powerpoint presentation slides shapes. This is a seven stage process. The stages in this process are bar graph, finance, marketing, strategy, analysis.
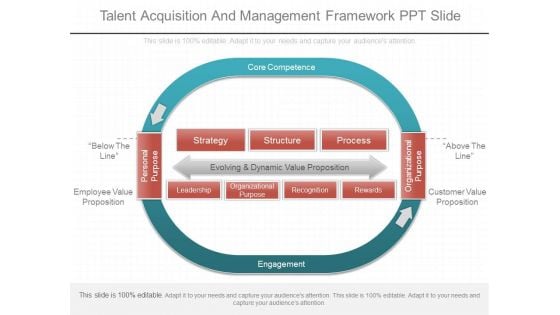
Talent Acquisition And Management Framework Ppt Slide
This is a talent acquisition and management framework ppt slide. This is a one stage process. The stages in this process are core competence, below the line, employee value proposition, personal purpose, strategy, structure, process, evolving and dynamic value proposition, leadership, organizational purpose, recognition, rewards, above the line, customer value proposition, engagement.\n\n\n\n\n\n\n\n\n\n\n\n\n\n\n\n
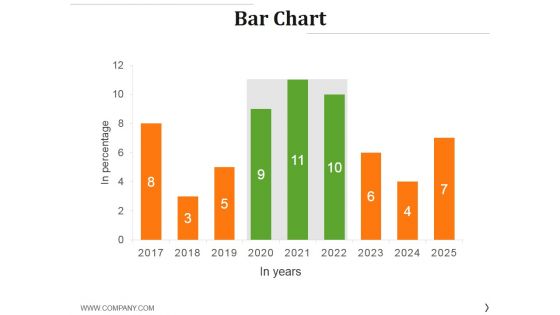
Bar Chart Ppt PowerPoint Presentation Styles Graphics Example
This is a bar chart ppt powerpoint presentation styles graphics example. This is a nine stage process. The stages in this process are graph, growth, success, business, finance.
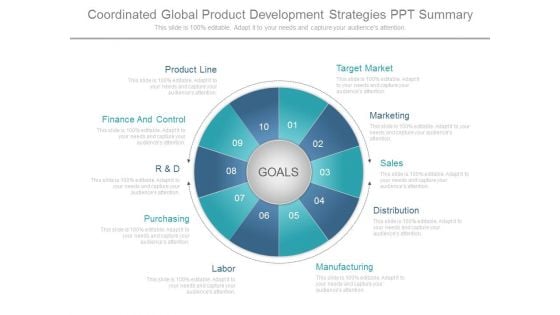
Coordinated Global Product Development Strategies Ppt Summary
This is a coordinated global product development strategies ppt summary. This is a ten stage process. The stages in this process are goals, target market, marketing, sales, distribution, manufacturing, labor, purchasing, r and d, finance and control, product line.
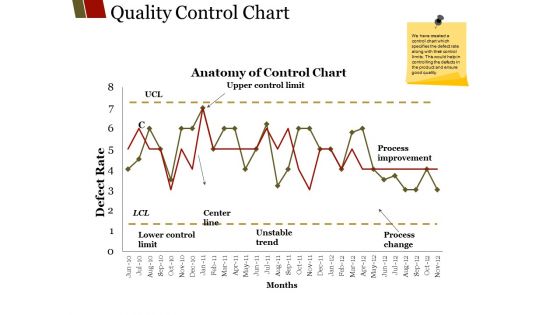
Quality Control Chart Ppt PowerPoint Presentation File Graphics Design
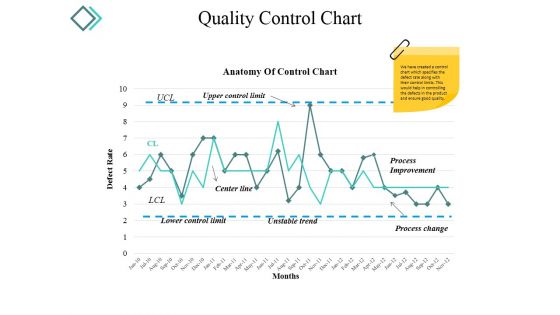
This is a quality control chart ppt powerpoint presentation file graphics design. This is a two stage process. The stages in this process are unstable trend, months center line, lower control limit, process improvement.
Quality Control Chart Ppt PowerPoint Presentation Model Background Images
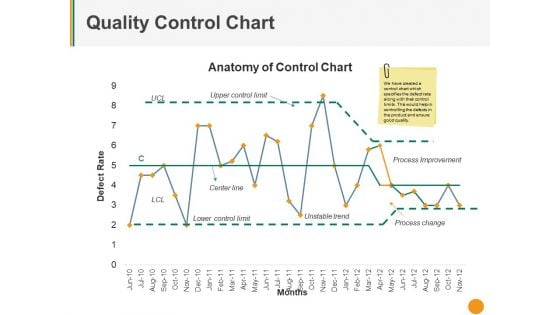
This is a quality control chart ppt powerpoint presentation model background images. This is a two stage process. The stages in this process are center line, process improvement, process change, unstable trend.
Quality Control Chart Ppt PowerPoint Presentation Pictures Deck
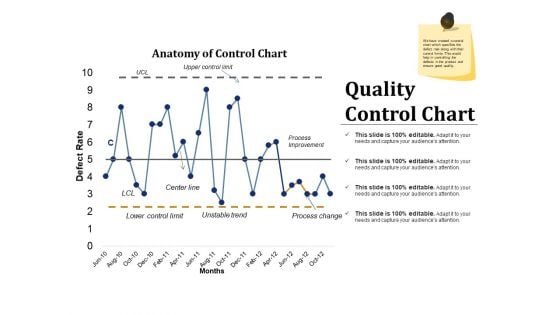
This is a quality control chart ppt powerpoint presentation pictures deck. This is a one stage process. The stages in this process are upper control limit, center line, unstable trend, process improvement, process change.
Quality Control Chart Ppt PowerPoint Presentation Inspiration Example Introduction
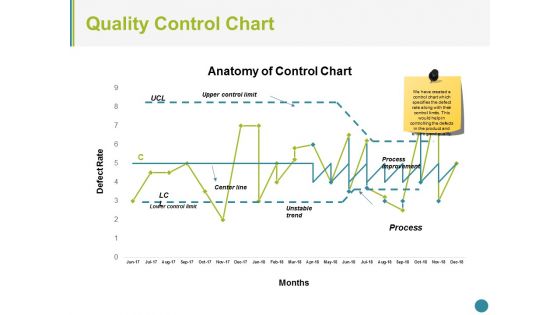
This is a quality control chart ppt powerpoint presentation inspiration example introduction. This is a two stage process. The stages in this process are process improvement, process change, unstable trend, lower control limit, center line.
Quality Control Chart Ppt PowerPoint Presentation Infographic Template Slide Portrait
This is a quality control chart ppt powerpoint presentation infographic template slide portrait. This is a three stage process. The stages in this process are upper control limit, center line, unstable trend, process change, process improvement, lower control limit.
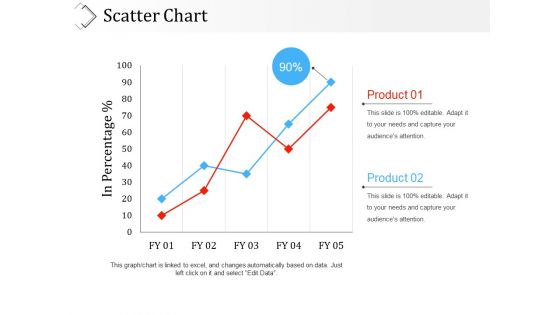
Scatter Chart Ppt PowerPoint Presentation Outline Picture
This is a scatter chart ppt powerpoint presentation outline picture. This is a two stage process. The stages in this process are in percentage, business, marketing, product, graph.
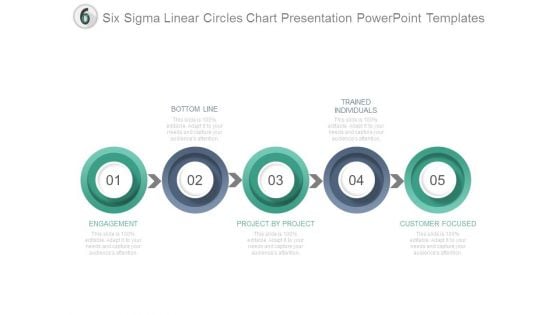
Six Sigma Linear Circles Chart Presentation Powerpoint Templates
This is a six sigma linear circles chart presentation powerpoint templates. This is a five stage process. The stages in this process are bottom line, trained individuals, engagement, project by project, customer focused.
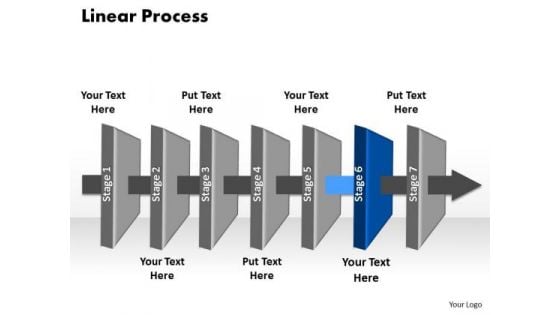
Ppt Ozone Layer PowerPoint Presentation 6 Social Linear Process Templates
PPT ozone layer PowerPoint presentation 6 social linear process Templates-Use this 3D PowerPoint Diagram to represent the Seven stages of Sequential Process. It portrays beeline, continuous, even, horizontal, in bee line, in straight line, linear , nonstop, not crooked, point-blank, right, shortest, straight, straightaway, though, true, unbroken etc.-PPT ozone layer PowerPoint presentation 6 social linear process Templates-abstract, achievement, adding, analyzing, arrow, art, background, blank, blue, business, chart, color, colorful, cycle, data, design, diagram, element, flow, graph, graphic, gray, green, icon, linear, management, market, numbers, percent, process, project, round, stock, success, up, value Experience the striking graphics of our Ppt Ozone Layer PowerPoint Presentation 6 Social Linear Process Templates. They bring good quality to the table.

Scatter Chart Ppt PowerPoint Presentation Portfolio Design Inspiration
This is a scatter chart ppt powerpoint presentation portfolio design inspiration. This is a twelve stage process. The stages in this process are graph, growth, success, business.

Scatter Chart Ppt PowerPoint Presentation Infographic Template Objects
This is a scatter chart ppt powerpoint presentation infographic template objects. This is a nine stage process. The stages in this process are product, growth, success, graph.

Bar Chart Dollar Business PowerPoint Templates And PowerPoint Themes 0912
Bar Chart Dollar Business PowerPoint Templates And PowerPoint Themes 0912-Microsoft Powerpoint Templates and Background with dollar bar graph-Dollar bar graph, money, finance, success, future, business Make people notice your slides with our Bar Chart Dollar Business PowerPoint Templates And PowerPoint Themes 0912. You will be at the top of your game.
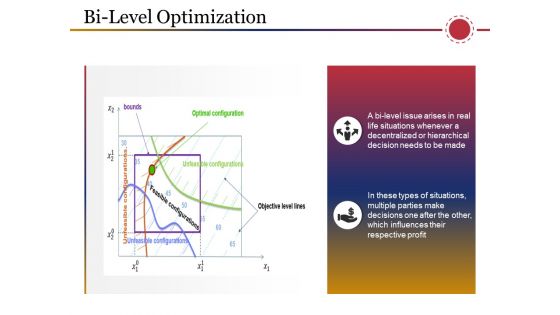
Bi Level Optimization Ppt PowerPoint Presentation Model Summary
This is a bi level optimization ppt powerpoint presentation model summary. This is a two stage process. The stages in this process are bounds, optimal configuration, objective level lines, icons, business.
Bi Level Optimization Ppt PowerPoint Presentation Gallery Icons
This is a bi level optimization ppt powerpoint presentation gallery icons. This is a two stage process. The stages in this process are objective level lines, bounds, optimal configuration, feasible configurations, business, marketing.
Bi Level Optimization Ppt PowerPoint Presentation Infographics Icon
This is a bi level optimization ppt powerpoint presentation infographics icon. This is a two stage process. The stages in this process are icons, business, marketing, bound, objective level lines.
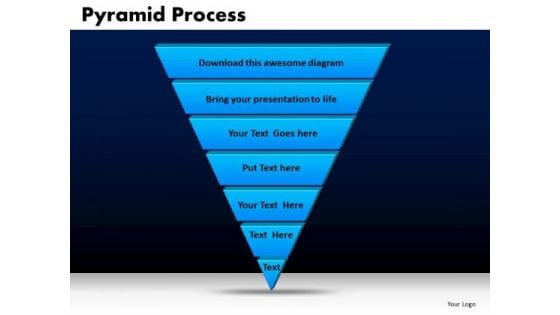
Business Triangles PowerPoint Templates Chart Pyramid Process Ppt Slides
Business Triangles PowerPoint Templates Chart Pyramid Process PPT Slides-A Pyramid Diagram may be defined as representation of data in the form of a triangle separated by horizontal lines. The widest section may contain the general topic while the narrowest section may contain a much more specific topic. -Business Triangles PowerPoint Templates Chart Pyramid Process PPT Slides-This template can be used for presentations relating to 3d, Bar, Business, Chart, Class, Conceptual, Corner, FInance, Graph, Graphic, Hierarchy, Investment, Layer, Level, Performance, Planner, Priority, Progress, Pyramid, Render, Status, Strategy, System, Triangle Earn the credits you do deserve. Answer the critics with our Business Triangles PowerPoint Templates Chart Pyramid Process Ppt Slides.
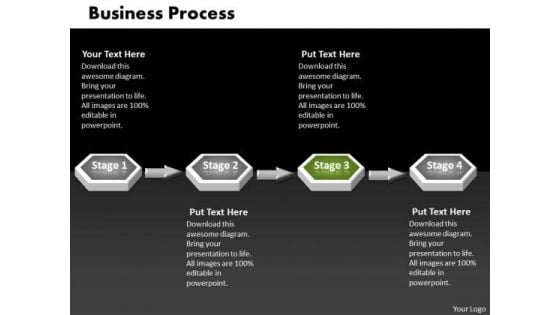
Ppt Green PowerPoint Slide Stage 3d Sequential Linear Process Templates
PPT green powerpoint slide stage 3d sequential linear process Templates-This Business PowerPoint Diagram shows 3d linear abstraction to represent Business related issues. It uses four stages. It indicates employment, field, function, game, line, and livelihood. It is helpful to organize information. -PPT green powerpoint slide stage 3d sequential linear process Templates-arrow, art, basic, blank, business, capital, chart, chevron, clip, clipart, colorful, conglomerates, consumer, copy, cyclical, energy, financial, flow, goods, graph, graphic, healthcare, illustration, infographic, information, investment, isolated, market, materials, non, round, sectors, services, slide, space, stock, technology, text, Make a fancy impression with our Ppt Green PowerPoint Slide Stage 3d Sequential Linear Process Templates. You will be at the top of your game.
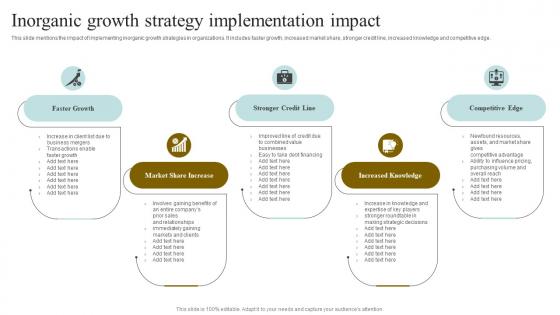
Inorganic Growth Strategy Implementation Impact Clipart Pdf
This slide mentions the impact of implementing inorganic growth strategies in organizations. It includes faster growth, increased market share, stronger credit line, increased knowledge and competitive edge. Showcasing this set of slides titled Inorganic Growth Strategy Implementation Impact Clipart Pdf. The topics addressed in these templates are Stronger Credit Line, Increased Knowledge, Competitive Edge. All the content presented in this PPT design is completely editable. Download it and make adjustments in color, background, font etc. as per your unique business setting. This slide mentions the impact of implementing inorganic growth strategies in organizations. It includes faster growth, increased market share, stronger credit line, increased knowledge and competitive edge.
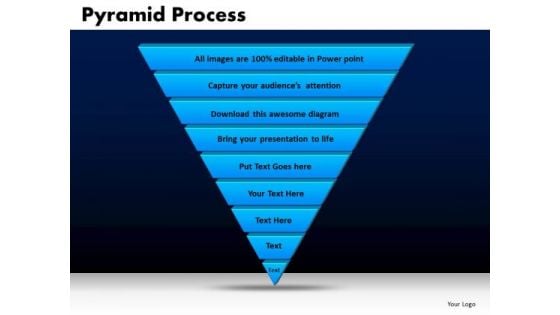
Business Triangles PowerPoint Templates Editable Pyramid Process Ppt Slides
Business Triangles PowerPoint Templates Editable Pyramid Process PPT Slides-A Pyramid Diagram may be defined as representation of data in the form of a triangle separated by horizontal lines. The widest section may contain the general topic while the narrowest section may contain a much more specific topic. -Business Triangles PowerPoint Templates Editable Pyramid Process PPT Slides-This template can be used for presentations relating to 3d, Bar, Business, Chart, Class, Conceptual, Corner, FInance, Graph, Graphic, Hierarchy, Investment, Layer, Level, Performance, Planner, Priority, Progress, Pyramid, Render, Status, Strategy, System, Triangle Complete your presentation in time with our Business Triangles PowerPoint Templates Editable Pyramid Process Ppt Slides. You will come out on top.
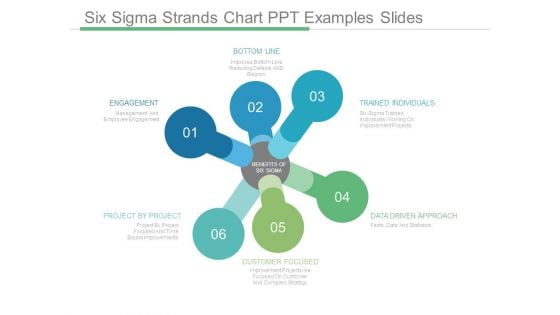
Six Sigma Strands Chart Ppt Examples Slides
This is a six sigma strands chart ppt examples slides. This is a six stage process. The stages in this process are bottom line, trained individuals, data driven approach, customer focused, project by project, engagement, benefits of six sigma.

Six Sigma Circle Chart Powerpoint Slide Information
This is a six sigma circle chart powerpoint slide information. This is a five stage process. The stages in this process are bottom line, trained individuals, engagement, project by project, customer focused.
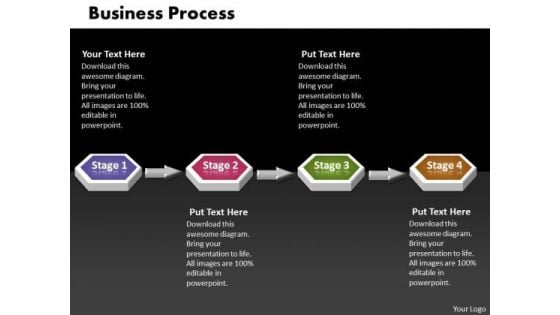
Ppt 4 Phase Diagram 3d Sequential Business PowerPoint Theme Process Templates
PPT 4 phase diagram 3d sequential business powerpoint theme process Templates-Use this 3D PowerPoint Diagram to describe three stages of Continuous Process. It portrays beeline, Sequential, even, horizontal, in bee line, linear , nonstop, not crooked, point-blank, right, straight, straightaway, though, true, unbroken etc.-PPT 4 phase diagram 3d sequential business powerpoint theme process Templates-arrow, art, background, blank, business, chart, clip, diagram, drop, eps10, flow, four, graph, graphic, gray, green, illustration, process, shadow, shape, step, symbol, transparency, vector, white Our Ppt 4 Phase Diagram 3d Sequential Business PowerPoint Theme Process Templates come in all colours, shades and hues. They help highlight the importance of your views.
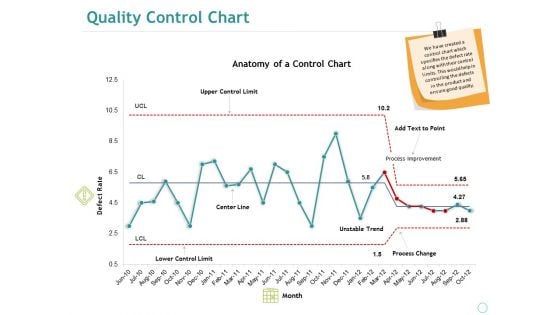
Quality Control Chart Ppt PowerPoint Presentation Summary Sample
This is a quality control chart ppt powerpoint presentation summary sample. This is a one stage process. The stages in this process are anatomy of a control chart, defect rate, upper control limit, center line, lower control limit.
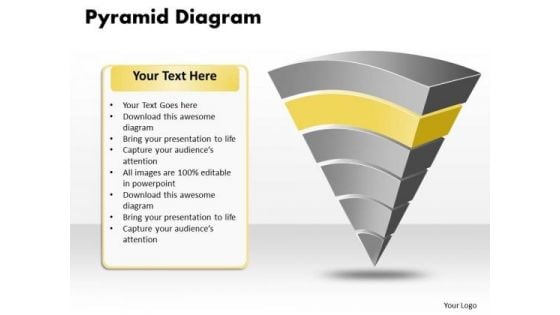
Ppt Pyramid Diagram Pattern Certificate Templates PowerPoint
PPT pyramid diagram pattern certificate templates powerpoint-A Pyramid Diagram may be defined as representation of data in the form of a triangle separated by horizontal lines. The widest section may contain the general topic while the narrowest section may contain a much more specific topic.This diagarm highlights the depth of your thought process.-PPT pyramid diagram pattern certificate templates powerpoint-Business, Chart, Color, Data Pyramid, Diagram, Graph, Group, Growth, Hierarchy, Illustration, Layer, Layered, Layered Pyramid, Level, Multicolor, Object, Performance, Presentation, Progress, Pyramid, Rank, Seam, Segment, Set, Shape, Stage, Structure, Symbol, System, Top Do not fall for any popular fallacy. Ascertain the facts with our Ppt Pyramid Diagram Pattern Certificate Templates PowerPoint.
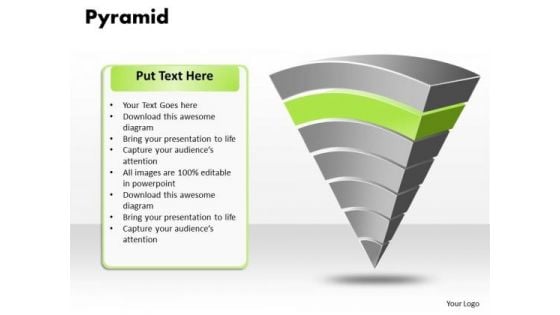
Ppt Pyramid Motivational Needs Interior Design PowerPoint Presentation Templates
PPT pyramid motivational needs interior design powerpoint presentation Templates-Successful businesses today get to where they are because of the right business process modeling that was applied previously.This structure of our templates allows you to effectively highlight the key issues concerning the growth of your business-PPT pyramid motivational needs interior design powerpoint presentation Templates-Business, Chart, Color, Data Pyramid, Diagram, Graph, Group, Growth, Hierarchy, Illustration, Layer, Layered, Layered Pyramid, Level, Multicolor, Object, Performance, Presentation, Progress, Pyramid, Rank, Seam, Segment, Set, Shape, Stage, Structure, Symbol, System, Top Our Ppt Pyramid Motivational Needs Interior Design PowerPoint Presentation Templates are a great feeder line. They keep the energy coming to you.

Pareto Chart Ppt PowerPoint Presentation Ideas
This is a pareto chart ppt powerpoint presentation ideas. This is a four stage process. The stages in this process are bar graph, finance, marketing, strategy, analysis, business.
Column Chart Ppt PowerPoint Presentation Professional Example
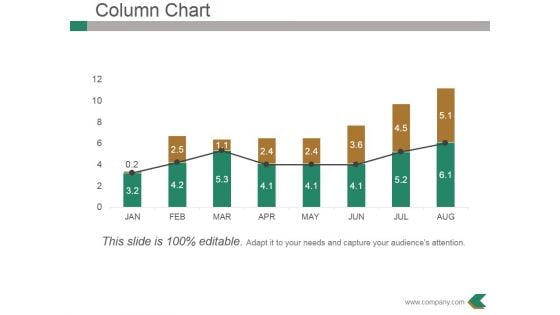
This is a column chart ppt powerpoint presentation professional example. This is a eight stage process. The stages in this process are bar graph, growth, success, business, marketing.
Column Chart Ppt PowerPoint Presentation Infographics Model
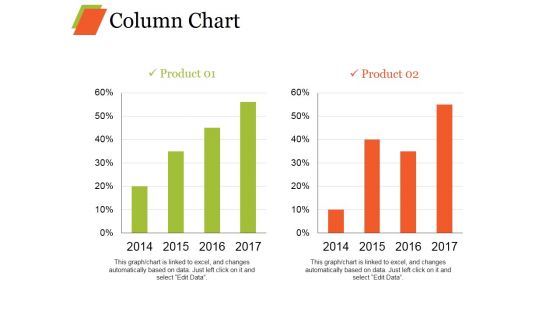
This is a column chart ppt powerpoint presentation infographics model. This is a two stage process. The stages in this process are bar graph, growth, product, percentage, year.
Lime Investor Fundraising Elevator Limebike Service To Seattles Columbia City Ppt Inspiration Grid PDF
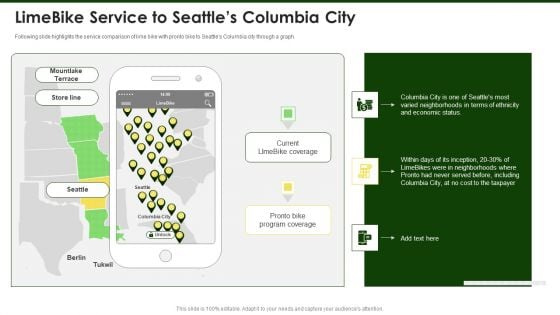
Following slide highlights the service comparison of lime bike with pronto bike to Seattles Columbia city through a graph. This is a lime investor fundraising elevator limebike service to seattles columbia city ppt inspiration grid pdf template with various stages. Focus and dispense information on three stages using this creative set, that comes with editable features. It contains large content boxes to add your information on topics like mountlake terrace, current, limebike coverage, pronto bike program coverage, store line. You can also showcase facts, figures, and other relevant content using this PPT layout. Grab it now.
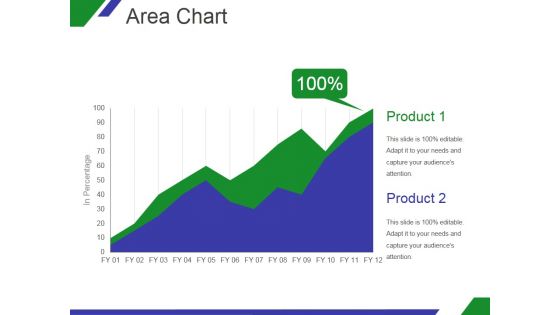
Area Chart Ppt PowerPoint Presentation Designs
This is a area chart ppt powerpoint presentation designs. This is a two stage process. The stages in this process are product, graph, in percentage, growth, business.
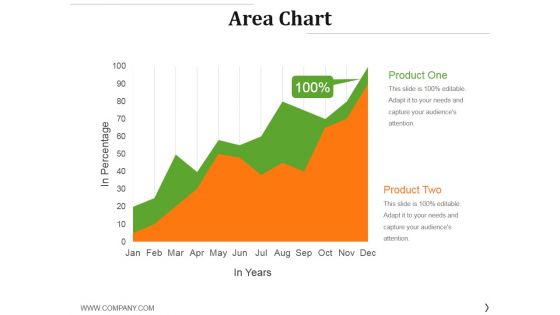
Area Chart Ppt PowerPoint Presentation Gallery Inspiration
This is a area chart ppt powerpoint presentation gallery inspiration. This is a two stage process. The stages in this process are product, growth, success, graph, finance.

Area Chart Ppt PowerPoint Presentation Slides Show
This is a area chart ppt powerpoint presentation slides show. This is a two stage process. The stages in this process are business, marketing, success, graph, growth.
Music Notes Abstract PowerPoint Presentation Slides F
Microsoft PowerPoint Slides and Backgrounds With multicoloured music notes abstract Our Music Notes Abstract PowerPoint Presentation Slides F will keep u sane. Your thoughts will bolt across the line.
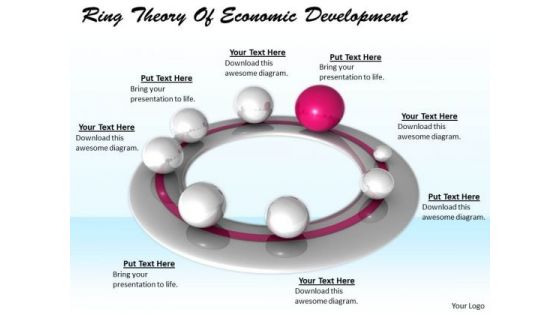
Stock Photo Business Growth Strategy Ring Theory Of Economic Development Clipart
Etch It In Their Brain With Our stock photo business growth strategy ring theory of economic development clipart. Embed Your Concept In Their Minds. Blast A Forehand With Our spheres. Your Ideas Will Go Right Down The Line.
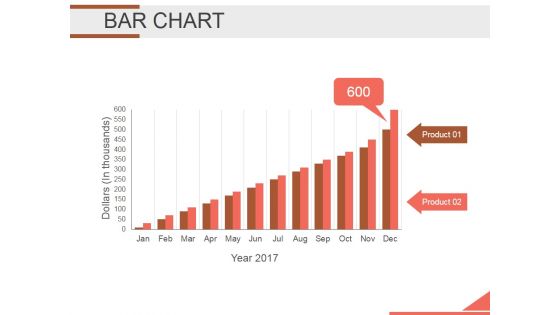
Bar Chart Ppt PowerPoint Presentation Background Designs
This is a bar chart ppt powerpoint presentation background designs. This is a twelve stage process. The stages in this process are bar graph, finance, marketing, strategy, analysis, investment.
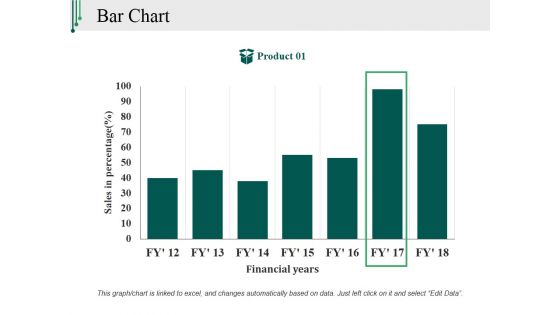
Bar Chart Ppt PowerPoint Presentation Outline Backgrounds
This is a bar chart ppt powerpoint presentation outline backgrounds. This is a one stage process. The stages in this process are sales in percentage, financial years, product, bar graph, finance.
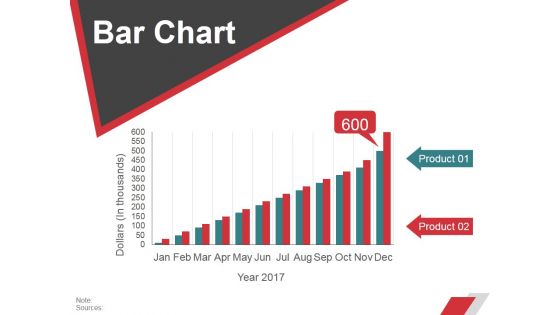
Bar Chart Ppt PowerPoint Presentation Layouts Visuals
This is a bar chart ppt powerpoint presentation layouts visuals. This is a two stage process. The stages in this process are business, strategy, marketing, planning, chart and graph.
Bar Chart Ppt PowerPoint Presentation Icon Demonstration
This is a bar chart ppt powerpoint presentation icon demonstration. This is a seven stage process. The stages in this process are product, sales in percentage, financial year, graph.
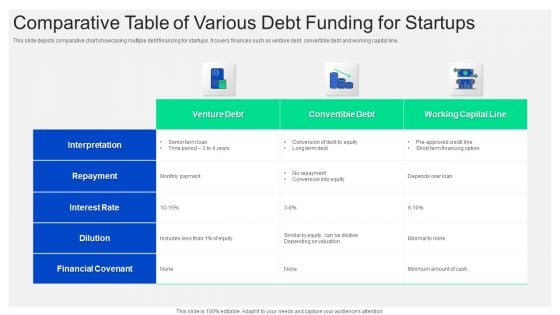
Comparative Table Of Various Debt Funding For Startups Microsoft PDF
This slide depicts comparative chart showcasing multiple debt financing for startups. It covers finances such as venture debt, convertible debt and working capital line. Pitch your topic with ease and precision using this comparative table of various debt funding for startups microsoft pdf. This layout presents information on venture debt, convertible debt, working capital line. It is also available for immediate download and adjustment. So, changes can be made in the color, design, graphics or any other component to create a unique layout.


 Continue with Email

 Home
Home


