Line Graph
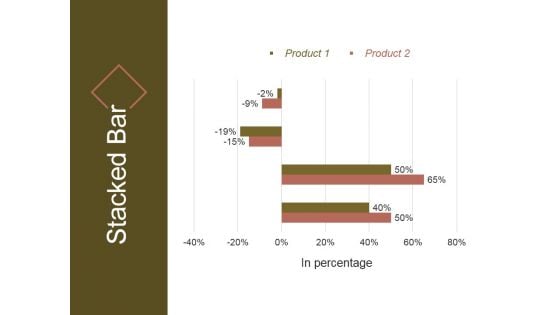
Stacked Bar Template 2 Ppt PowerPoint Presentation Pictures
This is a stacked bar template 2 ppt powerpoint presentation pictures. This is a four stage process. The stages in this process are in percentage, product, stacked bar.
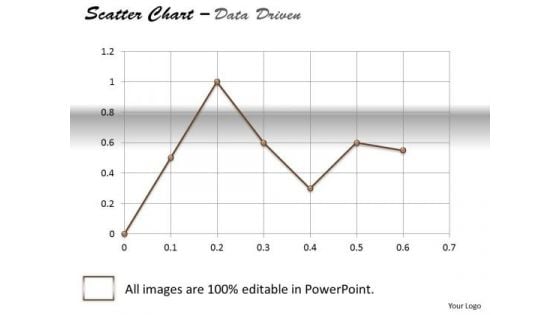
Data Analysis Excel Business Tool Scatter Chart PowerPoint Templates
Dominate Proceedings With Your Ideas. Our data analysis excel business tool scatter chart Powerpoint Templates Will Empower Your Thoughts.
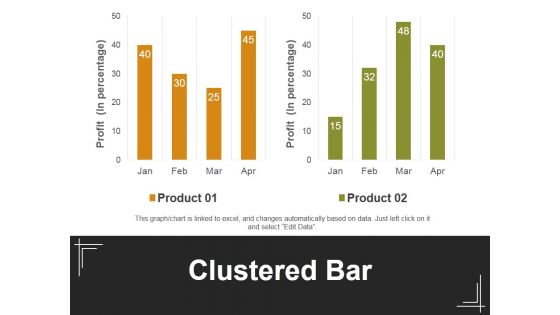
Clustered Bar Ppt PowerPoint Presentation Summary Design Inspiration
This is a clustered bar ppt powerpoint presentation summary design inspiration. This is a two stage process. The stages in this process are product, clustered bar, profit, business, marketing.
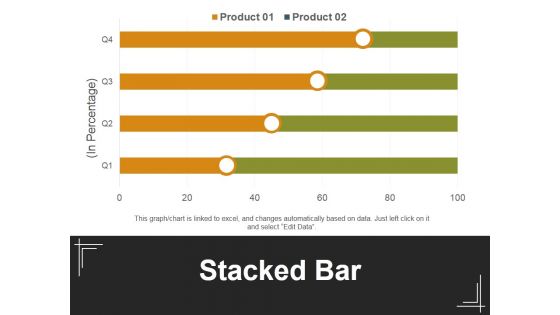
Stacked Bar Template 1 Ppt PowerPoint Presentation Inspiration Background Designs
This is a stacked bar template 1 ppt powerpoint presentation inspiration background designs. This is a four stage process. The stages in this process are in percentage, stacked bar, product, business, marketing.
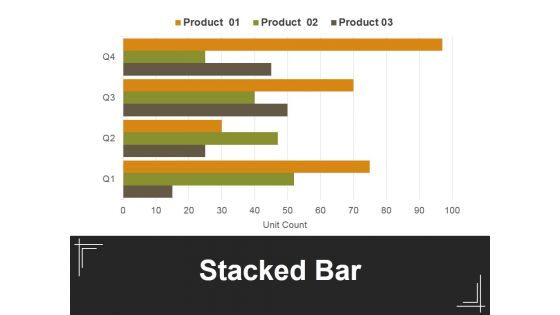
Stacked Bar Template 2 Ppt PowerPoint Presentation Professional Example
This is a stacked bar template 2 ppt powerpoint presentation professional example. This is a four stage process. The stages in this process are in percentage, stacked bar, product, business, marketing.
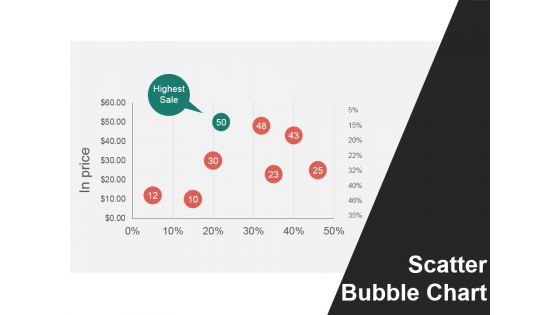
Scatter Bubble Chart Ppt PowerPoint Presentation Show Infographic Template
This is a scatter bubble chart ppt powerpoint presentation show infographic template. This is a six stage process. The stages in this process are in price, scatter bubble chart, highest sale.
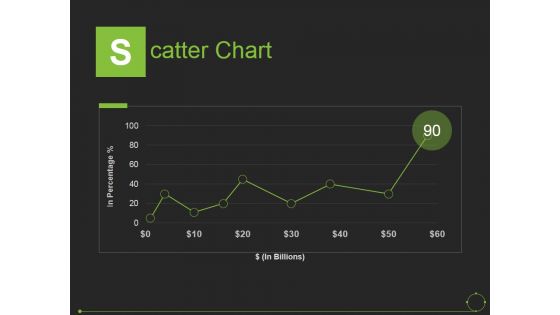
Scatter Chart Ppt PowerPoint Presentation Show Graphic Images
This is a scatter chart ppt powerpoint presentation show graphic images. This is a one stage process. The stages in this process are in percentage, in billions, scatter chart.
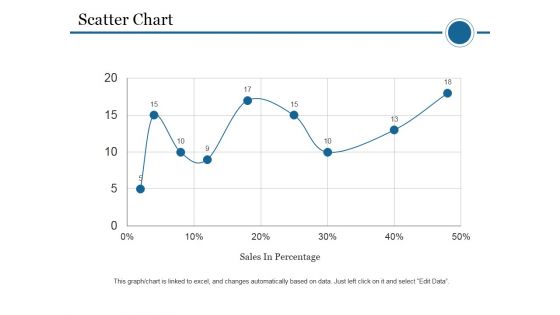
Scatter Chart Template 1 Ppt PowerPoint Presentation Outline Gridlines
This is a scatter chart template 1 ppt powerpoint presentation outline gridlines. This is a one stage process. The stages in this process are scatter chart, sales in percentage, business, marketing, growth.
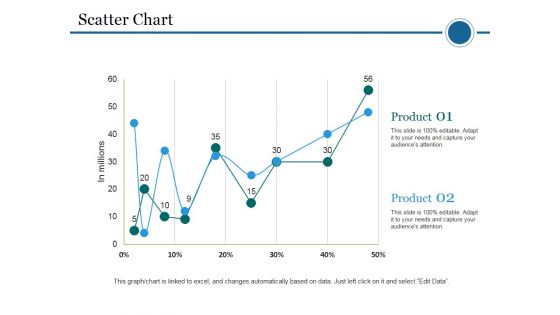
Scatter Chart Template 2 Ppt PowerPoint Presentation Portfolio Skills
This is a scatter chart template 2 ppt powerpoint presentation portfolio skills. This is a two stage process. The stages in this process are scatter chart, in millions, product, business, marketing.
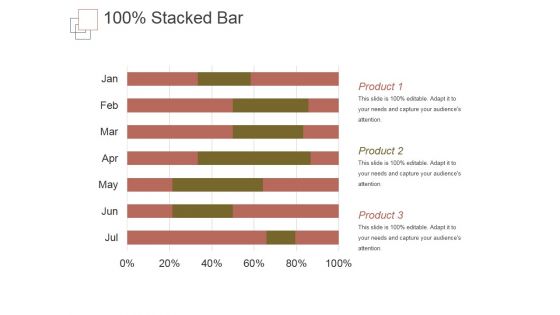
Stacked Bar Template 1 Ppt PowerPoint Presentation Themes
This is a stacked bar template 1 ppt powerpoint presentation themes. This is a six stage process. The stages in this process are product, business, marketing, success, management.
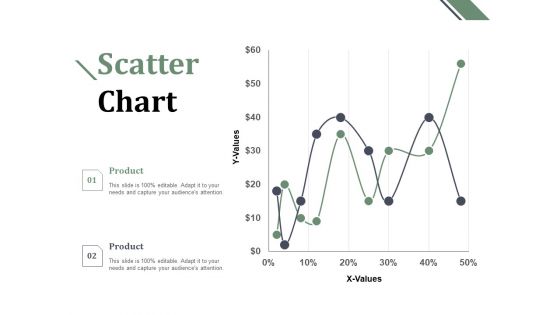
Scatter Chart Ppt PowerPoint Presentation Gallery Master Slide
This is a scatter chart ppt powerpoint presentation gallery master slide. This is a two stage process. The stages in this process are finance, marketing, management, investment, analysis.
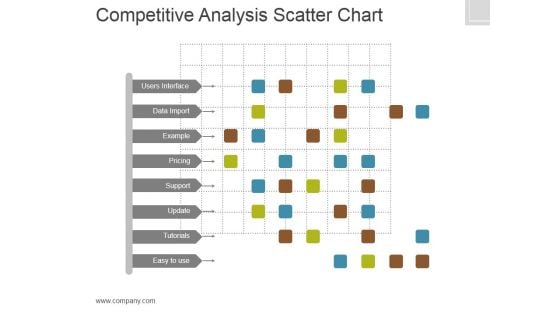
Competitive Analysis Template 6 Scatter Chart Ppt PowerPoint Presentation Slides
This is a competitive analysis template 6 scatter chart ppt powerpoint presentation slides. This is a eight stage process. The stages in this process are users interface, data import, example, pricing, support, update, tutorials, easy to use, table.
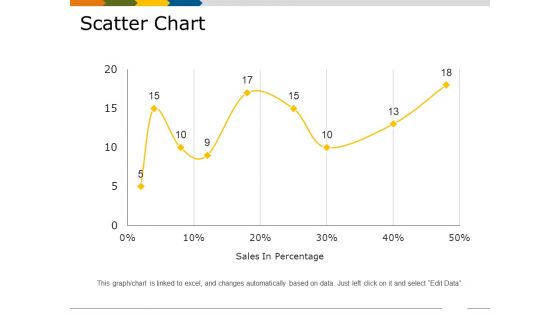
Scatter Chart Template 3 Ppt PowerPoint Presentation Styles Demonstration
This is a scatter chart template 3 ppt powerpoint presentation styles demonstration. This is a one stage process. The stages in this process are sales in percentage, finance, business, marketing, growth.
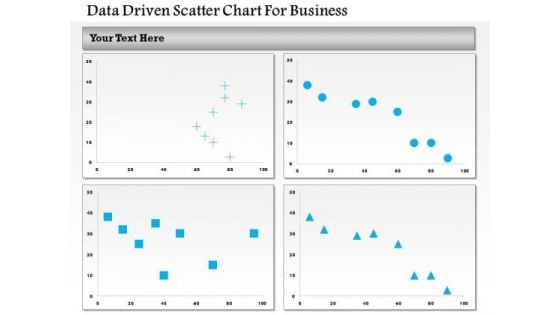
Business Diagram Data Driven Scatter Chart For Business PowerPoint Slide
This business diagram has been designed with four comparative charts. This slide suitable for data representation. You can also use this slide to present business analysis and reports. Use this diagram to present your views in a wonderful manner.
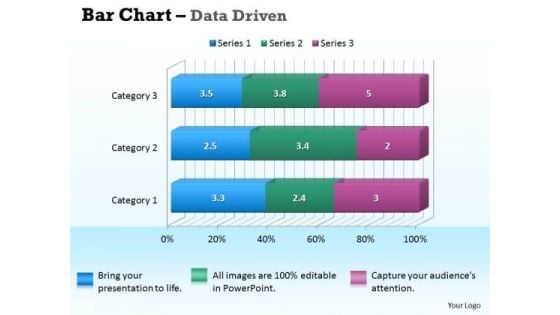
Data Analysis In Excel 3d Bar Chart For Business Information PowerPoint Templates
Our data analysis in excel 3d bar chart for business information Powerpoint Templates Deliver At Your Doorstep. Let Them In For A Wonderful Experience.
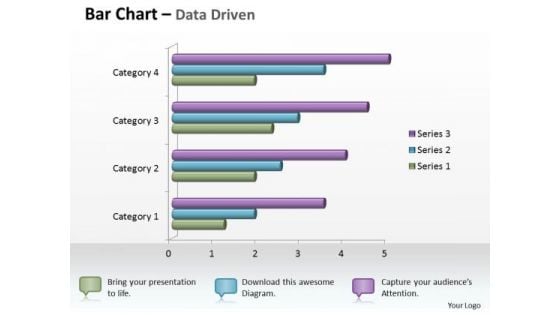
Data Analysis In Excel 3d Bar Chart For Business Statistics PowerPoint Templates
Knock On The Door To Success With Our data analysis in excel 3d bar chart for business statistics Powerpoint Templates . Be Assured Of Gaining Entry.
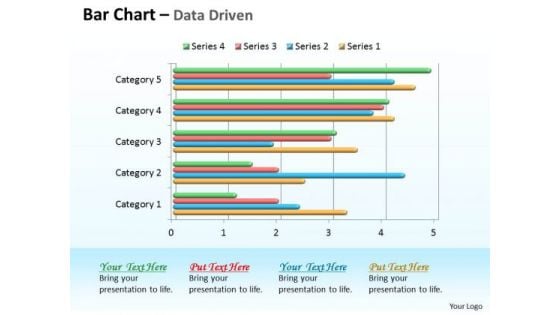
Data Analysis In Excel 3d Bar Chart For Comparison Of Time Series PowerPoint Templates
Double Your Chances With Our data analysis in excel 3d bar chart for comparison of time series Powerpoint Templates . The Value Of Your Thoughts Will Increase Two-Fold.
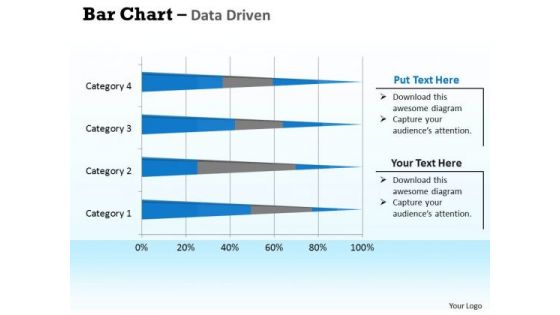
Data Analysis In Excel 3d Bar Chart For Interpretation PowerPoint Templates
Double Up Our data analysis in excel 3d bar chart for interpretation Powerpoint Templates With Your Thoughts. They Will Make An Awesome Pair.
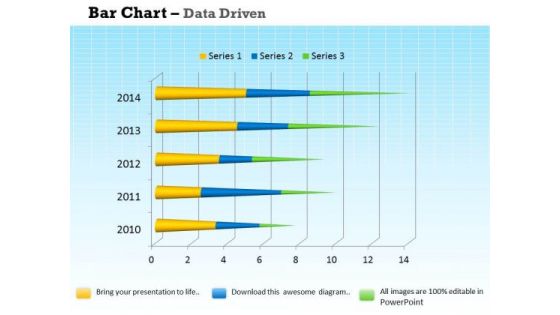
Data Analysis Programs 3d Bar Chart For Market Surveys PowerPoint Templates
Draw On The Experience Of Our data analysis programs 3d bar chart for market surveys Powerpoint Templates . They Imbibe From Past Masters.
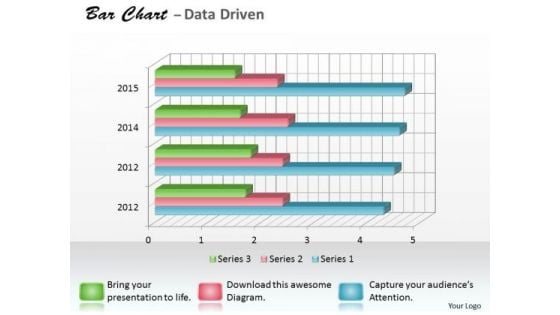
Data Analysis Programs 3d Bar Chart For Research In Statistics PowerPoint Templates
Draw It Out On Our data analysis programs 3d bar chart for research in statistics Powerpoint Templates . Provide Inspiration To Your Colleagues.
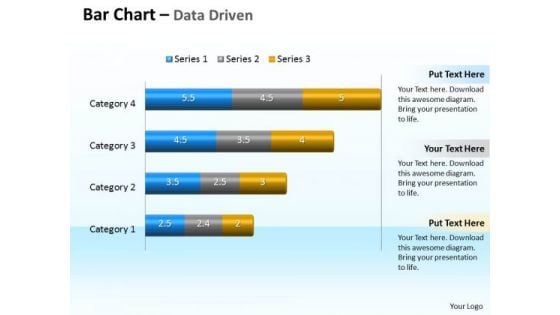
Data Analysis Programs 3d Bar Chart To Compare Categories PowerPoint Templates
Discover Decisive Moments With Our data analysis programs 3d bar chart to compare categories Powerpoint Templates . They Help Make That Crucial Difference.
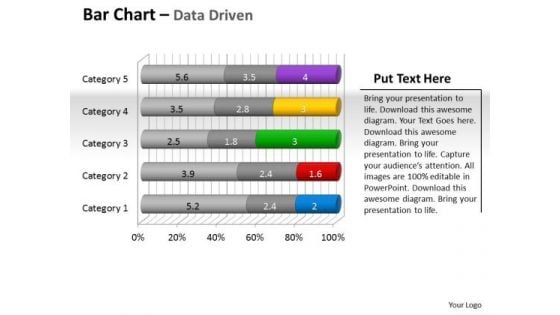
Data Analysis Programs 3d Bar Chart To Put Information PowerPoint Templates
Draw Up Your Agenda On Our data analysis programs 3d bar chart to put information Powerpoint Templates . Coax Your Audience Into Acceptance.
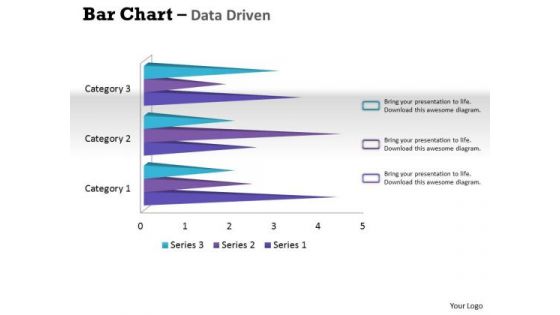
Data Analysis Techniques 3d Bar Chart For Financial Solutions PowerPoint Templates
Make Your Dreams A Reality With Our data analysis techniques 3d bar chart for financial solutions Powerpoint Templates . Your Ideas Will Begin To Take Shape.
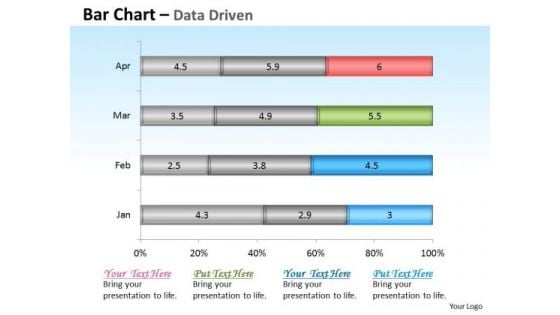
Financial Data Analysis Driven Base Bar Chart Design PowerPoint Slides Templates
Get The Domestics Right With Our financial data analysis driven base bar chart design powerpoint slides Templates . Create The Base For Thoughts To Grow.
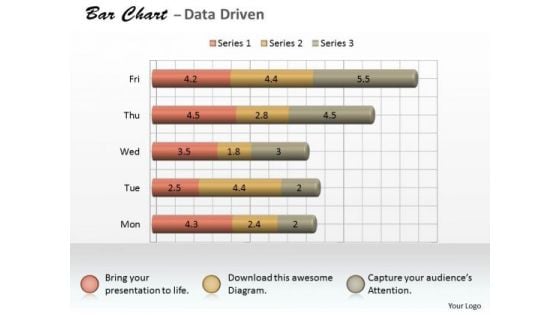
Microsoft Excel Data Analysis 3d Bar Chart As Research Tool PowerPoint Templates
Knock On The Door To Success With Our microsoft excel data analysis 3d bar chart as research tool Powerpoint Templates . Be Assured Of Gaining Entry.
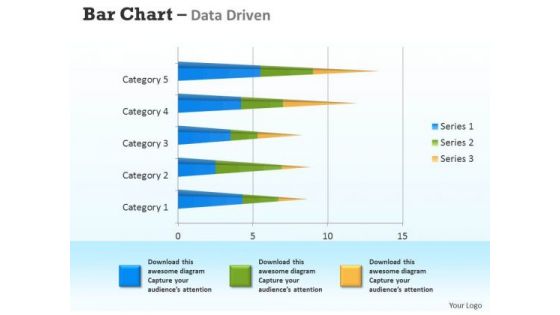
Microsoft Excel Data Analysis 3d Bar Chart For Analyzing Survey PowerPoint Templates
Connect The Dots With Our microsoft excel data analysis 3d bar chart for analyzing survey Powerpoint Templates . Watch The Whole Picture Clearly Emerge.
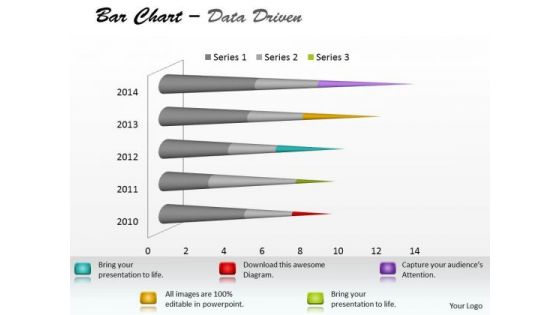
Microsoft Excel Data Analysis Bar Chart To Communicate Information PowerPoint Templates
With Our microsoft excel data analysis bar chart to communicate information Powerpoint Templates You Will Be Doubly Sure. They Possess That Stamp Of Authority.
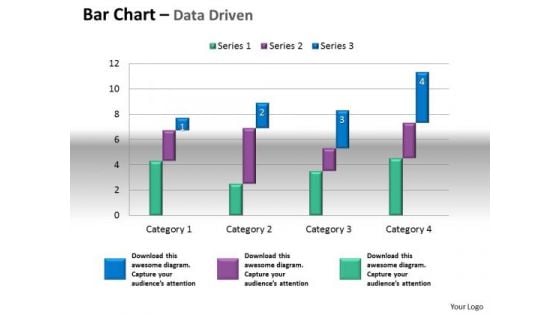
Microsoft Excel Data Analysis Bar Chart To Compare Quantities PowerPoint Templates
Our microsoft excel data analysis bar chart to compare quantities Powerpoint Templates Leave No One In Doubt. Provide A Certainty To Your Views.
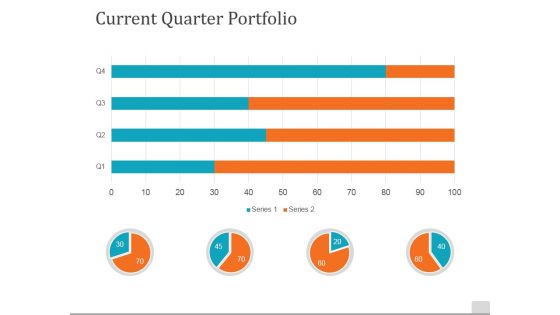
Current Quarter Portfolio Template 1 Ppt PowerPoint Presentation Styles Mockup
This is a current quarter portfolio template 1 ppt powerpoint presentation styles mockup. This is a four stage process. The stages in this process are current quarter portfolio, pie chart, bar graph, business, marketing.
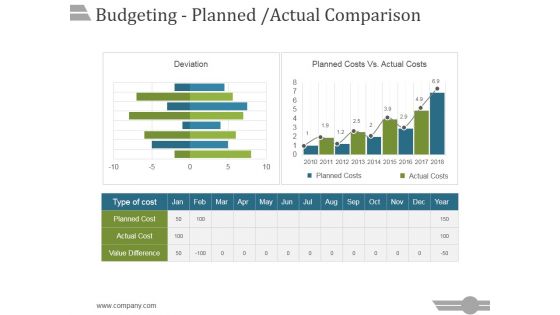
Budgeting Planned Actual Comparison Ppt PowerPoint Presentation Portfolio
This is a budgeting planned actual comparison ppt powerpoint presentation portfolio. This is a three stage process. The stages in this process are business, strategy, marketing, analysis, success, bar graph.
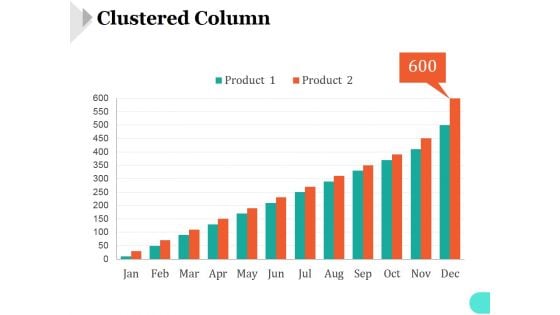
Clustered Column Template 1 Ppt PowerPoint Presentation Inspiration
This is a clustered column template 1 ppt powerpoint presentation inspiration. This is a twelve stage process. The stages in this process are bar graph, marketing, strategy, analysis, business, success.
Clustered Column Template 2 Ppt PowerPoint Presentation Icon
This is a clustered column template 2 ppt powerpoint presentation icon. This is a two stage process. The stages in this process are bar graph, marketing, strategy, analysis, business, success.
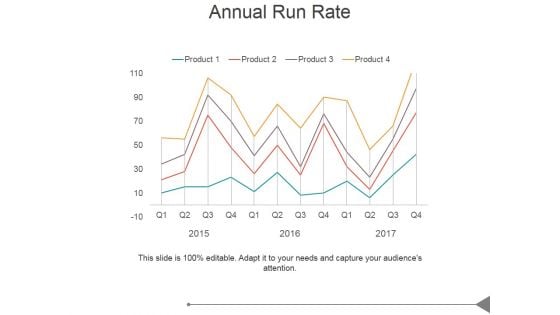
Annual Run Rate Ppt PowerPoint Presentation Designs Download
This is a annual run rate ppt powerpoint presentation designs download. This is a four stage process. The stages in this process are business, marketing, success, business plan, bar graph.
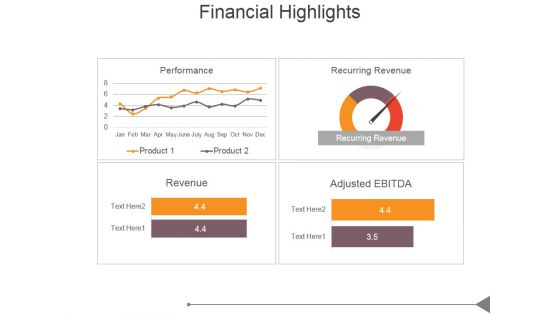
Financial Highlights Template 1 Ppt PowerPoint Presentation Model
This is a financial highlights template 1 ppt powerpoint presentation model. This is a four stage process. The stages in this process are business, marketing, success, business plan, bar graph.
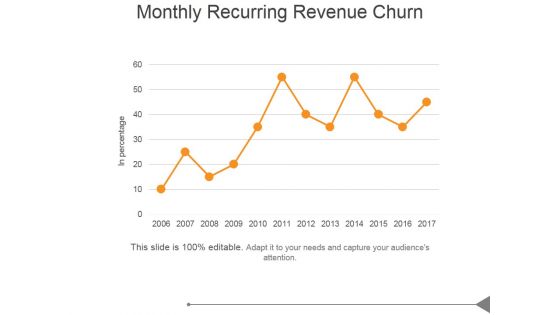
Monthly Recurring Revenue Churn Ppt PowerPoint Presentation Images
This is a monthly recurring revenue churn ppt powerpoint presentation images. This is a five stage process. The stages in this process are business, marketing, success, bar graph, growth.
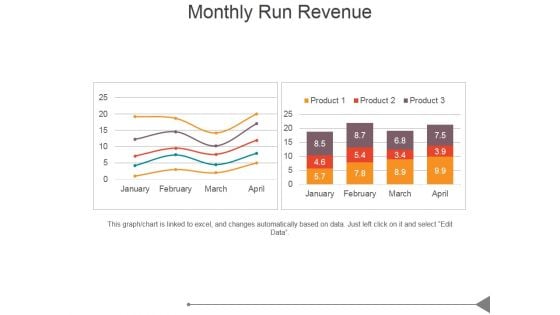
Monthly Run Revenue Ppt PowerPoint Presentation Design Ideas
This is a monthly run revenue ppt powerpoint presentation design ideas. This is a two stage process. The stages in this process are business, marketing, success, bar graph, growth.
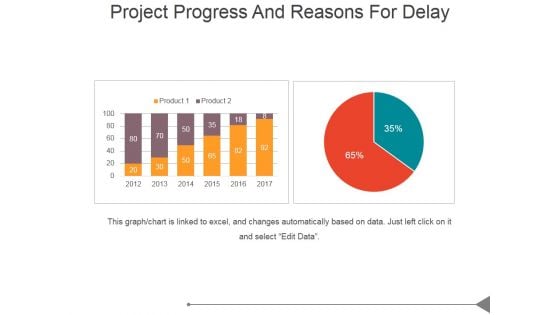
Project Progress And Reasons For Delay Ppt PowerPoint Presentation Designs Download
This is a project progress and reasons for delay ppt powerpoint presentation designs download. This is a two stage process. The stages in this process are business, marketing, success, bar graph, management.
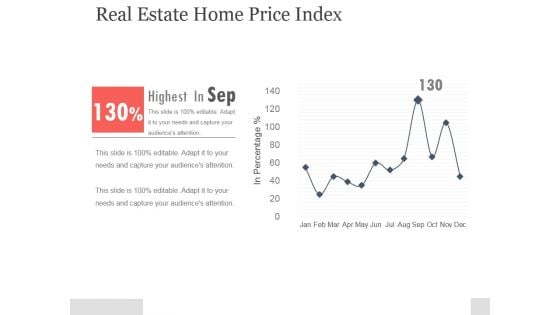
Real Estate Home Price Index Ppt PowerPoint Presentation Example
This is a real estate home price index ppt powerpoint presentation example. This is a one stage process. The stages in this process are bar graph, business, marketing, success, management.
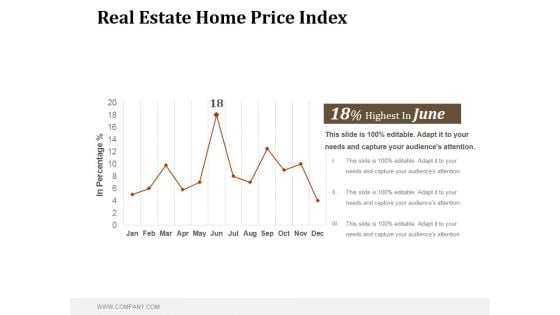
Real Estate Home Price Index Ppt PowerPoint Presentation Samples
This is a real estate home price index ppt powerpoint presentation samples. This is a one stage process. The stages in this process are in percentage, business, bar graph, marketing, success, management.
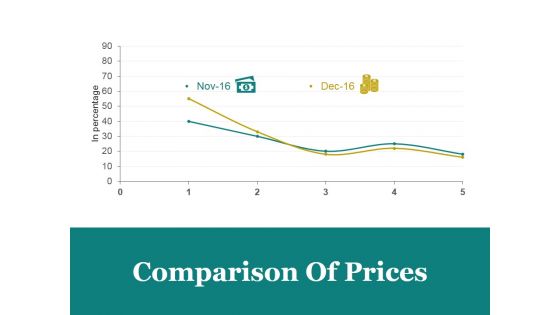
Comparison Of Prices Ppt PowerPoint Presentation Designs Download
This is a comparison of prices ppt powerpoint presentation designs download. This is a two stage process. The stages in this process are comparison of prices, marketing, in percentage, bar graph, business.
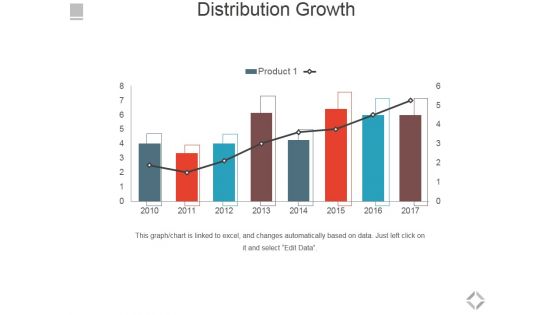
Distribution Growth Ppt PowerPoint Presentation Slides Clipart
This is a distribution growth ppt powerpoint presentation slides clipart. This is a eight stage process. The stages in this process are distribution growth, bar graph, business, marketing, success.
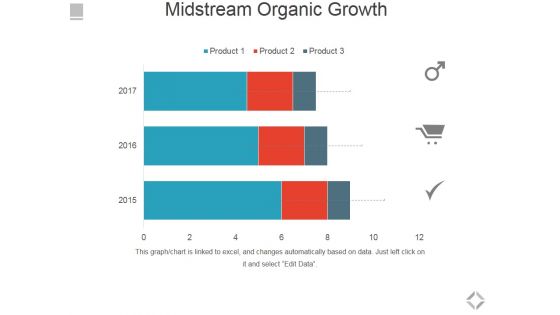
Midstream Organic Growth Ppt PowerPoint Presentation Ideas Graphics Tutorials
This is a midstream organic growth ppt powerpoint presentation ideas graphics tutorials. This is a three stage process. The stages in this process are business, marketing, bar graph, management, financials.
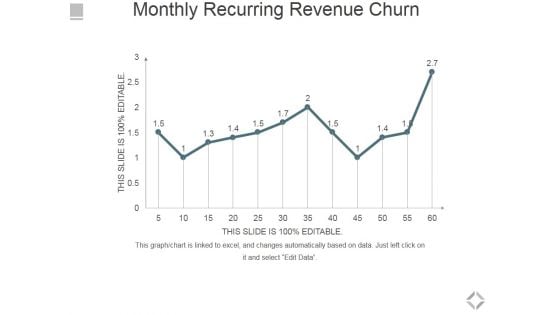
Monthly Recurring Revenue Churn Ppt PowerPoint Presentation Infographics Microsoft
This is a monthly recurring revenue churn ppt powerpoint presentation infographics microsoft. This is a one stage process. The stages in this process are bar graph, business, marketing, success, growth.
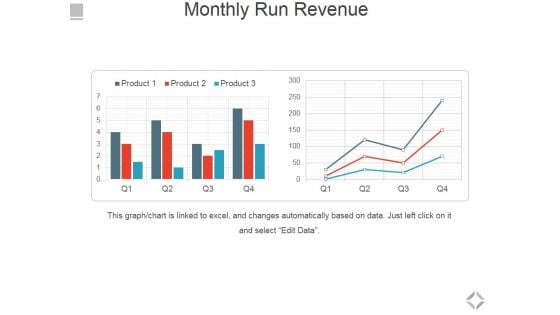
Monthly Run Revenue Ppt PowerPoint Presentation Show Styles
This is a monthly run revenue ppt powerpoint presentation show styles. This is a two stage process. The stages in this process are bar graph, business, marketing, success, growth.
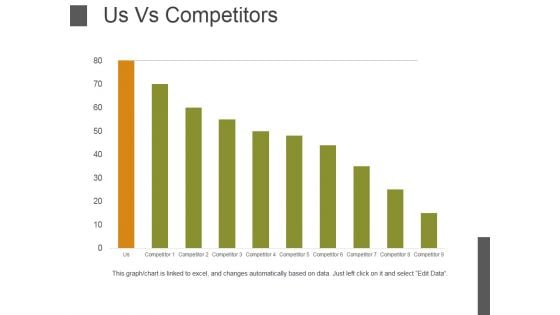
Us Vs Competitors Template 1 Ppt PowerPoint Presentation Model File Formats
This is a us vs competitors template 1 ppt powerpoint presentation model file formats. This is a nine stage process. The stages in this process are bar graph, business, marketing, management, success.
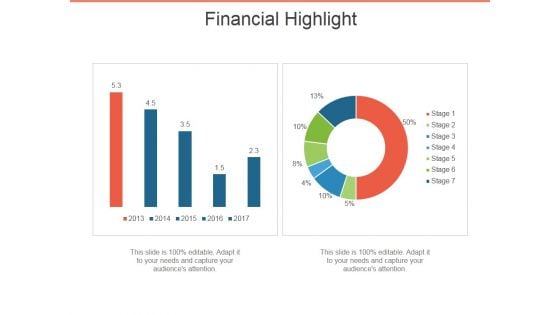
Financial Highlight Template 1 Ppt PowerPoint Presentation Ideas Themes
This is a financial highlight template 1 ppt powerpoint presentation ideas themes. This is a two stage process. The stages in this process are financial, highlight, business, bar graph, marketing.
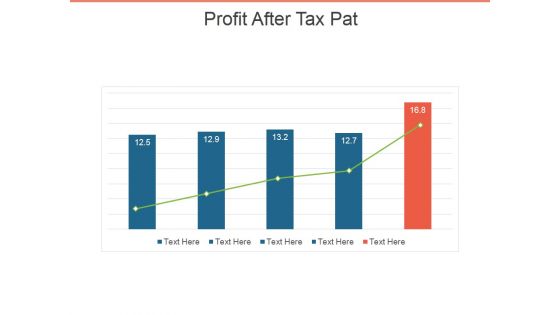
Profit After Tax Pat Ppt PowerPoint Presentation Inspiration Slide
This is a profit after tax pat ppt powerpoint presentation inspiration slide. This is a five stage process. The stages in this process are bar graph, business, marketing, growth, management.
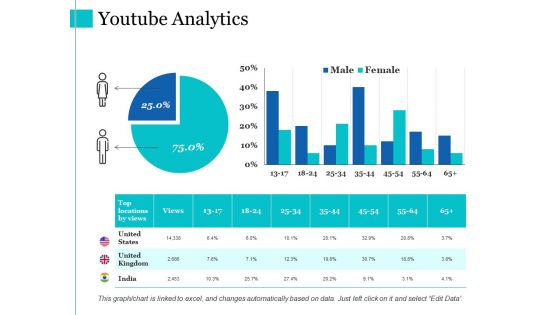
Youtube Analytics Ppt PowerPoint Presentation Layouts Graphic Images
This is a youtube analytics ppt powerpoint presentation layouts graphic images. This is a three stage process. The stages in this process are youtube analytics, finance, percentage, bar graph.
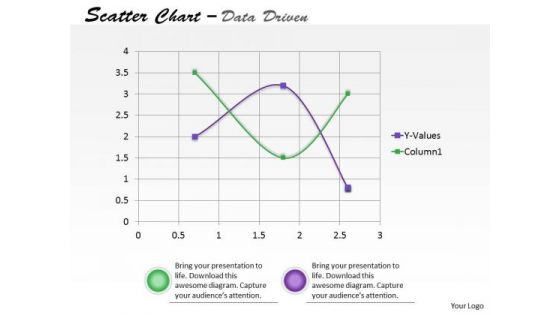
Data Analysis On Excel Driven Scatter Chart To Predict Future Movements PowerPoint Slides Templates
Our data analysis on excel driven scatter chart to predict future movements powerpoint slides Templates Enjoy Drama. They Provide Entertaining Backdrops.
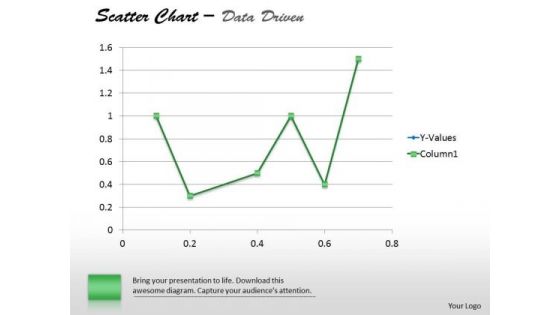
Financial Data Analysis Driven Demonstrate Statistics With Scatter Chart PowerPoint Slides Templates
Establish The Dominance Of Your Ideas. Our financial data analysis driven demonstrate statistics with scatter chart powerpoint slides Templates Will Put Them On Top.
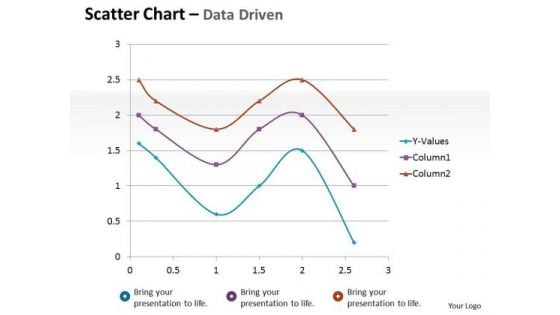
Financial Data Analysis Driven Scatter Chart Mathematical Diagram PowerPoint Slides Templates
Dominate Proceedings With Your Ideas. Our financial data analysis driven scatter chart mathematical diagram powerpoint slides Templates Will Empower Your Thoughts.
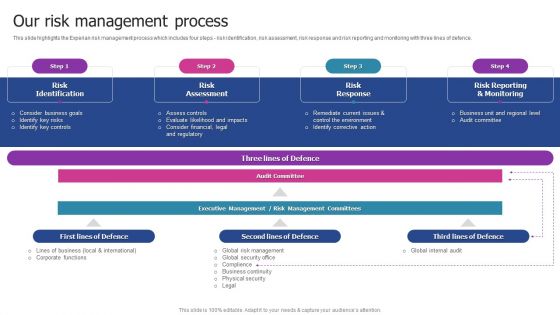
Experian Company Outline Our Risk Management Process Mockup PDF
This slide highlights the Experian risk management process which includes four steps risk identification, risk assessment, risk response and risk reporting and monitoring with three lines of defence. Welcome to our selection of the Experian Company Outline Our Risk Management Process Mockup PDF. These are designed to help you showcase your creativity and bring your sphere to life. Planning and Innovation are essential for any business that is just starting out. This collection contains the designs that you need for your everyday presentations. All of our PowerPoints are 100 percent editable, so you can customize them to suit your needs. This multi purpose template can be used in various situations. Grab these presentation templates today.
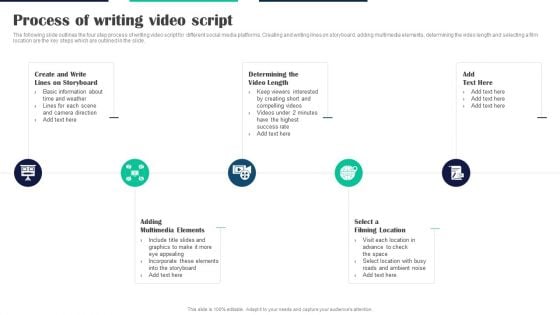
Executing Video Promotional Process Of Writing Video Script Sample PDF
The following slide outlines the four step process of writing video script for different social media platforms. Creating and writing lines on storyboard, adding multimedia elements, determining the video length and selecting a film location are the key steps which are outlined in the slide. Slidegeeks has constructed Executing Video Promotional Process Of Writing Video Script Sample PDF after conducting extensive research and examination. These presentation templates are constantly being generated and modified based on user preferences and critiques from editors. Here, you will find the most attractive templates for a range of purposes while taking into account ratings and remarks from users regarding the content. This is an excellent jumping-off point to explore our content and will give new users an insight into our top-notch PowerPoint Templates.
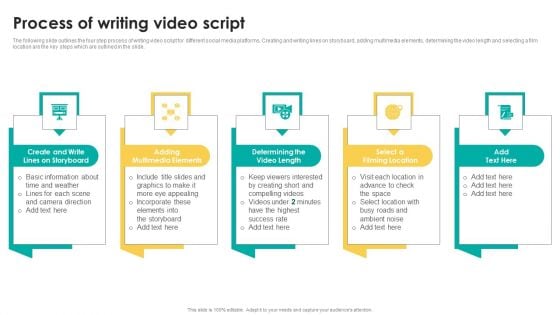
Process Of Writing Video Script Information PDF
The following slide outlines the four step process of writing video script for different social media platforms. Creating and writing lines on storyboard, adding multimedia elements, determining the video length and selecting a film location are the key steps which are outlined in the slide. Slidegeeks is here to make your presentations a breeze with Process Of Writing Video Script Information PDF With our easy to use and customizable templates, you can focus on delivering your ideas rather than worrying about formatting. With a variety of designs to choose from, you are sure to find one that suits your needs. And with animations and unique photos, illustrations, and fonts, you can make your presentation pop. So whether you are giving a sales pitch or presenting to the board, make sure to check out Slidegeeks first.
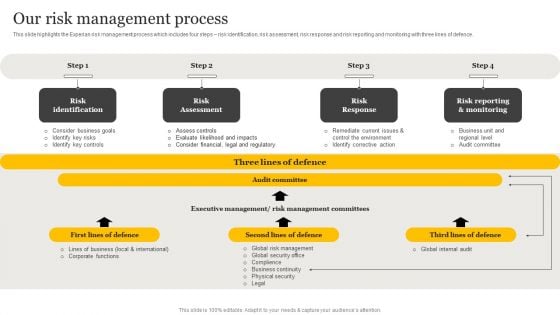
Customer Credit Reporting Company Outline Our Risk Management Process Summary PDF
This slide highlights the Experian risk management process which includes four steps risk identification, risk assessment, risk response and risk reporting and monitoring with three lines of defence. This modern and well arranged Customer Credit Reporting Company Outline Our Risk Management Process Summary PDF provides lots of creative possibilities. It is very simple to customize and edit with the Powerpoint Software. Just drag and drop your pictures into the shapes. All facets of this template can be edited with Powerpoint no extra software is necessary. Add your own material, put your images in the places assigned for them, adjust the colors, and then you can show your slides to the world, with an animated slide included.
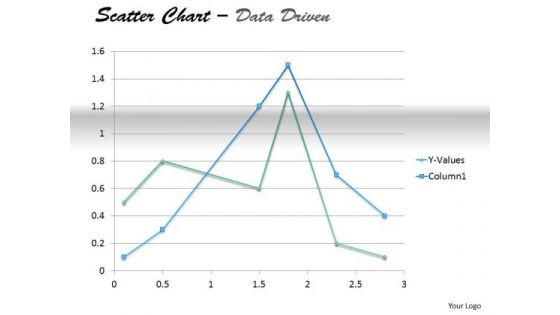
Examples Of Data Analysis Market Driven Present In Scatter Chart PowerPoint Slides Templates
Your Thoughts Will Take To Our examples of data analysis market driven present in scatter chart powerpoint slides Templates Like A Duck To Water. They Develop A Binding Affinity.

COVID 19 Risk Analysis Mitigation Policies Ocean Liner Sector Determining Impact Of Social Distancing On Cruise Industry Clipart PDF
This slide provides the major impact of social distancing on cruise industry. Key impacts include increase in customer cost, increase in the companys cost, cash crunch etc. This is a covid 19 risk analysis mitigation policies ocean liner sector determining impact of social distancing on cruise industry clipart pdf template with various stages. Focus and dispense information on three stages using this creative set, that comes with editable features. It contains large content boxes to add your information on topics like increase in customer costs, change in design will further increase the companys cost, cruise lines are burning through cash. You can also showcase facts, figures, and other relevant content using this PPT layout. Grab it now.
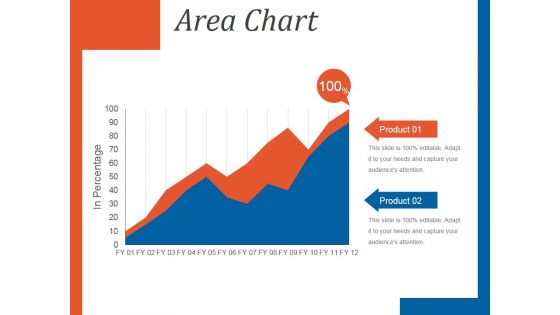
Area Chart Ppt PowerPoint Presentation Diagrams
This is a area chart ppt powerpoint presentation diagrams.This is a two stage process. The stages in this process are in percentage, area chart, product.
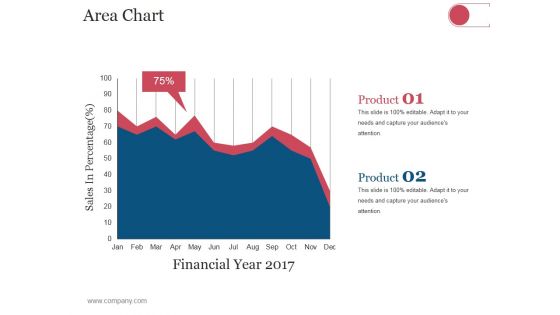
Area Chart Ppt PowerPoint Presentation Professional Infographics
This is a area chart ppt powerpoint presentation professional infographics. This is a two stage process. The stages in this process are business, strategy, analysis, planning, area chart.
Area Chart Ppt PowerPoint Presentation Icon Microsoft
This is a area chart ppt powerpoint presentation icon microsoft. This is a two stage process. The stages in this process are business, strategy, analysis, planning, area chart.


 Continue with Email

 Home
Home


