Marketing Dashboard
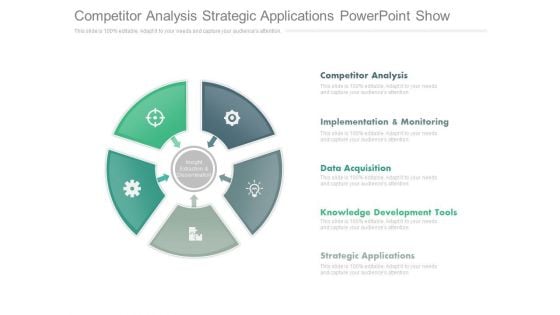
Competitor Analysis Strategic Applications Powerpoint Show
This is a competitor analysis strategic applications powerpoint show. This is a five stage process. The stages in this process are competitor analysis, implementation & monitoring, data acquisition, knowledge development tools, strategic applications.
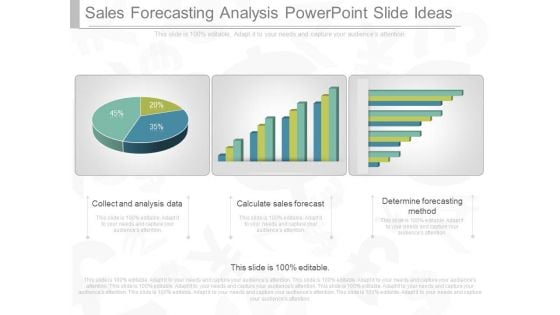
Sales Forecasting Analysis Powerpoint Slide Ideas
This is a sales forecasting analysis powerpoint slide ideas. This is a three stage process. The stages in this process are collect and analysis data, calculate sales forecast, determine forecasting method.
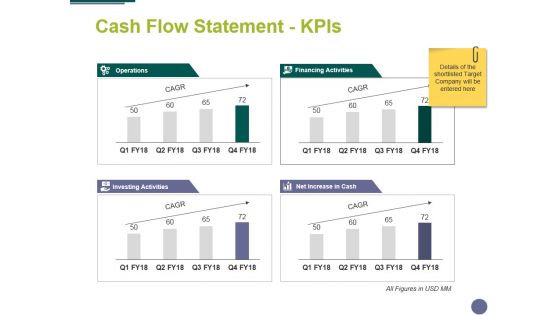
Cash Flow Statement Kpis Ppt PowerPoint Presentation File Styles
This is a cash flow statement kpis ppt powerpoint presentation file styles. This is a four stage process. The stages in this process are management, business, marketing, compere, strategy.
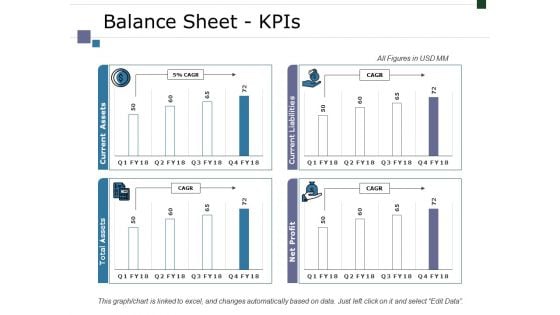
Balance Sheet Kpis Ppt PowerPoint Presentation Infographic Template Designs
This is a balance sheet kpis ppt powerpoint presentation infographic template designs. This is a four stage process. The stages in this process are business, marketing, finance, graph, strategy.
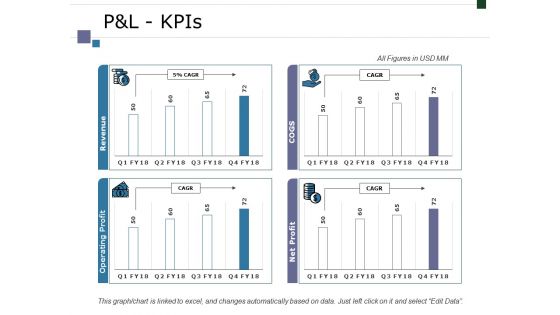
Pandl Kpis Ppt PowerPoint Presentation Infographic Template Graphics Tutorials
This is a pandl kpis ppt powerpoint presentation infographic template graphics tutorials. This is a four stage process. The stages in this process are business, marketing, finance, graph, strategy.
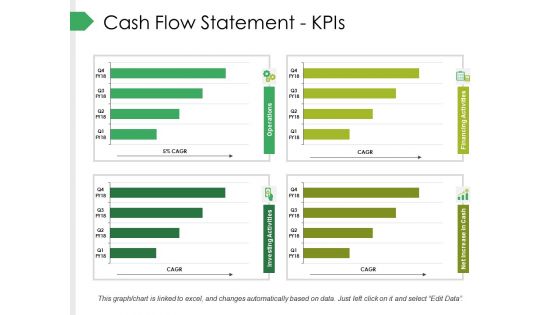
Cash Flow Statement Kpis Ppt PowerPoint Presentation Pictures Graphics
This is a cash flow statement kpis ppt powerpoint presentation pictures graphics. This is a four stage process. The stages in this process are business, marketing, graph, finance, strategy.
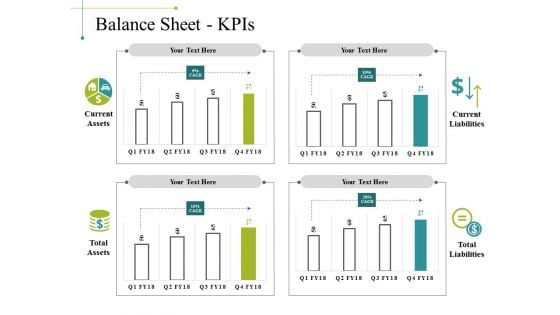
Balance Sheet Kpis Template 1 Ppt PowerPoint Presentation Show Inspiration
This is a balance sheet kpis template 1 ppt powerpoint presentation show inspiration. This is a four stage process. The stages in this process are business, marketing, graph, current liabilities, total liabilities.
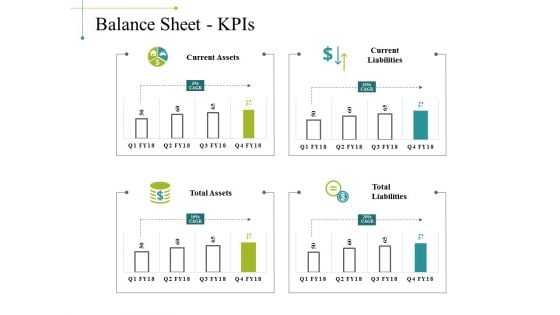
Balance Sheet Kpis Template 2 Ppt PowerPoint Presentation Gallery Example
This is a balance sheet kpis template 2 ppt powerpoint presentation gallery example. This is a four stage process. The stages in this process are business, marketing, graph, current liabilities, total liabilities.
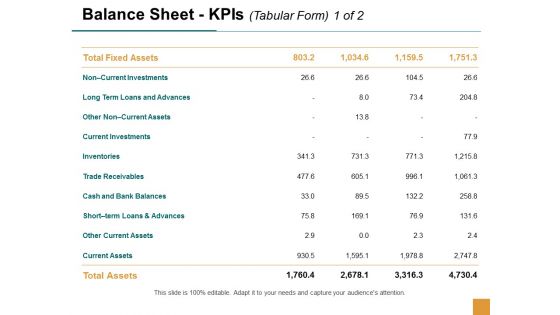
Balance Sheet Kpis Current Investments Ppt Powerpoint Presentation Professional Deck
This is a balance sheet kpis current investments ppt powerpoint presentation professional deck. This is a four stage process. The stages in this process are business, management, planning, strategy, marketing.
Balance Sheet Kpis Trade Payables Ppt Powerpoint Presentation Gallery Icon
This is a balance sheet kpis trade payables ppt powerpoint presentation gallery icon. This is a four stage process. The stages in this process are finance, marketing, management, investment, analysis.
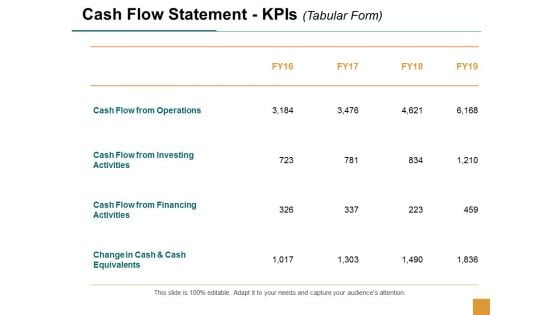
Cash Flow Statement Kpis Business Ppt Powerpoint Presentation Infographics Demonstration
This is a cash flow statement kpis business ppt powerpoint presentation infographics demonstration. This is a four stage process. The stages in this process are business, management, planning, strategy, marketing.
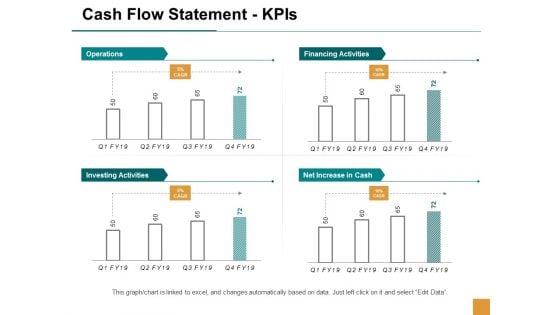
Cash Flow Statement Kpis Ppt Powerpoint Presentation Styles Graphics Tutorials
This is a cash flow statement kpis ppt powerpoint presentation styles graphics tutorials. This is a four stage process. The stages in this process are finance, marketing, management, investment, analysis.
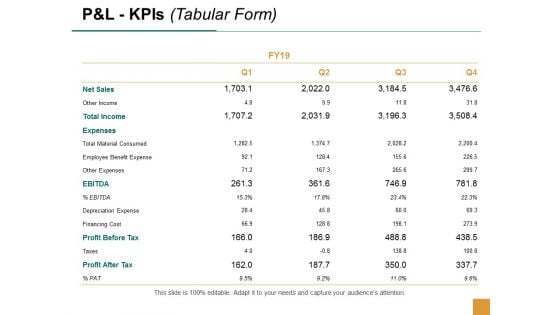
P And L Kpis Expenses Ppt Powerpoint Presentation Gallery Layouts
This is a p and l kpis expenses ppt powerpoint presentation gallery layouts. This is a four stage process. The stages in this process are business, management, planning, strategy, marketing.
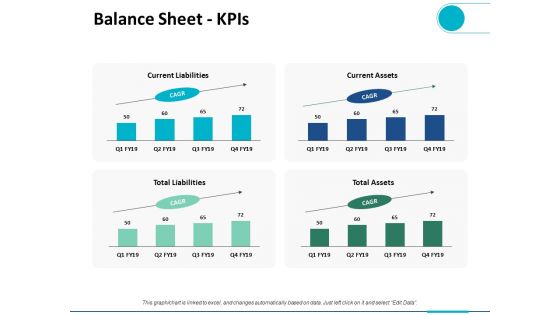
Balance Sheet Kpis Ppt PowerPoint Presentation Summary Gridlines
This is a balance sheet kpis ppt powerpoint presentation summary gridlines. This is a four stage process. The stages in this process are current liabilities, trade payables, marketing, planning, strategy.

Cash Flow Statement Kpis Ppt PowerPoint Presentation Gallery Vector
This is a cash flow statement kpis ppt powerpoint presentation gallery vector. This is a four stage process. The stages in this process are business, planning, strategy, marketing, management.
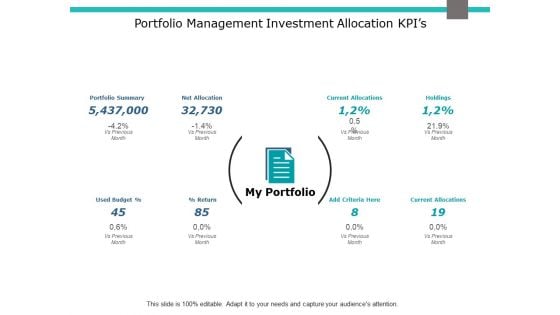
Portfolio Management Investment Allocation Kpis Ppt PowerPoint Presentation Gallery Slide
This is a portfolio management investment allocation kpis ppt powerpoint presentation gallery slide. This is a eight stage process. The stages in this process are business, management, marketing, agenda.
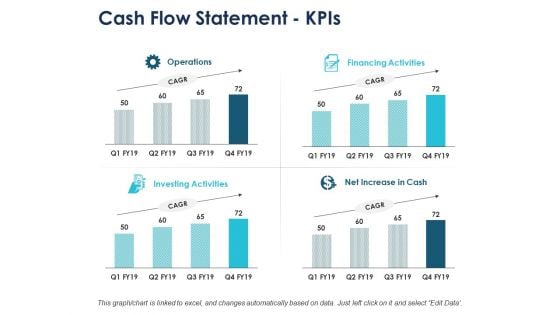
Cash Flow Statement Kpis Business Ppt PowerPoint Presentation Gallery Introduction
This is a cash flow statement kpis business ppt powerpoint presentation gallery introduction. This is a four stage process. The stages in this process are compare, marketing, business, management, planning.
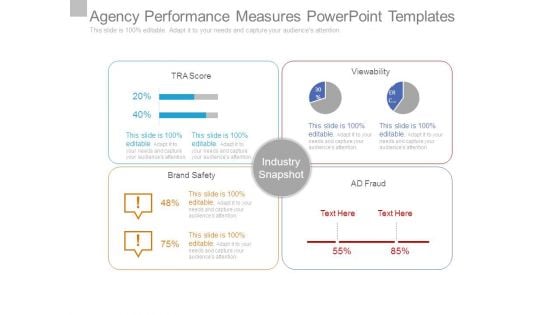
Agency Performance Measures Powerpoint Templates
This is a agency performance measures powerpoint templates. This is a four stage process. The stages in this process are industry snapshot, brand safety, ad fraud, viewability, tra score.
Survey On Agency Performance Ppt Example File
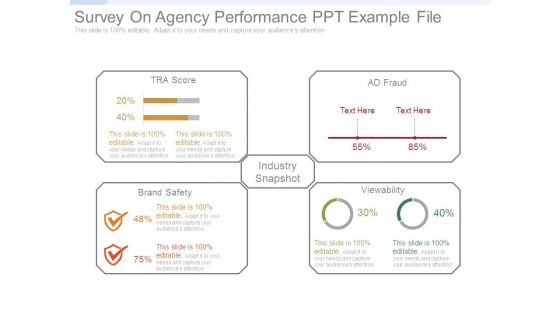
This is a survey on agency performance ppt example file. This is a four stage process. The stages in this process are industry snapshot, brand safety, ad fraud, viewability, tra score.
Ways To Assess Agency Performance Powerpoint Slide Deck Samples
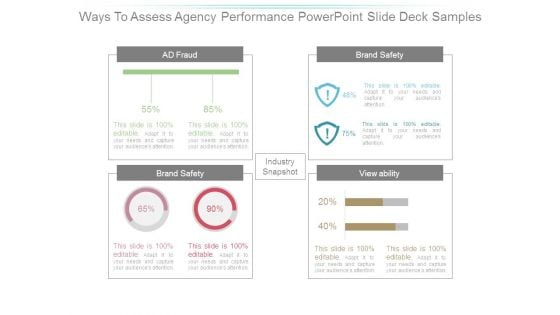
This is a ways to assess agency performance powerpoint slide deck samples. This is a four stage process. The stages in this process are industry snapshot, brand safety, ad fraud, viewability, tra score.
Agency Performance And Accountability Powerpoint Show
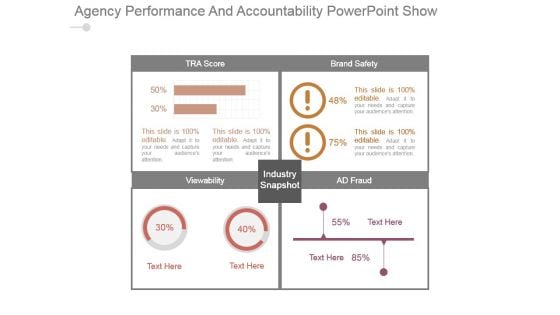
This is a agency performance and accountability powerpoint show. This is a four stage process. The stages in this process are tra score, brand safety, view ability, ad fraud, industry snapshot.
Company Performance Example Of Ppt Presentation
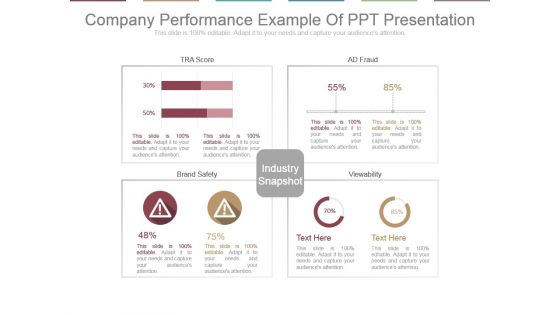
This is a company performance example of ppt presentation. This is a four stage process. The stages in this process are tra score, ad fraud, brand safety, view ability, industry snapshot.
Agency Performance Slide2 Ppt PowerPoint Presentation Deck
This is a agency performance slide2 ppt powerpoint presentation deck. This is a four stage process. The stages in this process are tra store, ad fraud, brand safety, industry snapshot, viewability.
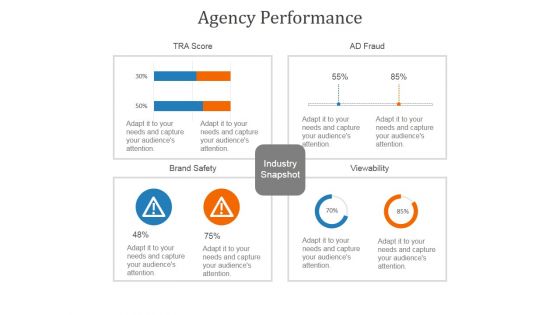
Agency Performance Template 2 Ppt PowerPoint Presentation Background Images
This is a agency performance template 2 ppt powerpoint presentation background images. This is a four stage process. The stages in this process are brand safety, viewability, industry snapshot.
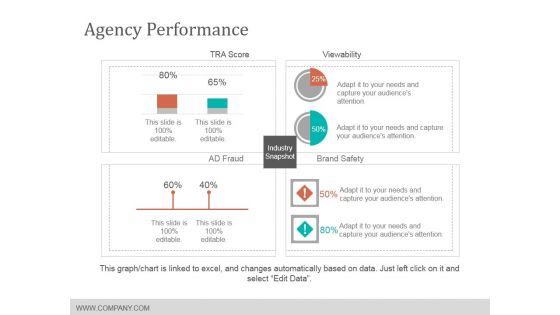
Agency Performance Template 2 Ppt Powerpoint Presentation Slides Designs
This is a agency performance template 2 ppt powerpoint presentation slides designs. This is a four stage process. The stages in this process are tra score, viewability, brand safety, industry snapshot.
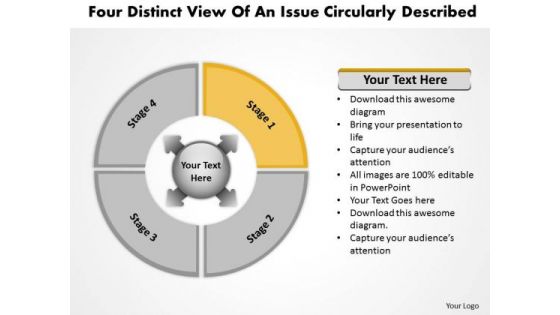
Distinct View Of An Issue Circularly Described Diagram PowerPoint Templates
We present our distinct view of an issue circularly described Diagram PowerPoint templates.Download our Process and flows PowerPoint Templates because it helps to churn the mixture to the right degree and pound home your views and expectations in a spectacularly grand and virtuoso fluid performance. Download and present our Arrows PowerPoint Templates because the plans are in your head, stage by stage, year by year. Download our Marketing PowerPoint Templates because you can put down your ideas and present them using our innovative templates. Present our Shapes PowerPoint Templates because the lessons have been analyzed, studied and conclusions drawn. Download our Signs PowerPoint Templates because this helps you to comprehend your plan to get the entire act together.Use these PowerPoint slides for presentations relating to Arrow, art, blank, blue, business, chart,circular,clipart, colorful, corporate, curving, cycle,diagram, directional, financial, flow,graph, graphic, red, illustration,infographic, modern, pie, process, round, segments, four, shape, slices, stages, steps. The prominent colors used in the PowerPoint template are Red, Black, White. People tell us our distinct view of an issue circularly described Diagram PowerPoint templates are Fun. Professionals tell us our blank PowerPoint templates and PPT Slides are Exuberant. We assure you our distinct view of an issue circularly described Diagram PowerPoint templates are Magnificent. PowerPoint presentation experts tell us our colorful PowerPoint templates and PPT Slides are Bold. We assure you our distinct view of an issue circularly described Diagram PowerPoint templates are Stunning. People tell us our blank PowerPoint templates and PPT Slides are Sparkling. Get the action going for you with our Distinct View Of An Issue Circularly Described Diagram PowerPoint Templates. Execute your plans to perfection.
Challenges Of Big Data In Telecom Industry Ppt PowerPoint Presentation Show Model PDF
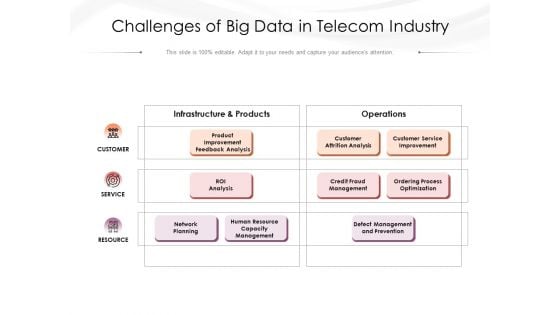
Presenting this set of slides with name challenges of big data in telecom industry ppt powerpoint presentation show model pdf. This is a three stage process. The stages in this process are infrastructure and products, operations, product improvement feedback analysis, customer attrition analysis, customer service improvement, roi analysis, credit fraud management, ordering process optimization, network planning, human resource capacity management, defect management and prevention, customer, service, resource. This is a completely editable PowerPoint presentation and is available for immediate download. Download now and impress your audience.
Key Metrics Ppt PowerPoint Presentation Model Professional
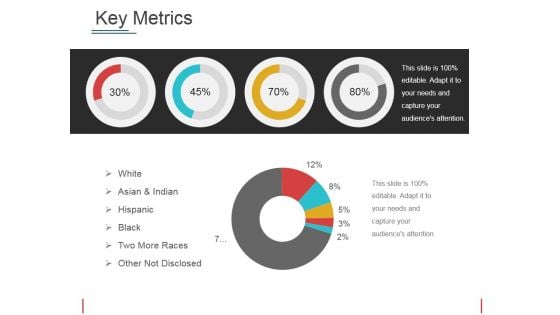
This is a key metrics ppt powerpoint presentation model professional. This is a four stage process. The stages in this process are white, asian and indian, hispanic, black, two more races, other not disclosed.
Key Metrics Ppt PowerPoint Presentation Layouts Good
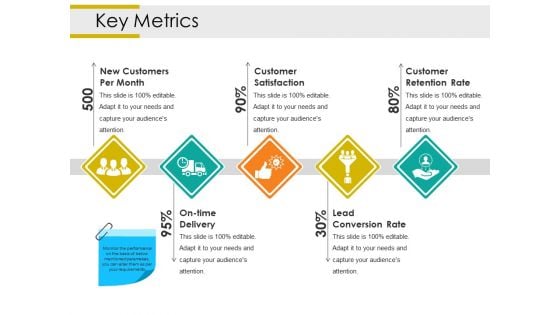
This is a key metrics ppt powerpoint presentation layouts good. This is a five stage process. The stages in this process are new customers per month, customer satisfaction, customer retention rate, lead conversion rate, on time delivery.
Key Metrics Ppt PowerPoint Presentation Themes
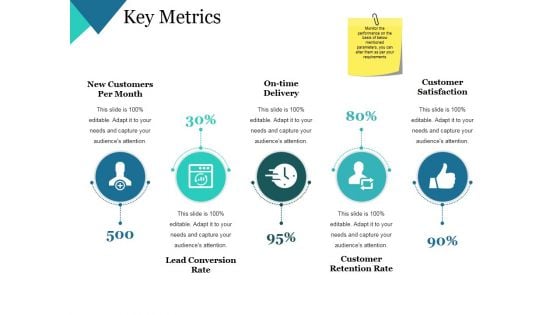
This is a key metrics ppt powerpoint presentation themes. This is a five stage process. The stages in this process are new customers per month, on time delivery, customer satisfaction, customer retention rate, lead conversion rate.
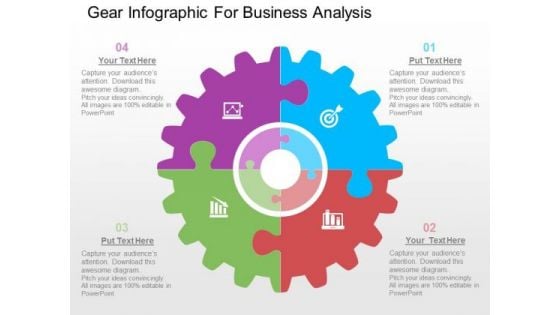
Gear Infographic For Business Analysis PowerPoint Templates
Our above slide contains diagram of gear infographic. This gear infographic slide helps to exhibit business analysis. Use this diagram to impart more clarity to data and to create more sound impact on viewers.
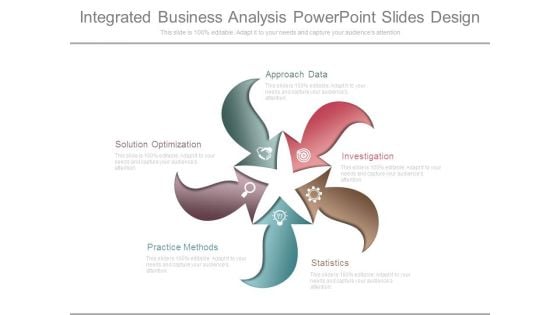
Integrated Business Analysis Powerpoint Slides Design
This is a integrated business analysis powerpoint slides design. This is a five stage process. The stages in this process are approach data, investigation, statistics, practice methods, solution optimization.
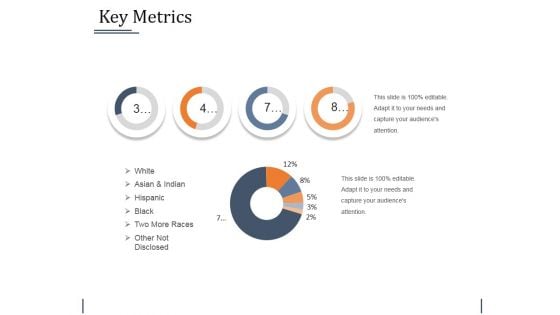
Key Metrics Ppt PowerPoint Presentation Outline Templates
This is a key metrics ppt powerpoint presentation outline templates. This is a four stage process. The stages in this process are white, asian and indian, hispanic, black, two more races, other not disclosed.
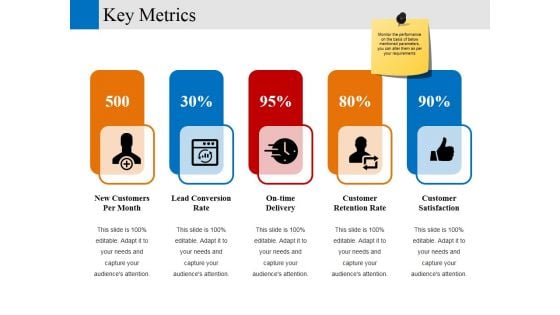
Key Metrics Ppt PowerPoint Presentation Layouts Ideas
This is a key metrics ppt powerpoint presentation layouts ideas. This is a five stage process. The stages in this process are new customers per month, lead conversion rate, on time delivery, customer retention rate, customer satisfaction.
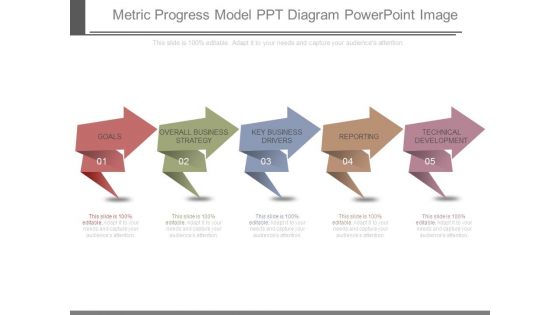
Metric Progress Model Ppt Diagram Powerpoint Image
This is a metric progress model ppt diagram powerpoint image. This is a five stage process. The stages in this process are goals, overall business strategy, key business drivers, reporting, technical development.
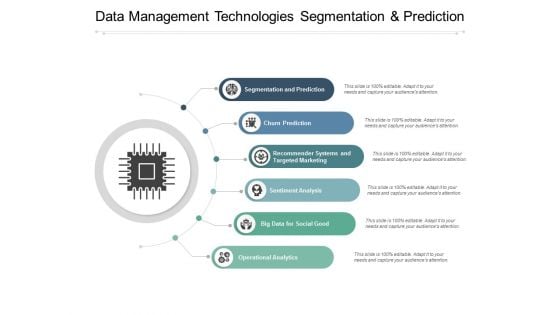
Data Management Technologies Segmentation And Prediction Ppt PowerPoint Presentation Professional Show
Presenting this set of slides with name data management technologies segmentation and prediction ppt powerpoint presentation professional show. This is a six stage process. The stages in this process are big data analysis, data management, technologies segmentation. This is a completely editable PowerPoint presentation and is available for immediate download. Download now and impress your audience.
Data Transfer Cloud Computing Vector Icon Ppt PowerPoint Presentation Layouts Graphics
Presenting this set of slides with name data transfer cloud computing vector icon ppt powerpoint presentation layouts graphics. This is a one stage process. The stages in this process are big data analysis, data management, technologies segmentation. This is a completely editable PowerPoint presentation and is available for immediate download. Download now and impress your audience.
Eight Ways To Collect Data With Icons Ppt PowerPoint Presentation Slides Influencers
Presenting this set of slides with name eight ways to collect data with icons ppt powerpoint presentation slides influencers. This is a eight stage process. The stages in this process are big data analysis, data management, technologies segmentation. This is a completely editable PowerPoint presentation and is available for immediate download. Download now and impress your audience.

Internet Of Things Related To Data Science Ppt PowerPoint Presentation Gallery Ideas
Presenting this set of slides with name internet of things related to data science ppt powerpoint presentation gallery ideas. This is a six stage process. The stages in this process are big data analysis, data management, technologies segmentation. This is a completely editable PowerPoint presentation and is available for immediate download. Download now and impress your audience.
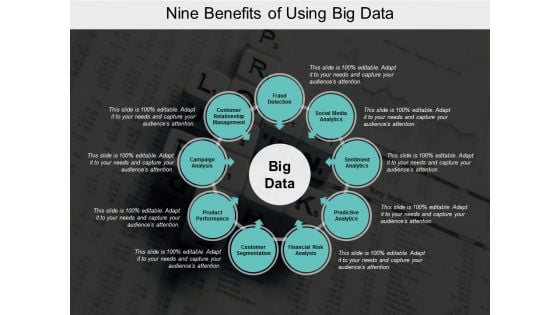
Nine Benefits Of Using Big Data Ppt PowerPoint Presentation Gallery Summary
Presenting this set of slides with name nine benefits of using big data ppt powerpoint presentation gallery summary. This is a nine stage process. The stages in this process are big data analysis, data management, technologies segmentation. This is a completely editable PowerPoint presentation and is available for immediate download. Download now and impress your audience.
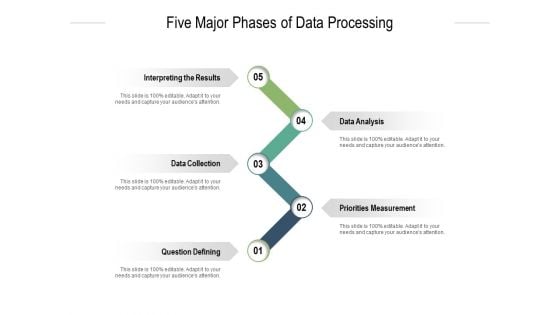
Five Major Phases Of Data Processing Ppt PowerPoint Presentation Slides File Formats
Presenting this set of slides with name five major phases of data processing ppt powerpoint presentation slides file formats. This is a five stage process. The stages in this process are interpreting the results, data collection, data analysis, question defining, priorities measurement. This is a completely editable PowerPoint presentation and is available for immediate download. Download now and impress your audience.
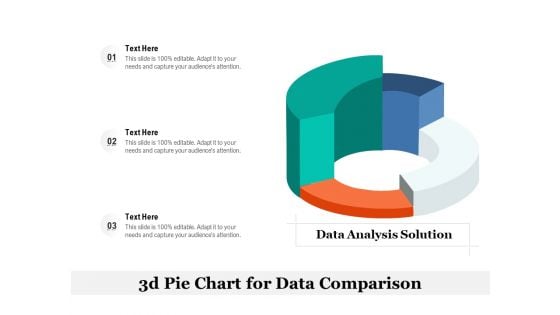
3D Pie Chart For Data Comparison Ppt Infographic Template Vector PDF
Presenting 3d pie chart for data comparison ppt infographic template vector pdf. to dispense important information. This template comprises three stages. It also presents valuable insights into the topics including data analysis solution, 3d pie chart for data comparison. This is a completely customizable PowerPoint theme that can be put to use immediately. So, download it and address the topic impactfully.
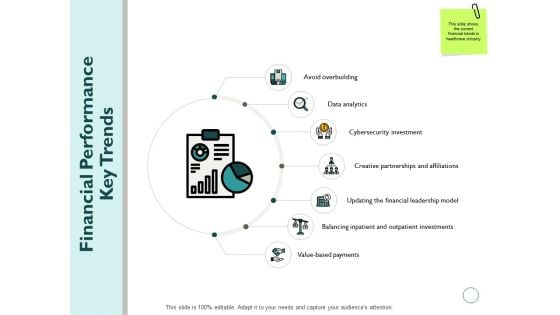
Financial Performance Key Trends Ppt PowerPoint Presentation Outline Ideas
Presenting this set of slides with name financial performance key trends ppt powerpoint presentation outline ideas. This is a seven stage process. The stages in this process are data analytics, cybersecurity investment, financial, leadership, management. This is a completely editable PowerPoint presentation and is available for immediate download. Download now and impress your audience.
Robotics Technology Trends Ppt PowerPoint Presentation Icon Example
Presenting this set of slides with name robotics technology trends ppt powerpoint presentation icon example. This is a four stage process. The stages in this process are generation technology, big data analytics, technology. This is a completely editable PowerPoint presentation and is available for immediate download. Download now and impress your audience.
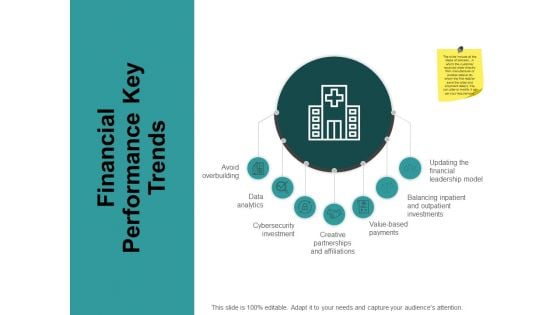
Financial Performance Key Trends Ppt PowerPoint Presentation Slides Deck
Presenting this set of slides with name financial performance key trends ppt powerpoint presentation slides deck. This is a seven stage process. The stages in this process are avoid overbuilding, data analytics, cybersecurity investment, balancing inpatient, affiliations. This is a completely editable PowerPoint presentation and is available for immediate download. Download now and impress your audience.
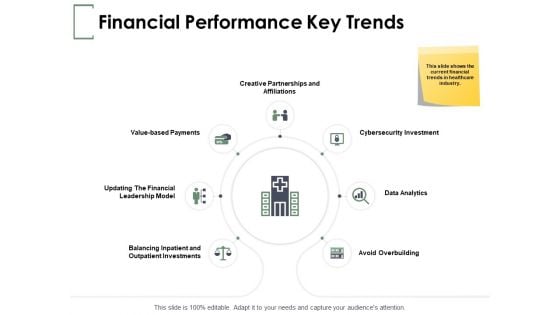
Financial Performance Key Trends Ppt PowerPoint Presentation Pictures Graphic Tips
Presenting this set of slides with name financial performance key trends ppt powerpoint presentation pictures graphic tips. This is a seven stage process. The stages in this process are affiliations, financial, investments, avoid overbuilding, data analytics. This is a completely editable PowerPoint presentation and is available for immediate download. Download now and impress your audience.
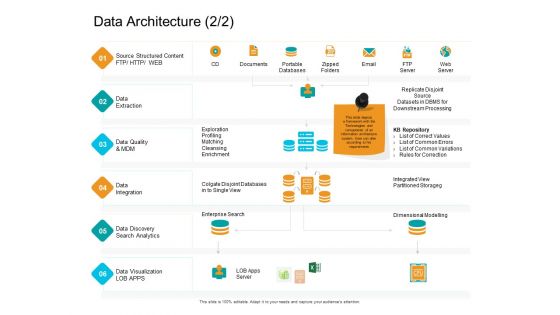
Facts Assessment Data Architecture Analytics Ppt PowerPoint Presentation Professional Templates PDF
Presenting this set of slides with name facts assessment data architecture analytics ppt powerpoint presentation professional templates pdf. This is a one stage process. The stages in this process are data extraction, data quality and mdm, data integration, enterprise search, data discovery search analytics. This is a completely editable PowerPoint presentation and is available for immediate download. Download now and impress your audience.
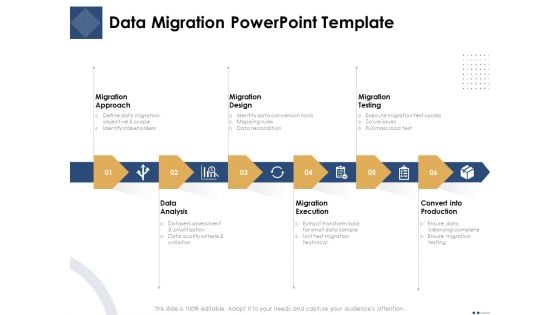
Introducing And Implementing Approaches Within The Business Data Migration PowerPoint Template Sample PDF
Presenting this set of slides with name introducing and implementing approaches within the business data migration powerpoint template sample pdf. This is a six stage process. The stages in this process are migration approach, migration design, migration testing, data analysis, migration execution, convert into production. This is a completely editable PowerPoint presentation and is available for immediate download. Download now and impress your audience.
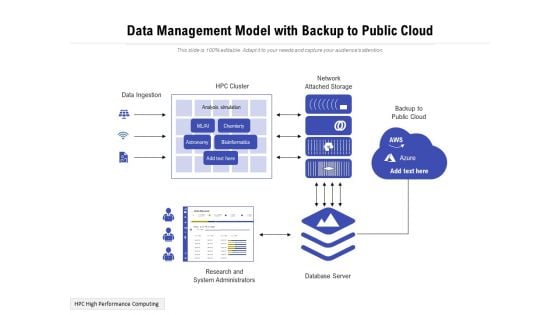
Data Management Model With Backup To Public Cloud Ppt PowerPoint Presentation Gallery Templates PDF
Presenting this set of slides with name data management model with backup to public cloud ppt powerpoint presentation gallery templates pdf. This is a one stage process. The stages in this process are data ingestion, analysis, network. This is a completely editable PowerPoint presentation and is available for immediate download. Download now and impress your audience.
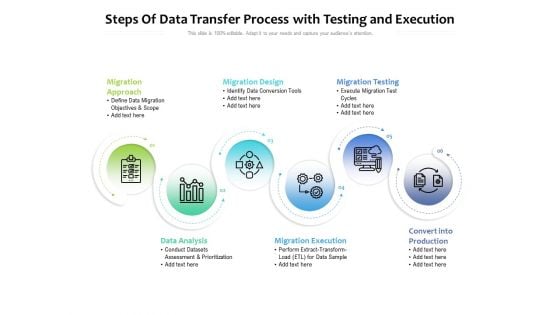
Steps Of Data Transfer Process With Testing And Execution Ppt PowerPoint Presentation File Ideas PDF
Presenting this set of slides with name steps of data transfer process with testing and execution ppt powerpoint presentation file ideas pdf. This is a six stage process. The stages in this process are migration, data analysis, execution. This is a completely editable PowerPoint presentation and is available for immediate download. Download now and impress your audience.
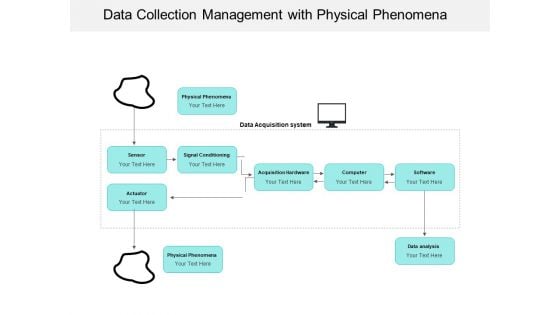
Data Collection Management With Physical Phenomena Ppt PowerPoint Presentation File Files PDF
Presenting this set of slides with name data collection management with physical phenomena ppt powerpoint presentation file files pdf. This is a one stage process. The stages in this process are sensor, actuator, data analysis. This is a completely editable PowerPoint presentation and is available for immediate download. Download now and impress your audience.
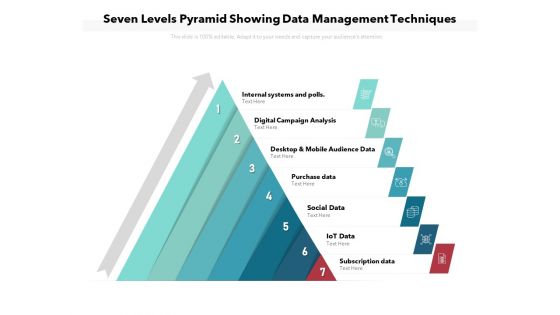
Seven Levels Pyramid Showing Data Management Techniques Ppt PowerPoint Presentation File Guide PDF
Presenting seven levels pyramid showing data management techniques ppt powerpoint presentation file guide pdf to dispense important information. This template comprises seven stages. It also presents valuable insights into the topics including analysis, social data, digital campaign. This is a completely customizable PowerPoint theme that can be put to use immediately. So, download it and address the topic impactfully.
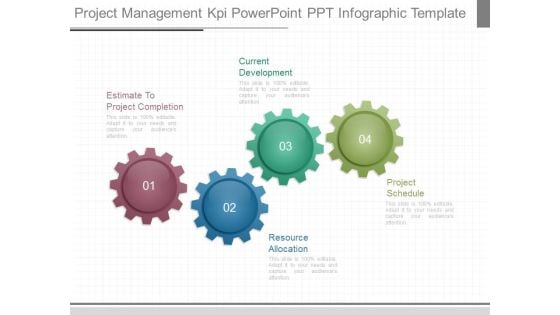
Project Management Kpi Powerpoint Ppt Infographic Template
This is a project management kpi powerpoint ppt infographic template. This is a four stage process. The stages in this process are estimate to project completion, resource allocation, current development, project schedule.
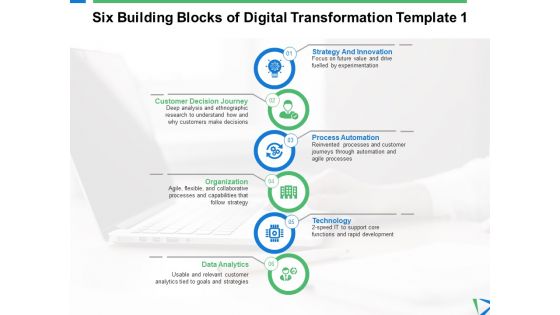
Six Building Blocks Of Digital Transformation Data Analytics Ppt PowerPoint Presentation Outline Guide
This is a six building blocks of digital transformation data analytics ppt powerpoint presentation outline guide. This is a six stage process. The stages in this process are process automation, organization, technology, data and analytics, strategy and innovation.
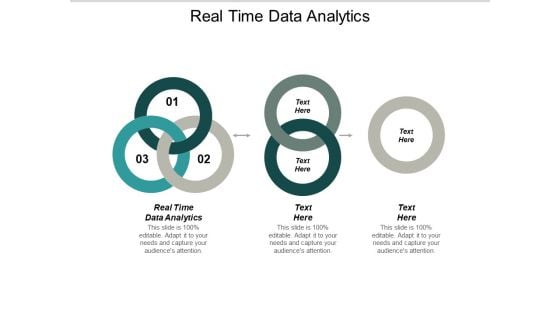
Real Time Data Analytics Ppt PowerPoint Presentation Model Background Designs Cpb
This is a real time data analytics ppt powerpoint presentation model background designs cpb. This is a three stage process. The stages in this process are real time data analytics.
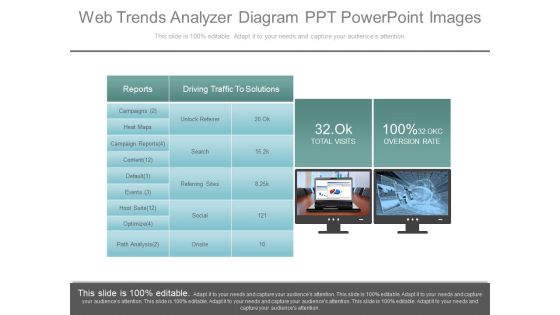
Web Trends Analyzer Diagram Ppt Powerpoint Images
This is a web trends analyzer diagram ppt powerpoint images. This is a two stage process. The stages in this process are reports, driving traffic to solutions, campaigns, heat maps, campaign reports, content, default, events, hoot suite, optimize, unlock referrer, search, referring sites, social, onsite, 32 ok total visits, 100 percent 32 okc oversion rate.
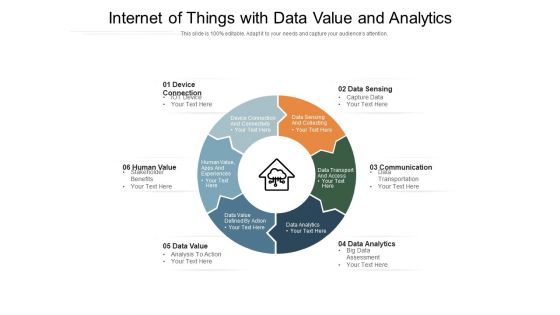
Internet Of Things With Data Value And Analytics Ppt PowerPoint Presentation Gallery Pictures PDF
Presenting this set of slides with name internet of things with data value and analytics ppt powerpoint presentation gallery pictures pdf. This is a six stage process. The stages in this process are data analytics, data value, data sensing. This is a completely editable PowerPoint presentation and is available for immediate download. Download now and impress your audience.
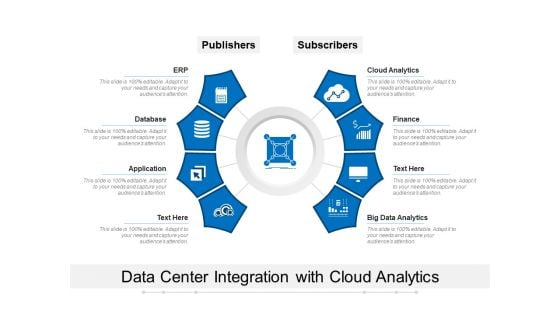
Data Center Integration With Cloud Analytics Ppt PowerPoint Presentation Slides Deck PDF
Presenting data center integration with cloud analytics ppt powerpoint presentation slides deck pdf to dispense important information. This template comprises eight stages. It also presents valuable insights into the topics including database, application, finance, big data analytics, cloud analytics, erp. This is a completely customizable PowerPoint theme that can be put to use immediately. So, download it and address the topic impactfully.
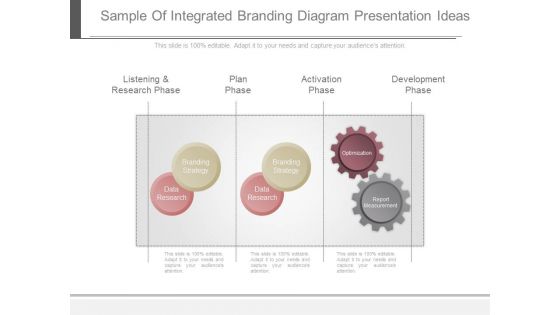
Sample Of Integrated Branding Diagram Presentation Ideas
This is a sample of integrated branding diagram presentation ideas. This is a three stage process. The stages in this process are listening and research phase, plan phase, activation phase, development phase, branding strategy, data research, optimization, report measurement.
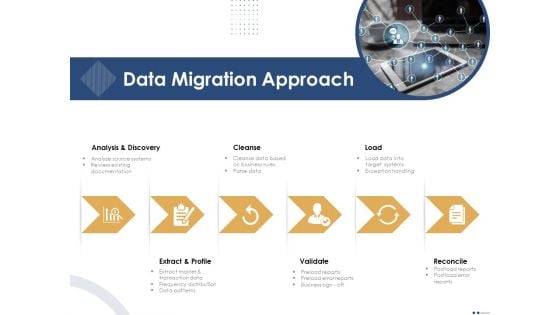
Introducing And Implementing Approaches Within The Business Data Migration Approach Themes PDF
Presenting this set of slides with name introducing and implementing approaches within the business data migration approach themes pdf. This is a six stage process. The stages in this process are analysis and discovery, cleanse, load, extract and profile, validate, reconcile. This is a completely editable PowerPoint presentation and is available for immediate download. Download now and impress your audience.


 Continue with Email

 Home
Home


