Marketing Dashboard

Ecommerce Management KPI Metrics Ppt Outline Infographics PDF
This is a ecommerce management kpi metrics ppt outline infographics pdf template with various stages. Focus and dispense information on four stages using this creative set, that comes with editable features. It contains large content boxes to add your information on topics like average order value, gross profit margin, conversation. You can also showcase facts, figures, and other relevant content using this PPT layout. Grab it now.
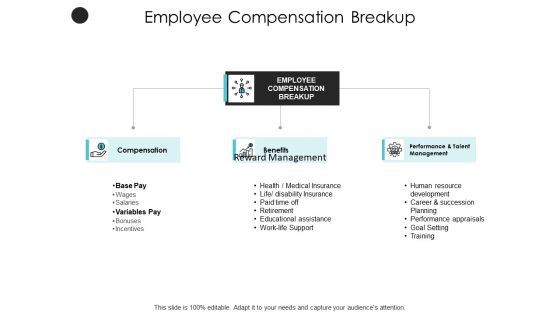
Employee Compensation Breakup Performance Ppt PowerPoint Presentation Infographics Guide
Presenting this set of slides with name employee compensation breakup performance ppt powerpoint presentation infographics guide. This is a two stage process. The stages in this process are marketing, business, management, planning, strategy. This is a completely editable PowerPoint presentation and is available for immediate download. Download now and impress your audience.
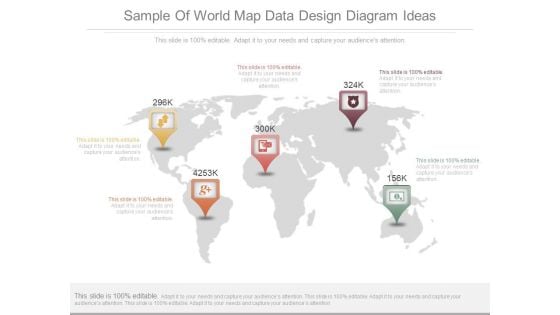
Sample Of World Map Data Design Diagram Ideas
This is a sample of world map data design diagram ideas. This is a five stage process. The stages in this process are map, location, indicator, marketing, geographical, business.

Process Safety Management Kpis Ppt Example
This is a process safety management kpis ppt example. This is a four stage process. The stages in this process are prevent major incidents, improve reliability, avoid complacency, communicate performance.
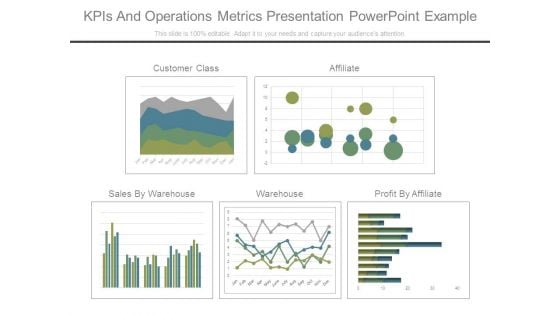
Kpis And Operations Metrics Presentation Powerpoint Example
This is a kpis and operations metrics presentation powerpoint example. This is a five stage process. The stages in this process are customer class, affiliate, sales by warehouse, warehouse, profit by affiliate.
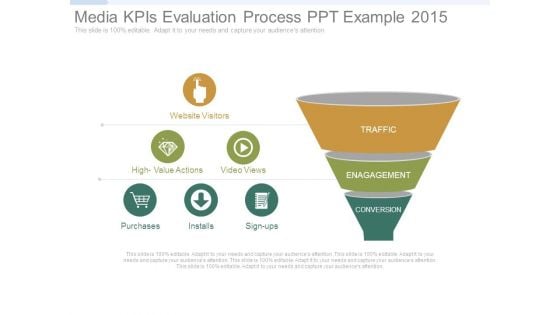
Media Kpis Evaluation Process Ppt Example 2015
This is a media kpis evaluation process ppt example 2015. This is a three stage process. The stages in this process are traffic, engagement, conversion, website visitors, high value actions, video views, purchases, installs, sign ups.
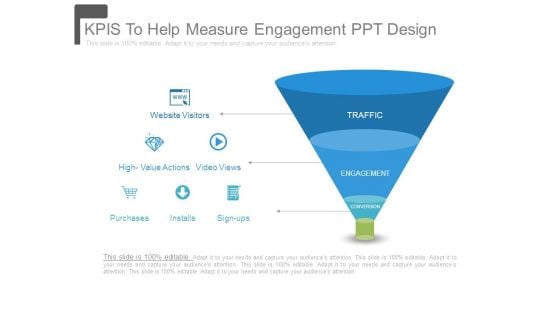
Kpis To Help Measure Engagement Ppt Design
This is a kpis to help measure engagement ppt design. This is a three stage process. The stages in this process are traffic, engagement, conversion, website visitors, high value actions, video views, purchases, installs, sign ups.
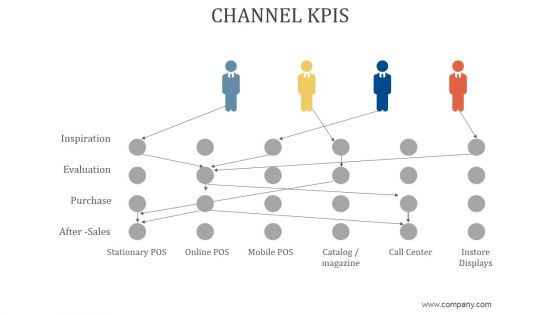
Channel Kpis Ppt PowerPoint Presentation Ideas
This is a channel kpis ppt powerpoint presentation ideas. This is a four stage process. The stages in this process are inspiration, evaluation, purchase, after sales, catalog magazine, call center, instore displays.
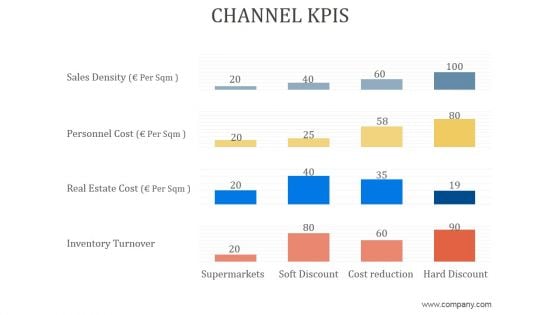
Channel Kpis Ppt PowerPoint Presentation Background Designs
This is a channel kpis ppt powerpoint presentation background designs. This is a four stage process. The stages in this process are sales density, personnel cost, real estate cost, inventory turnover, supermarkets, soft discount, cost reduction, hard discount.
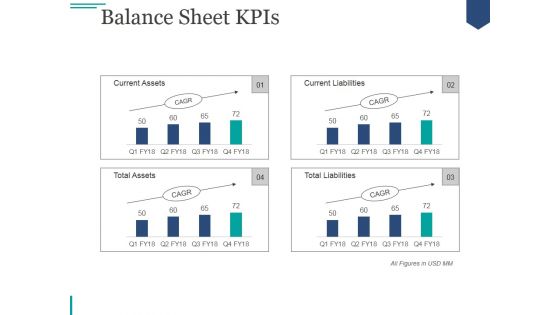
Balance Sheet Kpis Ppt PowerPoint Presentation Professional
This is a balance sheet kpis ppt powerpoint presentation professional. This is a four stage process. The stages in this process are current assets, current liabilities, total assets, total liabilities.
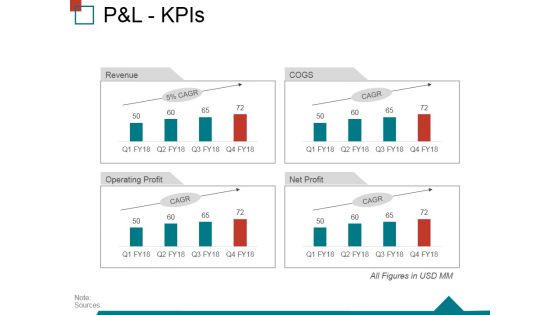
Pandl Kpis Ppt PowerPoint Presentation Outline Visuals
This is a pandl kpis ppt powerpoint presentation outline visuals. This is a four stage process. The stages in this process are other income, total income, expenses, total material consumed, other expenses.
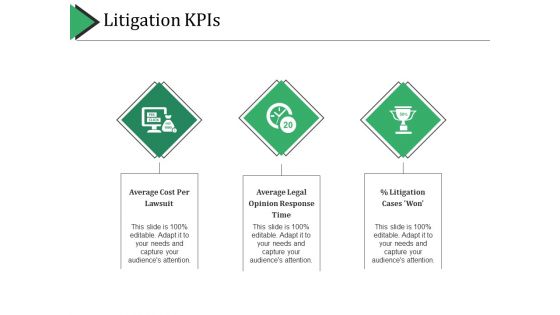
Litigation Kpis Ppt PowerPoint Presentation Styles Aids
This is a litigation kpis ppt powerpoint presentation styles aids. This is a three stage process. The stages in this process are average cost per lawsuit, average legal opinion response time.
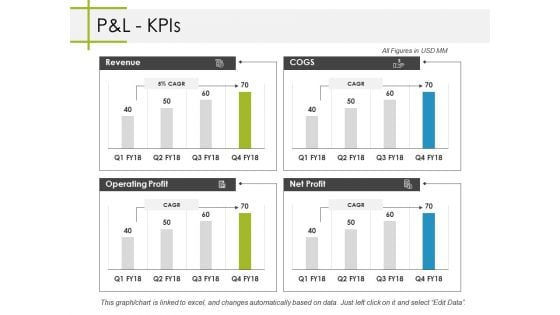
Pandl Kpis Ppt PowerPoint Presentation Professional Backgrounds
This is a pandl kpis ppt powerpoint presentation professional backgrounds. This is a four stage process. The stages in this process are business, revenue, operating profit, cogs, net profit.
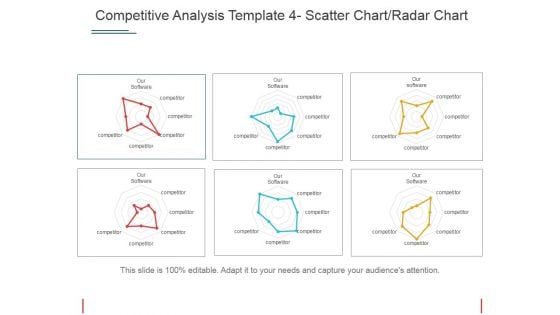
Competitive Analysis Scatter Chart Radar Chart Ppt PowerPoint Presentation Portfolio Templates
This is a competitive analysis scatter chart radar chart ppt powerpoint presentation portfolio templates. This is a eight stage process. The stages in this process are users interface, data import, example, pricing, support.
Competitive Analysis Template 6 Scatter Chart Ppt PowerPoint Presentation Icon Example Topics
This is a competitive analysis template 6 scatter chart ppt powerpoint presentation icon example topics. This is a eight stage process. The stages in this process are users interface, data import, example, pricing, support, update, tutorials, easy to use.
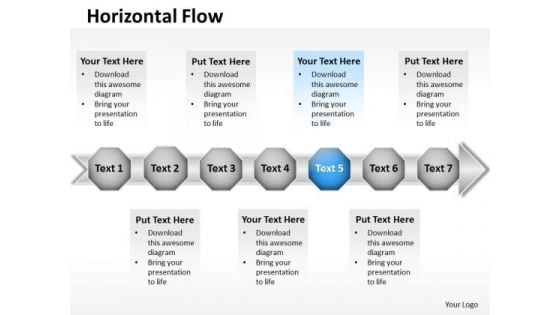
Ppt Blue Stage Business PowerPoint Templates Free Download Data Flow Diagram
PPT blue stage business PowerPoint templates free download data flow diagram-Use this sequentially based PowerPoint Diagram to represent seven different approaches combined to form a Linear Process. It portrays the concept of convert, reclaim, recondition, recover, recycle , redeem, regenerate, remodel, reoccupy, repossess, rescue, restore, retake, salvage etc.-PPT blue stage business PowerPoint templates free download data flow diagram-arrow, art, assess, blue, business, chart, chevron, clip, clipart, colorful, compliance, corporate, design, development, diagram, flow, glossy, graphic, hierarchy, icon, illustration, implement, info graphic, levels, marketing, modern, plan, process, shape, shiny, square, stages, vector Our content is a reliable partner. Team up with our Ppt Blue Stage Business PowerPoint Templates Free Download Data Flow Diagram. You'll always stay ahead of the game.
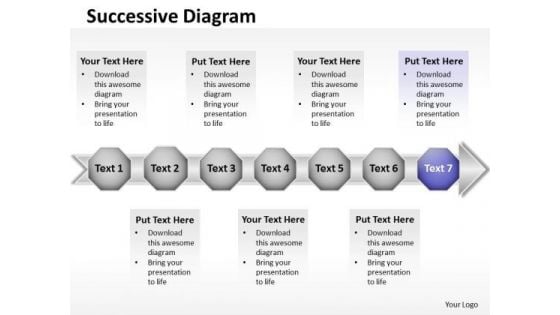
Ppt Purple Stage New Business PowerPoint Presentation Data Flow Diagram Templates
PPT purple stage new business PowerPoint presentation data flow diagram Templates-Develop competitive advantage with our above Diagram which contains a picture of seven hexagonal boxes on the arrow pointing towards the east direction. This image has been professionally designed to emphasize the concept of continuous process. Adjust the above image in your PPT presentations to visually support your content in your Business PPT slideshows.-PPT purple stage new business PowerPoint presentation data flow diagram Templates-arrow, art, assess, blue, business, chart, chevron, clip, clipart, colorful, compliance, corporate, design, development, diagram, flow, glossy, graphic, hierarchy, icon, illustration, implement, info graphic, levels, marketing, modern, plan, process, shape, shiny, square, stages, vector Subscribe to our Ppt Purple Stage New Business PowerPoint Presentation Data Flow Diagram Templates and receive success. Be assured of finding the best projection to highlight your words.
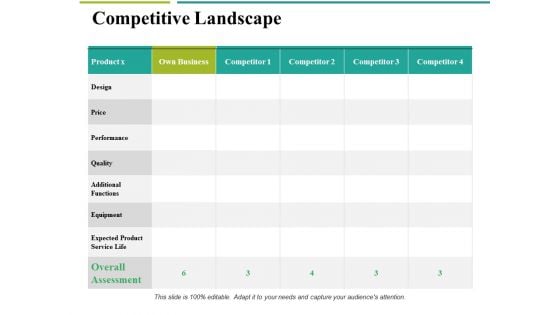
Competitive Landscape Ppt PowerPoint Presentation Infographics Outfit
This is a competitive landscape ppt powerpoint presentation infographics outfit. This is a four stage process. The stages in this process are business, marketing, design, price, performance.
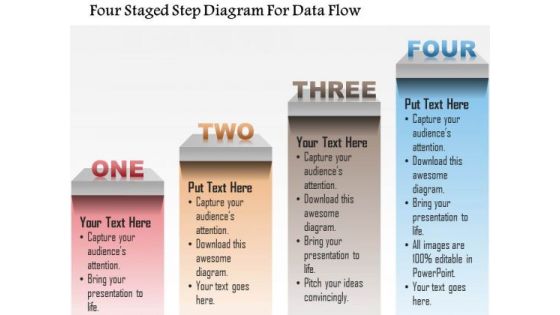
Busines Diagram Four Staged Step Diagram For Data Flow Presentation Template
This business diagram has been designed with graphic of four staged step diagram. Display the concept of data flow in any presentations by using this professional diagram.

Business Framework Big Data Cloud Storage PowerPoint Presentation 1
Explain the concept of big data storage on cloud service with this power point diagram slide. This diagram contains the graphic of big cloud and connected sub clouds in network. Use this image for data storage and data networking related presentations.
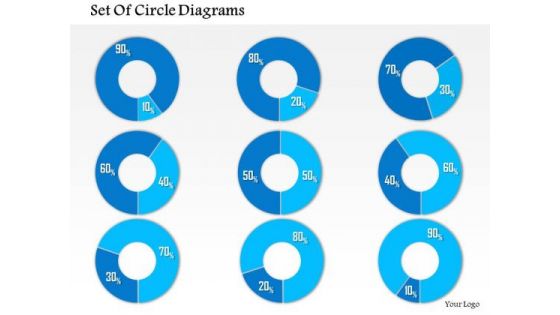
Business Framework 10 Percent To 90 Percent PowerPoint Presentation
This business diagram has been designed with graphic of multiple pie graphs. This diagram slide contains the concept of result analysis with percentage values. Use this diagram to present and compare data in an impressive manner
Big Data Processing Ppt PowerPoint Presentation Slide Download
This is a big data processing ppt powerpoint presentation slide download. This is a one stage process. The stages in this process are big data, technology, business, mind map, marketing.
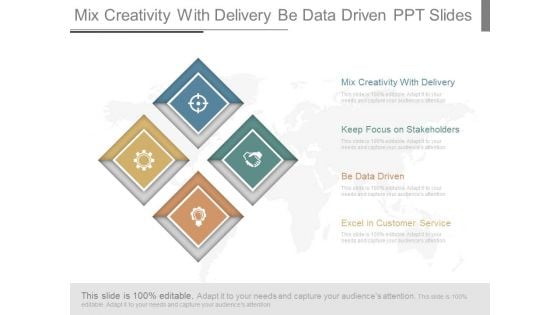
Mix Creativity With Delivery Be Data Driven Ppt Slides
This is a mix creativity with delivery be data driven ppt slides. This is a four stage process. The stages in this process are marketing, business, success, geographical.
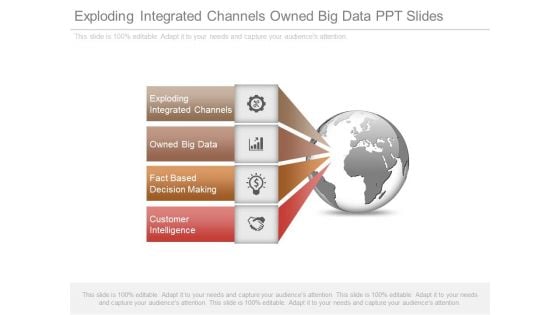
Exploding Integrated Channels Owned Big Data Ppt Slides
This is a exploding integrated channels owned big data ppt slides. This is a four stage process. The stages in this process are globe, marketing, business.
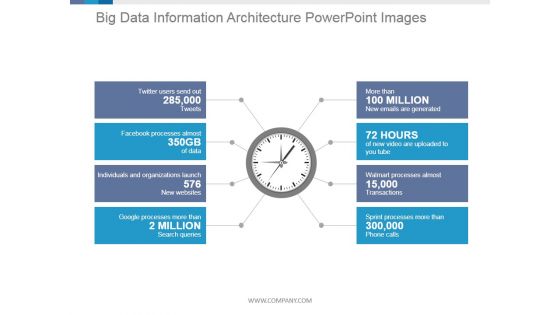
Big Data Information Architecture Ppt PowerPoint Presentation Graphics
This is a big data information architecture ppt powerpoint presentation graphics. This is a eight stage process. The stages in this process are clock, measurement, business, marketing, management.
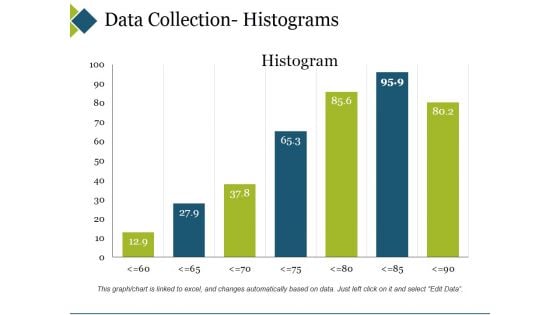
Data Collection Histograms Ppt PowerPoint Presentation Show Topics
This is a data collection histograms ppt powerpoint presentation show topics. This is a seven stage process. The stages in this process are business, marketing, histogram, finance, graph.
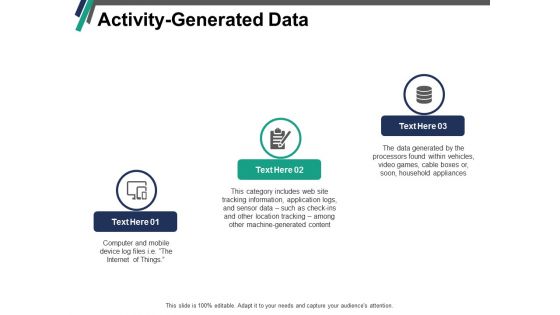
Activity Generated Data Ppt PowerPoint Presentation Summary Guide
This is a activity generated data ppt powerpoint presentation summary guide. This is a three stage process. The stages in this process are business, management, planning, strategy, marketing.
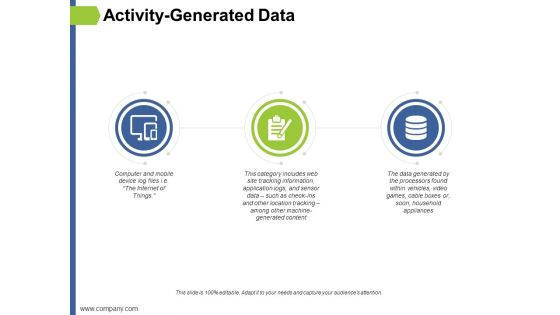
Activity Generated Data Ppt PowerPoint Presentation Portfolio Styles
This is a activity generated data ppt powerpoint presentation portfolio styles. This is a three stage process. The stages in this process are business, management, planning, strategy, marketing.
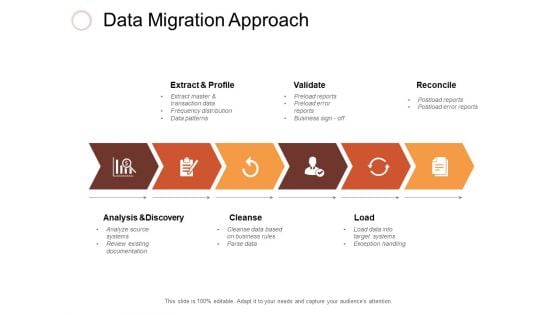
Data Migration Approach Ppt PowerPoint Presentation Inspiration Vector
This is a data migration approach ppt powerpoint presentation inspiration vector. This is a six stage process. The stages in this process are business, management, marketing.
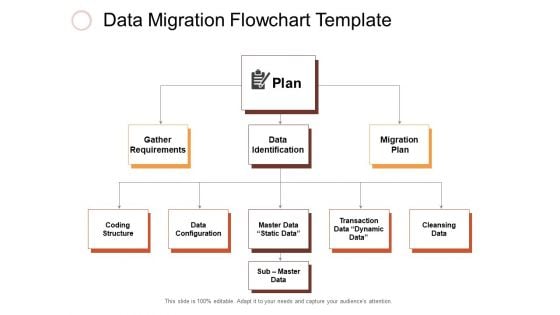
Data Migration Flowchart Template Ppt PowerPoint Presentation Inspiration Layout Ideas
This is a data migration flowchart template ppt powerpoint presentation inspiration layout ideas. This is a three stage process. The stages in this process are business, management, marketing.

Data Migration Four Step Process Ppt PowerPoint Presentation Model Guide
This is a data migration four step process ppt powerpoint presentation model guide. This is a four stage process. The stages in this process are business, management, marketing.
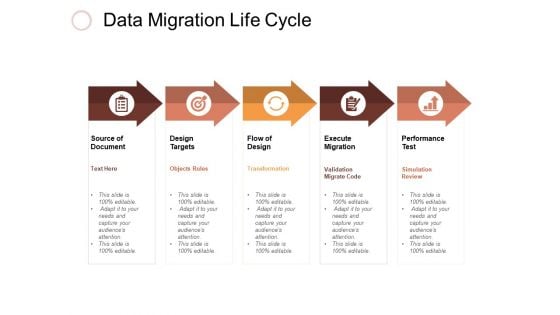
Data Migration Life Cycle Ppt PowerPoint Presentation Professional Elements
This is a data migration life cycle ppt powerpoint presentation professional elements. This is a five stage process. The stages in this process are business, management, marketing.

Data Migration On Cloud Ppt PowerPoint Presentation Shapes
This is a data migration on cloud ppt powerpoint presentation shapes. This is a six stage process. The stages in this process are business, management, marketing.

Data Migration PowerPoint Template Ppt PowerPoint Presentation Styles Example
This is a data migration powerpoint template ppt powerpoint presentation styles example. This is a six stage process. The stages in this process are business, management, marketing.
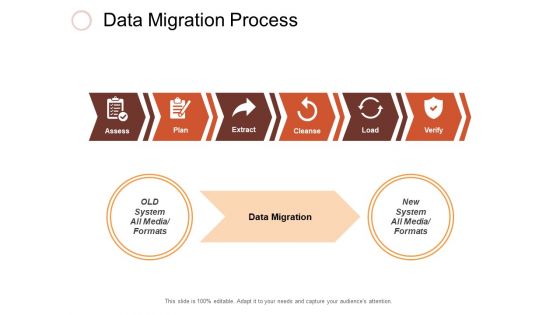
Data Migration Process Ppt PowerPoint Presentation Infographics Visual Aids
This is a data migration process ppt powerpoint presentation infographics visual aids. This is a six stage process. The stages in this process are business, management, marketing.
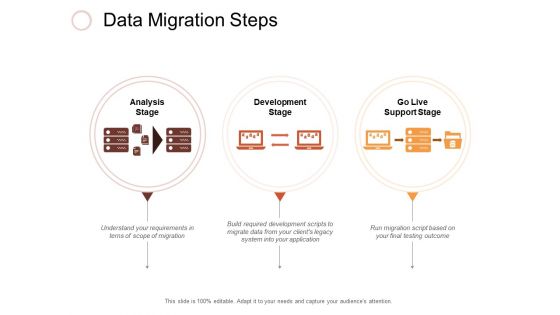
Data Migration Steps Ppt PowerPoint Presentation File Brochure
This is a data migration steps ppt powerpoint presentation file brochure. This is a three stage process. The stages in this process are business, management, marketing.
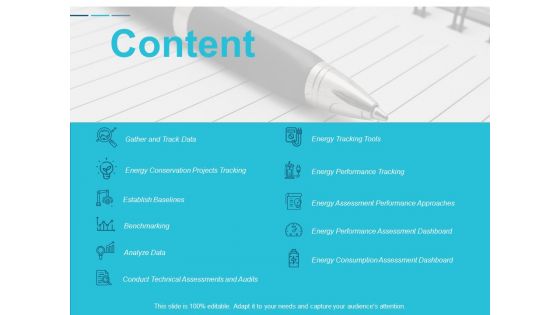
Content Analyze Data Ppt Powerpoint Presentation Outline Influencers
This is a content analyze data ppt powerpoint presentation outline influencers. This is a one stage process. The stages in this process are business, management, planning, strategy, marketing.
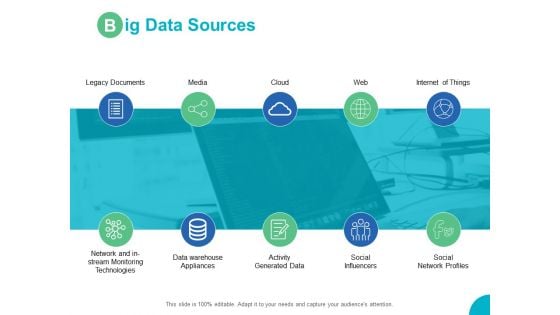
Big Data Sources Data Warehouse Ppt PowerPoint Presentation Ideas Pictures
Presenting this set of slides with name big data sources data warehouse ppt powerpoint presentation ideas pictures. This is a ten stage process. The stages in this process are marketing, business, management, planning, strategy. This is a completely editable PowerPoint presentation and is available for immediate download. Download now and impress your audience.
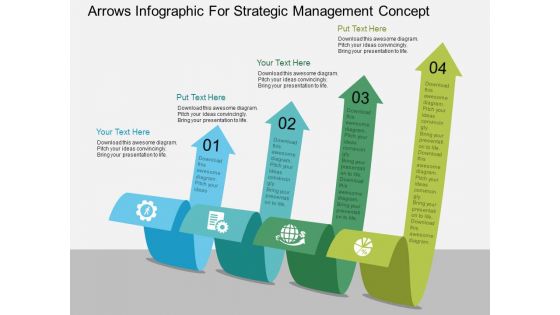
Arrows Infographic For Strategic Management Concept Powerpoint Template
Our above PPT slide contains four curved arrows infographic design. This business diagram helps to depict business information for strategic management. Use this diagram to impart more clarity to data and to create more sound impact on viewers.
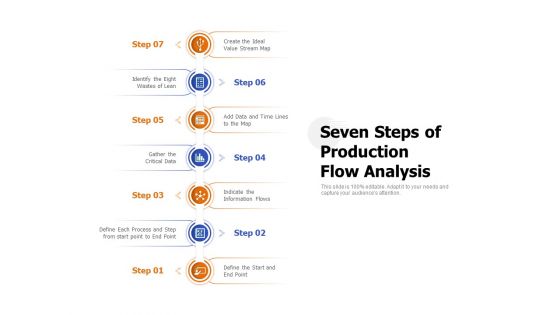
Seven Steps Of Production Flow Analysis Ppt PowerPoint Presentation Portfolio Information PDF
Presenting this set of slides with name seven steps of production flow analysis ppt powerpoint presentation portfolio information pdf. This is a aeven stage process. The stages in this process are create the ideal value stream map, identify the eight wastes of lean, add data and time lines to the map, gather the critical data, indicate the information flows, define each process and step from start point to end point, define the start and end point. This is a completely editable PowerPoint presentation and is available for immediate download. Download now and impress your audience.
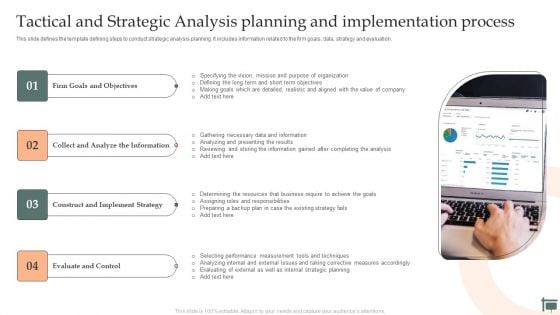
Tactical And Strategic Analysis Planning And Implementation Process Graphics PDF
This slide defines the template defining steps to conduct strategic analysis planning. It includes information related to the firm goals, data, strategy and evaluation. Persuade your audience using this Tactical And Strategic Analysis Planning And Implementation Process Graphics PDF. This PPT design covers four stages, thus making it a great tool to use. It also caters to a variety of topics including Evaluate And Control, Analyze Information, Goals And Objectives. Download this PPT design now to present a convincing pitch that not only emphasizes the topic but also showcases your presentation skills.
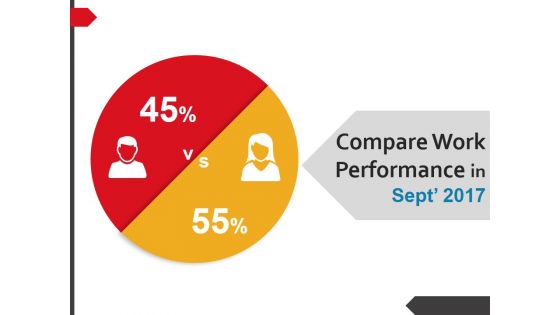
Compare Work Performance In Ppt PowerPoint Presentation Infographic Template Graphics Template
This is a compare work performance in ppt powerpoint presentation infographic template graphics template. This is a two stage process. The stages in this process are business, management, finance, marketing, strategy, analysis, compare.

Hedge Funds Performance Contribution Ppt PowerPoint Presentation Infographic Template Visual Aids
This is a hedge funds performance contribution ppt powerpoint presentation infographic template visual aids. This is a five stage process. The stages in this process are business, management, strategy, analysis, marketing.

Risk Impact And Probability Analysis Performance Ppt Powerpoint Presentation Infographics Deck
This is a risk impact and probability analysis performance ppt powerpoint presentation infographics deck. This is a five stage process. The stages in this process are business, management, planning, strategy, marketing.
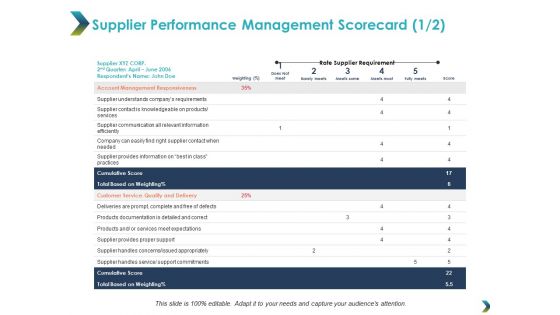
Supplier Performance Management Scorecard Business Ppt Powerpoint Presentation Infographics Slide Portrait
This is a supplier performance management scorecard business ppt powerpoint presentation infographics slide portrait. This is a five stage process. The stages in this process are business, management, planning, strategy, marketing.
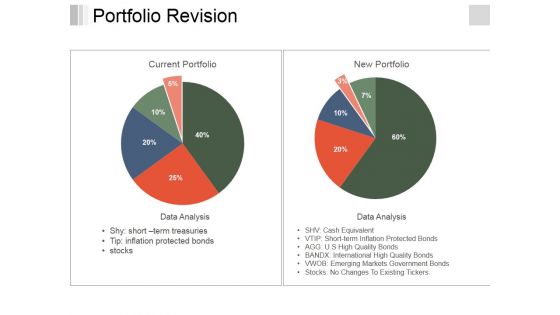
Portfolio Revision Ppt PowerPoint Presentation Visual Aids Infographic Template
This is a portfolio revision ppt powerpoint presentation visual aids infographic template. This is a two stage process. The stages in this process are current portfolio, data analysis, new portfolio, data analysis.
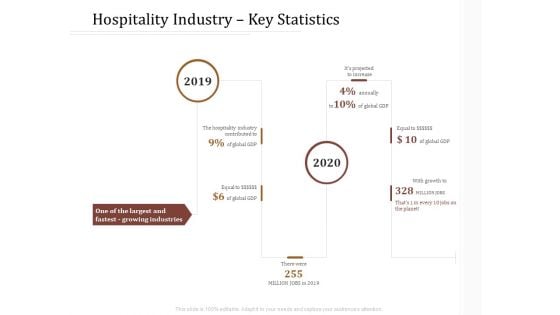
Key Metrics Hotel Administration Management Hospitality Industry Key Statistics Download PDF
Presenting this set of slides with name key metrics hotel administration management hospitality industry key statistics download pdf. This is a two stage process. The stages in this process are hospitality industry key statistics, 2019 to 2020. This is a completely editable PowerPoint presentation and is available for immediate download. Download now and impress your audience.
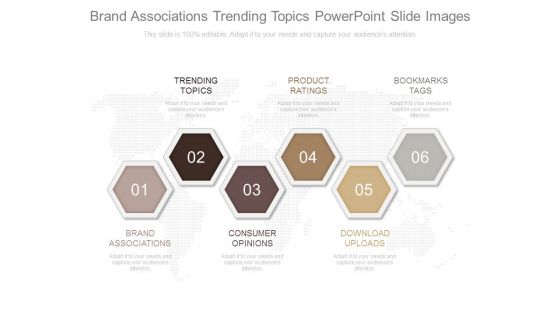
Brand Associations Trending Topics Powerpoint Slide Images
This is a brand associations trending topics powerpoint slide images. This is a six stage process. The stages in this process are trending topics, product ratings, bookmarks tags, brand associations, consumer opinions, download uploads.
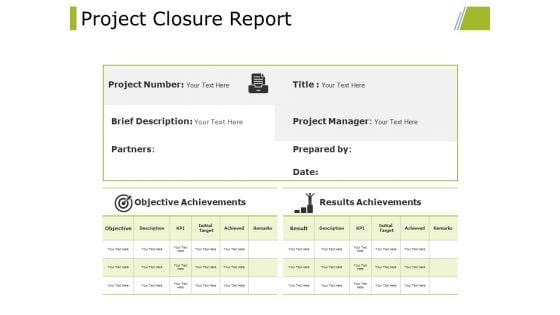
Project Closure Report Ppt PowerPoint Presentation Slides Portrait
This is a project closure report ppt powerpoint presentation slides portrait. This is a six stage process. The stages in this process are project information, project deliverables, benefits, key metrics, shortfalls, controls in place.
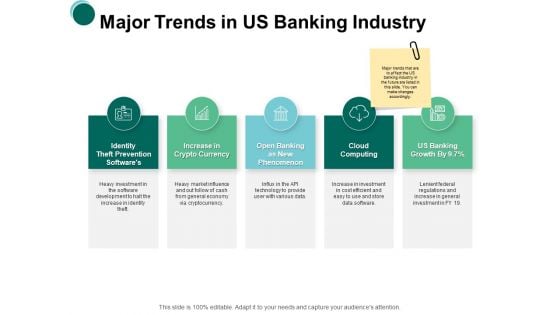
Major Trends In Us Banking Industry Cuurency Ppt PowerPoint Presentation Professional Slide Download
Presenting this set of slides with name major trends in us banking industry cuurency ppt powerpoint presentation professional slide download. This is a five stage process. The stages in this process are marketing, business, management, planning, strategy. This is a completely editable PowerPoint presentation and is available for immediate download. Download now and impress your audience.
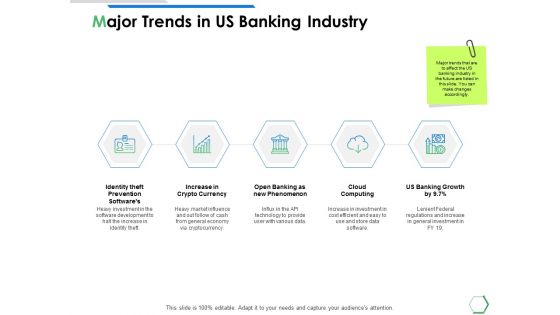
Major Trends In Us Banking Industry Ppt PowerPoint Presentation Portfolio Picture
Presenting this set of slides with name major trends in us banking industry ppt powerpoint presentation portfolio picture. This is a five stage process. The stages in this process are business, management, planning, strategy, marketing. This is a completely editable PowerPoint presentation and is available for immediate download. Download now and impress your audience.

Copyright Assets Alignment With Business Policy And Trends Ppt PowerPoint Presentation Gallery Skills PDF
Presenting this set of slides with name copyright assets alignment with business policy and trends ppt powerpoint presentation gallery skills pdf. This is a three stage process. The stages in this process are marketing, finance, policy. This is a completely editable PowerPoint presentation and is available for immediate download. Download now and impress your audience.
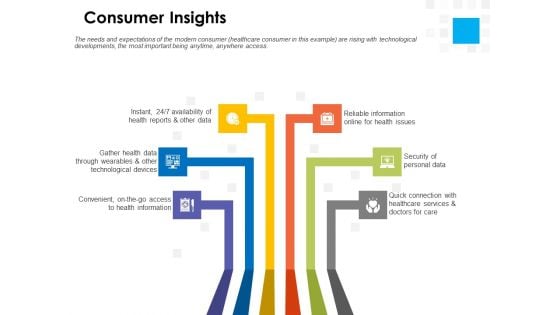
Digital Transformation Strategy Roadmap Consumer Insights Ppt PowerPoint Presentation Layouts Design Inspiration PDF
Presenting this set of slides with name digital transformation strategy roadmap consumer insights ppt powerpoint presentation layouts design inspiration pdf. This is a six stage process. The stages in this process are convenient access, health information, quick connection, healthcare services, security personal data, reliable information online health issues, health reports, gather health data through wearables, technological devices. This is a completely editable PowerPoint presentation and is available for immediate download. Download now and impress your audience.
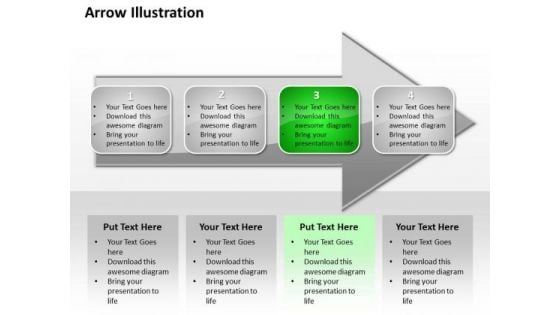
Ppt Arrow Illustration Of 4 Concepts PowerPoint Templates
PPT arrow illustration of 4 concepts PowerPoint Templates-Use this Diagram to display the data. It make easier for the analysts to visualize and interpret the data-PPT arrow illustration of 4 concepts PowerPoint Templates-3d, Abstract, Around, Arrows, Blue, Border, Business, Center, Circle, Circular, Concept, Connections, Copy, Curve, Cycle, Directions, Distribution, Illustration, Management, Middle, Objects, Pieces, Plan, Pointing, Process, Recycle, Rounded, Shadows, Space, System Hire teams with our Ppt Arrow Illustration Of 4 Concepts PowerPoint Templates. Download without worries with our money back guaranteee.
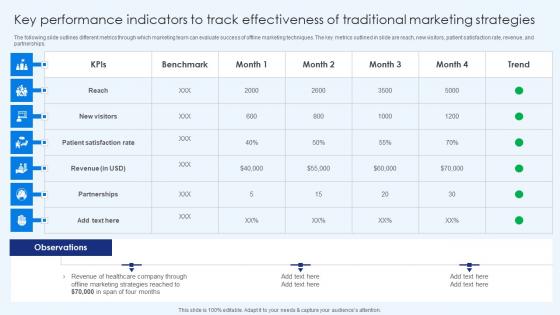
Key Performance Indicators To Track Effectivenes Healthcare Promotion Infographics Pdf
The following slide outlines different metrics through which marketing team can evaluate success of offline marketing techniques. The key metrics outlined in slide are reach, new visitors, patient satisfaction rate, revenue, and partnerships. The Key Performance Indicators To Track Effectivenes Healthcare Promotion Infographics Pdf is a compilation of the most recent design trends as a series of slides. It is suitable for any subject or industry presentation, containing attractive visuals and photo spots for businesses to clearly express their messages. This template contains a variety of slides for the user to input data, such as structures to contrast two elements, bullet points, and slides for written information. Slidegeeks is prepared to create an impression. The following slide outlines different metrics through which marketing team can evaluate success of offline marketing techniques. The key metrics outlined in slide are reach, new visitors, patient satisfaction rate, revenue, and partnerships.

Business Diagram Four Design For Concept Coding Presentation Template
Four colorful text boxes has been used to craft this power point template. This PPT diagram contains the concept of coding and data representation. Use this PPT for business and technology related presentations.
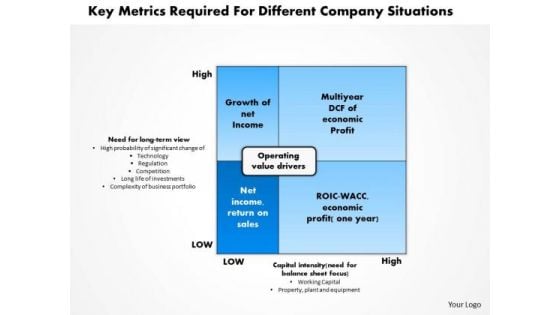
Business Diagram Key Metrics Required For Different Company Situations PowerPoint Ppt Presentation
Get The Domestics Right With Our Business Diagram Key Metrics Required For Different Company Situations PowerPoint PPT Presentation PowerPoint Templates. Create The Base For Thoughts To Grow. Do Away With Dogmatic Approaches. Establish The Value Of Reason With Our Business PowerPoint Templates.
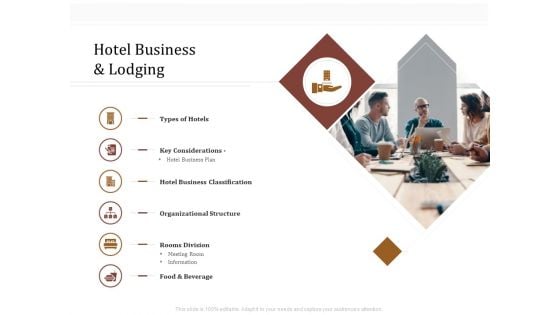
Key Metrics Hotel Administration Management Hotel Business And Lodging Sample PDF
Presenting this set of slides with name key metrics hotel administration management hotel business and lodging sample pdf. This is a six stage process. The stages in this process are organizational, business, considerations, plan. This is a completely editable PowerPoint presentation and is available for immediate download. Download now and impress your audience.
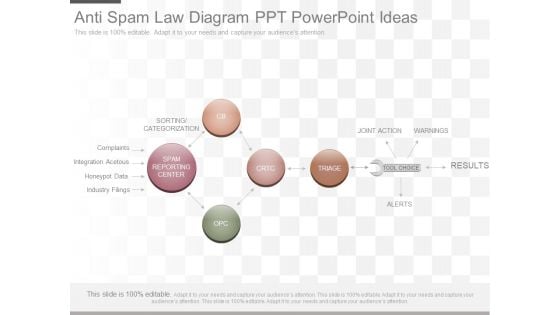
Anti Spam Law Diagram Ppt Powerpoint Ideas
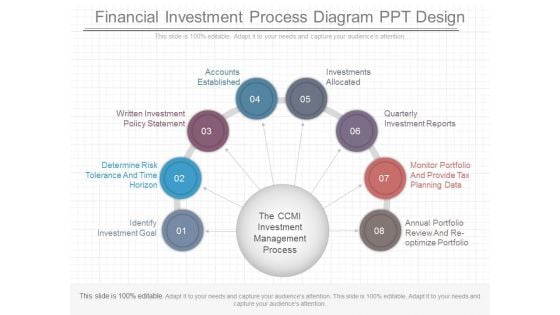
Financial Investment Process Diagram Ppt Design
This is a financial investment process diagram ppt design. This is a eight stage process. The stages in this process are identify investment goal, determine risk tolerance and time horizon, written investment policy statement, accounts established, investments allocated, quarterly investment reports, monitor portfolio and provide tax planning data, annual portfolio review and re optimize portfolio.


 Continue with Email

 Home
Home


