Meter Chart
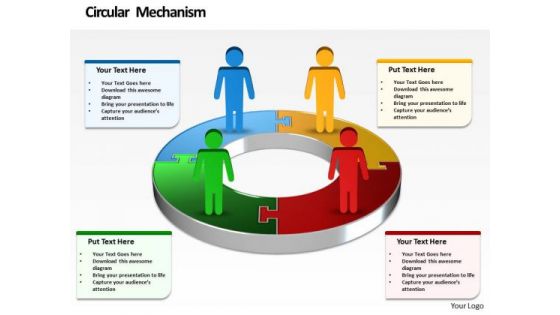
Ppt Symbol Business Men Standing On Financial Colorful Pie Chart PowerPoint Templates
PPT symbol business men standing on financial colorful pie chart PowerPoint Templates-Use this Business based PowerPoint Diagram to represent the Business issues Graphically. It indicates arrange, block out, blueprint, cast, delineate, design, devise, draft, graph , lay out, outline, plot, project, shape, sketch etc.-PPT symbol business men standing on financial colorful pie chart PowerPoint Templates-Adult, Art, Background, Business, Career, Chart, Communication, Concept, Conference, Corporate, Creative, Design, Economy, Executive, Finance, Group, Growth, Idea, Illustration, Leadership, Meeting, New, Occupation, Office, People, Person, Progress, Silhouette, Space, Speaking, Standing, Success Entertain your audience with your thoughts. Capture their imagination with our Ppt Symbol Business Men Standing On Financial Colorful Pie Chart PowerPoint Templates.
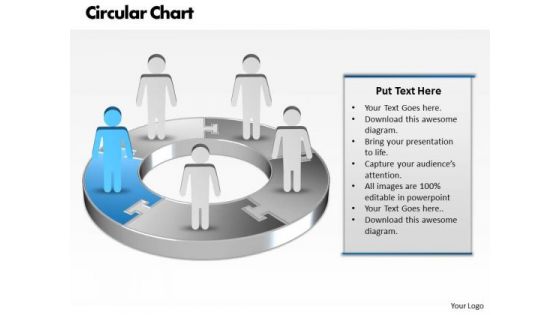
Ppt Blue Men Standing On Business Pie Organization Chart PowerPoint Template Templates
PPT blue men standing on business pie organization chart powerpoint template Templates-Use this Business based PowerPoint Diagram to represent the Business issues Graphically. It indicates arrange, block out, blueprint, cast, delineate, design, devise, draft, graph , lay out, outline, plot, project, shape, sketch etc.-PPT blue men standing on business pie organization chart powerpoint template Templates-arrow, art, basic, blank, business, capital, chart, chevron, clip, clipart, colorful, conglomerates, consumer, copy, cyclical, energy, financial, flow, goods, graph, graphic, healthcare, illustration, infographic, information, investment, isolated, market, materials, non, round, sectors, services, slide, space, stock, technology, text, Our Ppt Blue Men Standing On Business Pie Organization Chart PowerPoint Template Templates are never a drag. The audience will be always attentive.
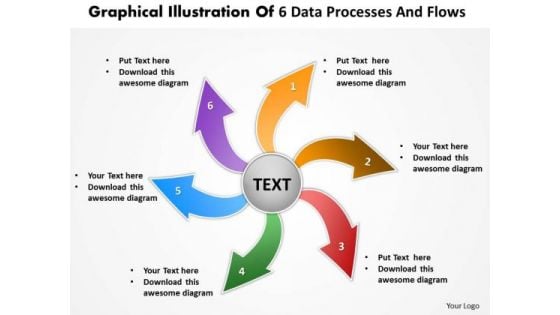
Illustration Of 6 Data Processes And Flows Circular Chart PowerPoint Templates
We present our illustration of 6 data processes and flows Circular Chart PowerPoint templates.Present our Arrows PowerPoint Templates because they are the indicators of the path you have in mind. Download our Circle Charts PowerPoint Templates because the ideas and plans are on your finger tips. Present our Shapes PowerPoint Templates because it shows how one can contribute to the overall feeling of well-being. Download our Business PowerPoint Templates because it will demonstrate the strength of character under severe stress. Shine the torch ahead and bring the light to shine on all. Present our Flow Charts PowerPoint Templates because you know what it takes to keep it fit and healthy.Use these PowerPoint slides for presentations relating to achievement, aim, around, arrow, blue, center, chart, circle, circular, connection, cursor, cycle, cyclic, decisions, direction, flow, graph, graphic, group, icon, illustration, isolated, loop, motion, movement, point, pointer, recycle, recycling, reuse, ring, rotation, round, sign, spin, symbol, target, team, teamwork, technology, turn, wheel, white. The prominent colors used in the PowerPoint template are Red, Green, Blue. Presenters tell us our illustration of 6 data processes and flows Circular Chart PowerPoint templates are Perfect. You can be sure our arrow PowerPoint templates and PPT Slides are Ultra. Professionals tell us our illustration of 6 data processes and flows Circular Chart PowerPoint templates are Nifty. People tell us our center PowerPoint templates and PPT Slides are Handsome. People tell us our illustration of 6 data processes and flows Circular Chart PowerPoint templates are Youthful. Professionals tell us our around PowerPoint templates and PPT Slides are Fancy. Address problems with our Illustration Of 6 Data Processes And Flows Circular Chart PowerPoint Templates. Download without worries with our money back guaranteee.
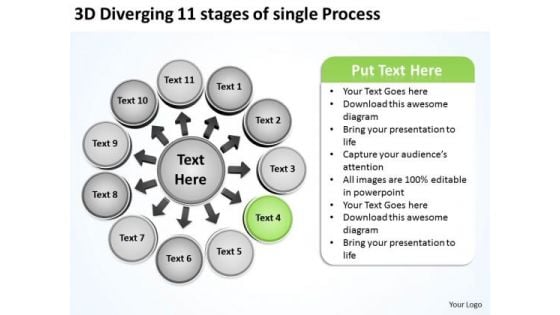
3d Diverging 11 Stages Of Single Process Business Circular Flow Arrow Chart PowerPoint Slides
We present our 3d diverging 11 stages of single process business Circular Flow Arrow Chart PowerPoint Slides.Use our Business PowerPoint Templates because you too have got the framework of your companys growth in place. Download our Circle charts PowerPoint Templates because you should Emphasise the process of your business or corporate growth. Download our Arrows PowerPoint Templates because colours generate instant reactions in our brains. Use our Shapes PowerPoint Templates because it Creates a winner with your passion and dream. Use our Flow charts PowerPoint Templates because they are the indicators of the path you have in mind.Use these PowerPoint slides for presentations relating to Abstract, arrow, arrow, circle, business, concept, career, center, stage, chart, circle circle, connection, contrast, cycle, diagram, direction, flow flowchart, future, graph, icon, illustration, isolate, isolated, job, life, loop, money, motion network, recycle, refresh, ring, rotation, sick, sign, symbol, simply, target, wealth. The prominent colors used in the PowerPoint template are Green, Gray, White. People tell us our 3d diverging 11 stages of single process business Circular Flow Arrow Chart PowerPoint Slides are No-nonsense. PowerPoint presentation experts tell us our center PowerPoint templates and PPT Slides provide great value for your money. Be assured of finding the best projection to highlight your words. Presenters tell us our 3d diverging 11 stages of single process business Circular Flow Arrow Chart PowerPoint Slides are Glamorous. PowerPoint presentation experts tell us our circle PowerPoint templates and PPT Slides are Spiffy. People tell us our 3d diverging 11 stages of single process business Circular Flow Arrow Chart PowerPoint Slides are specially created by a professional team with vast experience. They diligently strive to come up with the right vehicle for your brilliant Ideas. People tell us our stage PowerPoint templates and PPT Slides are Youthful. However faint their hopes may be. Buck them up with our 3d Diverging 11 Stages Of Single Process Business Circular Flow Arrow Chart PowerPoint Slides.
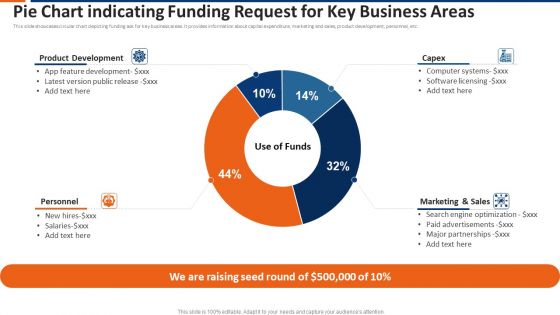
Pie Chart Indicating Funding Request For Key Business Areas Ppt Show Topics PDF
This slide showcases circular chart depicting funding ask for key business areas. It provides information about capital expenditure, marketing and sales, product development, personnel, etc. Pitch your topic with ease and precision using this pie chart indicating funding request for key business areas ppt show topics pdf. This layout presents information on product development, capex, marketing and sales, personnel. It is also available for immediate download and adjustment. So, changes can be made in the color, design, graphics or any other component to create a unique layout.
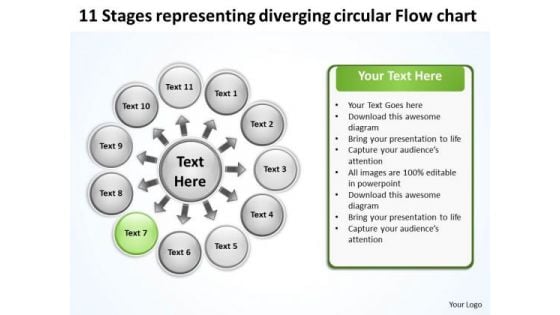
Representing Diverging Circular Flow Chart Relative Cycle Arrow Diagram PowerPoint Templates
We present our representing diverging circular flow chart Relative Cycle Arrow Diagram PowerPoint templates.Download and present our Ring charts PowerPoint Templates because you can present your opinions in this field using our impressive templates. Download and present our Circle charts PowerPoint Templates because stable ideas are the building blocks of a sucessful structure. Use our Business PowerPoint Templates because it illustrates the city with a lasting tryst with resilience. You epitomise the qualities that give your city its fame. Present our Marketing PowerPoint Templates because customer satisfaction is a mantra of the marketplace. Building a loyal client base is an essential element of your business. Use our Process and Flows PowerPoint Templates because all elements of the venture are equally critical.Use these PowerPoint slides for presentations relating to Button,cerulean, circle, circulation, cobalt,colorful, cyan, cycle, element,emblem, grayshadow, green,icon, indicator, interface, internet, label,link, load, marker, motion, movement,navigationpanel, next, orientation, pagsite, pink, pointer, previous, process, reload, rotation, satined, sign, signpost,smooth, sticker, sticky, symbol. The prominent colors used in the PowerPoint template are Green, Black, White. Customers tell us our representing diverging circular flow chart Relative Cycle Arrow Diagram PowerPoint templates are designed by a team of presentation professionals. We assure you our element PowerPoint templates and PPT Slides are readymade to fit into any presentation structure. PowerPoint presentation experts tell us our representing diverging circular flow chart Relative Cycle Arrow Diagram PowerPoint templates are Detailed. People tell us our circle PowerPoint templates and PPT Slides are Striking. We assure you our representing diverging circular flow chart Relative Cycle Arrow Diagram PowerPoint templates are Endearing. Use our circulation PowerPoint templates and PPT Slides are Delightful. Cross continents with our Representing Diverging Circular Flow Chart Relative Cycle Arrow Diagram PowerPoint Templates. Your thoughts will cover the earth.
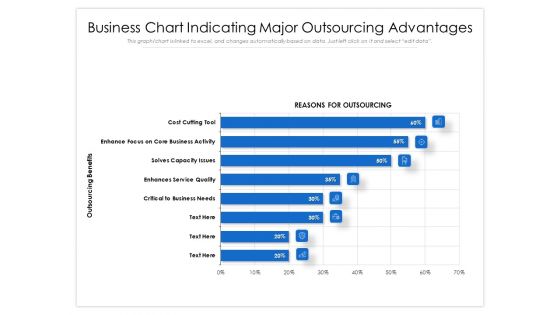
Business Chart Indicating Major Outsourcing Advantages Ppt PowerPoint Presentation File Template PDF
Showcasing this set of slides titled business chart indicating major outsourcing advantages ppt powerpoint presentation file template pdf. The topics addressed in these templates are cost, business, service. All the content presented in this PPT design is completely editable. Download it and make adjustments in color, background, font etc. as per your unique business setting.
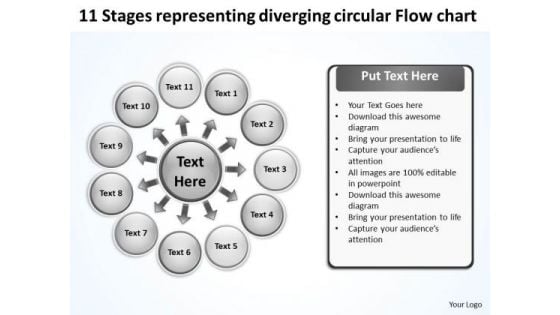
Representing Diverging Circular Flow Chart Relative Cycle Arrow Diagram PowerPoint Slides
We present our representing diverging circular flow chart Relative Cycle Arrow Diagram PowerPoint Slides.Present our Ring charts PowerPoint Templates because the world over it is a priority for many. Along with it there are so many oppurtunities waiting to be utilised. Download and present our Circle charts PowerPoint Templates because you know that the core of any organisation is the people who work for it. Use our Process and Flows PowerPoint Templates because you can Be the cynosure of all eyes with our template depicting . Download and present our Business PowerPoint Templates because infrastructure growth is an obvious requirement of today.inform your group on how exactly this potential is tailor made for you. Download and present our Marketing PowerPoint Templates because you know Coincidentally it will always point to the top.Use these PowerPoint slides for presentations relating to Button,cerulean, circle, circulation, cobalt,colorful, cyan, cycle, element,emblem, grayshadow, green,icon, indicator, interface, internet, label,link, load, marker, motion, movement,navigationpanel, next, orientation, pagsite, pink, pointer, previous, process, reload, rotation, satined, sign, signpost,smooth, sticker, sticky, symbol. The prominent colors used in the PowerPoint template are Gray, Black, White. Customers tell us our representing diverging circular flow chart Relative Cycle Arrow Diagram PowerPoint Slides are Vintage. We assure you our colorful PowerPoint templates and PPT Slides provide great value for your money. Be assured of finding the best projection to highlight your words. PowerPoint presentation experts tell us our representing diverging circular flow chart Relative Cycle Arrow Diagram PowerPoint Slides are Second to none. People tell us our cycle PowerPoint templates and PPT Slides are Zippy. We assure you our representing diverging circular flow chart Relative Cycle Arrow Diagram PowerPoint Slides are Magnificent. Use our circle PowerPoint templates and PPT Slides are Majestic. Create a better workplace with our Representing Diverging Circular Flow Chart Relative Cycle Arrow Diagram PowerPoint Slides. Dont pass up this opportunity to shine.
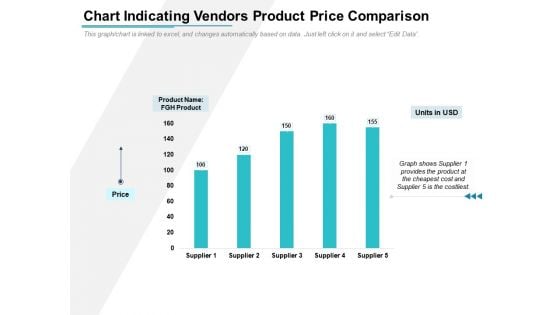
Chart Indicating Vendors Product Price Comparison Ppt PowerPoint Presentation Portfolio Infographics PDF
Showcasing this set of slides titled chart indicating vendors product price comparison ppt powerpoint presentation portfolio infographics pdf. The topics addressed in these templates are product, fgh product, units in usd, price, supplier. All the content presented in this PPT design is completely editable. Download it and make adjustments in color, background, font etc. as per your unique business setting.
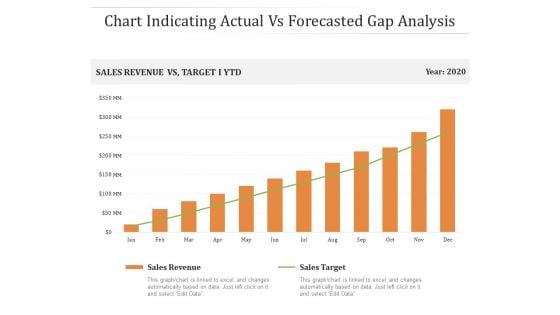
Chart Indicating Actual Vs Forecasted Gap Analysis Ppt PowerPoint Presentation Gallery Slides PDF
Presenting this set of slides with name chart indicating actual vs forecasted gap analysis ppt powerpoint presentation gallery slides pdf. The topics discussed in these slides are sales, target, revenue. This is a completely editable PowerPoint presentation and is available for immediate download. Download now and impress your audience.
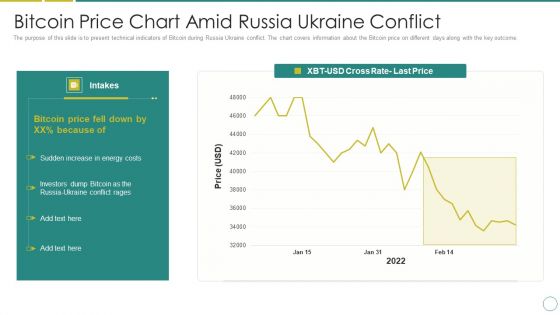
Russia Ukraine Bitcoin Price Chart Amid Russia Ukraine Conflict Demonstration PDF
The purpose of this slide is to present technical indicators of Bitcoin during Russia Ukraine conflict. The chart covers information about the Bitcoin price on different days along with the key outcome. Deliver an awe inspiring pitch with this creative russia ukraine bitcoin price chart amid russia ukraine conflict demonstration pdf bundle. Topics like bitcoin price, energy costs, 2022 can be discussed with this completely editable template. It is available for immediate download depending on the needs and requirements of the user.
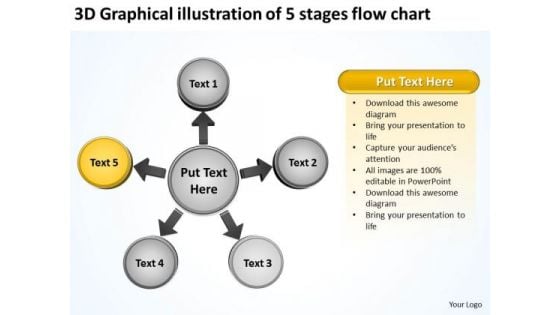
3d Graphical Illustration Of 5 Stages Flow Chart Arrow Circular Spoke Diagram PowerPoint Slides
We present our 3d graphical illustration of 5 stages flow chart arrow Circular Spoke Diagram PowerPoint Slides.Present our Business PowerPoint Templates because you are ready to flap your wings and launch off. All poised are you to touch the sky with glory. Present our Circle charts PowerPoint Templates because they are the indicators of the path you have in mind. Download our Arrows PowerPoint Templates because you can put down your ideas and present them using our innovative templates. Present our Shapes PowerPoint Templates because it Shines the light on your thoughts and motivates your team to improve the quality of celebration for all around you. Use our Flow charts PowerPoint Templates because you have the ideas to develop the teams vision of where they need to be in the future.Use these PowerPoint slides for presentations relating to Abstract, arrow, arrow, circle, business, concept, career, center, stage, chart, circle circle, connection, contrast, cycle, diagram, direction, flow flowchart, future, graph, icon, illustration, isolate, isolated, job, life, loop, money, motion network, recycle, refresh, ring, rotation, sick, sign, symbol, simply, target, wealth. The prominent colors used in the PowerPoint template are Yellow, Gray, White. People tell us our 3d graphical illustration of 5 stages flow chart arrow Circular Spoke Diagram PowerPoint Slides are Romantic. PowerPoint presentation experts tell us our business PowerPoint templates and PPT Slides are Vintage. Presenters tell us our 3d graphical illustration of 5 stages flow chart arrow Circular Spoke Diagram PowerPoint Slides are Fantastic. PowerPoint presentation experts tell us our circle PowerPoint templates and PPT Slides are Functional. People tell us our 3d graphical illustration of 5 stages flow chart arrow Circular Spoke Diagram PowerPoint Slides are Nifty. People tell us our center PowerPoint templates and PPT Slides will generate and maintain the level of interest you desire. They will create the impression you want to imprint on your audience. Our 3d Graphical Illustration Of 5 Stages Flow Chart Arrow Circular Spoke Diagram PowerPoint Slides stay away from farce. They treat every event correctly.
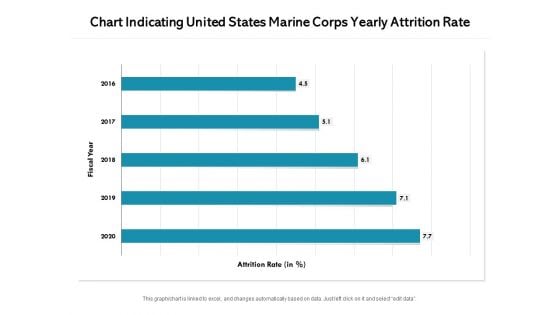
Chart Indicating United States Marine Corps Yearly Attrition Rate Ppt PowerPoint Presentation File Background Images PDF
Pitch your topic with ease and precision using this chart indicating united states marine corps yearly attrition rate ppt powerpoint presentation file background images pdf. This layout presents information on hart indicating united states marine corps yearly attrition rate. It is also available for immediate download and adjustment. So, changes can be made in the color, design, graphics or any other component to create a unique layout.
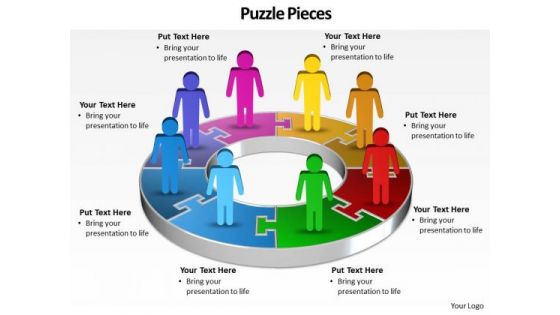
Ppt A Team Of Business People Standing On Pie PowerPoint Bar Chart Ks2 Pieces Templates
PPT a team of business people standing on pie powerpoint bar chart ks2 pieces Templates-This Business PowerPoint Diagram shows 3d linear abstraction to represent Business related issues. It uses three steps. It indicates employment, field, function, game, line, and livelihood. It is helpful to organize information. -PPT a team of business people standing on pie powerpoint bar chart ks2 pieces Templates-Abstract, Arrow, Art, Artistic, Background, Business, Colorful, Communication, Computer-Graphics, Concept, Creation, Data, Decoration, Decorative, Design, Design-Element, Digital, Direction, Effect, Elegance, Element, Energy, Flow, Go, Idea, Illustration, Modern, Movement, Network, Symbol Break out of the cocoon with our Ppt A Team Of Business People Standing On Pie PowerPoint Bar Chart Ks2 Pieces Templates. Let your thoughts take to the air.
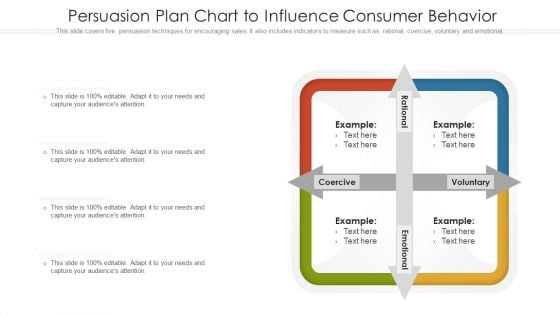
Persuasion Plan Chart To Influence Consumer Behavior Ppt PowerPoint Presentation Summary Design Templates PDF
This slide covers five persuasion techniques for encouraging sales. It also includes indicators to measure such as rational, coercive, voluntary and emotional. Persuade your audience using this persuasion plan chart to influence consumer behavior ppt powerpoint presentation summary design templates pdf. This PPT design covers four stages, thus making it a great tool to use. It also caters to a variety of topics including persuasion plan chart to influence consumer behavior. Download this PPT design now to present a convincing pitch that not only emphasizes the topic but also showcases your presentation skills.
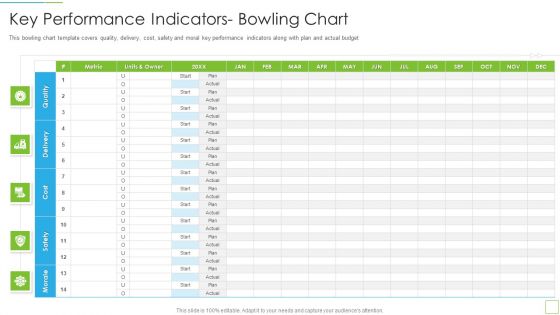
Hoshin Kanri Pitch Deck Key Performance Indicators Bowling Chart Introduction PDF
This bowling chart template covers quality, delivery, cost, safety and moral key performance indicators along with plan and actual budget Deliver an awe inspiring pitch with this creative hoshin kanri pitch deck key performance indicators bowling chart introduction pdf bundle. Topics like key performance indicators bowling chart can be discussed with this completely editable template. It is available for immediate download depending on the needs and requirements of the user.
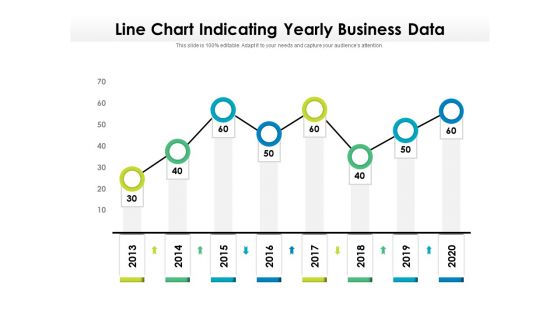
Line Chart Indicating Yearly Business Data Ppt PowerPoint Presentation Styles Deck PDF
Showcasing this set of slides titled line chart indicating yearly business data ppt powerpoint presentation styles deck pdf. The topics addressed in these templates are line chart indicating yearly business data, 2013 to 2020. All the content presented in this PPT design is completely editable. Download it and make adjustments in color, background, font etc. as per your unique business setting.
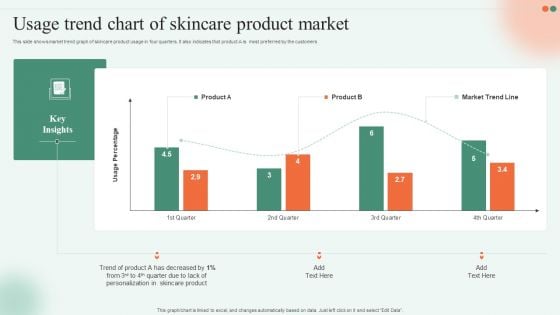
Usage Trend Chart Of Skincare Product Market Ppt Slides Graphics Download PDF
This slide shows market trend graph of skincare product usage in four quarters. It also indicates that product A is most preferred by the customers. Pitch your topic with ease and precision using this Usage Trend Chart Of Skincare Product Market Ppt Slides Graphics Download PDF. This layout presents information on Trend Product, Skincare Product, Quarter Due. It is also available for immediate download and adjustment. So, changes can be made in the color, design, graphics or any other component to create a unique layout.
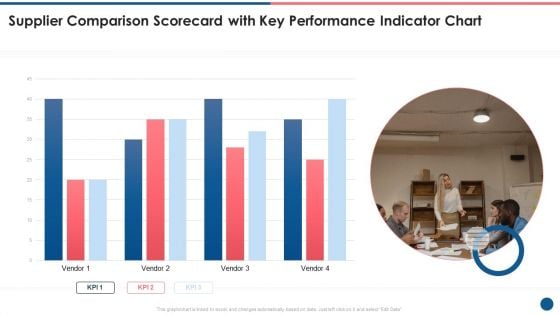
Supplier Scorecard Supplier Comparison Scorecard With Key Performance Indicator Chart Formats PDF
This is a supplier scorecard supplier comparison scorecard with key performance indicator chart formats pdf template with various stages. Focus and dispense information on one stages using this creative set, that comes with editable features. It contains large content boxes to add your information on topics like supplier comparison scorecard, key performance, indicator chart. You can also showcase facts, figures, and other relevant content using this PPT layout. Grab it now.
Statistics Chart Indicating RD Expenditure Ppt PowerPoint Presentation Icon Example PDF
Presenting this set of slides with name statistics chart indicating rd expenditure ppt powerpoint presentation icon example pdf. The topics discussed in these slides are revenue, expenditure, competitor. This is a completely editable PowerPoint presentation and is available for immediate download. Download now and impress your audience.
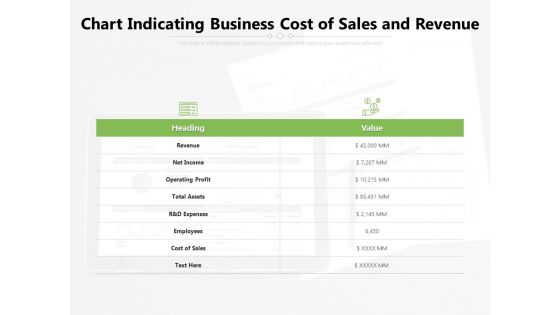
Chart Indicating Business Cost Of Sales And Revenue Ppt PowerPoint Presentation File Gridlines PDF
Presenting this set of slides with name chart indicating business cost of sales and revenue ppt powerpoint presentation file gridlines pdf. The topics discussed in these slides are revenue, operating, assets. This is a completely editable PowerPoint presentation and is available for immediate download. Download now and impress your audience.
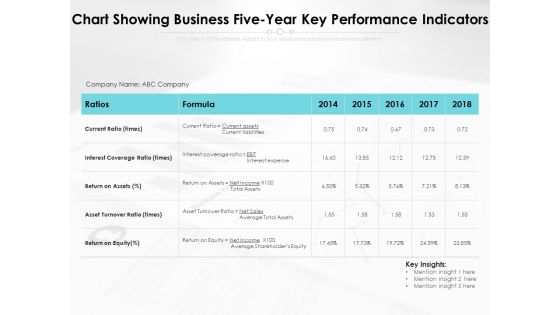
Chart Showing Business Five Year Key Performance Indicators Ppt PowerPoint Presentation File Infographics PDF
Presenting this set of slides with name chart showing business five year key performance indicators ppt powerpoint presentation file infographics pdf. The topics discussed in these slides are liabilities, equity, assets. This is a completely editable PowerPoint presentation and is available for immediate download. Download now and impress your audience.
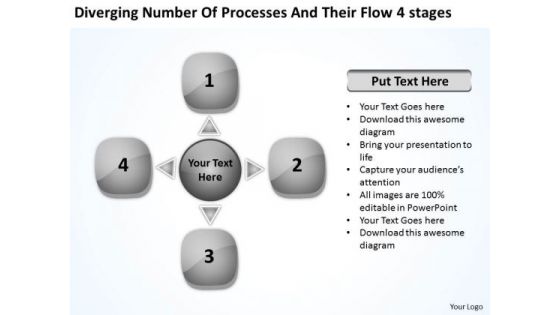
Number Of Processes And Their Stages Cycle Motion Chart PowerPoint Templates
We present our number of processes and their stages Cycle Motion Chart PowerPoint templates.Download our Symbol PowerPoint Templates because they are the indicators of the path you have in mind. Download and present our Arrows PowerPoint Templates because you can get advantage to prioritise your ideas. Present our Business PowerPoint Templates because you too have got the framework of your companys growth in place. Download our Shapes PowerPoint Templates because knowledge is power goes the popular saying. Download and present our Process and Flows PowerPoint Templates because the ideas and plans are on your finger tips.Use these PowerPoint slides for presentations relating to Abstract, Arrows, Blank, Business, Central, Centralized, Chart, Circle, Circular, Circulation, Concept, Conceptual, Converging, Design, Diagram, Empty, Executive, Five, Icon, Idea, Illustration, Management, Map, Mapping, Organization, Outwards, Pointing, Procedure, Process, Relationship, Strategy, Template. The prominent colors used in the PowerPoint template are White, Gray, Black. Use our number of processes and their stages Cycle Motion Chart PowerPoint templates are Festive. We assure you our Centralized PowerPoint templates and PPT Slides are Beautiful. People tell us our number of processes and their stages Cycle Motion Chart PowerPoint templates provide great value for your money. Be assured of finding the best projection to highlight your words. PowerPoint presentation experts tell us our Blank PowerPoint templates and PPT Slides are Colorful. PowerPoint presentation experts tell us our number of processes and their stages Cycle Motion Chart PowerPoint templates are Endearing. Use our Blank PowerPoint templates and PPT Slides are Stunning. Consolidate successes with our Number Of Processes And Their Stages Cycle Motion Chart PowerPoint Templates. Download without worries with our money back guaranteee.
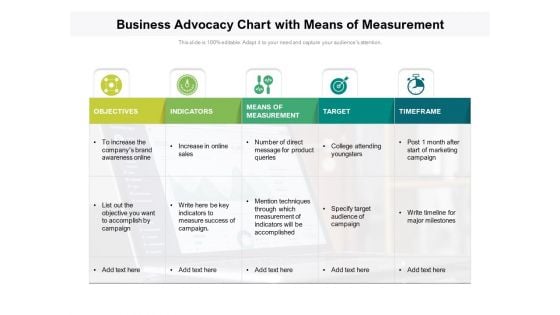
Business Advocacy Chart With Means Of Measurement Ppt PowerPoint Presentation Layouts Designs Download PDF
Presenting this set of slides with name business advocacy chart with means of measurement ppt powerpoint presentation layouts designs download pdf. The topics discussed in these slides are objectives, indicators, means of measurement, target, timeframe. This is a completely editable PowerPoint presentation and is available for immediate download. Download now and impress your audience.
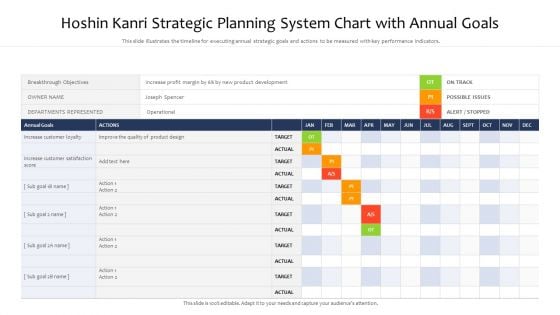
Hoshin Kanri Strategic Planning System Chart With Annual Goals Ppt PowerPoint Presentation Gallery Graphics Design PDF
This slide illustrates the timeline for executing annual strategic goals and actions to be measured with key performance indicators. Showcasing this set of slides titled hoshin kanri strategic planning system chart with annual goals ppt powerpoint presentation gallery graphics design pdf. The topics addressed in these templates are product design, product development, annual goals. All the content presented in this PPT design is completely editable. Download it and make adjustments in color, background, font etc. as per your unique business setting.
Project Management Under Supervision Projects Tracking Chart With Multiple Stages Ideas PDF
This dashboard indicates the progress of multiple projects with completion status during different stages and client feedback. Deliver and pitch your topic in the best possible manner with this project management under supervision projects tracking chart with multiple stages ideas pdf. Use them to share invaluable insights on analysis, design, development, testing, live and impress your audience. This template can be altered and modified as per your expectations. So, grab it now.
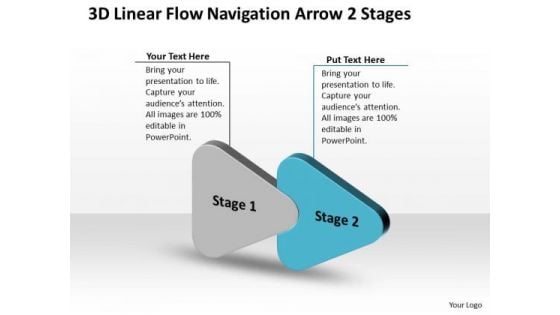
3d Linear Flow Navigation Arrow 2 Stages Ppt Working Chart PowerPoint Slides
We present our 3d linear flow navigation arrow 2 stages ppt working chart PowerPoint Slides. Use our Arrows PowerPoint Templates because; Highlight the key components of your entire manufacturing/ business process. Use our Symbol PowerPoint Templates because, guaranteed to focus the minds of your team. Use our Shapes PowerPoint Templates because, they are indicators of the path you have in mind. Use our Business PowerPoint Templates because, Shine the light on these thoughts and motivate your team to improve the quality of celebration for all around you. Use our Process and Flows PowerPoint Templates because, You sure have something unique, so use this template to expound on it and be rest assured that soon there will be an enthusiastic response and a purposeful Aye- Aye Sir. Use these PowerPoint slides for presentations relating to abstract, arrow, arrows business, chart, design, development, diagram, direction, element, flow, flowchart, graph, linear, management, model, motion, organization, plan, process, program, section, segment, set, sign, solution, strategy, symbol, technology. The prominent colors used in the PowerPoint template are Blue, Gray, and Black Escape from the humdrum with our 3d Linear Flow Navigation Arrow 2 Stages Ppt Working Chart PowerPoint Slides. Put in the element of excitement in your talk.
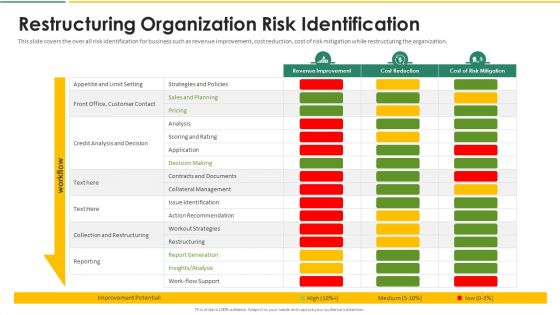
Organization Chart And Corporate Model Transformation Restructuring Organization Risk Identification Inspiration PDF
This slide covers the challenge in reporting several performance indices is to assess whether an improvement in one is comparable with that in another. The indices in the chosen set are each given a usually estimated weighting to reflect their relative importance. Deliver an awe inspiring pitch with this creative organization chart and corporate model transformation restructuring organization risk identification inspiration pdf bundle. Topics like financials, customers, internal processes, learning and growth can be discussed with this completely editable template. It is available for immediate download depending on the needs and requirements of the user.
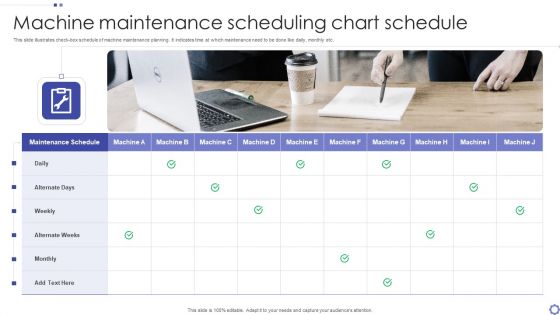
Machine Maintenance Scheduling Chart Schedule Ppt PowerPoint Presentation Ideas Design Ideas PDF
This slide illustrates check box schedule of machine maintenance planning. It indicates time at which maintenance need to be done like daily, monthly etc.Persuade your audience using this Machine Maintenance Scheduling Chart Schedule Ppt PowerPoint Presentation Ideas Design Ideas PDF This PPT design covers one stage, thus making it a great tool to use. It also caters to a variety of topics including Maintenance Schedule, Alternate Weeks, Machine Download this PPT design now to present a convincing pitch that not only emphasizes the topic but also showcases your presentation skills.
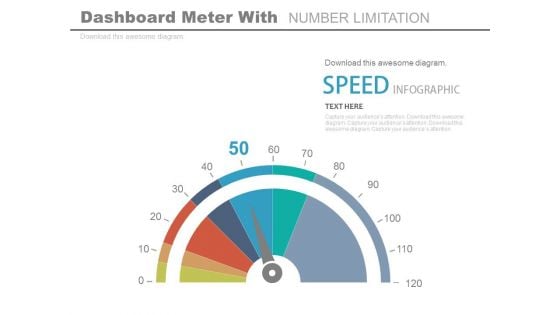
Dashboard To Impact The Performance Powerpoint Slides
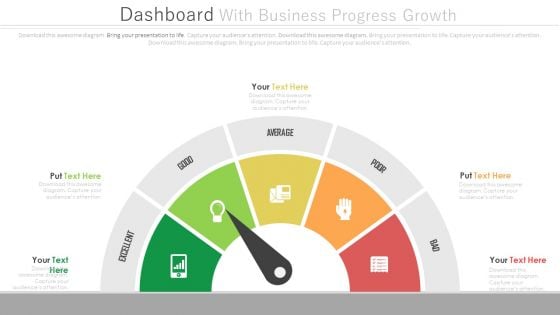
This PowerPoint template graphics of meter chart. Download this PPT chart for business performance analysis. This PowerPoint slide is of great help in the business sector to make realistic presentations and provides effective way of presenting your newer thoughts.
Dashboard To Simplify Business Data Analysis Powerpoint Slides
This PowerPoint template graphics of meter chart. Download this PPT chart to simplify business data analysis. This PowerPoint slide is of great help in the business sector to make realistic presentations and provides effective way of presenting your newer thoughts.
Dashboard With Business Icons Powerpoint Slides
This PowerPoint template graphics of meter chart with business icons. Download this PPT chart to simplify business data analysis. This PowerPoint slide is of great help in the business sector to make realistic presentations and provides effective way of presenting your newer thoughts.
Arrow Diagram Indicate The Tasks Ppt Charts And PowerPoint Templates
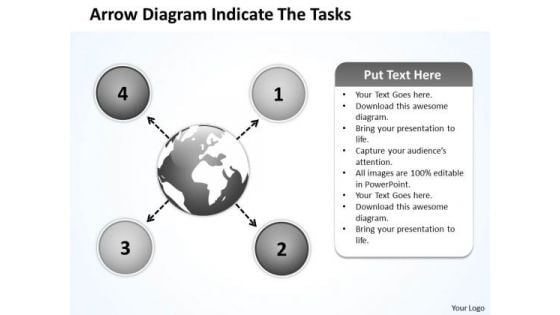
We present our arrow diagram indicate the tasks ppt Charts and PowerPoint templates.Use our Process and Flows PowerPoint Templates because a lot of hard work has gone in and you are almost there. Download our Arrows PowerPoint Templates because you have the ideas, you have got a brainwave. Use our Business PowerPoint Templates because your thoughts are pointed and sharp as arrows. Download our Circle Charts PowerPoint Templates because you can Show them how you can save the day. Present our Flow Charts PowerPoint Templates because you have some excellent plans to spread some more of it across your community.Use these PowerPoint slides for presentations relating to Arrows, choice, connect, design, direction, flows, four, info graph, instruction, layout, manual, marketing, modern, one, option, order, page, paper, pointing, process, product, promotion, sequence, simple, special, step, symbol. The prominent colors used in the PowerPoint template are Black, White, Gray. Presenters tell us our arrow diagram indicate the tasks ppt Charts and PowerPoint templates will help them to explain complicated concepts. Professionals tell us our flows PowerPoint templates and PPT Slides are Enchanting. PowerPoint presentation experts tell us our arrow diagram indicate the tasks ppt Charts and PowerPoint templates are effectively colour coded to prioritise your plans They automatically highlight the sequence of events you desire. The feedback we get is that our four PowerPoint templates and PPT Slides are Beautiful. Use our arrow diagram indicate the tasks ppt Charts and PowerPoint templates are Efficient. Use our connect PowerPoint templates and PPT Slides are Ultra. Achieve collaboration despite differences. Our Arrow Diagram Indicate The Tasks Ppt Charts And PowerPoint Templates encourage convergence.
Project Administration Strategy Dashboard With Pie Charts Sample PDF
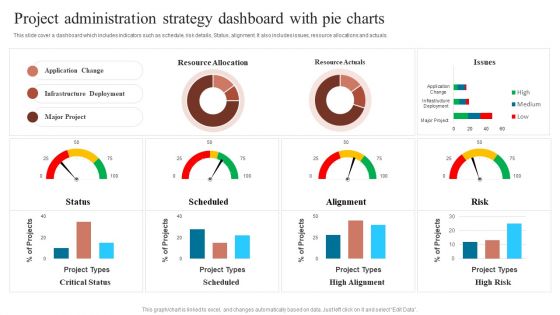
This slide cover a dashboard which includes indicators such as schedule, risk details, Status, alignment. It also includes issues, resource allocations and actuals. Pitch your topic with ease and precision using this Project Administration Strategy Dashboard With Pie Charts Sample PDF. This layout presents information on Communication Goal, Communication Tool, Increase Revenue. It is also available for immediate download and adjustment. So, changes can be made in the color, design, graphics or any other component to create a unique layout.
Steps Layout With Converging Arrows Pointing To Center Charts And Diagrams PowerPoint Slides
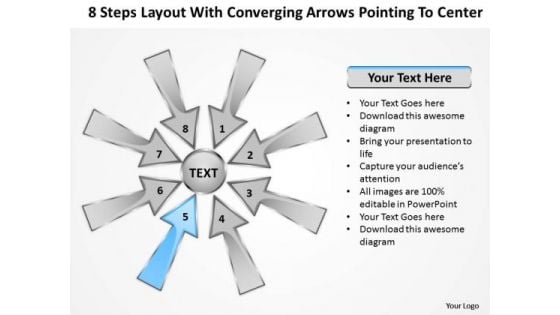
We present our steps layout with converging arrows pointing to center Charts and Diagrams PowerPoint Slides.Present our Arrows PowerPoint Templates because it focuses the light on the path to sure shot success. Download and present our Circle Charts PowerPoint Templates because you have a good idea of the roadmap to your desired destination. Download and present our Shapes PowerPoint Templates because this diagram provides trainers a tool to teach the procedure in a highly visual, engaging way. Present our Business PowerPoint Templates because it enlightens your team and colleagues on the critical factors involved. Present our Flow Charts PowerPoint Templates because it outlines the process with this innovative graphic to authenticate your plan of achieving the goal of added value/profit.Use these PowerPoint slides for presentations relating to 3d, abstract, all, around, arrow, aspect, attention, attract, blue, center, collect, colorful, conceptual, converge, course, cutout, direct, direction, factor, gather, globalization, go, green, guide, illustration, indicate, integration, isolated, location, many, movement, point, pointer, rainbow, reach, red, round, show, sides, sign, source, sphere, strategy, summon, symbol, target, unity, way, white, yellow. The prominent colors used in the PowerPoint template are Blue, Gray, Black. Presenters tell us our steps layout with converging arrows pointing to center Charts and Diagrams PowerPoint Slides are Royal. The feedback we get is that our aspect PowerPoint templates and PPT Slides are Clever. Presenters tell us our steps layout with converging arrows pointing to center Charts and Diagrams PowerPoint Slides are designed to make your presentations professional. You can be sure our attention PowerPoint templates and PPT Slides are Spectacular. People tell us our steps layout with converging arrows pointing to center Charts and Diagrams PowerPoint Slides are Ultra. PowerPoint presentation experts tell us our attract PowerPoint templates and PPT Slides are Endearing. Monitor plans with our Steps Layout With Converging Arrows Pointing To Center Charts And Diagrams PowerPoint Slides. Download without worries with our money back guaranteee.
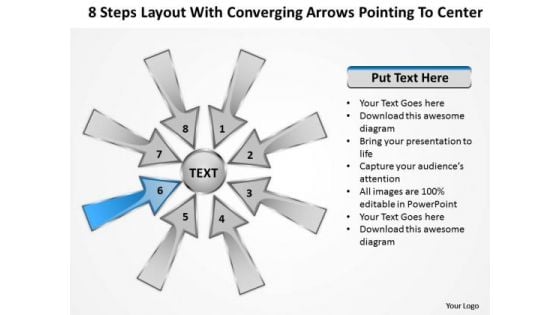
Steps Layout With Converging Arrows Pointing To Center Charts And Diagrams PowerPoint Slide
We present our steps layout with converging arrows pointing to center Charts and Diagrams PowerPoint Slide.Download our Arrows PowerPoint Templates because health of the determines the quality of our lives. Download and present our Circle Charts PowerPoint Templates because Our PowerPoint Templates and Slides will provide weight to your words. They will bring out the depth of your thought process. Use our Shapes PowerPoint Templates because it enlightens your team and colleagues on the critical factors involved. Download and present our Business PowerPoint Templates because this layout helps you to bring some important aspects of your business process to the notice of all concerned. Streamline the flow of information across the board. Download our Flow Charts PowerPoint Templates because Our PowerPoint Templates and Slides will let Your superior ideas hit the target always and everytime.Use these PowerPoint slides for presentations relating to 3d, abstract, all, around, arrow, aspect, attention, attract, blue, center, collect, colorful, conceptual, converge, course, cutout, direct, direction, factor, gather, globalization, go, green, guide, illustration, indicate, integration, isolated, location, many, movement, point, pointer, rainbow, reach, red, round, show, sides, sign, source, sphere, strategy, summon, symbol, target, unity, way, white, yellow. The prominent colors used in the PowerPoint template are Blue, Gray, Black. Presenters tell us our steps layout with converging arrows pointing to center Charts and Diagrams PowerPoint Slide are Quaint. The feedback we get is that our blue PowerPoint templates and PPT Slides are Great. Presenters tell us our steps layout with converging arrows pointing to center Charts and Diagrams PowerPoint Slide are designed by professionals You can be sure our arrow PowerPoint templates and PPT Slides are Whimsical. People tell us our steps layout with converging arrows pointing to center Charts and Diagrams PowerPoint Slide are Lush. PowerPoint presentation experts tell us our all PowerPoint templates and PPT Slides are Luxurious. You will find our Steps Layout With Converging Arrows Pointing To Center Charts And Diagrams PowerPoint Slide fighting fit. They will give you able-bodied assistance.
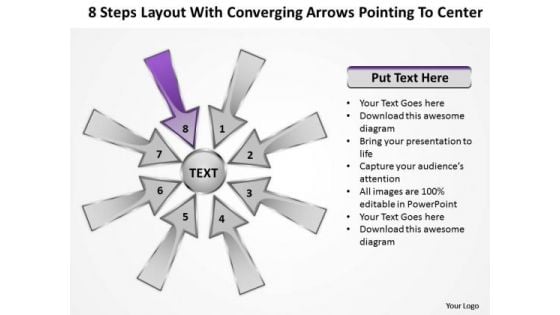
Steps Layout With Converging Arrow Pointing To Center Ppt Charts And Diagrams PowerPoint Slides
We present our steps layout with converging arrow pointing to center ppt Charts and Diagrams PowerPoint Slides.Present our Arrows PowerPoint Templates because Our PowerPoint Templates and Slides are the chords of your song. String them along and provide the lilt to your views. Use our Circle Charts PowerPoint Templates because you have a clear vision of the cake you want. Download our Shapes PowerPoint Templates because they will help you to organise the logic of your views. Present our Business PowerPoint Templates because you are ready to flap your wings and launch off. All poised are you to touch the sky with glory. Use our Flow Charts PowerPoint Templates because you are ready to flap your wings and launch off. All poised are you to touch the sky with glory.Use these PowerPoint slides for presentations relating to 3d, abstract, all, around, arrow, aspect, attention, attract, blue, center, collect, colorful, conceptual, converge, course, cutout, direct, direction, factor, gather, globalization, go, green, guide, illustration, indicate, integration, isolated, location, many, movement, point, pointer, rainbow, reach, red, round, show, sides, sign, source, sphere, strategy, summon, symbol, target, unity, way, white, yellow. The prominent colors used in the PowerPoint template are Purple, Gray, Black. Presenters tell us our steps layout with converging arrow pointing to center ppt Charts and Diagrams PowerPoint Slides are Chic. The feedback we get is that our all PowerPoint templates and PPT Slides are Swanky. Presenters tell us our steps layout with converging arrow pointing to center ppt Charts and Diagrams PowerPoint Slides are Pretty. You can be sure our aspect PowerPoint templates and PPT Slides are incredible easy to use. People tell us our steps layout with converging arrow pointing to center ppt Charts and Diagrams PowerPoint Slides are Graceful. PowerPoint presentation experts tell us our aspect PowerPoint templates and PPT Slides are Charming. Analyse the figures with our Steps Layout With Converging Arrow Pointing To Center Ppt Charts And Diagrams PowerPoint Slides. You will find answers emerging.
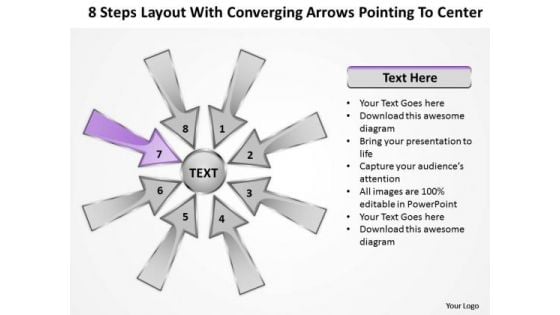
Steps Layout With Converging Arrows Pointing To Center Ppt Charts And Diagrams PowerPoint Slides
We present our steps layout with converging arrows pointing to center ppt Charts and Diagrams PowerPoint Slides.Present our Arrows PowerPoint Templates because this slide can help to bullet point your views. Download our Circle Charts PowerPoint Templates because you know your business and have a vision for it. Download and present our Shapes PowerPoint Templates because with the help of our Slides you can Illustrate these thoughts with this slide. Use our Business PowerPoint Templates because maximising sales of your product is the intended destination. Present our Flow Charts PowerPoint Templates because you require care and diligence to function well.Use these PowerPoint slides for presentations relating to 3d, abstract, all, around, arrow, aspect, attention, attract, blue, center, collect, colorful, conceptual, converge, course, cutout, direct, direction, factor, gather, globalization, go, green, guide, illustration, indicate, integration, isolated, location, many, movement, point, pointer, rainbow, reach, red, round, show, sides, sign, source, sphere, strategy, summon, symbol, target, unity, way, white, yellow. The prominent colors used in the PowerPoint template are Purple, Gray, Black. Presenters tell us our steps layout with converging arrows pointing to center ppt Charts and Diagrams PowerPoint Slides are Amazing. The feedback we get is that our attention PowerPoint templates and PPT Slides are second to none. Presenters tell us our steps layout with converging arrows pointing to center ppt Charts and Diagrams PowerPoint Slides are visually appealing. You can be sure our aspect PowerPoint templates and PPT Slides are Multicolored. People tell us our steps layout with converging arrows pointing to center ppt Charts and Diagrams PowerPoint Slides are Endearing. PowerPoint presentation experts tell us our around PowerPoint templates and PPT Slides are Majestic. Become a genius with our Steps Layout With Converging Arrows Pointing To Center Ppt Charts And Diagrams PowerPoint Slides. You will come out on top.
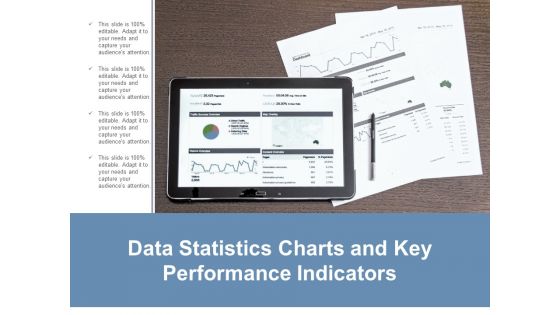
Data Statistics Charts And Key Performance Indicators Ppt Powerpoint Presentation Layouts Guide
This is a data statistics charts and key performance indicators ppt powerpoint presentation layouts guide. This is a four stage process. The stages in this process are business metrics, business kpi, business dashboard.
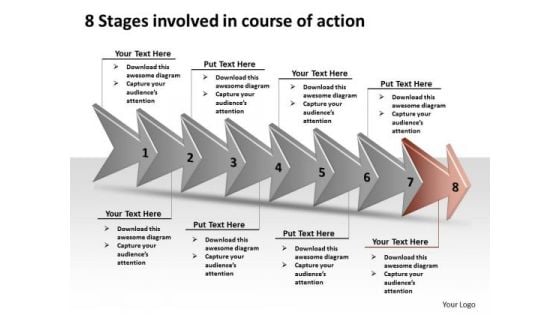
8 Stages Involved Course Of Action Ppt Production Flow Charts PowerPoint Slides
We present our 8 stages involved course of action ppt production flow charts PowerPoint Slides.Download our Leadership PowerPoint Templates because this diagram can be used to illustrate the logical path or system. Download our Shapes PowerPoint Templates because it Educates your team with your thoughts and logic. Present our Signs PowerPoint Templates because some opportunities are bound to be highly profitable for you to follow up. Use our Arrows PowerPoint Templates because we all know that alphabetical order is a time honoured concept. Download our Process and Flows PowerPoint Templates because this slide helps you to give your team an overview of your capability and insight into the minute details of the overall picture highlighting the interdependence at every operational level.Use these PowerPoint slides for presentations relating to Around, Arrows, artistic, bevel, bright, concept, conceptual, decrease, design, direction, down, ecology, high, icon, illustration, increase, indication, isolated, low, motion, movement, nature, opposite, point, protection, recycling, red, reflection, renewable, reuse, set, shinning, sign, stylish, symbol. The prominent colors used in the PowerPoint template are White, Black, Gray. The feedback we get is that our 8 stages involved course of action ppt production flow charts PowerPoint Slides are Youthful. People tell us our decrease PowerPoint templates and PPT Slides are Wistful. We assure you our 8 stages involved course of action ppt production flow charts PowerPoint Slides are Striking. Presenters tell us our design PowerPoint templates and PPT Slides are Gorgeous. We assure you our 8 stages involved course of action ppt production flow charts PowerPoint Slides are Charming. Use our concept PowerPoint templates and PPT Slides are Dynamic. Try our 8 Stages Involved Course Of Action Ppt Production Flow Charts PowerPoint Slides and get bitten by the bug. You will cease to consider anything else.
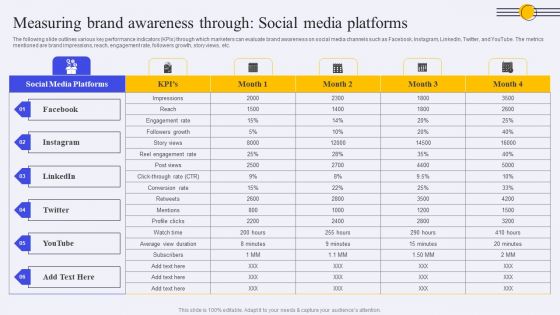
Measuring Brand Awareness Through Social Media Platforms Ppt PowerPoint Presentation Diagram Graph Charts PDF
The following slide outlines various key performance indicators KPIs through which marketers can evaluate brand awareness on social media channels such as Facebook, Instagram, LinkedIn, Twitter, and YouTube. The metrics mentioned are brand impressions, reach, engagement rate, followers growth, story views, etc. The best PPT templates are a great way to save time, energy, and resources. Slidegeeks have 100 percent editable powerpoint slides making them incredibly versatile. With these quality presentation templates, you can create a captivating and memorable presentation by combining visually appealing slides and effectively communicating your message. Download Measuring Brand Awareness Through Social Media Platforms Ppt PowerPoint Presentation Diagram Graph Charts PDF from Slidegeeks and deliver a wonderful presentation.
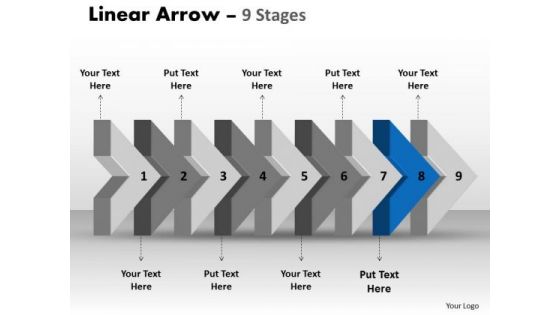
Ppt Theme Beeline Flow Manner Charts Arrow Ishikawa Diagram PowerPoint Template 9 Design
We present our PPT Theme beeline flow manner charts arrow ishikawa diagram PowerPoint template 9 design. Use our Arrows PowerPoint Templates because, you have a great training programmed in mind to upgrade the skills of your staff. Use our Symbol PowerPoint Templates because, to achieve sure shot success they need to come together at the right time, place and manner. Use our Business PowerPoint Templates because, Marketing Strategy Business Template: - Maximizing sales of your product is the intended destination. Use our Process and Flows PowerPoint Templates because, our ready backdrops leave a lasting impression. Use our Marketing PowerPoint Templates because, you have the people in place, selected the team leaders and all are raring to go. Use these PowerPoint slides for presentations relating to Aim, Angle, Arrow, Arrowheads, Badge, Banner, Connection, Curve, Design, Direction, Download, Element, Fuchsia, Icon, Illustration, Indicator, Internet, Label, Link, Magenta, Mark, Marker, Next, Object, Orientation, Pointer, Shadow, Shape, Signs, Symbol. The prominent colors used in the PowerPoint template are Blue, Gray, and Black Become a leader with our Ppt Theme Beeline Flow Manner Charts Arrow Ishikawa Diagram PowerPoint Template 9 Design. You will come out on top.
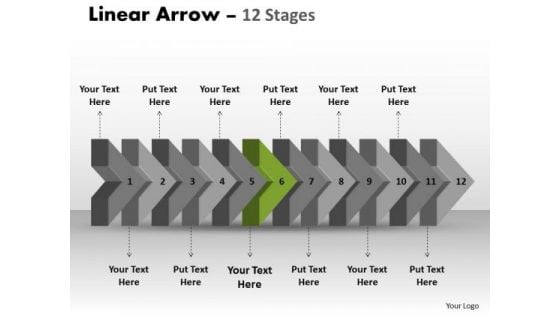
Ppt Theme 3d Illustration Of Straightaway Arrow Flow Activity Charts Diagram 7 Image
We present our PPT Theme 3d illustration of straightaway arrow flow activity charts diagram 7 Image. Use our Arrows PowerPoint Templates because, Like your thoughts arrows are inherently precise and true. Use our Symbol PowerPoint Templates because; represent the progress in our lives. Use our Business PowerPoint Templates because, You have the process in your head, our template design showing will illuminate your thoughts. Use our Process and Flows PowerPoint Templates because, you have analyzed the illness and know the need. Use our Marketing PowerPoint Templates because, now fire the arrows to emblazon the desired path by which you will achieve anticipated results. Use these PowerPoint slides for presentations relating to Aim, Angle, Arrow, Arrowheads, Badge, Banner, Connection, Curve, Design, Direction, Download, Element, Fuchsia, Icon, Illustration, Indicator, Internet, Label, Link, Magenta, Mark, Marker, Next, Object, Orientation, Pointer, Shadow, Shape, Signs, Symbol. The prominent colors used in the PowerPoint template are Green, Gray, and Black Dare to dream with our Ppt Theme 3d Illustration Of Straightaway Arrow Flow Activity Charts Diagram 7 Image. You will come out on top.
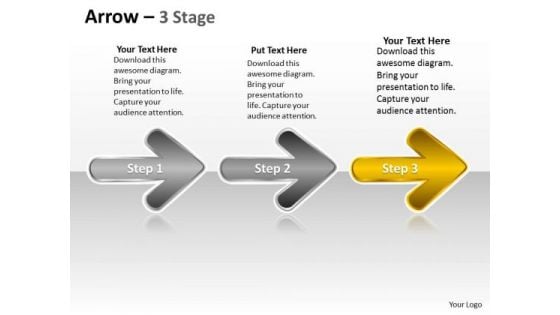
Ppt Series Of Continual Free Custom Presentation PowerPoint Charts Plan 4 Image
We present our PPT series of continual free custom presentation PowerPoint charts plan 4 Image. Use our Symbol PowerPoint Templates because, Brilliant ideas are your forte. Use our Shapes PowerPoint Templates because, Focus on each one and investigate which one would be the best fit for your needs. Use our Signs PowerPoint Templates because; Focus the light on the path to sure shot success. Use our Business PowerPoint Templates because; now imprint them on the minds of your audience via our slides. Use our Arrows PowerPoint Templates because; educate your staff on the means to provide the required support for speedy recovery. Use these PowerPoint slides for presentations relating to arrow, arrowheads, badge, banner, cerulean, colored, colorful, connection, design element, designator, directional, download, emblem, indicator, interface, internet, magenta, marker, matted, menu tool, navigation panel, next, orientation, page site, pictogram, pointer, sign. The prominent colors used in the PowerPoint template are Yellow, Gray, and White Subscribe to our Ppt Series Of Continual Free Custom Presentation PowerPoint Charts Plan 4 Image and receive success. Be assured of finding the best projection to highlight your words.
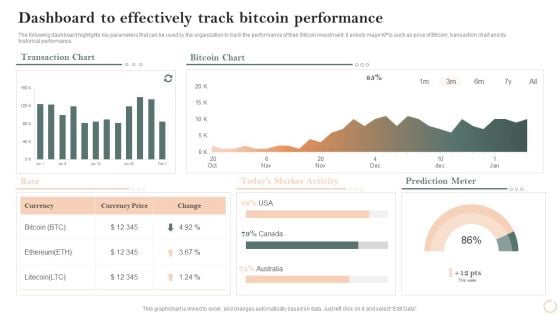
Virtual Assets Investment Guide Dashboard To Effectively Track Bitcoin Performance Rules PDF
The following dashboard highlights key parameters that can be used by the organization to track the performance of their Bitcoin investment, it enlists major KPIs such as price of Bitcoin, transaction chart and its historical performance. Deliver an awe inspiring pitch with this creative Virtual Assets Investment Guide Dashboard To Effectively Track Bitcoin Performance Rules PDF bundle. Topics like Bitcoin Chart, Transaction Chart, Prediction Meter can be discussed with this completely editable template. It is available for immediate download depending on the needs and requirements of the user.
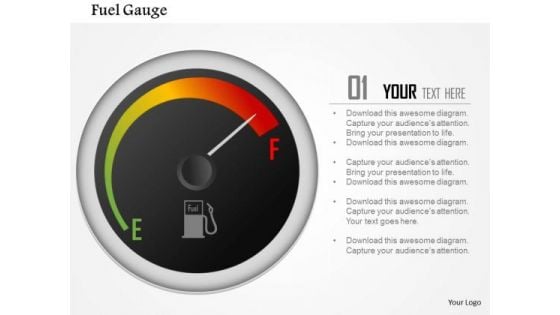
Business Framework Fuel Gauge Indicator PowerPoint Presentation
This diagram displays framework of fuel gauge indicator. It contains graphic of black meter indicating the fuel gauge. Use this editable diagram for your business and technology related presentations.
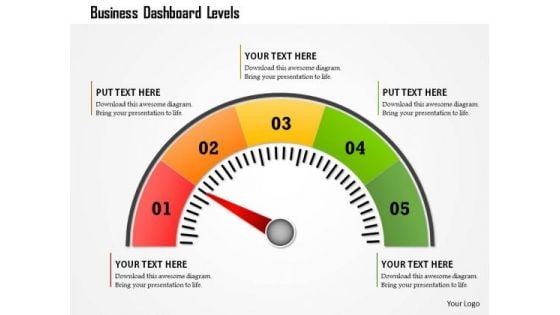
Business Framework Business Dashboard Levels PowerPoint Presentation
This business diagram displays colored meter with multiple levels. Use this diagram to display business process. This diagram can be used to indicate performance measures. This is an excellent diagram to impress your audiences.

Virtual Currency Investment Guide For Companies Dashboard To Effectively Track Bitcoin Diagrams PDF
The following dashboard highlights key parameters that can be used by the organization to track the performance of their bitcoin investment, it enlists major KPIs such as price of bitcoin, transaction chart and its historical performance. Deliver an awe inspiring pitch with this creative Virtual Currency Investment Guide For Companies Dashboard To Effectively Track Bitcoin Diagrams PDF bundle. Topics like Prediction Meter, Todays Market Activity, Transaction Chart can be discussed with this completely editable template. It is available for immediate download depending on the needs and requirements of the user.
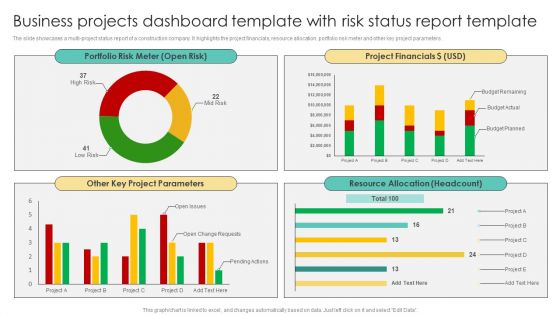
Business Projects Dashboard Template With Risk Status Report Template Topics PDF
The slide showcases a multi-project status report of a construction company. It highlights the project financials, resource allocation, portfolio risk meter and other key project parameters. Pitch your topic with ease and precision using this Business Projects Dashboard Template With Risk Status Report Template Topics PDF. This layout presents information on Portfolio Risk Meter, Project Financials, Project Parameters, Resource Allocation. It is also available for immediate download and adjustment. So, changes can be made in the color, design, graphics or any other component to create a unique layout.
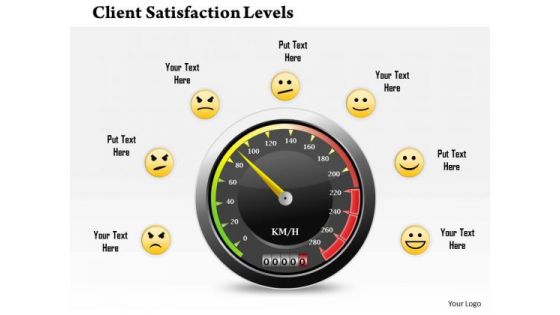
Business Framework Client Satisfaction Levels PowerPoint Presentation
Graphic of black meter has been used to design this business diagram. This business slide displays the concept of client satisfaction with different levels. Use this editable diagram for customer and business related presentations.
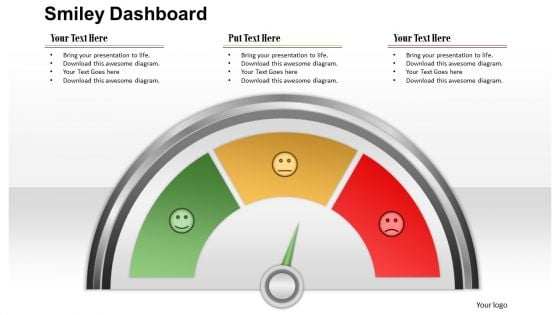
Business Framework Smiley Dashboard PowerPoint Presentation
This Power Point template slide has been designed with graphic of dashboard with meter diagram. This PPT slide contains the concept of maximum achievement. Use this PPT slide in your business presentations.
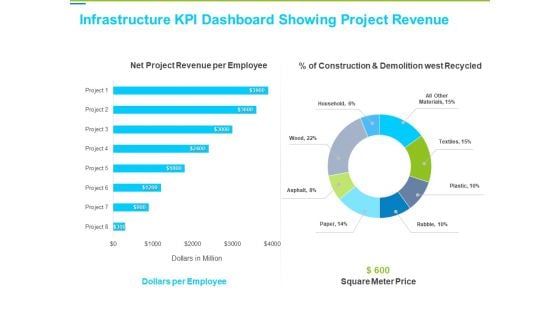
Framework Administration Infrastructure KPI Dashboard Showing Project Revenue Background PDF
Deliver an awe-inspiring pitch with this creative framework administration infrastructure kpi dashboard showing project revenue background pdf bundle. Topics like net project revenue per employee, dollars per employee, square meter price can be discussed with this completely editable template. It is available for immediate download depending on the needs and requirements of the user.
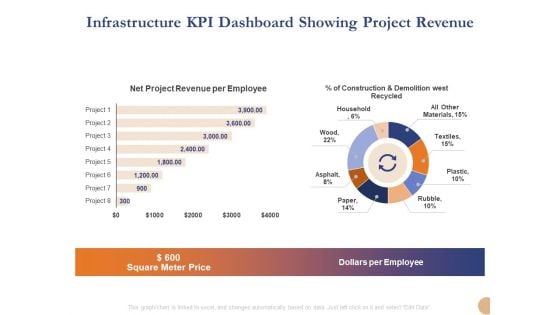
Substructure Segment Analysis Infrastructure KPI Dashboard Showing Project Revenue Summary PDF
Deliver and pitch your topic in the best possible manner with this substructure segment analysis infrastructure kpi dashboard showing project revenue summary pdf. Use them to share invaluable insights on square meter price, dollars per employee, net project revenue per employee and impress your audience. This template can be altered and modified as per your expectations. So, grab it now.
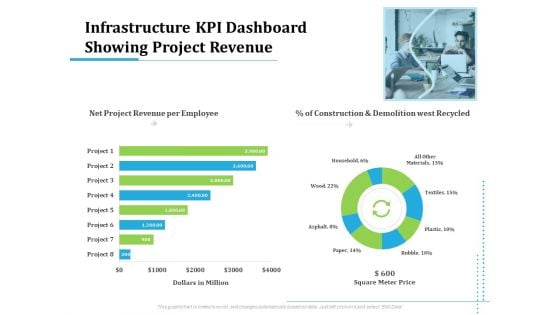
Information Technology Functions Management Infrastructure KPI Dashboard Showing Project Revenue Ppt Show Information PDF
Deliver an awe-inspiring pitch with this creative information technology functions management infrastructure kpi dashboard showing project revenue ppt show information pdf bundle. Topics like net project revenue per employee, construction and demolition west recycled, dollars million, square meter price, project can be discussed with this completely editable template. It is available for immediate download depending on the needs and requirements of the user.
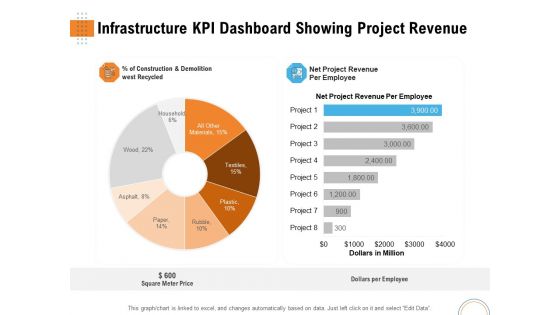
Utilizing Infrastructure Management Using Latest Methods Infrastructure KPI Dashboard Showing Project Revenue Background PDF
Deliver an awe-inspiring pitch with this creative utilizing infrastructure management using latest methods infrastructure kpi dashboard showing project revenue background pdf bundle. Topics like net project revenue per employee, construction and demolition west recycled, dollars million, square meter price, project can be discussed with this completely editable template. It is available for immediate download depending on the needs and requirements of the user.
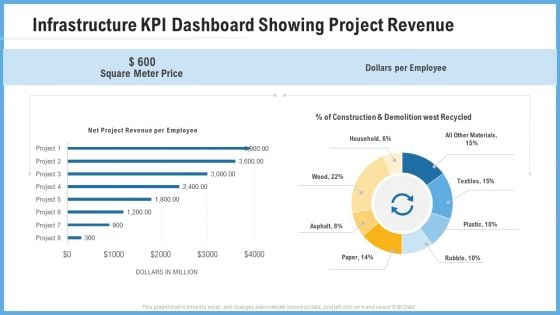
Improving Operational Activities Enterprise Infrastructure Kpi Dashboard Showing Project Revenue Professional PDF
Deliver an awe inspiring pitch with this creative improving operational activities enterprise infrastructure kpi dashboard showing project revenue professional pdf bundle. Topics like square meter price, dollars per employee can be discussed with this completely editable template. It is available for immediate download depending on the needs and requirements of the user.
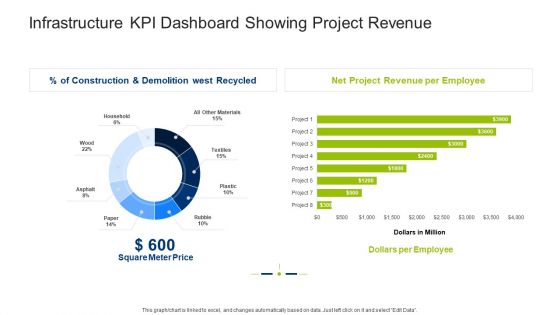
Infrastructure Building Administration Infrastructure KPI Dashboard Showing Project Revenue Clipart PDF
Deliver an awe inspiring pitch with this creative infrastructure building administration infrastructure kpi dashboard showing project revenue clipart pdf bundle. Topics like square meter price, net project revenue per employee, dollars per employee can be discussed with this completely editable template. It is available for immediate download depending on the needs and requirements of the user.
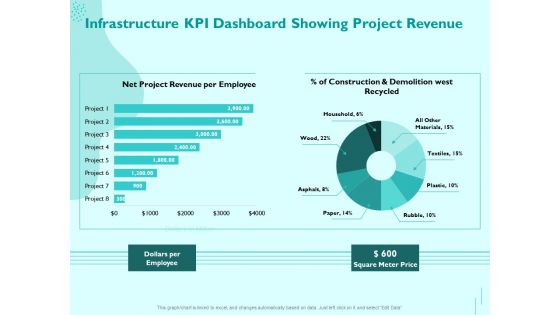
Managing IT Operating System Infrastructure KPI Dashboard Showing Project Revenue Diagrams PDF
Presenting this set of slides with name managing it operating system infrastructure kpi dashboard showing project revenue diagrams pdf. The topics discussed in these slides are dollars per employee, square meter price. This is a completely editable PowerPoint presentation and is available for immediate download. Download now and impress your audience.
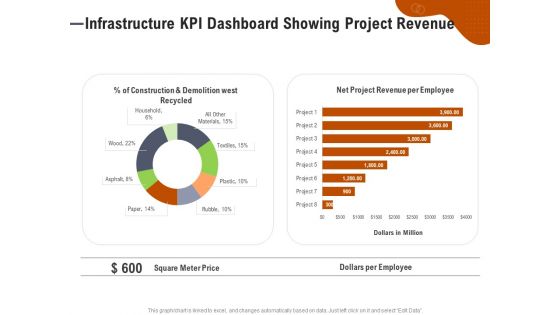
Key Features For Effective Business Management Infrastructure KPI Dashboard Showing Project Revenue Ppt Ideas File Formats PDF
Presenting this set of slides with name key features for effective business management infrastructure kpi dashboard showing project revenue ppt ideas file formats pdf. The topics discussed in these slides are construction and demolition west recycled, net project revenue per employee, square meter price, dollars per employee. This is a completely editable PowerPoint presentation and is available for immediate download. Download now and impress your audience.
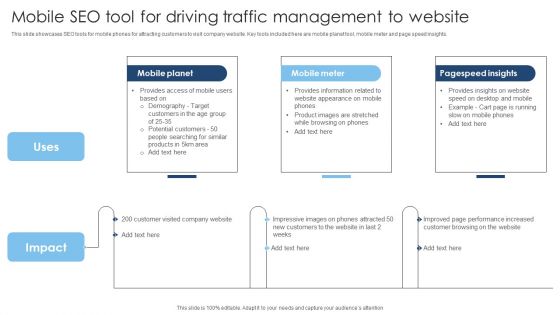
Mobile SEO Tool For Driving Traffic Management To Website Demonstration PDF
This slide showcases SEO tools for mobile phones for attracting customers to visit company website. Key tools included here are mobile planet tool, mobile meter and page speed insights. Presenting Mobile SEO Tool For Driving Traffic Management To Website Demonstration PDF to dispense important information. This template comprises three stages. It also presents valuable insights into the topics including Mobile Planet, Mobile Meter, Pagespeed Insights . This is a completely customizable PowerPoint theme that can be put to use immediately. So, download it and address the topic impactfully.


 Continue with Email

 Home
Home


