Meter Chart
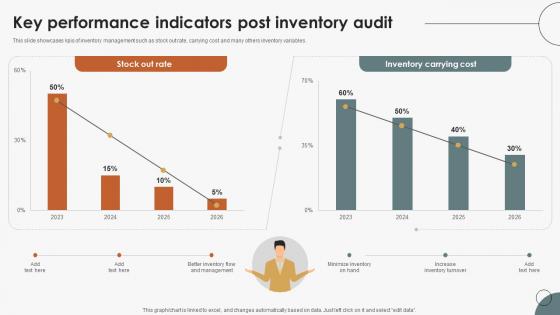
Boosting Efficiency In Inventory Key Performance Indicators Post Inventory Audit
This slide showcases kpis of inventory management such as stock out rate, carrying cost and many others inventory variables. Make sure to capture your audiences attention in your business displays with our gratis customizable Boosting Efficiency In Inventory Key Performance Indicators Post Inventory Audit. These are great for business strategies, office conferences, capital raising or task suggestions. If you desire to acquire more customers for your tech business and ensure they stay satisfied, create your own sales presentation with these plain slides. This slide showcases kpis of inventory management such as stock out rate, carrying cost and many others inventory variables.
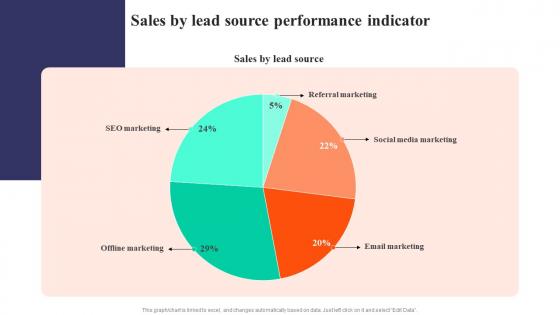
Sales By Lead Source Performance Indicator Strategies To Develop Successful Guidelines Pdf
This modern and well-arranged Sales By Lead Source Performance Indicator Strategies To Develop Successful Guidelines Pdf provides lots of creative possibilities. It is very simple to customize and edit with the Powerpoint Software. Just drag and drop your pictures into the shapes. All facets of this template can be edited with Powerpoint no extra software is necessary. Add your own material, put your images in the places assigned for them, adjust the colors, and then you can show your slides to the world, with an animated slide included. Our Sales By Lead Source Performance Indicator Strategies To Develop Successful Guidelines Pdf are topically designed to provide an attractive backdrop to any subject. Use them to look like a presentation pro.
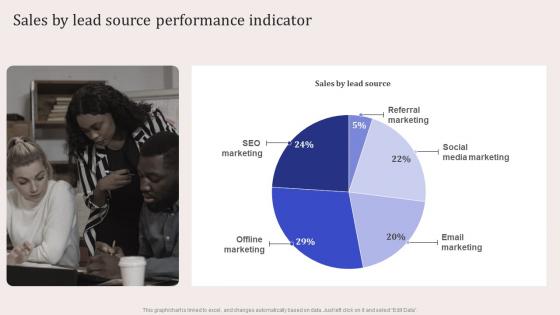
Sales By Lead Source Performance Indicator Virtual Event Promotion To Capture Infographics Pdf
The Sales By Lead Source Performance Indicator Virtual Event Promotion To Capture Infographics Pdf is a compilation of the most recent design trends as a series of slides. It is suitable for any subject or industry presentation, containing attractive visuals and photo spots for businesses to clearly express their messages. This template contains a variety of slides for the user to input data, such as structures to contrast two elements, bullet points, and slides for written information. Slidegeeks is prepared to create an impression. Our Sales By Lead Source Performance Indicator Virtual Event Promotion To Capture Infographics Pdf are topically designed to provide an attractive backdrop to any subject. Use them to look like a presentation pro.
Linkedin Content Strategies Ad Campaign Performance Indicators Tracking MKT SS V
This slide covers dashboard to measure the performance of ad campaigns on LinkedIn platform. The purpose of this template is to provide the company an overview on the outcomes of running ad campaigns on LinkedIn. It includes performance based on impressions, CTR, engagement rates, CPC, CPM, etc. There are so many reasons you need a Linkedin Content Strategies Ad Campaign Performance Indicators Tracking MKT SS V. The first reason is you can not spend time making everything from scratch, Thus, Slidegeeks has made presentation templates for you too. You can easily download these templates from our website easily. This slide covers dashboard to measure the performance of ad campaigns on LinkedIn platform. The purpose of this template is to provide the company an overview on the outcomes of running ad campaigns on LinkedIn. It includes performance based on impressions, CTR, engagement rates, CPC, CPM, etc.

Manufacturing Plant Sustainability Dashboard Indicating Sourcing And Consumption Ppt Slide SS
The following slide showcases business sustainability innovation model. It provides information about public policy, business case, financing, company level, stakeholders, etc. The Manufacturing Plant Sustainability Dashboard Indicating Sourcing And Consumption Ppt Slide SS is a compilation of the most recent design trends as a series of slides. It is suitable for any subject or industry presentation, containing attractive visuals and photo spots for businesses to clearly express their messages. This template contains a variety of slides for the user to input data, such as structures to contrast two elements, bullet points, and slides for written information. Slidegeeks is prepared to create an impression. The following slide showcases business sustainability innovation model. It provides information about public policy, business case, financing, company level, stakeholders, etc.
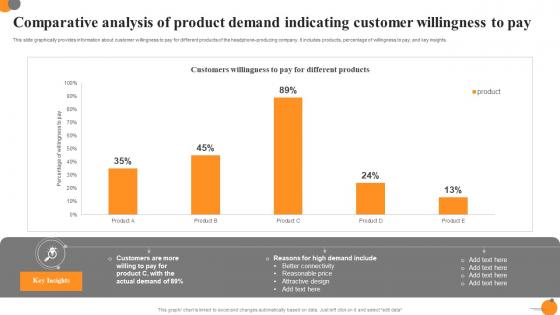
Comparative Analysis Of Product Demand Indicating Customer Willingness To Pay Ppt Gallery Influencers Pdf
This slide graphically provides information about customer willingness to pay for different products of the headphone-producing company. It includes products, percentage of willingness to pay, and key insights. Pitch your topic with ease and precision using this Comparative Analysis Of Product Demand Indicating Customer Willingness To Pay Ppt Gallery Influencers Pdf. This layout presents information on Customers, Willingness To Pay, Different Products. It is also available for immediate download and adjustment. So, changes can be made in the color, design, graphics or any other component to create a unique layout. This slide graphically provides information about customer willingness to pay for different products of the headphone-producing company. It includes products, percentage of willingness to pay, and key insights.
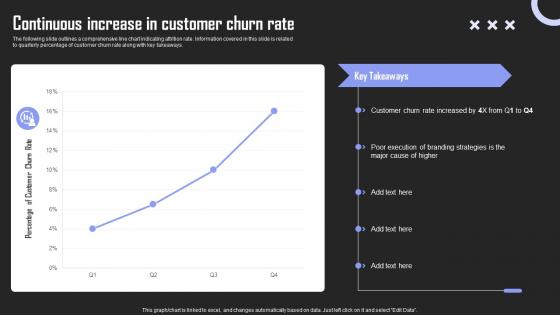
Continuous Increase Rate Brand Building Techniques To Gain Competitive Edge Summary Pdf
The following slide outlines a comprehensive line chart indicating attrition rate. Information covered in this slide is related to quarterly percentage of customer churn rate along with key takeaways. Whether you have daily or monthly meetings, a brilliant presentation is necessary. Continuous Increase Rate Brand Building Techniques To Gain Competitive Edge Summary Pdf can be your best option for delivering a presentation. Represent everything in detail using Continuous Increase Rate Brand Building Techniques To Gain Competitive Edge Summary Pdf and make yourself stand out in meetings. The template is versatile and follows a structure that will cater to your requirements. All the templates prepared by Slidegeeks are easy to download and edit. Our research experts have taken care of the corporate themes as well. So, give it a try and see the results. The following slide outlines a comprehensive line chart indicating attrition rate. Information covered in this slide is related to quarterly percentage of customer churn rate along with key takeaways.
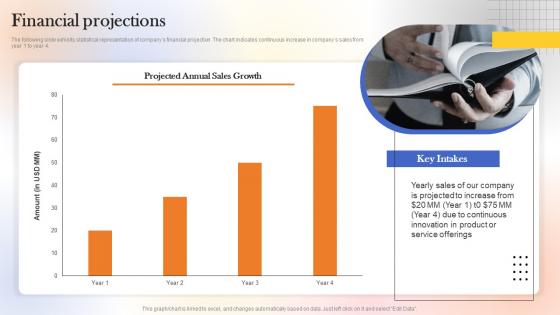
Financial Projections Web Designing Platform Fundraising Pitch Deck Microsoft Pdf
The following slide exhibits statistical representation of companys financial projection. The chart indicates continuous increase in companys sales from year 1 to year 4. Whether you have daily or monthly meetings, a brilliant presentation is necessary. Financial Projections Web Designing Platform Fundraising Pitch Deck Microsoft Pdf can be your best option for delivering a presentation. Represent everything in detail using Financial Projections Web Designing Platform Fundraising Pitch Deck Microsoft Pdf and make yourself stand out in meetings. The template is versatile and follows a structure that will cater to your requirements. All the templates prepared by Slidegeeks are easy to download and edit. Our research experts have taken care of the corporate themes as well. So, give it a try and see the results. The following slide exhibits statistical representation of companys financial projection. The chart indicates continuous increase in companys sales from year 1 to year 4.
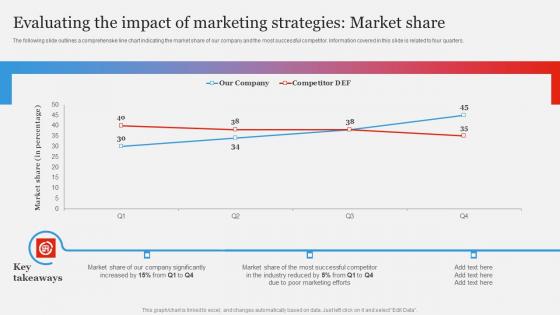
Branding Strategy To Gain Competitive Edge Evaluating Impact Marketing Demonstration Pdf
The following slide outlines a comprehensive line chart indicating the market share of our company and the most successful competitor. Information covered in this slide is related to four quarters. Slidegeeks is one of the best resources for PowerPoint templates. You can download easily and regulate Branding Strategy To Gain Competitive Edge Evaluating Impact Marketing Demonstration Pdf for your personal presentations from our wonderful collection. A few clicks is all it takes to discover and get the most relevant and appropriate templates. Use our Templates to add a unique zing and appeal to your presentation and meetings. All the slides are easy to edit and you can use them even for advertisement purposes. The following slide outlines a comprehensive line chart indicating the market share of our company and the most successful competitor. Information covered in this slide is related to four quarters.
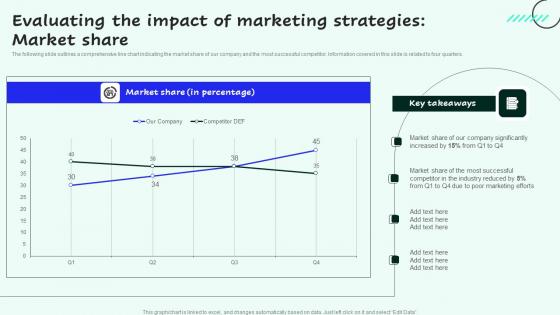
Evaluating The Impact Of Marketing Strategies For Enhancing Sales And Profitability Elements Pdf
The following slide outlines a comprehensive line chart indicating the market share of our company and the most successful competitor. Information covered in this slide is related to four quarters.Present like a pro with Evaluating The Impact Of Marketing Strategies For Enhancing Sales And Profitability Elements Pdf Create beautiful presentations together with your team, using our easy to use presentation slides. Share your ideas in real time and make changes on the fly by downloading our templates. So whether you are in the office, on the go, or in a remote location, you can stay in sync with your team and present your ideas with confidence. With Slidegeeks presentation got a whole lot easier. Grab these presentations today. The following slide outlines a comprehensive line chart indicating the market share of our company and the most successful competitor. Information covered in this slide is related to four quarters.
Evaluating The Impact Of Marketing Branding Strategies To Get Competitive Background Pdf
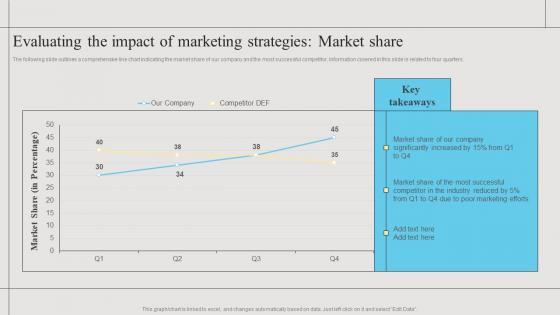
The following slide outlines a comprehensive line chart indicating the market share of our company and the most successful competitor. Information covered in this slide is related to four quarters.Do you have an important presentation coming up Are you looking for something that will make your presentation stand out from the rest Look no further than Evaluating The Impact Of Marketing Branding Strategies To Get Competitive Background Pdf. With our professional designs, you can trust that your presentation will pop and make delivering it a smooth process. And with Slidegeeks, you can trust that your presentation will be unique and memorable. So why wait Grab Evaluating The Impact Of Marketing Branding Strategies To Get Competitive Background Pdf today and make your presentation stand out from the rest. The following slide outlines a comprehensive line chart indicating the market share of our company and the most successful competitor. Information covered in this slide is related to four quarters.
Cybersecurity In Medical Industry Breach Downtime Report Designs Pdf
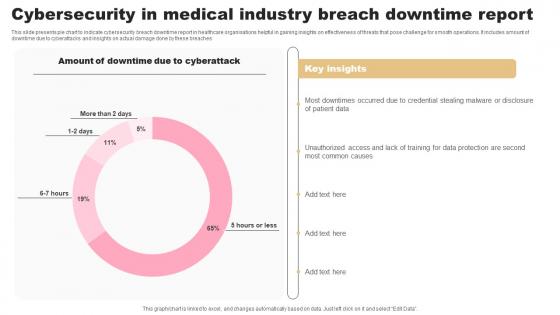
This slide presents pie chart to indicate cybersecurity breach downtime report in healthcare organisations helpful in gaining insights on effectiveness of threats that pose challenge for smooth operations. It includes amount of downtime due to cyberattacks and insights on actual damage done by these breaches Pitch your topic with ease and precision using this Cybersecurity In Medical Industry Breach Downtime Report Designs Pdf. This layout presents information on Cyberattack, Insights, Report. It is also available for immediate download and adjustment. So, changes can be made in the color, design, graphics or any other component to create a unique layout. This slide presents pie chart to indicate cybersecurity breach downtime report in healthcare organisations helpful in gaining insights on effectiveness of threats that pose challenge for smooth operations. It includes amount of downtime due to cyberattacks and insights on actual damage done by these breaches
Customer Satisfaction Levels High Medium Low Indicator Dashboard Ppt PowerPoint Presentation Icon Show
This is a customer satisfaction levels high medium low indicator dashboard ppt powerpoint presentation icon show. This is a six stage process. The stages in this process are performance dashboard, performance meter, performance kpi.

Low High Performance Measurement Indicator Dashboard Ppt PowerPoint Presentation Summary Images
This is a low high performance measurement indicator dashboard ppt powerpoint presentation summary images. This is a five stage process. The stages in this process are performance dashboard, performance meter, performance kpi.
Dashboard Vector With Pointer And Text Holders Ppt PowerPoint Presentation Portfolio Format Ideas
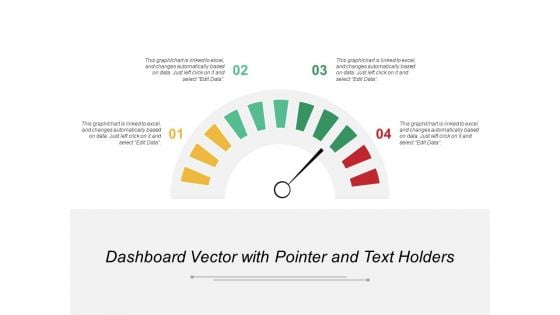
This is a dashboard vector with pointer and text holders ppt powerpoint presentation portfolio format ideas. This is a four stage process. The stages in this process are performance dashboard, performance meter, performance kpi.
Dashboards For Performance Mapping And Management Ppt PowerPoint Presentation Ideas File Formats
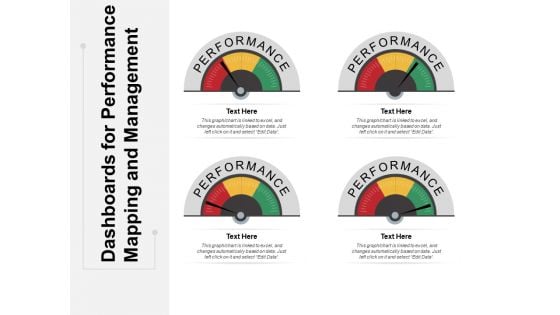
This is a dashboards for performance mapping and management ppt powerpoint presentation ideas file formats. This is a four stage process. The stages in this process are performance dashboard, performance meter, performance kpi.
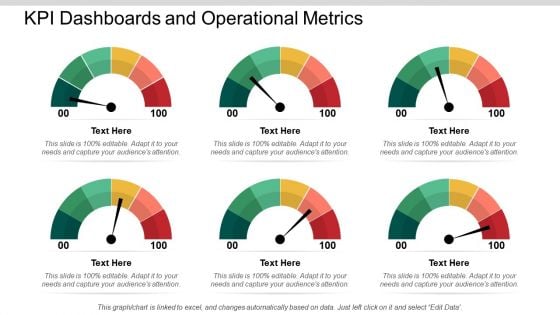
KPI Dashboards And Operational Metrics Ppt PowerPoint Presentation Portfolio Infographics
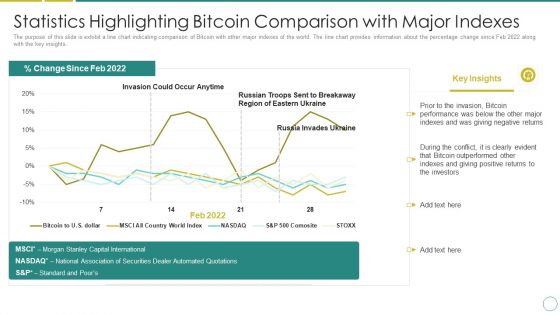
Russia Ukraine Statistics Highlighting Bitcoin Comparison With Major Indexes Mockup PDF
The purpose of this slide is exhibit a line chart indicating comparison of Bitcoin with other major indexes of the world. The line chart provides information about the percentage change since Feb 2022 along with the key insights. Deliver an awe inspiring pitch with this creative russia ukraine statistics highlighting bitcoin comparison with major indexes mockup pdf bundle. Topics like invasion could occur anytime, russia invades ukraine, bitcoin performance can be discussed with this completely editable template. It is available for immediate download depending on the needs and requirements of the user.
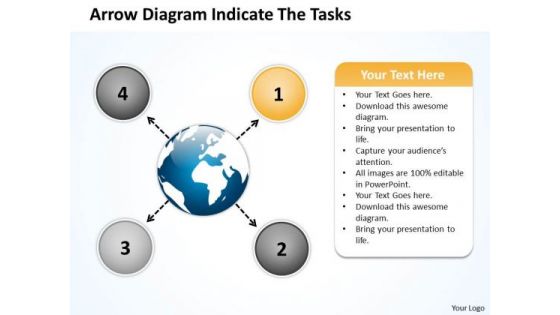
Arrow Diagram Indicate The Tasks Ppt Circular Flow Layout Process PowerPoint Slide
We present our arrow diagram indicate the tasks ppt Circular Flow Layout Process PowerPoint Slide.Download our Process and Flows PowerPoint Templates because the vision of being the market leader is clear to you. Download our Arrows PowerPoint Templates because this is a good example of the strength of teamwork. Use our Business PowerPoint Templates because this template helps you to delve on these thoughts and brief your team on the value of your depth of understanding of the subject. Download and present our Circle Charts PowerPoint Templates because the mind is always whirring with new ideas. Present our Flow Charts PowerPoint Templates because you know your business and have a vision for it.Use these PowerPoint slides for presentations relating to Arrows, choice, connect, design, direction, flows, four, info graph, instruction, layout, manual, marketing, modern, one, option, order, page, paper, pointing, process, product, promotion, sequence, simple, special, step, symbol. The prominent colors used in the PowerPoint template are Orange, Gray, Black. Presenters tell us our arrow diagram indicate the tasks ppt Circular Flow Layout Process PowerPoint Slide will help you be quick off the draw. Just enter your specific text and see your points hit home. Professionals tell us our design PowerPoint templates and PPT Slides are specially created by a professional team with vast experience. They diligently strive to come up with the right vehicle for your brilliant Ideas. PowerPoint presentation experts tell us our arrow diagram indicate the tasks ppt Circular Flow Layout Process PowerPoint Slide are Reminiscent. The feedback we get is that our direction PowerPoint templates and PPT Slides are effectively colour coded to prioritise your plans They automatically highlight the sequence of events you desire. Use our arrow diagram indicate the tasks ppt Circular Flow Layout Process PowerPoint Slide are Clever. Use our info PowerPoint templates and PPT Slides are Colorful. Get things going for you with our Arrow Diagram Indicate The Tasks Ppt Circular Flow Layout Process PowerPoint Slide. The audience will be in a favourable mood.
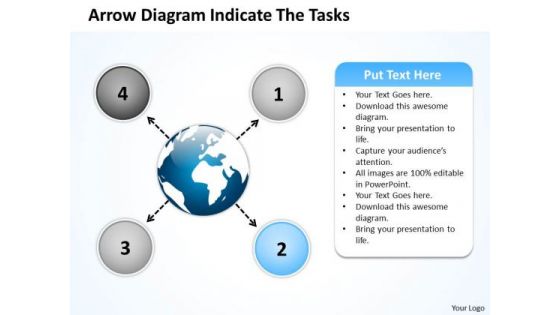
Arrow Diagram Indicate The Tasks Circular Flow Layout Process PowerPoint Slide
We present our arrow diagram indicate the tasks Circular Flow Layout Process PowerPoint Slide.Use our Process and Flows PowerPoint Templates because the atmosphere in the worplace is electric. Download and present our Arrows PowerPoint Templates because you know that the core of any organisation is the people who work for it. Use our Business PowerPoint Templates because the majestic tiger lord of all it surveys.It exudes power even when it is in repose. Download and present our Circle Charts PowerPoint Templates because you have a handle on all the targets, a master of the game, the experienced and consummate juggler. Download our Flow Charts PowerPoint Templates because this Layout can explain the relevance of the different layers and stages in getting down to your core competence, ability and desired result.Use these PowerPoint slides for presentations relating to Arrows, choice, connect, design, direction, flows, four, info graph, instruction, layout, manual, marketing, modern, one, option, order, page, paper, pointing, process, product, promotion, sequence, simple, special, step, symbol. The prominent colors used in the PowerPoint template are Blue light, Blue, Black. Presenters tell us our arrow diagram indicate the tasks Circular Flow Layout Process PowerPoint Slide are Stylish. Professionals tell us our info PowerPoint templates and PPT Slides are Fashionable. PowerPoint presentation experts tell us our arrow diagram indicate the tasks Circular Flow Layout Process PowerPoint Slide will make the presenter look like a pro even if they are not computer savvy. The feedback we get is that our connect PowerPoint templates and PPT Slides are Fashionable. Use our arrow diagram indicate the tasks Circular Flow Layout Process PowerPoint Slide are Zippy. Use our four PowerPoint templates and PPT Slides are Royal. Be a proactive manager with our Arrow Diagram Indicate The Tasks Circular Flow Layout Process PowerPoint Slide. They will make you look good.
Half Yearly Roadmap For Organization Development With Key Indicators Icons
Presenting the half yearly roadmap for organization development with key indicators icons. The template includes a roadmap that can be used to initiate a strategic plan. Not only this, the PowerPoint slideshow is completely editable and you can effortlessly modify the font size, font type, and shapes according to your needs. This PPT slide can be easily reached in standard screen and widescreen aspect ratios. The set is also available in various formats like PDF, PNG, and JPG. So download and use it multiple times as per your knowledge.
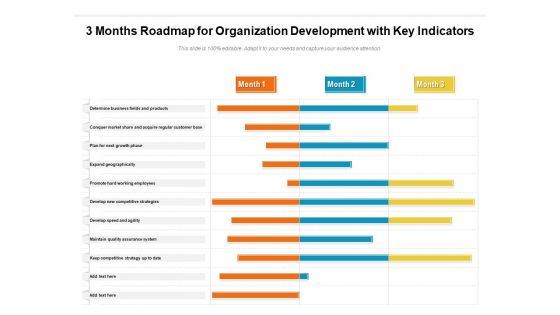
3 Months Roadmap For Organization Development With Key Indicators Guidelines
Presenting the 3 months roadmap for organization development with key indicators guidelines. The template includes a roadmap that can be used to initiate a strategic plan. Not only this, the PowerPoint slideshow is completely editable and you can effortlessly modify the font size, font type, and shapes according to your needs. This PPT slide can be easily reached in standard screen and widescreen aspect ratios. The set is also available in various formats like PDF, PNG, and JPG. So download and use it multiple times as per your knowledge.
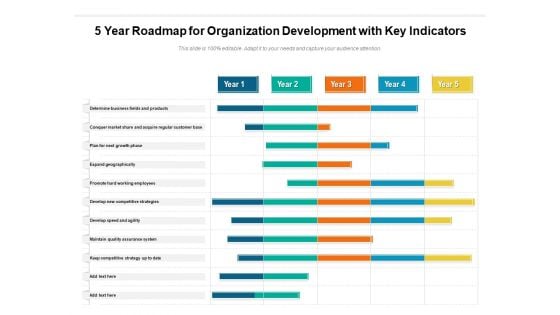
5 Year Roadmap For Organization Development With Key Indicators Clipart
Presenting the 5 year roadmap for organization development with key indicators clipart. The template includes a roadmap that can be used to initiate a strategic plan. Not only this, the PowerPoint slideshow is completely editable and you can effortlessly modify the font size, font type, and shapes according to your needs. This PPT slide can be easily reached in standard screen and widescreen aspect ratios. The set is also available in various formats like PDF, PNG, and JPG. So download and use it multiple times as per your knowledge.
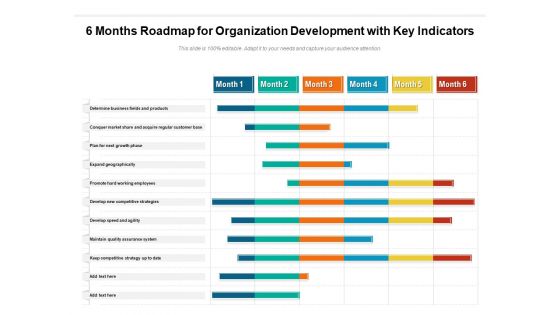
6 Months Roadmap For Organization Development With Key Indicators Topics
Presenting the 6 months roadmap for organization development with key indicators topics. The template includes a roadmap that can be used to initiate a strategic plan. Not only this, the PowerPoint slideshow is completely editable and you can effortlessly modify the font size, font type, and shapes according to your needs. This PPT slide can be easily reached in standard screen and widescreen aspect ratios. The set is also available in various formats like PDF, PNG, and JPG. So download and use it multiple times as per your knowledge.
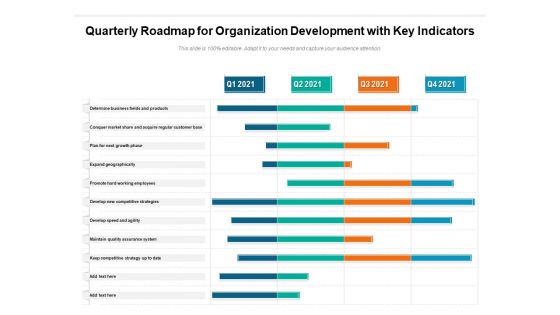
Quarterly Roadmap For Organization Development With Key Indicators Sample
Presenting the quarterly roadmap for organization development with key indicators sample. The template includes a roadmap that can be used to initiate a strategic plan. Not only this, the PowerPoint slideshow is completely editable and you can effortlessly modify the font size, font type, and shapes according to your needs. This PPT slide can be easily reached in standard screen and widescreen aspect ratios. The set is also available in various formats like PDF, PNG, and JPG. So download and use it multiple times as per your knowledge.
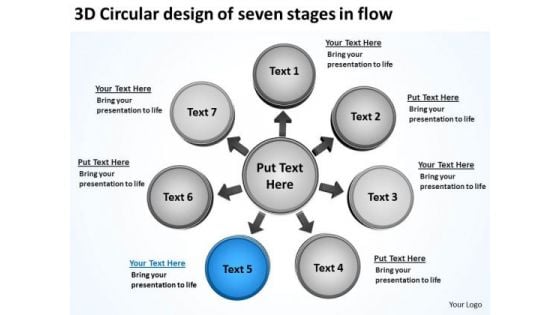
3d Circular Design Of Seven Stages In Flow Business Arrows Diagram Software PowerPoint Slides
We present our 3d circular design of seven stages in flow business Arrows Diagram Software PowerPoint Slides.Present our Business PowerPoint Templates because this template helps you to grab the attention of your listeners. Download and present our Circle charts PowerPoint Templates because sprout your thoughts into the minds of your colleagues. Download our Arrows PowerPoint Templates because they are the indicators of the path you have in mind. Use our Shapes PowerPoint Templates because this can explain the various related aspects of these varied tracks and how they will, on hitting their own targets, cumulatively contribute to hitting GOLD. Download our Flow charts PowerPoint Templates because there is a very good saying that prevention is better than cure, either way you have a store of knowledge for sure.Use these PowerPoint slides for presentations relating to Abstract, arrow, arrow, circle, business, concept, career, center, stage, chart, circle circle, connection, contrast, cycle, diagram, direction, flow flowchart, future, graph, icon, illustration, isolate, isolated, job, life, loop, money, motion network, recycle, refresh, ring, rotation, sick, sign, symbol, simply, target, wealth. The prominent colors used in the PowerPoint template are White, Gray, Blue. People tell us our 3d circular design of seven stages in flow business Arrows Diagram Software PowerPoint Slides are the best it can get when it comes to presenting. PowerPoint presentation experts tell us our stage PowerPoint templates and PPT Slides are Bright. Presenters tell us our 3d circular design of seven stages in flow business Arrows Diagram Software PowerPoint Slides are Precious. PowerPoint presentation experts tell us our concept PowerPoint templates and PPT Slides are Fabulous. People tell us our 3d circular design of seven stages in flow business Arrows Diagram Software PowerPoint Slides are Romantic. People tell us our center PowerPoint templates and PPT Slides are Swanky. Bring all different factions together for you. Our 3d Circular Design Of Seven Stages In Flow Business Arrows Diagram Software PowerPoint Slides champion camaraderie.
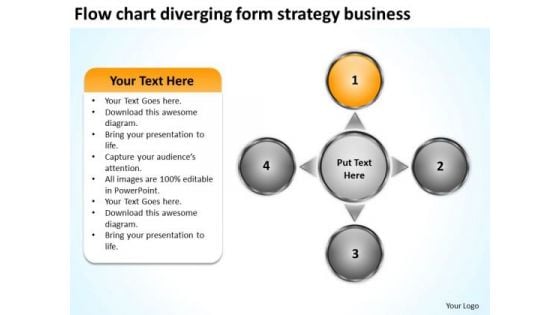
Form Strategy Business PowerPoint Presentations Cycle Arrow Process Templates
We present our form strategy business powerpoint presentations Cycle Arrow Process templates.Download our Circle Charts PowerPoint Templates because honesty is the best policy has an ardent follower in you. Use our Arrows PowerPoint Templates because they are the indicators of the path you have in mind. Download our Business PowerPoint Templates because your fledgling career is in the chrysallis stage. Nurture it and watch it grow into a beautiful butterfly. Download our Shapes PowerPoint Templates because you will be able to Highlight your ideas broad-based on strong fundamentals and illustrate how they step by step acheive the set growth factor. Download and present our Flow Charts PowerPoint Templates because you have an idea of which you are sure.Use these PowerPoint slides for presentations relating to Analysis, Analyze, Background, Blank, Business, Businessman, Center, Central, Chart, Component, Concept, Connect, Core, Decentralize, Diagram, Disperse, Disseminate, Distribute, Divide, Education, Element, Empty, Expand, Flow, Gist, Group, Industry, Link, Management, Manager, Part, Plan, Process, Scatter, Separate, Spread, Strategy, Support, Surround, Template, Transfer. The prominent colors used in the PowerPoint template are Orange, Gray, Black. We assure you our form strategy business powerpoint presentations Cycle Arrow Process templates are Quaint. We assure you our Center PowerPoint templates and PPT Slides are designed by a team of presentation professionals. Customers tell us our form strategy business powerpoint presentations Cycle Arrow Process templates are the best it can get when it comes to presenting. Presenters tell us our Center PowerPoint templates and PPT Slides are Perfect. You can be sure our form strategy business powerpoint presentations Cycle Arrow Process templates are Energetic. The feedback we get is that our Central PowerPoint templates and PPT Slides are Stunning. Our Form Strategy Business PowerPoint Presentations Cycle Arrow Process Templates can be bewitching. Put your audience under your spell.
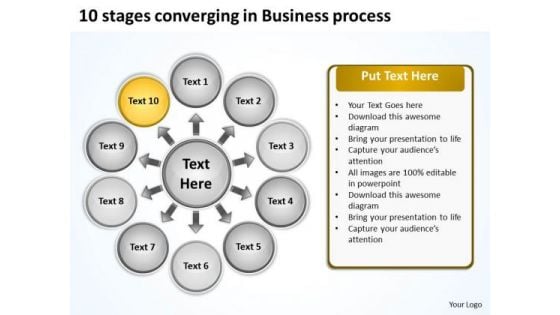
PowerPoint Templates Free Download Process Circular Flow Diagram
We present our powerpoint templates free download process Circular Flow Diagram.Download our Ring charts PowerPoint Templates because you must Evolve the strategy to take you down the required path with appropriate, efficient and effective marketing along the way. Download and present our Circle charts PowerPoint Templates because this slide Probe the minds of your colleagues, see their faces light up as they assimilate and understand the value of your suggestions. Download and present our Business PowerPoint Templates because it helps you to explain your plans in all earnest to your colleagues and raise the bar for all. Present our Process and Flows PowerPoint Templates because you know that the core of any organisation is the people who work for it. Use our Marketing PowerPoint Templates because networking is an imperative in todays world. You need to access the views of others. Similarly you need to give access to them of your abilities.Use these PowerPoint slides for presentations relating to Arrowheads, cerulean, circle, circulation, cobalt,colorful, cyan, cycle, element,emblem, grayshadow, green,icon, indicator, interface, internet, label,link, load, marker, motion, movement,navigationpanel, next, orientation, pagsite, pink, pointer, previous, process, reload, rotation, satined, sign, signpost,smooth, sticker, sticky, symbol. The prominent colors used in the PowerPoint template are Yellow, Orange, Gray. Customers tell us our powerpoint templates free download process Circular Flow Diagram are Ultra. We assure you our cobalt PowerPoint templates and PPT Slides are Magical. PowerPoint presentation experts tell us our powerpoint templates free download process Circular Flow Diagram are Awesome. People tell us our cyan PowerPoint templates and PPT Slides are Nice. We assure you our powerpoint templates free download process Circular Flow Diagram are Tasteful. Use our cobalt PowerPoint templates and PPT Slides are Efficient. Become a leader with our PowerPoint Templates Free Download Process Circular Flow Diagram. You will come out on top.
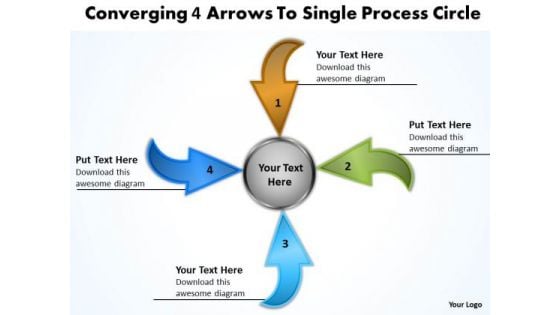
Converging 4 Arrows To Single Process Circle Pie Diagram PowerPoint Templates
We present our converging 4 arrows to single process circle Pie Diagram PowerPoint templates.Download and present our Arrows PowerPoint Templates because you will be able to Highlight your ideas broad-based on strong fundamentals and illustrate how they step by step acheive the set growth factor. Use our Circle Charts PowerPoint Templates because you can present your opinions in this field using our impressive templates. Download our Shapes PowerPoint Templates because displaying your ideas and highlighting your ability will accelerate the growth of your company and yours. Download and present our Business PowerPoint Templates because your ideas too are pinpointedly focused on you goals. Present our Flow Charts PowerPoint Templates because you can Unravel the desired and essential elements of your overall strategy.Use these PowerPoint slides for presentations relating to arrow, arrowheads, badge, banner, blue, button, cerulean, cobalt, colored, colorful, connection, cursor, cyan, design element, designator, directional, download, emblem, gray shadow, green, icon, indicator, interface, internet, link, load, magenta, marker, matted, menu tool, navigation panel, next, orientation, page site, pictogram, pink, pointer, red, right, satined, sign, signpost, smooth, symbol, upload, vector illustration, web, web 2.0, white background. The prominent colors used in the PowerPoint template are Blue, Brown, Green. Presenters tell us our converging 4 arrows to single process circle Pie Diagram PowerPoint templates are Nostalgic. You can be sure our banner PowerPoint templates and PPT Slides are Radiant. Professionals tell us our converging 4 arrows to single process circle Pie Diagram PowerPoint templates are Stylish. People tell us our colored PowerPoint templates and PPT Slides will generate and maintain the level of interest you desire. They will create the impression you want to imprint on your audience. People tell us our converging 4 arrows to single process circle Pie Diagram PowerPoint templates are Handsome. Professionals tell us our banner PowerPoint templates and PPT Slides are Efficient. Carry your thoughts on our Converging 4 Arrows To Single Process Circle Pie Diagram PowerPoint Templates. They will take them that much further.
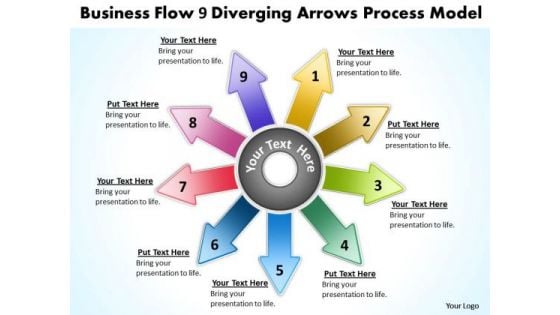
Templates Flow 9 Diverging Arrows Process Model Circular PowerPoint Slides
We present our templates flow 9 diverging arrows process model Circular PowerPoint Slides.Download our Arrows PowerPoint Templates because this template contains the material to highlight the key issues of your presentation. Use our Circle Charts PowerPoint Templates because we all know that alphabetical order is a time honoured concept. Use our Shapes PowerPoint Templates because it highlights the important timelines and milestones of this exciting journey. Download and present our Business PowerPoint Templates because your fledgling career is in the chrysallis stage. Nurture it and watch it grow into a beautiful butterfly. Download our Flow Charts PowerPoint Templates because it helps to churn the mixture to the right degree and pound home your views and expectations in a spectacularly grand and virtuoso fluid performance.Use these PowerPoint slides for presentations relating to arrow, arrowheads, badge, banner, blue, button, cerulean, cobalt, colored, colorful, connection, cursor, cyan, design element, designator, directional, download, emblem, gray shadow, green, icon, indicator, interface, internet, link, load, magenta, marker, navigation panel, next, orientation, page site, pictogram, pink, pointer, red, right, satined, sign, signpost, smooth, symbol, . The prominent colors used in the PowerPoint template are Purple, Red, Green. Presenters tell us our templates flow 9 diverging arrows process model Circular PowerPoint Slides are Detailed. You can be sure our cerulean PowerPoint templates and PPT Slides will impress their bosses and teams. Professionals tell us our templates flow 9 diverging arrows process model Circular PowerPoint Slides are Royal. People tell us our blue PowerPoint templates and PPT Slides are Ultra. People tell us our templates flow 9 diverging arrows process model Circular PowerPoint Slides are Swanky. Professionals tell us our blue PowerPoint templates and PPT Slides effectively help you save your valuable time. Our Templates Flow 9 Diverging Arrows Process Model Circular PowerPoint Slides team cater for all possibilities. You thoughts will automatically factor all in.
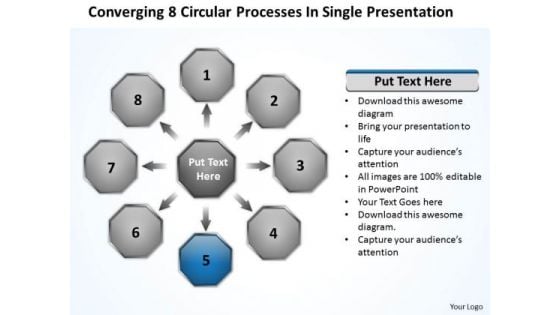
Processes In Single Presentation Relative Circular Flow Arrow Network PowerPoint Templates
We present our processes in single presentation Relative Circular Flow Arrow Network PowerPoint templates.Download and present our Arrows PowerPoint Templates because you can Show them how to churn out fresh ideas. Use our Circle Charts PowerPoint Templates because it shows various choices to be made. Download our Ring Charts PowerPoint Templates because very often it is important to reflect on the basics. Download our Business PowerPoint Templates because you have selected your team man for man. Use our Shapes PowerPoint Templates because they will Amplify your thoughts via our appropriate templates.Use these PowerPoint slides for presentations relating to Button,cerulean, circle, circulation, cobalt,colorful, cyan, cycle, element,emblem, grayshadow, green,icon, indicator, interface, internet, label,link, load, marker, motion, movement,navigationpanel, next, orientation, pagsite, pink, pointer, previous, process, reload, rotation, satined, sign, signpost,smooth, sticker, sticky, symbol. The prominent colors used in the PowerPoint template are Blue navy, Black, Gray. Customers tell us our processes in single presentation Relative Circular Flow Arrow Network PowerPoint templates are Energetic. We assure you our colorful PowerPoint templates and PPT Slides help you meet deadlines which are an element of today's workplace. Just browse and pick the slides that appeal to your intuitive senses. PowerPoint presentation experts tell us our processes in single presentation Relative Circular Flow Arrow Network PowerPoint templates are Elegant. People tell us our element PowerPoint templates and PPT Slides are Wistful. We assure you our processes in single presentation Relative Circular Flow Arrow Network PowerPoint templates are Beautiful. Use our cycle PowerPoint templates and PPT Slides are Adorable. You have fathereda great idea. Baptise it with our Processes In Single Presentation Relative Circular Flow Arrow Network PowerPoint Templates.
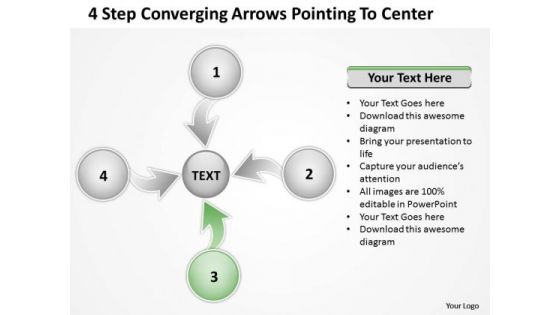
Step Converging Arrows Poiting To Center Ppt Relative Circular Process PowerPoint Templates
We present our step converging arrows poiting to center ppt Relative Circular Process PowerPoint templates.Use our Arrows PowerPoint Templates because Our PowerPoint Templates and Slides come in all colours, shades and hues. They help highlight every nuance of your views. Use our Circle Charts PowerPoint Templates because you have the right arrows in your quiver. Download and present our Shapes PowerPoint Templates because you have the ability to judge Which out of late have been proving to be a hassle. Download and present our Business PowerPoint Templates because you have secured a name for yourself in the domestic market. Now the time is right to spread your reach to other countries. Download and present our Flow Charts PowerPoint Templates because the ideas and plans are on your finger tips.Use these PowerPoint slides for presentations relating to 3d, abstract, all, around, arrow, aspect, attention, attract, blue, center, collect, colorful, conceptual, converge, course, cutout, direct, direction, factor, gather, globalization, go, green, guide, illustration, indicate, integration, isolated, location, many, movement, point, pointer, rainbow, reach, red, round, show, sides, sign, source, sphere, strategy, summon, symbol, target, unity, way, white, yellow. The prominent colors used in the PowerPoint template are Green, Gray, Black. Presenters tell us our step converging arrows poiting to center ppt Relative Circular Process PowerPoint templates are Romantic. The feedback we get is that our arrow PowerPoint templates and PPT Slides are Bold. Presenters tell us our step converging arrows poiting to center ppt Relative Circular Process PowerPoint templates are the best it can get when it comes to presenting. You can be sure our blue PowerPoint templates and PPT Slides look good visually. People tell us our step converging arrows poiting to center ppt Relative Circular Process PowerPoint templates are Fantastic. PowerPoint presentation experts tell us our around PowerPoint templates and PPT Slides are Chic. Rebuild your team with our Step Converging Arrows Poiting To Center Ppt Relative Circular Process PowerPoint Templates. Download without worries with our money back guaranteee.
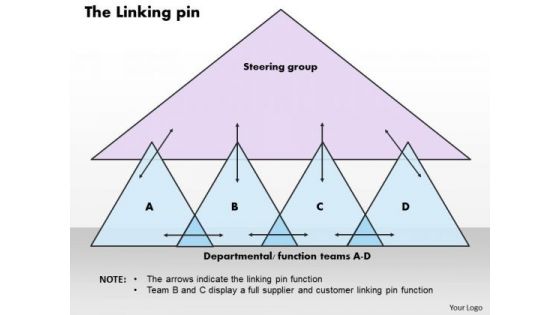
Business Framework The Linking Pin PowerPoint Presentation
This diagram displays framework for the linking pin. It contains diagram of linking triangles. This template is perfect for presentations on the linking pin, steering group, departmental function teams a d, note, the arrows indicate the linking pin function, and team b and c display a full supplier and customer linking pin function.
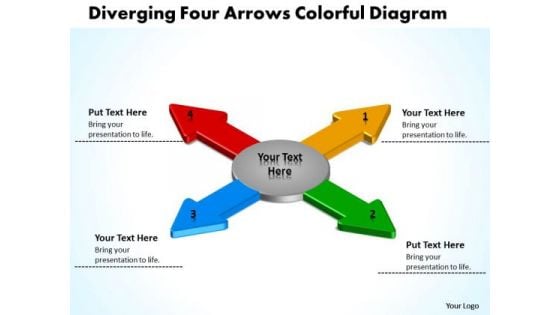
Diverging Four Arrows Colorful Flow Diagram Cycle PowerPoint Slides
We present our diverging four arrows colorful flow diagram Cycle PowerPoint Slides.Use our Arrows PowerPoint Templates because the NASA Space programme took mankind to the moon and so much more. Like them you too can look far beyond normal boundaries. Show them that in your mind the sky is certainly not the limit. Download our Circle Charts PowerPoint Templates because our creative template will lay down your views. Download our Shapes PowerPoint Templates because you are going along well but your foresight shows that it may need a slight change in plans or direction. Download and present our Business PowerPoint Templates because project your ideas to you colleagues and complete the full picture. Use our Flow Charts PowerPoint Templates because you can Set out the goals and your plan of action for teamwork.Use these PowerPoint slides for presentations relating to arrow, arrowheads, badge, banner, blue, button, cerulean, cobalt, colored, colorful, connection, cursor, cyan, design element, designator, directional, download, emblem, gray shadow, green, icon, indicator, interface, internet, link, load, magenta, marker, matted, menu tool, navigation panel, next, orientation, page site, pictogram, pink, pointer, red, right, satined, sign, signpost, smooth, symbol, upload, vector illustration, web, web 2.0, white background. The prominent colors used in the PowerPoint template are Red, Yellow, Green. Presenters tell us our diverging four arrows colorful flow diagram Cycle PowerPoint Slides are aesthetically designed to attract attention. We guarantee that they will grab all the eyeballs you need. You can be sure our button PowerPoint templates and PPT Slides are Awesome. Professionals tell us our diverging four arrows colorful flow diagram Cycle PowerPoint Slides are Glamorous. People tell us our blue PowerPoint templates and PPT Slides are Multicolored. People tell us our diverging four arrows colorful flow diagram Cycle PowerPoint Slides are effectively colour coded to prioritise your plans They automatically highlight the sequence of events you desire. Professionals tell us our banner PowerPoint templates and PPT Slides effectively help you save your valuable time. Give an exhaustive account with our Diverging Four Arrows Colorful Flow Diagram Cycle PowerPoint Slides. Your thoughts will illuminate every little detail.
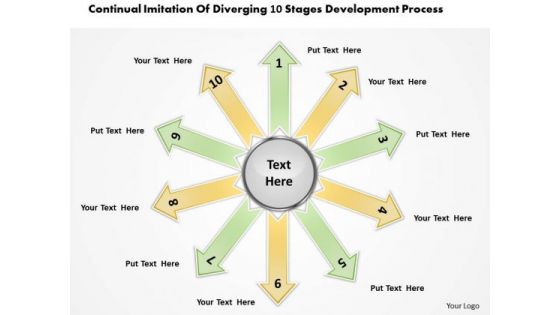
Imitation Of Diverging 10 Stages Development Process Ppt Pie Diagram PowerPoint Templates
We present our imitation of diverging 10 stages development process ppt Pie Diagram PowerPoint templates.Download our Arrows PowerPoint Templates because this layout helps you to see satisfaction spread across the room as they unravel your gifted views. Use our Circle Charts PowerPoint Templates because this Layout can explain the relevance of the different layers and stages in getting down to your core competence, ability and desired result. Use our Shapes PowerPoint Templates because it has inspired a whole new world of medical endeavour. Download our Business PowerPoint Templates because you can Lead your flock steadily to greater heights. Look around at the vast potential of achievement around you. Present our Flow Charts PowerPoint Templates because this is an excellent slide to detail and highlight your thought process, your views and your positive expectations..Use these PowerPoint slides for presentations relating to arrow, arrowheads, badge, banner, blue, button, cerulean, cobalt, colored, colorful, connection, cursor, cyan, design element, designator, icon, indicator, interface, internet, link, load, magenta, marker, matted, menu tool, navigation panel, next, orientation, page site, pictogram, pink, pointer, red, right, satined, sign, signpost, smooth, symbol, . The prominent colors used in the PowerPoint template are Yellow, Green, Gray. Presenters tell us our imitation of diverging 10 stages development process ppt Pie Diagram PowerPoint templates are Attractive. You can be sure our button PowerPoint templates and PPT Slides will make the presenter successul in his career/life. Professionals tell us our imitation of diverging 10 stages development process ppt Pie Diagram PowerPoint templates will impress their bosses and teams. People tell us our button PowerPoint templates and PPT Slides are Elevated. People tell us our imitation of diverging 10 stages development process ppt Pie Diagram PowerPoint templates provide great value for your money. Be assured of finding the best projection to highlight your words. Professionals tell us our blue PowerPoint templates and PPT Slides are Pretty. Give a fillip to your plans with our Imitation Of Diverging 10 Stages Development Process Ppt Pie Diagram PowerPoint Templates. They will get that extra attention you seek.
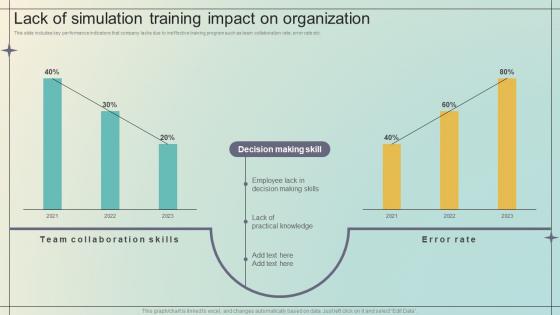
Immersive Training For Practical Lack Of Simulation Training Impact On Organization DTE SS V
This slide includes key performance indicators that company lacks due to ineffective training program such as team collaboration rate, error rate etc. If you are looking for a format to display your unique thoughts, then the professionally designed Immersive Training For Practical Lack Of Simulation Training Impact On Organization DTE SS V is the one for you. You can use it as a Google Slides template or a PowerPoint template. Incorporate impressive visuals, symbols, images, and other charts. Modify or reorganize the text boxes as you desire. Experiment with shade schemes and font pairings. Alter, share or cooperate with other people on your work. Download Immersive Training For Practical Lack Of Simulation Training Impact On Organization DTE SS V and find out how to give a successful presentation. Present a perfect display to your team and make your presentation unforgettable. This slide includes key performance indicators that company lacks due to ineffective training program such as team collaboration rate, error rate etc.
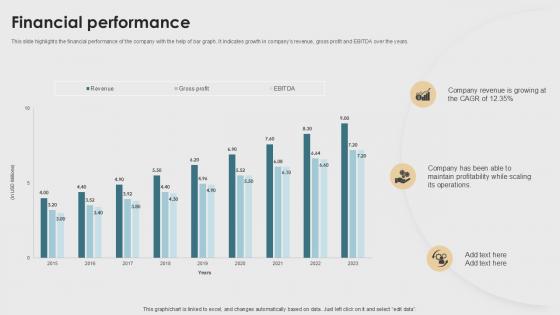
Financial Performance Property Listings Platform Pitch Deck PPT Sample
This slide highlights the financial performance of the company with the help of bar graph. It indicates growth in companys revenue, gross profit and EBITDA over the years. Present like a pro with Financial Performance Property Listings Platform Pitch Deck PPT Sample. Create beautiful presentations together with your team, using our easy to use presentation slides. Share your ideas in real time and make changes on the fly by downloading our templates. So whether you are in the office, on the go, or in a remote location, you can stay in sync with your team and present your ideas with confidence. With Slidegeeks presentation got a whole lot easier. Grab these presentations today. This slide highlights the financial performance of the company with the help of bar graph.It indicates growth in companys revenue, gross profit and EBITDA over the years.
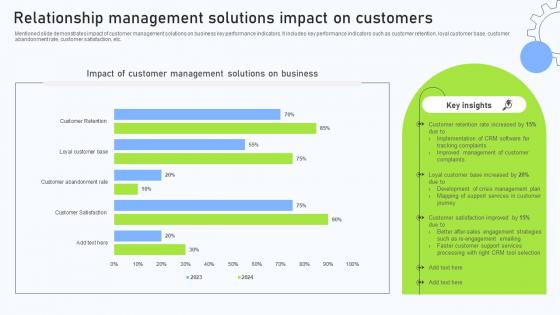
Relationship Management Automation Relationship Management Solutions Impact
Mentioned slide demonstrates impact of customer management solutions on business key performance indicators. It includes key performance indicators such as customer retention, loyal customer base, customer abandonment rate, customer satisfaction, etc. This Relationship Management Automation Relationship Management Solutions Impact from Slidegeeks makes it easy to present information on your topic with precision. It provides customization options, so you can make changes to the colors, design, graphics, or any other component to create a unique layout. It is also available for immediate download, so you can begin using it right away. Slidegeeks has done good research to ensure that you have everything you need to make your presentation stand out. Make a name out there for a brilliant performance. Mentioned slide demonstrates impact of customer management solutions on business key performance indicators. It includes key performance indicators such as customer retention, loyal customer base, customer abandonment rate, customer satisfaction, etc.
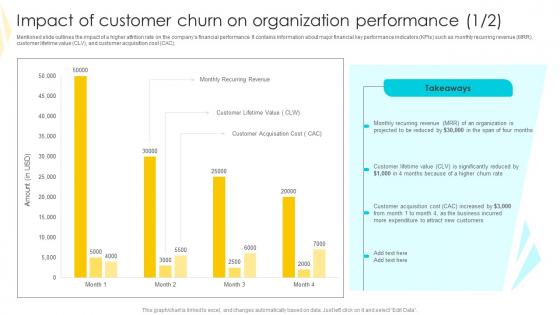
Impact Of Customer Churn On Strategies To Mitigate Customer Churn Template Pdf
Mentioned slide outlines the impact of a higher attrition rate on the companys financial performance. It contains information about major financial key performance indicators KPIs such as monthly recurring revenue MRR, customer lifetime value CLV, and customer acquisition cost CAC. If you are looking for a format to display your unique thoughts, then the professionally designed Impact Of Customer Churn On Strategies To Mitigate Customer Churn Template Pdf is the one for you. You can use it as a Google Slides template or a PowerPoint template. Incorporate impressive visuals, symbols, images, and other charts. Modify or reorganize the text boxes as you desire. Experiment with shade schemes and font pairings. Alter, share or cooperate with other people on your work. Download Impact Of Customer Churn On Strategies To Mitigate Customer Churn Template Pdf and find out how to give a successful presentation. Present a perfect display to your team and make your presentation unforgettable. Mentioned slide outlines the impact of a higher attrition rate on the companys financial performance. It contains information about major financial key performance indicators KPIs such as monthly recurring revenue MRR, customer lifetime value CLV, and customer acquisition cost CAC.
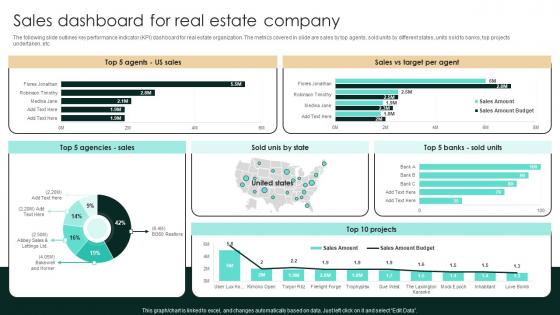
Sales Dashboard For Real Estate Company Strategic Real Estate Introduction Pdf
The following slide outlines key performance indicator KPI dashboard for real estate organization. The metrics covered in slide are sales by top agents, sold units by different states, units sold to banks, top projects undertaken, etc. If you are looking for a format to display your unique thoughts, then the professionally designed Sales Dashboard For Real Estate Company Strategic Real Estate Introduction Pdf is the one for you. You can use it as a Google Slides template or a PowerPoint template. Incorporate impressive visuals, symbols, images, and other charts. Modify or reorganize the text boxes as you desire. Experiment with shade schemes and font pairings. Alter, share or cooperate with other people on your work. Download Sales Dashboard For Real Estate Company Strategic Real Estate Introduction Pdf and find out how to give a successful presentation. Present a perfect display to your team and make your presentation unforgettable. The following slide outlines key performance indicator KPI dashboard for real estate organization. The metrics covered in slide are sales by top agents, sold units by different states, units sold to banks, top projects undertaken, etc.
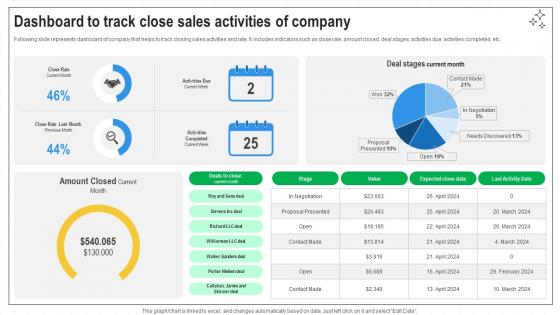
Closing Techniques To Seal Dashboard To Track Close Sales Activities Of Company SA SS V
Following slide represents dashboard of company that helps to track closing sales activities and rate. It includes indicators such as close rate, amount closed, deal stages, activities due, activities completed, etc. If you are looking for a format to display your unique thoughts, then the professionally designed Closing Techniques To Seal Dashboard To Track Close Sales Activities Of Company SA SS V is the one for you. You can use it as a Google Slides template or a PowerPoint template. Incorporate impressive visuals, symbols, images, and other charts. Modify or reorganize the text boxes as you desire. Experiment with shade schemes and font pairings. Alter, share or cooperate with other people on your work. Download Closing Techniques To Seal Dashboard To Track Close Sales Activities Of Company SA SS V and find out how to give a successful presentation. Present a perfect display to your team and make your presentation unforgettable. Following slide represents dashboard of company that helps to track closing sales activities and rate. It includes indicators such as close rate, amount closed, deal stages, activities due, activities completed, etc.

Key Statistics Associated With Global E Commerce Smartphones Industry Report PPT Presentation IR SS V
The slide presents a comprehensive overview of the e commerce electronics market in order to give stakeholders useful information that will help them make strategic decisions. The statistics for the global markets are covered in the slide indicating the potential for any new business, product, or service. If you are looking for a format to display your unique thoughts, then the professionally designed Key Statistics Associated With Global E Commerce Smartphones Industry Report PPT Presentation IR SS V is the one for you. You can use it as a Google Slides template or a PowerPoint template. Incorporate impressive visuals, symbols, images, and other charts. Modify or reorganize the text boxes as you desire. Experiment with shade schemes and font pairings. Alter, share or cooperate with other people on your work. Download Key Statistics Associated With Global E Commerce Smartphones Industry Report PPT Presentation IR SS V and find out how to give a successful presentation. Present a perfect display to your team and make your presentation unforgettable. The slide presents a comprehensive overview of the e commerce electronics market in order to give stakeholders useful information that will help them make strategic decisions. The statistics for the global markets are covered in the slide indicating the potential for any new business, product, or service.
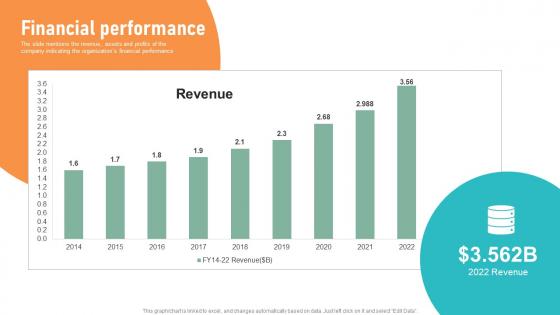
Financial Performance Circuit Designing Company Investor Fund Raising Pitch Deck Themes Pdf
The slide mentions the revenue, assets and profits of the company indicating the organizations financial performance From laying roadmaps to briefing everything in detail, our templates are perfect for you. You can set the stage with your presentation slides. All you have to do is download these easy to edit and customizable templates. Financial Performance Circuit Designing Company Investor Fund Raising Pitch Deck Themes Pdf will help you deliver an outstanding performance that everyone would remember and praise you for. Do download this presentation today. The slide mentions the revenue, assets and profits of the company indicating the organizations financial performance
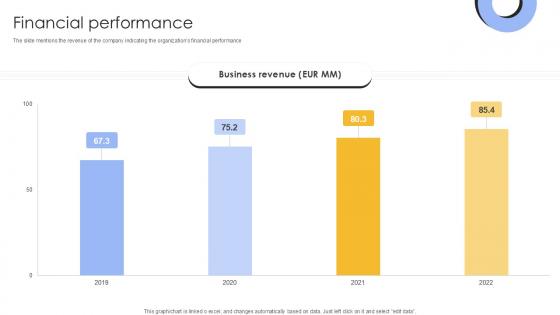
Financial Performance Investment Company Investor Funding Elevator Ppt Slide
The slide mentions the revenue of the company indicating the organizations financial performance. Find a pre-designed and impeccable Financial Performance Investment Company Investor Funding Elevator Ppt Slide. The templates can ace your presentation without additional effort. You can download these easy-to-edit presentation templates to make your presentation stand out from others. So, what are you waiting for Download the template from Slidegeeks today and give a unique touch to your presentation. The slide mentions the revenue of the company indicating the organizations financial performance
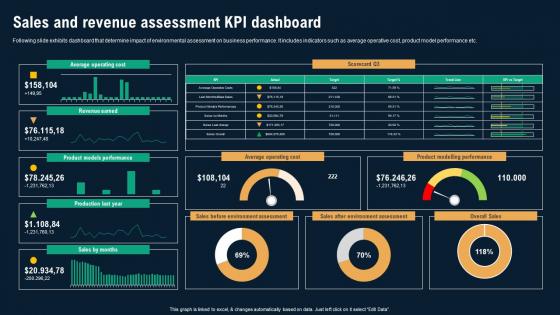
Sales And Revenue Assessment KPI Dashboard Business Environmental Analysis Ideas Pdf
Following slide exhibits dashboard that determine impact of environmental assessment on business performance. It includes indicators such as average operative cost, product model performance etc. There are so many reasons you need a Sales And Revenue Assessment KPI Dashboard Business Environmental Analysis Ideas Pdf The first reason is you can not spend time making everything from scratch, Thus, Slidegeeks has made presentation templates for you too. You can easily download these templates from our website easily. Following slide exhibits dashboard that determine impact of environmental assessment on business performance. It includes indicators such as average operative cost, product model performance etc.
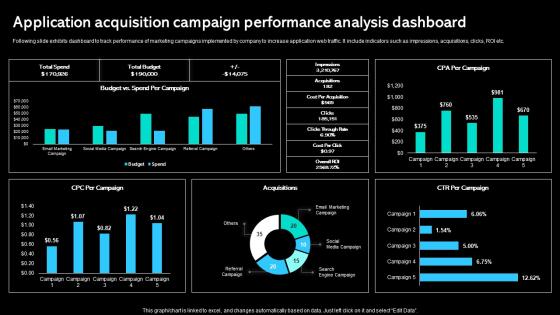
Application Acquisition Campaign Performance Analysis Paid Marketing Approach Infographics Pdf
Following slide exhibits dashboard to track performance of marketing campaigns implemented by company to increase application web traffic. It include indicators such as impressions, acquisitions, clicks, ROI etc. There are so many reasons you need a Application Acquisition Campaign Performance Analysis Paid Marketing Approach Infographics Pdf The first reason is you can not spend time making everything from scratch, Thus, Slidegeeks has made presentation templates for you too. You can easily download these templates from our website easily. Following slide exhibits dashboard to track performance of marketing campaigns implemented by company to increase application web traffic. It include indicators such as impressions, acquisitions, clicks, ROI etc.
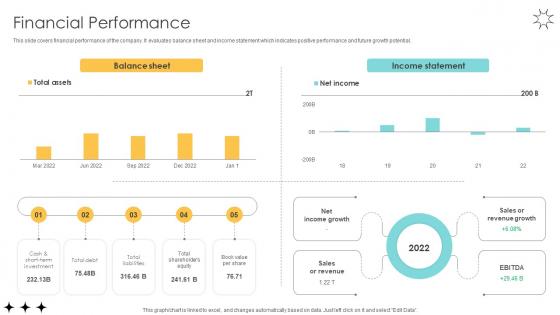
Financial Performance Online Marketplace Pitch Deck
This slide covers financial performance of the company. It evaluates balance sheet and income statement which indicates positive performance and future growth potential. From laying roadmaps to briefing everything in detail, our templates are perfect for you. You can set the stage with your presentation slides. All you have to do is download these easy-to-edit and customizable templates. Financial Performance Online Marketplace Pitch Deck will help you deliver an outstanding performance that everyone would remember and praise you for. Do download this presentation today. This slide covers financial performance of the company. It evaluates balance sheet and income statement which indicates positive performance and future growth potential.
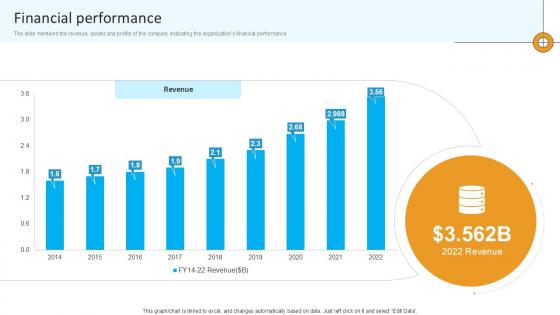
Financial Performance Computational Software Company Investor Funding Ppt Example
The slide mentions the revenue, assets and profits of the company indicating the organizations financial performance. From laying roadmaps to briefing everything in detail, our templates are perfect for you. You can set the stage with your presentation slides. All you have to do is download these easy-to-edit and customizable templates. Financial Performance Computational Software Company Investor Funding Ppt Example will help you deliver an outstanding performance that everyone would remember and praise you for. Do download this presentation today. The slide mentions the revenue, assets and profits of the company indicating the organizations financial performance
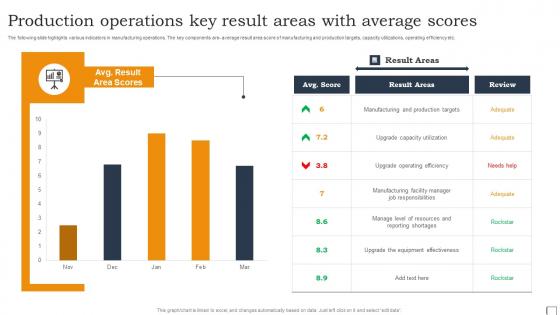
Production Operations Key Result Areas With Average Scores Structure Pdf
The following slide highlights various indicators in manufacturing operations. The key components are- average result area score of manufacturing and production targets, capacity utilizations, operating efficiency etc. Showcasing this set of slides titled Production Operations Key Result Areas With Average Scores Structure Pdf. The topics addressed in these templates are Result Areas. All the content presented in this PPT design is completely editable. Download it and make adjustments in color, background, font etc. as per your unique business setting. The following slide highlights various indicators in manufacturing operations. The key components are- average result area score of manufacturing and production targets, capacity utilizations, operating efficiency etc.
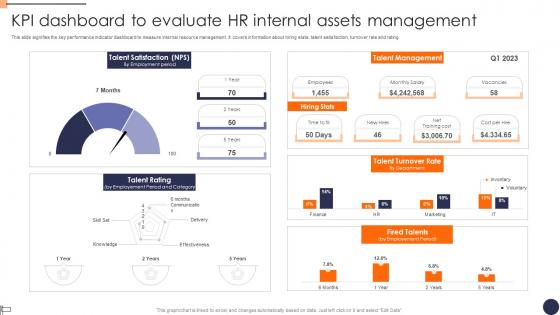
KPI Dashboard To Evaluate HR Internal Assets Management Structure Pdf
This slide signifies the key performance indicator dashboard to measure internal resource management. It covers information about hiring stats, talent satisfaction, turnover rate and rating. Showcasing this set of slides titled KPI Dashboard To Evaluate HR Internal Assets Management Structure Pdf. The topics addressed in these templates are About Hiring Stats, Talent Satisfaction, Turnover. All the content presented in this PPT design is completely editable. Download it and make adjustments in color, background, font etc. as per your unique business setting. This slide signifies the key performance indicator dashboard to measure internal resource management. It covers information about hiring stats, talent satisfaction, turnover rate and rating.
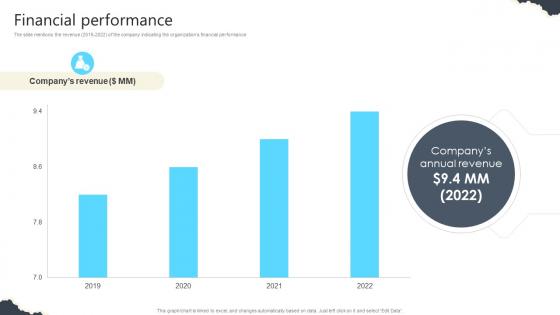
Financial Performance Real Estate Platform Investor Funding Elevator Pitch Deck
The slide mentions the revenue 2019-2022 of the company indicating the organizations financial performance. Present like a pro with Financial Performance Real Estate Platform Investor Funding Elevator Pitch Deck. Create beautiful presentations together with your team, using our easy-to-use presentation slides. Share your ideas in real-time and make changes on the fly by downloading our templates. So whether you are in the office, on the go, or in a remote location, you can stay in sync with your team and present your ideas with confidence. With Slidegeeks presentation got a whole lot easier. Grab these presentations today. The slide mentions the revenue 2019-2022 of the company indicating the organizations financial performance.
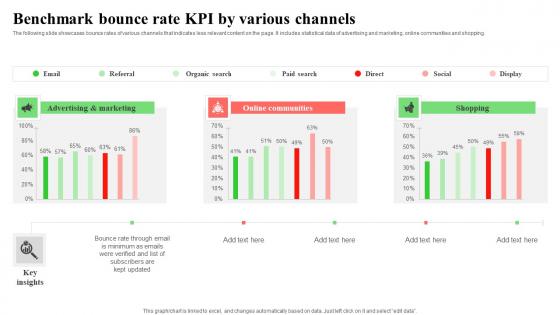
Benchmark Bounce Rate KPI By Various Channels Infographics Pdf
The following slide showcases bounce rates of various channels that indicates less relevant content on the page. It includes statistical data of advertising and marketing, online communities and shopping. Pitch your topic with ease and precision using this Benchmark Bounce Rate KPI By Various Channels Infographics Pdf. This layout presents information on Advertising,Marketing, Online Communities. It is also available for immediate download and adjustment. So, changes can be made in the color, design, graphics or any other component to create a unique layout. The following slide showcases bounce rates of various channels that indicates less relevant content on the page. It includes statistical data of advertising and marketing, online communities and shopping.
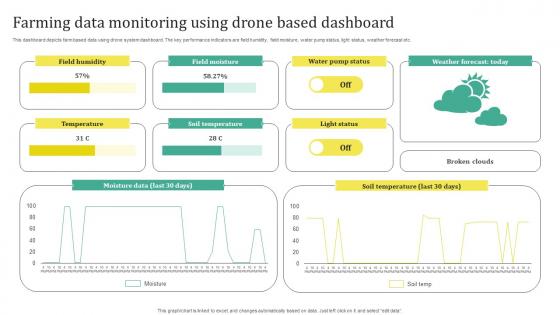
Farming Data Monitoring Using Drone Based Dashboard Sample Pdf
This dashboard depicts farm based data using drone system dashboard. The key performance indicators are field humidity, field moisture, water pump status, light status, weather forecast etc. Pitch your topic with ease and precision using this Farming Data Monitoring Using Drone Based Dashboard Sample Pdf. This layout presents information on Temperature, Soil Temperature, Light Status. It is also available for immediate download and adjustment. So, changes can be made in the color, design, graphics or any other component to create a unique layout. This dashboard depicts farm based data using drone system dashboard. The key performance indicators are field humidity, field moisture, water pump status, light status, weather forecast etc.
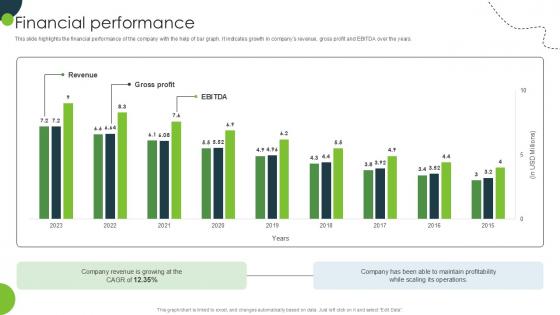
Financial Performance Land And Property Marketplace Pitch Deck PPT Sample
This slide highlights the financial performance of the company with the help of bar graph. It indicates growth in companys revenue, gross profit and EBITDA over the years. Present like a pro with Financial Performance Land And Property Marketplace Pitch Deck PPT Sample. Create beautiful presentations together with your team, using our easy-to-use presentation slides. Share your ideas in real-time and make changes on the fly by downloading our templates. So whether you are in the office, on the go, or in a remote location, you can stay in sync with your team and present your ideas with confidence. With Slidegeeks presentation got a whole lot easier. Grab these presentations today. This slide highlights the financial performance of the company with the help of bar graph. It indicates growth in companys revenue, gross profit and EBITDA over the years.

KPI Dashboard For Monitoring Warehouse Operations Strategic Plan For Enhancing Inspiration Pdf
Mentioned slide illustrates warehouse operations dashboard with key performance indicators KPIs. KPIs included are operating cost, order rate, total shipment by country and on-time shipment. Retrieve professionally designed KPI Dashboard For Monitoring Warehouse Operations Strategic Plan For Enhancing Inspiration Pdf to effectively convey your message and captivate your listeners. Save time by selecting pre-made slideshows that are appropriate for various topics, from business to educational purposes. These themes come in many different styles, from creative to corporate, and all of them are easily adjustable and can be edited quickly. Access them as PowerPoint templates or as Google Slides themes. You do not have to go on a hunt for the perfect presentation because Slidegeeks got you covered from everywhere. Mentioned slide illustrates warehouse operations dashboard with key performance indicators KPIs. KPIs included are operating cost, order rate, total shipment by country and on-time shipment.
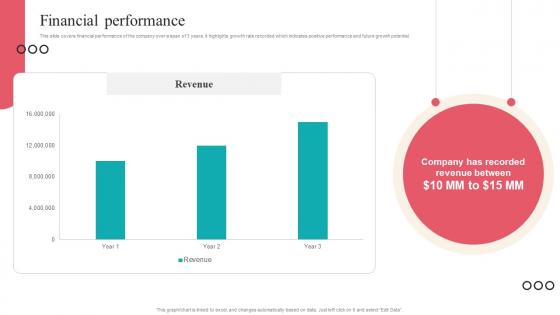
Financial Performance Camera Management Platform Investor Funding Elevator Pitch Deck
This slide covers financial performance of the company over a span of 3 years. It highlights growth rate recorded which indicates positive performance and future growth potential. From laying roadmaps to briefing everything in detail, our templates are perfect for you. You can set the stage with your presentation slides. All you have to do is download these easy-to-edit and customizable templates. Financial Performance Camera Management Platform Investor Funding Elevator Pitch Deck will help you deliver an outstanding performance that everyone would remember and praise you for. Do download this presentation today. This slide covers financial performance of the company over a span of 3 years. It highlights growth rate recorded which indicates positive performance and future growth potential.
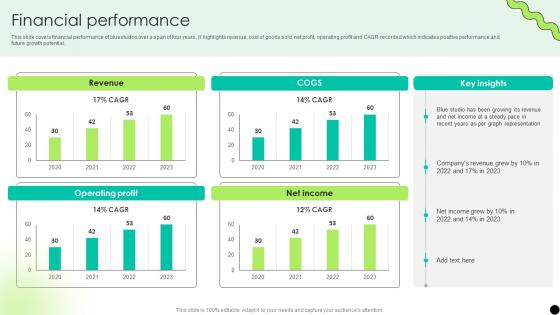
Financial Performance Digital Payment Platform Pitch Deck
This slide covers financial performance of bluestudios over a span of four years. It highlights revenue, cost of goods sold, net profit, operating profit and CAGR recorded which indicates positive performance and future growth potential. From laying roadmaps to briefing everything in detail, our templates are perfect for you. You can set the stage with your presentation slides. All you have to do is download these easy-to-edit and customizable templates. Financial Performance Digital Payment Platform Pitch Deck will help you deliver an outstanding performance that everyone would remember and praise you for. Do download this presentation today. This slide covers financial performance of bluestudios over a span of four years. It highlights revenue, cost of goods sold, net profit, operating profit and CAGR recorded which indicates positive performance and future growth potential.
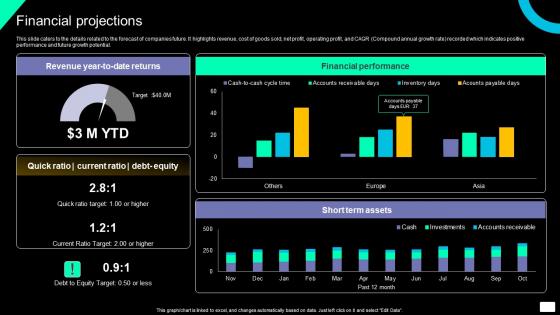
Financial Projections Brand Exposure And Lead Generation Software Investment Designs Pdf
This slide caters to the details related to the forecast of companies future. It highlights revenue, cost of goods sold, net profit, operating profit, and CAGR Compound annual growth rate recorded which indicates positive performance and future growth potential. Present like a pro with Financial Projections Brand Exposure And Lead Generation Software Investment Designs Pdf Create beautiful presentations together with your team, using our easy-to-use presentation slides. Share your ideas in real-time and make changes on the fly by downloading our templates. So whether you are in the office, on the go, or in a remote location, you can stay in sync with your team and present your ideas with confidence. With Slidegeeks presentation got a whole lot easier. Grab these presentations today. This slide caters to the details related to the forecast of companies future. It highlights revenue, cost of goods sold, net profit, operating profit, and CAGR Compound annual growth rate recorded which indicates positive performance and future growth potential.

Financial Projections Technology Solutions Provider Investor Funding Elevator Pitch Deck
This slide caters to the details related to the forecast of companies future. It highlights revenue, net income, free cash flow, and cash balance recorded which indicates positive performance and future growth potential. Slidegeeks is here to make your presentations a breeze with Financial Projections Technology Solutions Provider Investor Funding Elevator Pitch Deck With our easy-to-use and customizable templates, you can focus on delivering your ideas rather than worrying about formatting. With a variety of designs to choose from, you are sure to find one that suits your needs. And with animations and unique photos, illustrations, and fonts, you can make your presentation pop. So whether you are giving a sales pitch or presenting to the board, make sure to check out Slidegeeks first This slide caters to the details related to the forecast of companies future. It highlights revenue, net income, free cash flow, and cash balance recorded which indicates positive performance and future growth potential.

Facebook Marketing Plan KPI Dashboard To Monitor Facebook Marketing Strategy SS V


 Continue with Email

 Home
Home


