Meter Chart
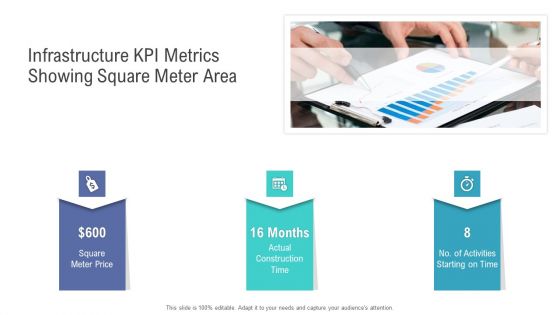
Financial Functional Assessment Infrastructure KPI Metrics Showing Square Meter Area Summary PDF
Presenting financial functional assessment infrastructure kpi metrics showing square meter area summary pdf to provide visual cues and insights. Share and navigate important information on three stages that need your due attention. This template can be used to pitch topics like square meter price, actual construction time, activities. In addition, this PPT design contains high-resolution images, graphics, etc, that are easily editable and available for immediate download.
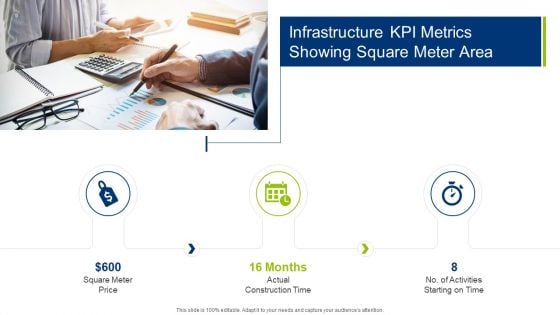
Infrastructure Building Administration Infrastructure KPI Metrics Showing Square Meter Area Portrait PDF
This is a infrastructure building administration infrastructure kpi metrics showing square meter area portrait pdf template with various stages. Focus and dispense information on three stages using this creative set, that comes with editable features. It contains large content boxes to add your information on topics like square meter price actual, construction time, activities starting on time. You can also showcase facts, figures, and other relevant content using this PPT layout. Grab it now.

Information Technology Functions Management Infrastructure KPI Metrics Showing Square Meter Area Summary PDF
Presenting information technology functions management infrastructure kpi metrics showing square meter area summary pdf to provide visual cues and insights. Share and navigate important information on three stages that need your due attention. This template can be used to pitch topics like square meter price, actual construction time, no activities starting time. In addition, this PPT design contains high-resolution images, graphics, etc, that are easily editable and available for immediate download.
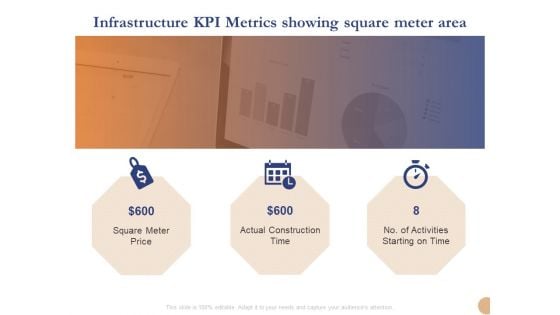
Substructure Segment Analysis Infrastructure KPI Metrics Showing Square Meter Area Diagrams PDF
This is a substructure segment analysis infrastructure kpi metrics showing square meter area diagrams pdf template with various stages. Focus and dispense information on three stages using this creative set, that comes with editable features. It contains large content boxes to add your information on topics like square meter price, actual construction time, activities starting on time. You can also showcase facts, figures, and other relevant content using this PPT layout. Grab it now.
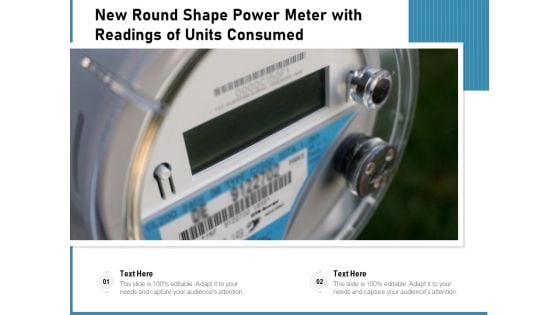
New Round Shape Power Meter With Readings Of Units Consumed Ppt PowerPoint Presentation File Show PDF
Showcasing this set of slides titled new round shape power meter with readings of units consumed ppt powerpoint presentation file show pdf. The topics addressed in these templates are new round shape power meter with readings of units consumed. All the content presented in this PPT design is completely editable. Download it and make adjustments in color, background, font etc. as per your unique business setting.
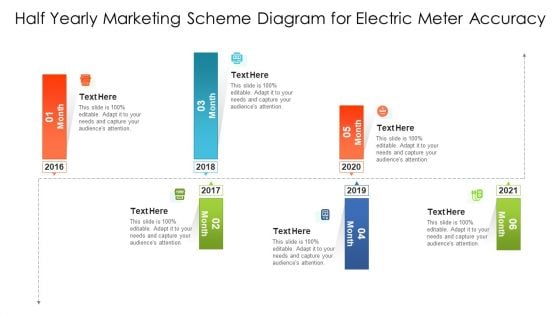
Half Yearly Marketing Scheme Diagram For Electric Meter Accuracy Ppt PowerPoint Presentation Gallery Maker PDF
Persuade your audience using this half yearly marketing scheme diagram for electric meter accuracy ppt powerpoint presentation gallery maker pdf. This PPT design covers six stages, thus making it a great tool to use. It also caters to a variety of topics including half yearly marketing scheme diagram for electric meter accuracy. Download this PPT design now to present a convincing pitch that not only emphasizes the topic but also showcases your presentation skills.
Company Website Trust Meter Vector Icon Ppt PowerPoint Presentation Infographics Example PDF
Persuade your audience using this company website trust meter vector icon ppt powerpoint presentation infographics example pdf. This PPT design covers two stages, thus making it a great tool to use. It also caters to a variety of topics including company website trust meter vector icon. Download this PPT design now to present a convincing pitch that not only emphasizes the topic but also showcases your presentation skills.
Employee Trust Meter Vector Icon Ppt PowerPoint Presentation Infographics Good PDF
Persuade your audience using this employee trust meter vector icon ppt powerpoint presentation infographics good pdf. This PPT design covers three stages, thus making it a great tool to use. It also caters to a variety of topics including employee trust meter vector icon. Download this PPT design now to present a convincing pitch that not only emphasizes the topic but also showcases your presentation skills.
Security Shield And Meter Vector Icon Ppt PowerPoint Presentation Styles Summary PDF
Persuade your audience using this security shield and meter vector icon ppt powerpoint presentation styles summary pdf. This PPT design covers three stages, thus making it a great tool to use. It also caters to a variety of topics including security shield and meter vector icon. Download this PPT design now to present a convincing pitch that not only emphasizes the topic but also showcases your presentation skills.
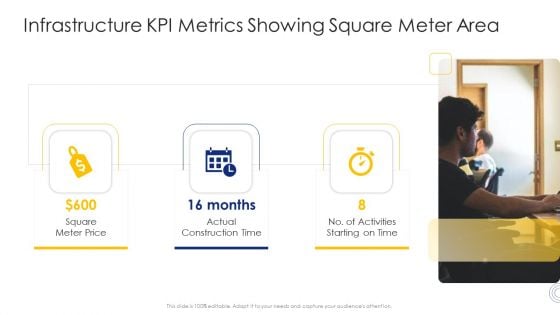
Construction Engineering And Industrial Facility Management Infrastructure KPI Metrics Showing Square Meter Area Ideas PDF
Presenting construction engineering and industrial facility management infrastructure kpi metrics showing square meter area ideas pdf to provide visual cues and insights. Share and navigate important information on three stages that need your due attention. This template can be used to pitch topics like square meter price, actual construction time, no of activities starting on time . In addtion, this PPT design contains high resolution images, graphics, etc, that are easily editable and available for immediate download.

Construction Management Services Infrastructure KPI Metrics Showing Square Meter Area Designs PDF
Presenting construction management services infrastructure kpi metrics showing square meter area designs pdf to provide visual cues and insights. Share and navigate important information on three stages that need your due attention. This template can be used to pitch topics like square meter price, actual construction time, activities. In addition, this PPT design contains high-resolution images, graphics, etc, that are easily editable and available for immediate download.
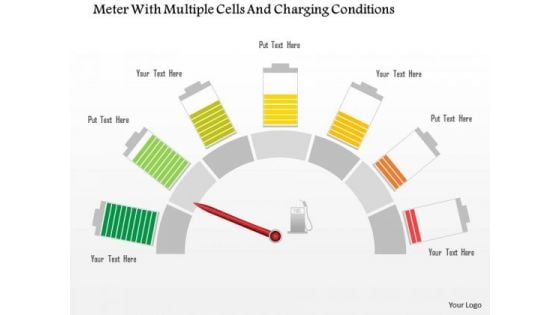
Business Diagram Meter With Multiple Cells And Charging Conditions Presentation Template
This Power Point template slide has been designed with graphic of meter and multiple cells. This PPT slide contains the concept of power consumption and charging. Use this PPT in your presentation and build an innovative presentation for power related topics.
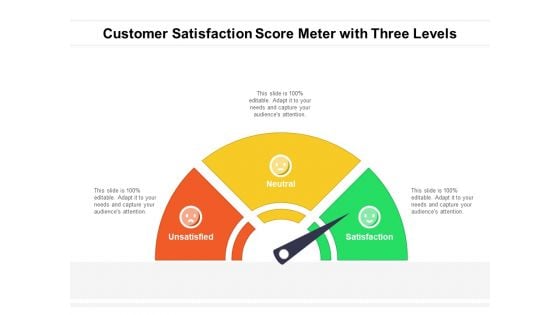
Customer Satisfaction Score Meter With Three Levels Ppt PowerPoint Presentation Gallery Smartart PDF
Presenting customer satisfaction score meter with three levels ppt powerpoint presentation gallery smartart pdf to dispense important information. This template comprises three stages. It also presents valuable insights into the topics including unsatisfied, neutral, satisfaction. This is a completely customizable PowerPoint theme that can be put to use immediately. So, download it and address the topic impactfully.
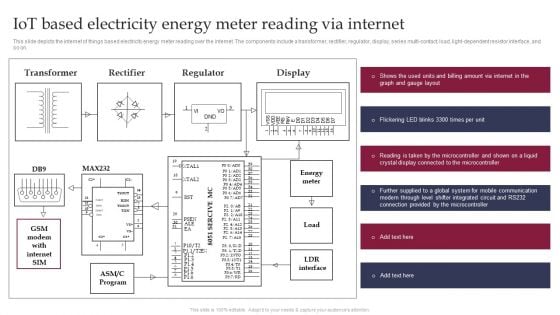
Smart Grid Technology Iot Based Electricity Energy Meter Reading Background PDF
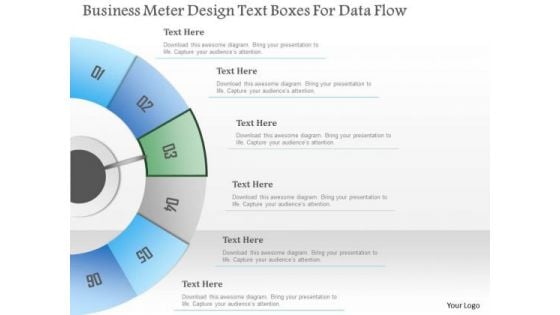
Busines Diagram Business Meter Design Text Boxes For Data Flow Presentation Template
Concept of data flow can be well defined with this exclusive business diagram. This slide contains the diagram of six steps in semi-circle. Use this professional diagram to impress your viewers.
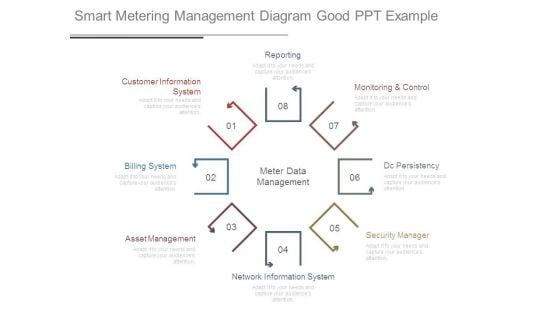
Smart Metering Management Diagram Good Ppt Example
This is a smart metering management diagram good ppt example. This is a eight stage process. The stages in this process are reporting, customer information system, billing system, asset management, network information system, security manager, dc persistency, monitoring and control, meter data management.
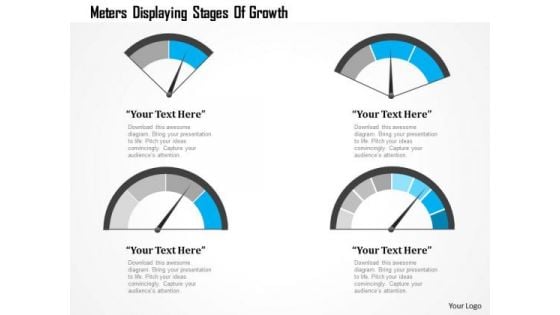
Business Diagram Meters Displaying Stages Of Growth Presentation Template
Graphic of four different meters has been used to craft this power point template. This PPT contains the concept of speed calculation. Use this PPT for your technology and mechanical topics in any presentations.
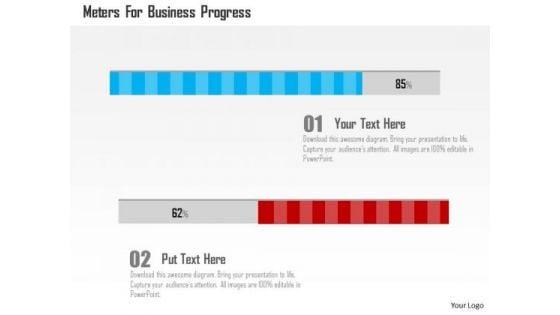
Business Diagram Meters For Business Progress Presentation Template
This business slide contains graphics of meter. You may use this slide to depict business progress. Download our above diagram to express information in a visual way.

Business Diagram Three Meters For Speed Control Presentation Template
Graphic of three speedometers has been used to design this power point template. This diagram contains the concept of speed control. Amplify your thoughts via this appropriate business template.
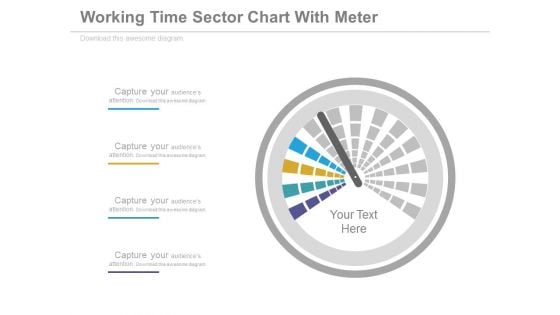
Dashboard Performance Analysis Chart Powerpoint Slides
This PowerPoint template graphics of meter chart. Download this PPT chart for business performance analysis. This PowerPoint slide is of great help in the business sector to make realistic presentations and provides effective way of presenting your newer thoughts.

Empowering The Future Smart Meters Dashboard For Effective Energy IoT SS V
This slide exhibits a dashboard that provides real-time energy specific information from multiple smart meters. It includes elements such as voltage, energy consumption, energy meters, alarms alert, and amperage Welcome to our selection of the Empowering The Future Smart Meters Dashboard For Effective Energy IoT SS V. These are designed to help you showcase your creativity and bring your sphere to life. Planning and Innovation are essential for any business that is just starting out. This collection contains the designs that you need for your everyday presentations. All of our PowerPoints are 100Percent editable, so you can customize them to suit your needs. This multi-purpose template can be used in various situations. Grab these presentation templates today. This slide exhibits a dashboard that provides real-time energy specific information from multiple smart meters. It includes elements such as voltage, energy consumption, energy meters, alarms alert, and amperage
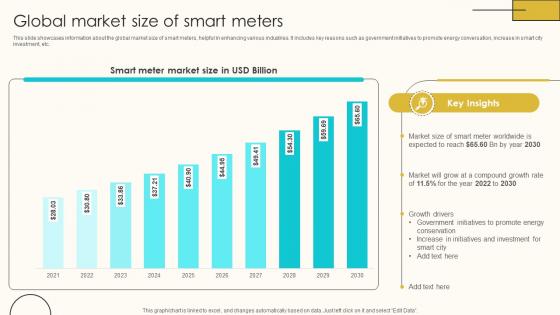
Global Market Size Of Smart Meters Internet Of Things Solutions To Enhance Energy IoT SS V
This slide showcases information about the global market size of smart meters, helpful in enhancing various industries. It includes key reasons such as government initiatives to promote energy conversation, increase in smart city investment, etc. From laying roadmaps to briefing everything in detail, our templates are perfect for you. You can set the stage with your presentation slides. All you have to do is download these easy-to-edit and customizable templates. Global Market Size Of Smart Meters Internet Of Things Solutions To Enhance Energy IoT SS V will help you deliver an outstanding performance that everyone would remember and praise you for. Do download this presentation today. This slide showcases information about the global market size of smart meters, helpful in enhancing various industries. It includes key reasons such as government initiatives to promote energy conversation, increase in smart city investment, etc.
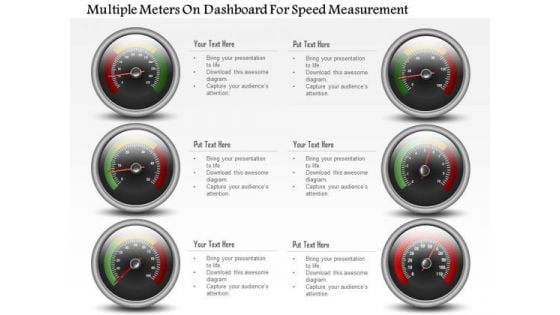
Business Diagram Multiple Meters On Dashboard For Speed Measurement PowerPoint Slide
This business diagram has been designed with multiple meters on dashboard. This slide can be used for business planning and progress. Use this diagram for your business and success milestones related presentations.
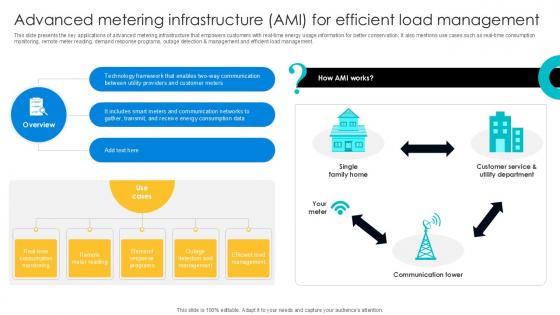
Advanced Metering Infrastructure Digital Transformation Journey PPT Slide DT SS V
This slide presents the key applications of advanced metering infrastructure that empowers customers with real-time energy usage information for better conservation. It also mentions use cases such as real-time consumption monitoring, remote meter reading, demand response programs, outage detection and management and efficient load management. Boost your pitch with our creative Advanced Metering Infrastructure Digital Transformation Journey PPT Slide DT SS V. Deliver an awe-inspiring pitch that will mesmerize everyone. Using these presentation templates you will surely catch everyones attention. You can browse the ppts collection on our website. We have researchers who are experts at creating the right content for the templates. So you do not have to invest time in any additional work. Just grab the template now and use them. This slide presents the key applications of advanced metering infrastructure that empowers customers with real-time energy usage information for better conservation. It also mentions use cases such as real-time consumption monitoring, remote meter reading, demand response programs, outage detection and management and efficient load management.
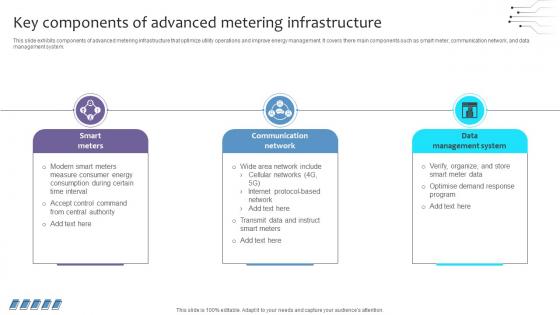
Empowering The Future Key Components Of Advanced Metering Infrastructure IoT SS V
This slide exhibits components of advanced metering infrastructure that optimize utility operations and improve energy management. It covers there main components such as smart meter, communication network, and data management system. Do you have to make sure that everyone on your team knows about any specific topic I yes, then you should give Empowering The Future Key Components Of Advanced Metering Infrastructure IoT SS V a try. Our experts have put a lot of knowledge and effort into creating this impeccable Empowering The Future Key Components Of Advanced Metering Infrastructure IoT SS V. You can use this template for your upcoming presentations, as the slides are perfect to represent even the tiniest detail. You can download these templates from the Slidegeeks website and these are easy to edit. So grab these today This slide exhibits components of advanced metering infrastructure that optimize utility operations and improve energy management. It covers there main components such as smart meter, communication network, and data management system.

Empowering The Future Introduction To Smart Meters Overview And Role IoT SS V
This slide exhibits information about smart meters that enable efficient data collection on energy utilisation. It covers benefits such as real-time monitoring, accurate billing, and remote management. Are you searching for a Empowering The Future Introduction To Smart Meters Overview And Role IoT SS V that is uncluttered, straightforward, and original Its easy to edit, and you can change the colors to suit your personal or business branding. For a presentation that expresses how much effort you have put in, this template is ideal With all of its features, including tables, diagrams, statistics, and lists, its perfect for a business plan presentation. Make your ideas more appealing with these professional slides. Download Empowering The Future Introduction To Smart Meters Overview And Role IoT SS V from Slidegeeks today. This slide exhibits information about smart meters that enable efficient data collection on energy utilisation. It covers benefits such as real-time monitoring, accurate billing, and remote management.
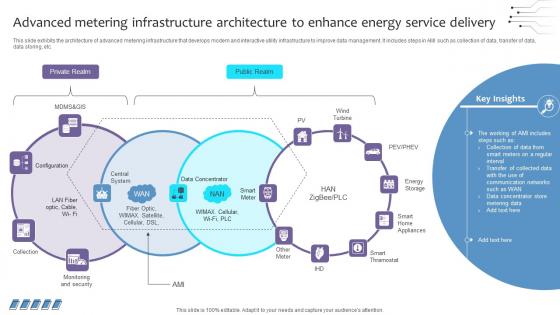
Empowering The Future Advanced Metering Infrastructure Architecture To Enhance IoT SS V
This slide exhibits the architecture of advanced metering infrastructure that develops modern and interactive utility infrastructure to improve data management. It includes steps in AMI such as collection of data, transfer of data, data storing, etc. There are so many reasons you need a Empowering The Future Advanced Metering Infrastructure Architecture To Enhance IoT SS V. The first reason is you can not spend time making everything from scratch, Thus, Slidegeeks has made presentation templates for you too. You can easily download these templates from our website easily. This slide exhibits the architecture of advanced metering infrastructure that develops modern and interactive utility infrastructure to improve data management. It includes steps in AMI such as collection of data, transfer of data, data storing, etc.

Empowering The Future Key Benefits Of Data Management In Smart Metering IoT SS V
This slide highlights data management in smart metering in order to enhance the overall efficiency of energy transmission and distribution.it covers key aspects such as data collection, data recording, data storing, data transmission, and data display. Want to ace your presentation in front of a live audience Our Empowering The Future Key Benefits Of Data Management In Smart Metering IoT SS V can help you do that by engaging all the users towards you. Slidegeeks experts have put their efforts and expertise into creating these impeccable powerpoint presentations so that you can communicate your ideas clearly. Moreover, all the templates are customizable, and easy-to-edit and downloadable. Use these for both personal and commercial use. This slide highlights data management in smart metering in order to enhance the overall efficiency of energy transmission and distribution.it covers key aspects such as data collection, data recording, data storing, data transmission, and data display.
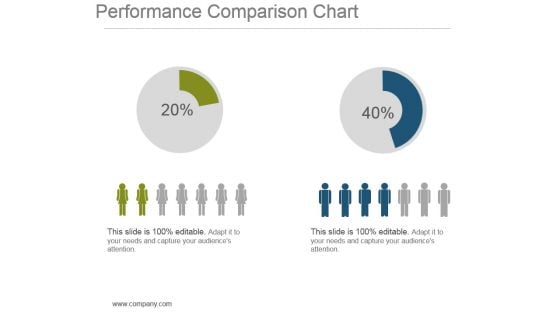
Performance Comparison Chart Powerpoint Show
This is a performance comparison chart powerpoint show. This is a two stage process. The stages in this process are finance, compare, strategy, management, planning.
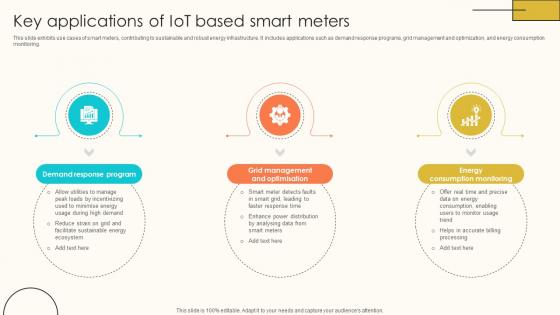
Key Applications Of IoT Based Smart Meters Internet Of Things Solutions To Enhance Energy IoT SS V
This slide exhibits use cases of smart meters, contributing to sustainable and robust energy infrastructure. It includes applications such as demand response programs, grid management and optimization, and energy consumption monitoring. The Key Applications Of IoT Based Smart Meters Internet Of Things Solutions To Enhance Energy IoT SS V is a compilation of the most recent design trends as a series of slides. It is suitable for any subject or industry presentation, containing attractive visuals and photo spots for businesses to clearly express their messages. This template contains a variety of slides for the user to input data, such as structures to contrast two elements, bullet points, and slides for written information. Slidegeeks is prepared to create an impression. This slide exhibits use cases of smart meters, contributing to sustainable and robust energy infrastructure. It includes applications such as demand response programs, grid management and optimization, and energy consumption monitoring.
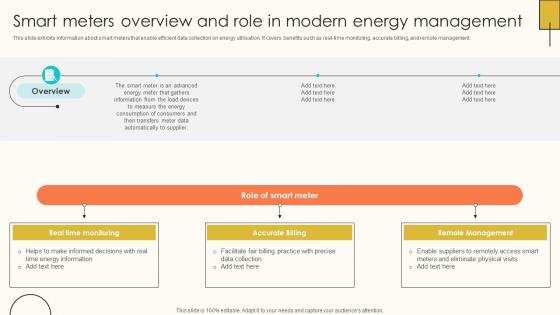
Smart Meters Overview And Role In Modern Internet Of Things Solutions To Enhance Energy IoT SS V
This slide exhibits information about smart meters that enable efficient data collection on energy utilisation. It covers benefits such as real-time monitoring, accurate billing, and remote management. Presenting this PowerPoint presentation, titled Smart Meters Overview And Role In Modern Internet Of Things Solutions To Enhance Energy IoT SS V, with topics curated by our researchers after extensive research. This editable presentation is available for immediate download and provides attractive features when used. Download now and captivate your audience. Presenting this Smart Meters Overview And Role In Modern Internet Of Things Solutions To Enhance Energy IoT SS V. Our researchers have carefully researched and created these slides with all aspects taken into consideration. This is a completely customizable Smart Meters Overview And Role In Modern Internet Of Things Solutions To Enhance Energy IoT SS V that is available for immediate downloading. Download now and make an impact on your audience. Highlight the attractive features available with our PPTs. This slide exhibits information about smart meters that enable efficient data collection on energy utilisation. It covers benefits such as real-time monitoring, accurate billing, and remote management.
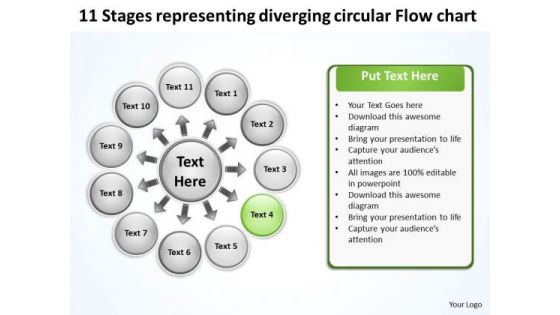
Representing Diverging Circular Flow Chart PowerPoint Templates
We present our representing diverging circular flow chart PowerPoint templates.Present our Ring charts PowerPoint Templates because this PPt slide helps you to measure key aspects of the current process and collect relevant data. Download our Circle charts PowerPoint Templates because the mind is always whirring with new ideas. Download our Process and Flows PowerPoint Templates because you have a clear vision of the cake you want. Download our Business PowerPoint Templates because you can Flutter your wings and enchant the world. Impress them with the innate attractiveness of your thoughts and words. Download our Marketing PowerPoint Templates because with the help of our Slides you can Illustrate your ideas one by one and demonstrate how each is an important cog in running the entire wheel.Use these PowerPoint slides for presentations relating to Circle, circulation, cobalt,colorful, cyan, cycle, element,emblem, grayshadow, green,icon, indicator, interface, internet, label,link, load, marker, motion, movement,navigationpanel, next, orientation, pagsite, pink, pointer, previous, process, reload, rotation, satined, sign, signpost,smooth, sticker, sticky, symbol. The prominent colors used in the PowerPoint template are Green, Black, White. Customers tell us our representing diverging circular flow chart PowerPoint templates will make the presenter successul in his career/life. We assure you our cobalt PowerPoint templates and PPT Slides are Nifty. PowerPoint presentation experts tell us our representing diverging circular flow chart PowerPoint templates are Fabulous. People tell us our grayshadow PowerPoint templates and PPT Slides will help you be quick off the draw. Just enter your specific text and see your points hit home. We assure you our representing diverging circular flow chart PowerPoint templates are Excellent. Use our cobalt PowerPoint templates and PPT Slides have awesome images to get your point across. Compile targets with our Representing Diverging Circular Flow Chart PowerPoint Templates. Download without worries with our money back guaranteee.
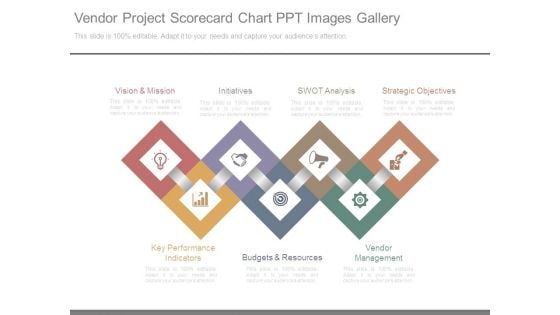
Vendor Project Scorecard Chart Ppt Images Gallery
This is a vendor project scorecard chart ppt images gallery. This is a seven stage process. The stages in this process are vision and mission, initiatives, swot analysis, strategic objectives, vendor management, budgets and resources, key performance indicators.
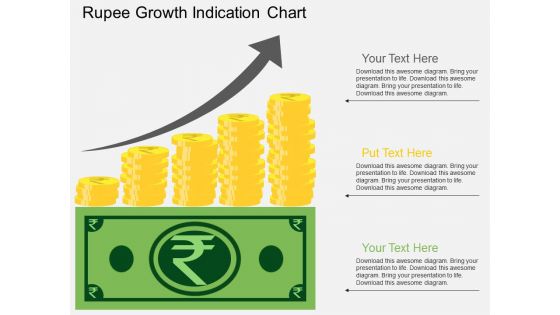
Rupee Growth Indication Chart Powerpoint Template
This business diagram displays rupee growth chart. This business diagram has been designed to implement strategic plan. Use this diagram to depict financial planning process in your presentations.
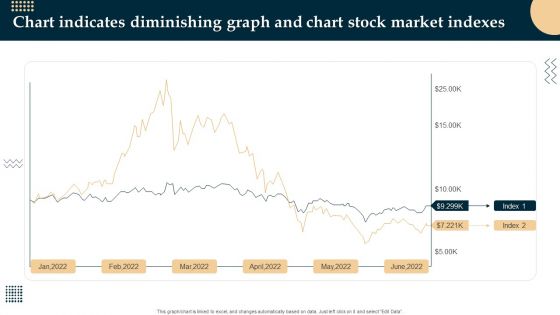
Chart Indicates Diminishing Graph And Chart Stock Market Indexes Themes PDF
Showcasing this set of slides titled Chart Indicates Diminishing Graph And Chart Stock Market Indexes Themes PDF. The topics addressed in these templates are Chart Indicates Diminishing Graph, Chart Stock Market Indexes. All the content presented in this PPT design is completely editable. Download it and make adjustments in color, background, font etc. as per your unique business setting.

Chart Indicates Diminishing Graph And Chart Cash Payment Mode Inspiration PDF
Showcasing this set of slides titled Chart Indicates Diminishing Graph And Chart Cash Payment Mode Inspiration PDF. The topics addressed in these templates are Chart Indicates Diminishing Graph, Chart Cash Payment Mode. All the content presented in this PPT design is completely editable. Download it and make adjustments in color, background, font etc. as per your unique business setting.

Chart Indicates Diminishing Graph And Chart Retail Value And Volume Download PDF
Pitch your topic with ease and precision using this Chart Indicates Diminishing Graph And Chart Retail Value And Volume Download PDF. This layout presents information on Chart Indicates Diminishing Graph, Chart Retail Value And Volume. It is also available for immediate download and adjustment. So, changes can be made in the color, design, graphics or any other component to create a unique layout.
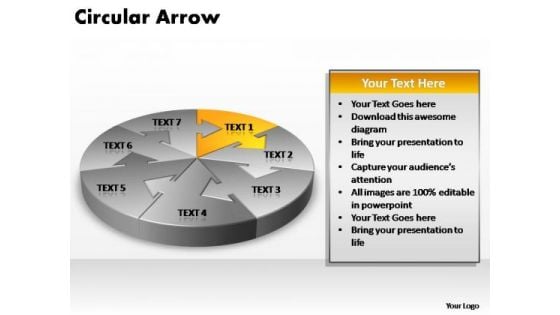
PowerPoint Template Chart Circular Arrow Ppt Slide Designs
PowerPoint Template Chart Circular Arrow PPT Slide Designs-The arrows indicate the progression of the process. Constant monitoring of the processes provides you with opportunities to concentrate on the core competencies in your business and improve the standards for more effective results.-PowerPoint Template Chart Circular Arrow PPT Slide Designs Our PowerPoint Template Chart Circular Arrow Ppt Slide Designs will be a feather in your cap. They will add to your enduring charm.
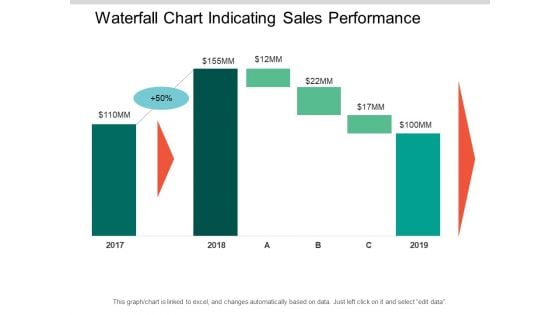
Waterfall Chart Indicating Sales Performance Ppt PowerPoint Presentation Outline Templates
This is a waterfall chart indicating sales performance ppt powerpoint presentation outline templates. This is a seven stage process. The stages in this process are sales waterfall, waterfall chart, business.
Scrum Kpis With Sprint Burndown Chart Ppt Icon Elements PDF
This slide illustrates scrum key performance indicators for individual sprints. It includes tasks, story points, bugs, burndown charts, statistics etc. Pitch your topic with ease and precision using this Scrum Kpis With Sprint Burndown Chart Ppt Icon Elements PDF. This layout presents information on Burndown Chart, Story Points, Cost, Bugs. It is also available for immediate download and adjustment. So, changes can be made in the color, design, graphics or any other component to create a unique layout.
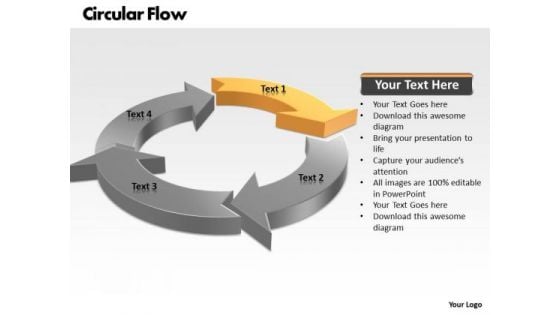
Ppt Circular Flow Process PowerPoint Presentation Chart 4 Stages Templates
PPT circular flow process powerpoint presentation chart 4 stages Templates-The diagrams are used to represent part whole relationship because results relationship etc. this is a 4 parts circle to express your ideas. They are indicators of the path you have in mind.-PPT circular flow process powerpoint presentation chart 4 stages Templates-Arrow, Chart, Circle, Circular, Circulation, Collection, Concept, Connection, Continuity, Cursor, Cycle, Cyclic, Diagram, Direction, Flow, Flowchart, Graph, Graphic, Group, Icon, Motion, Movement, Process, Progress, Recycle, Recycling, Refresh, Reload, Renew, Repetition, Return, Reuse, Ring, Rotation, Round, Sign, Six, Symbol Address eco-clubs with our Ppt Circular Flow Process PowerPoint Presentation Chart 4 Stages Templates. Advocate curbing of carbon emissions.
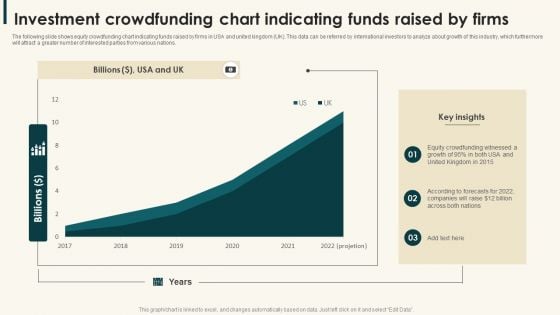
Investment Crowdfunding Chart Indicating Funds Raised By Firms Demonstration PDF
The following slide shows equity crowdfunding chart indicating funds raised by firms in USA and united kingdom UK. This data can be referred by international investors to analyze about growth of this industry, which furthermore will attract a greater number of interested parties from various nations.Showcasing this set of slides titled Investment Crowdfunding Chart Indicating Funds Raised By Firms Demonstration PDF. The topics addressed in these templates are Crowdfunding Witnessed, United Kingdom, Companies Raise. All the content presented in this PPT design is completely editable. Download it and make adjustments in color, background, font etc. as per your unique business setting.
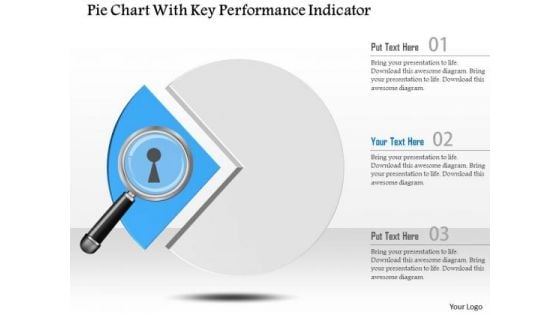
Business Diagram Pie Chart With Key Performance Indicator Presentation Template
This power point template slide has been crafted with graphic of pie chart and magnifier. This PPT contains the concept of performance indication. Use this PPT for data technology and business related presentations.
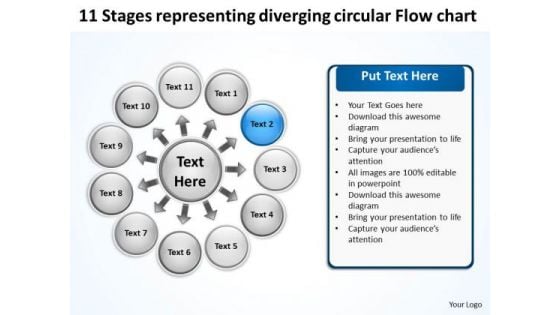
Representing Diverging Circular Flow Chart Process Diagram PowerPoint Templates
We present our representing diverging circular flow chart Process Diagram PowerPoint templates.Use our Ring charts PowerPoint Templates because your group can behave steady in the top bracket. Present our Circle charts PowerPoint Templates because this diagram helps you to harness the opportunities, celebrate your performance till date and focus on greater growth and expansion in coming years. Present our Process and Flows PowerPoint Templates because this slide helps you to give your team an overview of your capability and insight into the minute details of the overall picture highlighting the interdependence at every operational level. Download our Business PowerPoint Templates because you can Flutter your wings and enchant the world. Impress them with the innate attractiveness of your thoughts and words. Download our Marketing PowerPoint Templates because this slide represents the tools of the trade.Use these PowerPoint slides for presentations relating to Button,cerulean, circle, circulation, cobalt,colorful, cyan, cycle, element,emblem, grayshadow, green,icon, indicator, interface, internet, label,link, load, marker, motion, movement,navigationpanel, next, orientation, pagsite, pink, pointer, previous, process, reload, rotation, satined, sign, signpost,smooth, sticker, sticky, symbol. The prominent colors used in the PowerPoint template are Blue, Black, White. Customers tell us our representing diverging circular flow chart Process Diagram PowerPoint templates are Precious. We assure you our cycle PowerPoint templates and PPT Slides are Breathtaking. PowerPoint presentation experts tell us our representing diverging circular flow chart Process Diagram PowerPoint templates are Stunning. People tell us our circulation PowerPoint templates and PPT Slides are Tasteful. We assure you our representing diverging circular flow chart Process Diagram PowerPoint templates are Lush. Use our cyan PowerPoint templates and PPT Slides are Upbeat. Govern your team with our Representing Diverging Circular Flow Chart Process Diagram PowerPoint Templates. Download without worries with our money back guaranteee.
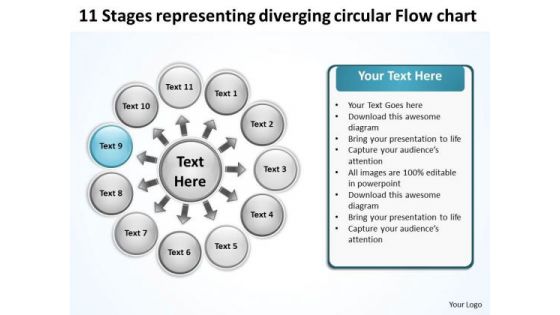
Representing Diverging Circular Flow Chart Process PowerPoint Slides
We present our representing diverging circular flow chart Process PowerPoint Slides.Use our Ring charts PowerPoint Templates because the lessons have been analyzed, studied and conclusions drawn. Present our Circle charts PowerPoint Templates because you will be able to Highlight these individual targets and the paths to their achievement. Use our Process and Flows PowerPoint Templates because this unique template give you an enthusiastic response and a purposeful Aye- Aye Sir. Download and present our Business PowerPoint Templates because you have had a great year or so business wise. It is time to celebrate the efforts of your team. Download our Marketing PowerPoint Templates because networking is an imperative in todays world. You need to access the views of others. Similarly you need to give access to them of your abilities.Use these PowerPoint slides for presentations relating to Cerulean, circle, circulation, cobalt,colorful, cyan, cycle, element,emblem, grayshadow, green,icon, indicator, interface, internet, label,link, load, marker, motion, movement,navigationpanel, next, orientation, pagsite, pink, pointer, previous, process, reload, rotation, satined, sign, signpost,smooth, sticker, sticky, symbol. The prominent colors used in the PowerPoint template are Blue light, Black, White. Customers tell us our representing diverging circular flow chart Process PowerPoint Slides are Lush. We assure you our cyan PowerPoint templates and PPT Slides are Adorable. PowerPoint presentation experts tell us our representing diverging circular flow chart Process PowerPoint Slides are Sparkling. People tell us our circulation PowerPoint templates and PPT Slides are Luxurious. We assure you our representing diverging circular flow chart Process PowerPoint Slides are Wistful. Use our element PowerPoint templates and PPT Slides are Handsome. Cure your organization's problems with our Representing Diverging Circular Flow Chart Process PowerPoint Slides. You will come out on top.
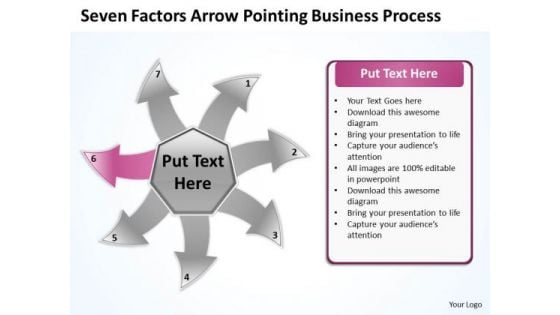
Free Business PowerPoint Templates Process Cycle Circular Flow Layout Chart
We present our free business powerpoint templates process cycle Circular Flow Layout Chart.Use our Communication PowerPoint Templates because the plans are in your head, stage by stage, year by year. Present our Arrows PowerPoint Templates because you have had your share of being a goldfish in a small bowl.you are ready to launch out and spread your wings. Download and present our Circle Charts PowerPoint Templates because they are the indicators of the path you have in mind. Download our Business PowerPoint Templates because your thoughts are pointed and sharp as arrows. Present our Shapes PowerPoint Templates because your group can behave steady in the top bracket.Use these PowerPoint slides for presentations relating to Arrow, Bio, Business, Chart, Circle, Concept, Control, Cycle, Design, Development, Diagram, Eco, Ecology, Environmental, Evaluate, Flow, Flowchart, Fresh, Graphic, Green, Idea, Infographic, Iterative, Life, Lifecycle, Management, Method, Model, Natural, Nature, Organic, Process, Quality, Recycle, Research, Schema, Spiral, Step, Strategy, Success, System. The prominent colors used in the PowerPoint template are Pink, Gray, White. Customers tell us our free business powerpoint templates process cycle Circular Flow Layout Chart are Adorable. Customers tell us our Concept PowerPoint templates and PPT Slides are Tranquil. Presenters tell us our free business powerpoint templates process cycle Circular Flow Layout Chart are Romantic. PowerPoint presentation experts tell us our Design PowerPoint templates and PPT Slides are Tranquil. Customers tell us our free business powerpoint templates process cycle Circular Flow Layout Chart are Efficient. Professionals tell us our Chart PowerPoint templates and PPT Slides provide you with a vast range of viable options. Select the appropriate ones and just fill in your text. Our Free Business PowerPoint Templates Process Cycle Circular Flow Layout Chart remain within bounds. They will never exceed their brief.
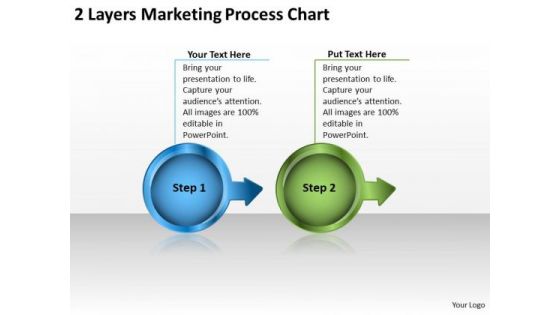
2 Layers Marketing Process Chart Flow PowerPoint Templates
We present our 2 layers marketing process chart flow PowerPoint templates.Use our Circle Charts PowerPoint Templates because,You can Inform your team of the various means they have to achieve them. Use our Arrows PowerPoint Templates because,You should Lay down the fundamentals to build upon. Use our Leadership PowerPoint Templates because,They are the indicators of the path you have in mind. Use our Business PowerPoint Templates because, Your fledgling career is in the chrysallis stage. Nurture it and watch it grow into a beautiful butterfly Use our Process and Flows PowerPoint Templates because,With the help of our Slides you can Illustrate the means to prevent or control them using our imaginative templates.Use these PowerPoint slides for presentations relating to 3d, abstract, analysis, chart, collaborate, communication, concept, conceptual, diagram, digital, flow, group, guide, idea, layer, leadership, management, marketing, meeting, organization, path, plan, present, presentation, process, program, section, strategy, team, teamwork, . The prominent colors used in the PowerPoint template are Blue, Green, Black. People tell us our 2 layers marketing process chart flow PowerPoint templates are Enchanting. The feedback we get is that our diagram PowerPoint templates and PPT Slides are Fun. People tell us our 2 layers marketing process chart flow PowerPoint templates are Nostalgic. Presenters tell us our concept PowerPoint templates and PPT Slides are Stylish. The feedback we get is that our 2 layers marketing process chart flow PowerPoint templates are incredible easy to use. Professionals tell us our diagram PowerPoint templates and PPT Slides are Efficacious. Make a powerful statement with our 2 Layers Marketing Process Chart Flow PowerPoint Templates. You'll always stay ahead of the game.
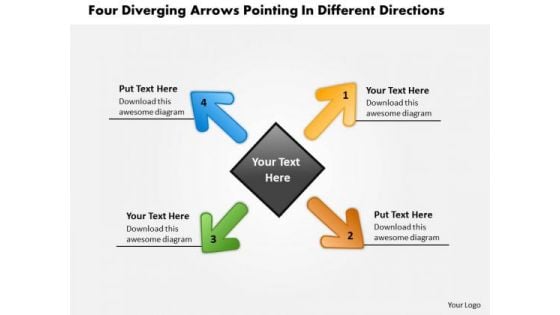
Arrows Pointing Different Directions Circular Flow Chart PowerPoint Templates
We present our arrows pointing different directions Circular Flow Chart PowerPoint templates.Download our Arrows PowerPoint Templates because you can Amplify your views, ideas and thoughts from very basic aspects to the highly technical and complicated issus using this template as a tool. Download our Business PowerPoint Templates because you can Flutter your wings and enchant the world. Impress them with the innate attractiveness of your thoughts and words. Download our Shapes PowerPoint Templates because this slide depicts the occasion for gifting and giving. Download our Metaphors-Visual Concepts PowerPoint Templates because you can Present your views on the methods using our self-explanatory templates. Use our Flow Charts PowerPoint Templates because it Saves your time as a prized possession, an ideal aid to give an ideal presentation.Use these PowerPoint slides for presentations relating to arrow, arrowheads, badge, banner, blue, button, cerulean, cobalt, colored, colorful, connection, cursor, cyan, design element, designator, directional, download, emblem, gray shadow, green, icon, indicator, interface, internet, link, load, magenta, marker, matted, menu tool, navigation panel, next, orientation, page site, pictogram, pink, pointer, red, right, satined, sign, signpost, smooth, symbol, upload, vector illustration, web, web 2.0, white background. The prominent colors used in the PowerPoint template are Green, Blue, Orange. Presenters tell us our arrows pointing different directions Circular Flow Chart PowerPoint templates have awesome images to get your point across. You can be sure our colored PowerPoint templates and PPT Slides are Functional. Professionals tell us our arrows pointing different directions Circular Flow Chart PowerPoint templates are visually appealing. People tell us our banner PowerPoint templates and PPT Slides are Nice. People tell us our arrows pointing different directions Circular Flow Chart PowerPoint templates are Efficacious. Professionals tell us our blue PowerPoint templates and PPT Slides are Royal. Burst through the ceiling with our Arrows Pointing Different Directions Circular Flow Chart PowerPoint Templates. Rise strongly above created barriers.
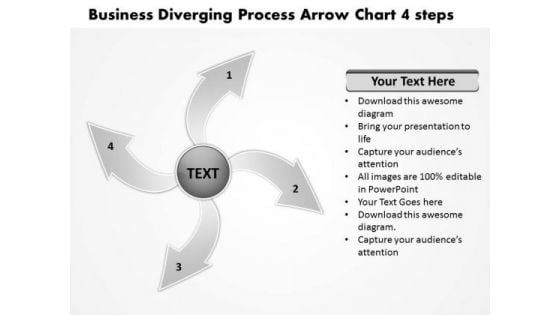
Presentation Diverging Process Arrow Chart 4 Steps Cycle PowerPoint Slides
We present our presentation diverging process arrow chart 4 steps Cycle PowerPoint Slides.Present our Arrows PowerPoint Templates because this PPt slide highlights any anticipated problems, shortfalls or weak areas. Use our Flow charts PowerPoint Templates because displaying your ideas and highlighting your ability will accelerate the growth of your company and yours. Use our Process and Flows PowerPoint Templates because the fruit of your labour is about to ripen. Download and present our Business PowerPoint Templates because the great Bald headed Eagle embodies your personality. the eagle eye to seize upon the smallest of opportunities. Use our Shapes PowerPoint Templates because the ideas and plans are on your finger tips.Use these PowerPoint slides for presentations relating to Button,cerulean, circle, circulation, cobalt,colorful,cycle, element,emblem, grayshadow, green,icon, indicator, interface, internet, label,link, load, marker, motion, movement,navigationpanel, next, orientation, pagsite, pink, pointer, previous, process, reload, rotation, satined, sign, signpost,smooth, sticker, sticky, symbol. The prominent colors used in the PowerPoint template are Gray, Black, White. Customers tell us our presentation diverging process arrow chart 4 steps Cycle PowerPoint Slides are Zippy. We assure you our cobalt PowerPoint templates and PPT Slides are Pleasant. PowerPoint presentation experts tell us our presentation diverging process arrow chart 4 steps Cycle PowerPoint Slides are Fancy. People tell us our cycle PowerPoint templates and PPT Slides are Striking. We assure you our presentation diverging process arrow chart 4 steps Cycle PowerPoint Slides are Romantic. Use our circle PowerPoint templates and PPT Slides are Awesome. Our Presentation Diverging Process Arrow Chart 4 Steps Cycle PowerPoint Slides fall in step with your thought. They will go through the drill with you.
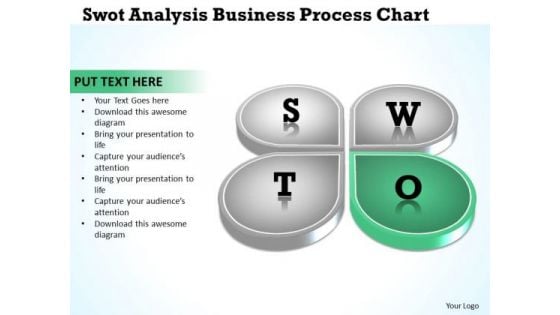
Business Logic Diagram Analysis PowerPoint Theme Process Chart Ppt Templates
We present our business logic diagram analysis powerpoint theme process chart ppt templates.Download and present our Business PowerPoint Templates because Our PowerPoint Templates and Slides are conceived by a dedicated team. Use them and give form to your wondrous ideas. Download and present our Shapes PowerPoint Templates because These PowerPoint Templates and Slides will give the updraft to your ideas. See them soar to great heights with ease. Use our Success PowerPoint Templates because You can Create a matrix with our PowerPoint Templates and Slides. Feel the strength of your ideas click into place. Download and present our Flow Charts PowerPoint Templates because You canTake a leap off the starting blocks with our PowerPoint Templates and Slides. They will put you ahead of the competition in quick time. Download and present our Process and Flows PowerPoint Templates because Our PowerPoint Templates and Slides will bullet point your ideas. See them fall into place one by one.Use these PowerPoint slides for presentations relating to Business, center, circle, circular, circulation, concept, control, cycle, development, diagram, direction, flow, graphic, green, idea, illustration, indicator, iterative, life, lifecycle, loop, management, method, mix, motion, movement, nature, pointer, process, propeller, quality, range, recycling, research, ring, rotation, round, schema, spectrum, spiral, step, strategy, success. The prominent colors used in the PowerPoint template are Green, Gray, White. People tell us our business logic diagram analysis powerpoint theme process chart ppt templates are designed by a team of presentation professionals. PowerPoint presentation experts tell us our circular PowerPoint templates and PPT Slides are designed by professionals Presenters tell us our business logic diagram analysis powerpoint theme process chart ppt templates are aesthetically designed to attract attention. We guarantee that they will grab all the eyeballs you need. Use our control PowerPoint templates and PPT Slides will impress their bosses and teams. Customers tell us our business logic diagram analysis powerpoint theme process chart ppt templates are designed by a team of presentation professionals. People tell us our circular PowerPoint templates and PPT Slides are aesthetically designed to attract attention. We guarantee that they will grab all the eyeballs you need. Dont ignore the perils of a boring presentation. Liven it up with our Business Logic Diagram Analysis PowerPoint Theme Process Chart Ppt Templates. Make sure your presentation gets the attention it deserves.
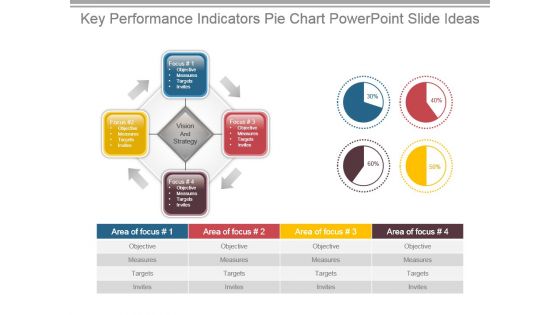
Key Performance Indicators Pie Chart Powerpoint Slide Ideas
This is a key performance indicators pie chart powerpoint slide ideas. This is a four stage process. The stages in this process are focus, objectives, measures, targets, invites, vision and strategy, area of focus.
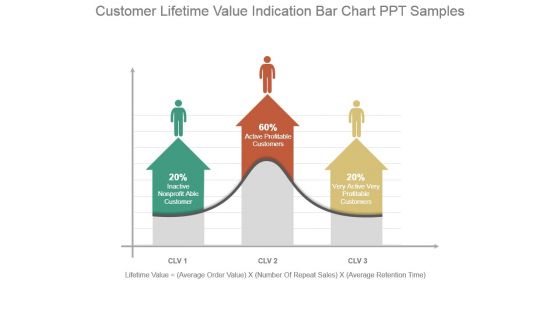
Customer Lifetime Value Indication Bar Chart Ppt Samples
This is a customer lifetime value indication bar chart ppt samples. This is a three stage process. The stages in this process are inactive nonprofit able customer, active profitable customers, very active very profitable customers, lifetime value, average order value, number of repeat sales, average retention time.
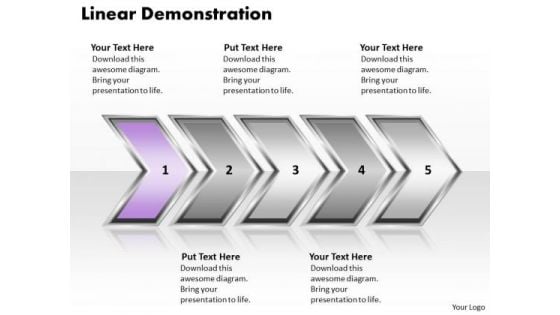
Ppt Linear Demonstration Of Arrows PowerPoint 2010 Org Chart Templates
PPT linear demonstration of arrows powerpoint 2010 org chart Templates-Life and Business is made up of processes comprising stages that flow from one to another. An excellent graphic to attract the attention of and understanding by your audience to improve earnings.-PPT linear demonstration of arrows powerpoint 2010 org chart Templates-Aim, Arrow, Arrowheads, Badge, Border, Click, Connection, Curve, Design, Direction, Download, Element, Fuchsia, Icon, Illustration, Indicator, Internet, Magenta, Mark, Object, Orientation, Pointer, Shadow, Shape, Sign Encourage creativity with our Ppt Linear Demonstration Of Arrows PowerPoint 2010 Org Chart Templates. You will come out on top.
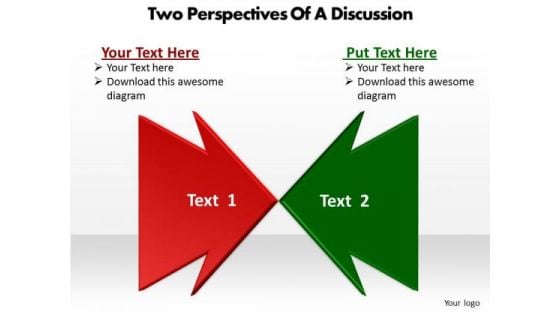
Two Perspectives Of A Discussion Cycle Chart PowerPoint Slides
We present our two perspectives of a discussion Cycle Chart PowerPoint Slides.Use our Marketing PowerPoint Templates because customer satisfaction is a mantra of the marketplace. Building a loyal client base is an essential element of your business. Download and present our Business PowerPoint Templates because your thoughts are pointed and sharp as arrows. Download our Shapes PowerPoint Templates because there is a very good saying that prevention is better than cure, either way you have a store of knowledge for sure. Use our Finance PowerPoint Templates because you have the right arrows in your quiver. Use our Symbol PowerPoint Templates because this Slide offers an excellent background to build up the various stages of your business process.Use these PowerPoint slides for presentations relating to Arrow, Background, Banner, Bar, Blue, Collection, Completed, Completion, Concept, Confirmation, Design, Five, Flow, Four, Graph, Graphic, Illustration, Indication, Indicator, Information, Instruction, Interface, Internet, Layout, Measurement, Modern, Number, One, Order, Phase, Pointer, Process, Progress, Reflection, Scale, Send, Set, Shape, Stage, Status, Step, Design, Web, Design, Elements. The prominent colors used in the PowerPoint template are Red, Green, Black. We assure you our two perspectives of a discussion Cycle Chart PowerPoint Slides are Sparkling. Customers tell us our Bar PowerPoint templates and PPT Slides are Radiant. The feedback we get is that our two perspectives of a discussion Cycle Chart PowerPoint Slides are Bright. We assure you our Collection PowerPoint templates and PPT Slides will get their audience's attention. People tell us our two perspectives of a discussion Cycle Chart PowerPoint Slides are Efficient. We assure you our Completed PowerPoint templates and PPT Slides are Efficient. Diversify plans with our Two Perspectives Of A Discussion Cycle Chart PowerPoint Slides. Download without worries with our money back guaranteee.

CRM Different Software Product Comparison Chart Portrait PDF
This slide indicates product comparison of two different software. It includes variables like free trial, contact management, deal management, task management, social integration, email integration, analytics and dashboards, etc. Presenting CRM Different Software Product Comparison Chart Portrait PDF to dispense important information. This template comprises three stages. It also presents valuable insights into the topics including Deal Management, Task Management, Advertising Management. This is a completely customizable PowerPoint theme that can be put to use immediately. So, download it and address the topic impactfully.
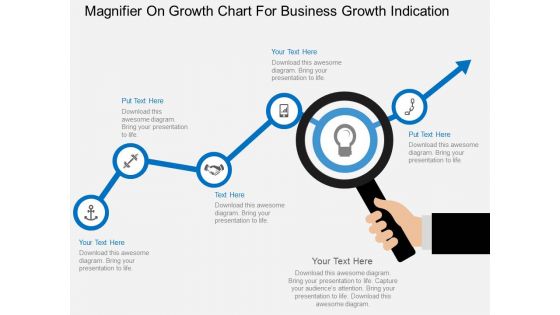
Magnifier On Growth Chart For Business Growth Indication Powerpoint Template
This business slide contains graphics of magnifier on growth chart. This PowerPoint template helps to display business planning and analysis. Use this diagram to impart more clarity to concept and to create more sound impact on viewers.
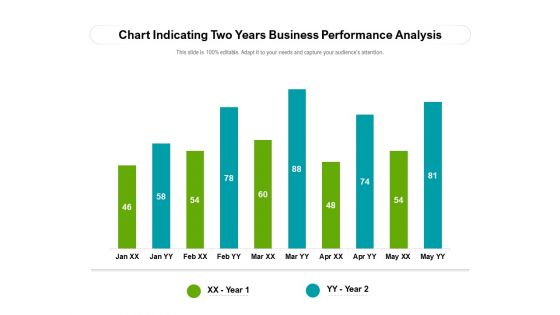
Chart Indicating Two Years Business Performance Analysis Ppt PowerPoint Presentation File Grid PDF
Showcasing this set of slides titled chart indicating two years business performance analysis ppt powerpoint presentation file grid pdf. The topics addressed in these templates are chart indicating two years business performance analysis. All the content presented in this PPT design is completely editable. Download it and make ajustments in color, background, font etc. as per your unique business setting.
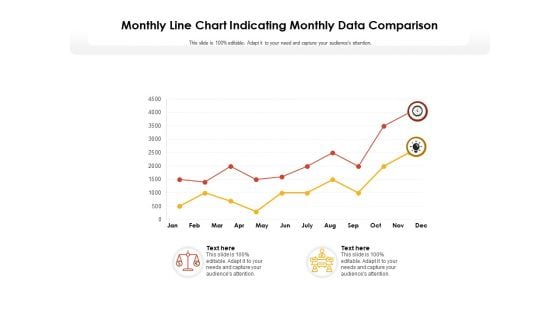
Monthly Line Chart Indicating Monthly Data Comparison Ppt PowerPoint Presentation Model Slide Portrait
Showcasing this set of slides titled monthly line chart indicating monthly data comparison ppt powerpoint presentation model slide portrait. The topics addressed in these templates are monthly line chart indicating monthly data comparison. All the content presented in this PPT design is completely editable. Download it and make adjustments in color, background, font etc. as per your unique business setting.
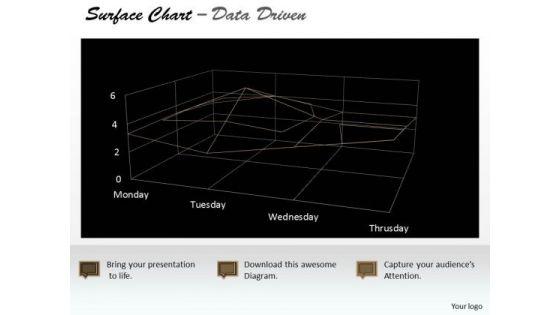
Data Analysis Template Driven Surface Chart Indicating Areas PowerPoint Slides Templates
Highlight Your Drive With Our data analysis template driven surface chart indicating areas powerpoint slides Templates . Prove The Fact That You Have Control.
Barometer And Bar Chart Benchmarking Vector Icon Ppt PowerPoint Presentation File Background PDF
Showcasing this set of slides titled barometer and bar chart benchmarking vector icon ppt powerpoint presentation file background pdf. The topics addressed in these templates are barometer and bar chart benchmarking vector icon. All the content presented in this PPT design is completely editable. Download it and make ajustments in color, background, font etc. as per your unique business setting.


 Continue with Email

 Home
Home


