Meter Icon
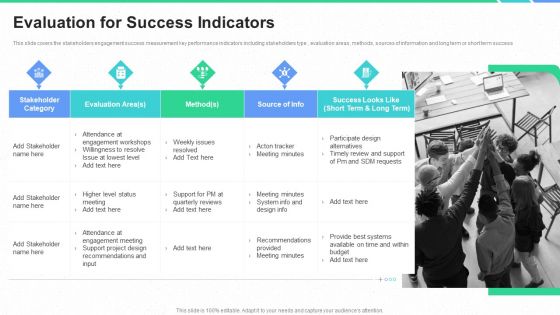
Stakeholders Participation Project Development Process Evaluation For Success Indicators Diagrams PDF
This slide covers the stakeholders engagement success measurement key performance indicators including stakeholders type , evaluation areas, methods, sources of information and long term or short term success. This is a stakeholders participation project development process evaluation for success indicators diagrams pdf template with various stages. Focus and dispense information on one stage using this creative set, that comes with editable features. It contains large content boxes to add your information on topics like stakeholder category, provide best systems available on time and within budget, support project design recommendations and input, meeting minutes. You can also showcase facts, figures, and other relevant content using this PPT layout. Grab it now.
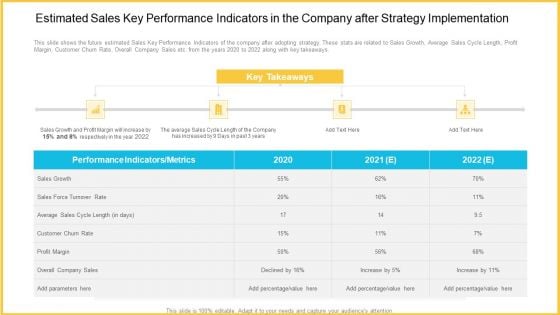
Estimated Sales Key Performance Indicators In The Company After Strategy Implementation Diagrams PDF
This slide shows the future estimated Sales Key Performance Indicators of the company after adopting strategy. These stats are related to Sales Growth, Average Sales Cycle Length, Profit Margin, Customer Churn Rate, Overall Company Sales etc. from the years 2020 to 2022 along with key takeaways. Deliver an awe-inspiring pitch with this creative estimated sales key performance indicators in the company after strategy implementation diagrams pdf. bundle. Topics like sales growth, sales force turnover rate, customer churn rate, profit margin, overall company sales can be discussed with this completely editable template. It is available for immediate download depending on the needs and requirements of the user.
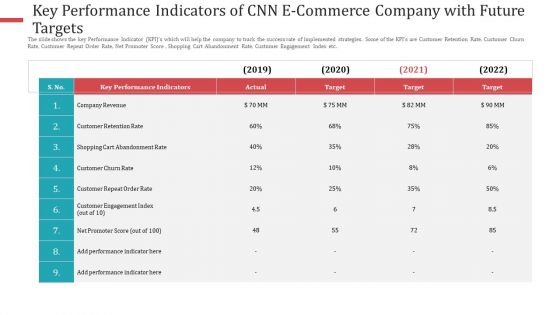
Key Performance Indicators Of CNN E Commerce Company With Future Targets Diagrams PDF
The slide shows the key Performance Indicator KPIs which will help the company to track the success rate of implemented strategies. Some of the KPIs are Customer Retention Rate, Customer Churn Rate, Customer Repeat Order Rate, Net Promoter Score , Shopping Cart Abandonment Rate, Customer Engagement Index etc.Deliver and pitch your topic in the best possible manner with this key performance indicators of CNN e commerce company with future targets diagrams pdf. Use them to share invaluable insights on customer retention rate, shopping cart abandonment rate, 2019 to 2022 and impress your audience. This template can be altered and modified as per your expectations. So, grab it now.
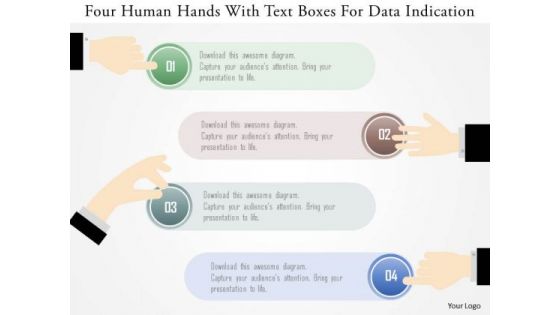
Business Diagram Four Human Hands With Text Boxes For Data Indication Ppt Template
Graphic of four human hands with text boxes are used to design this power point template. This PPT contains the concept of data indication. Use this PPT for your data related topics in any presentation.
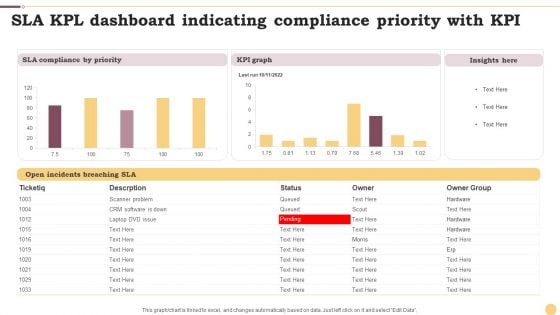
SLA KPL Dashboard Indicating Compliance Priority With KPI Ppt File Format PDF
This graph or chart is linked to excel, and changes automatically based on data. Just left click on it and select Edit Data. Showcasing this set of slides titled SLA KPL Dashboard Indicating Compliance Priority With KPI Ppt File Format PDF. The topics addressed in these templates are KPI Graph, Insights Here, SLA Compliance Priority. All the content presented in this PPT design is completely editable. Download it and make adjustments in color, background, font etc. as per your unique business setting.
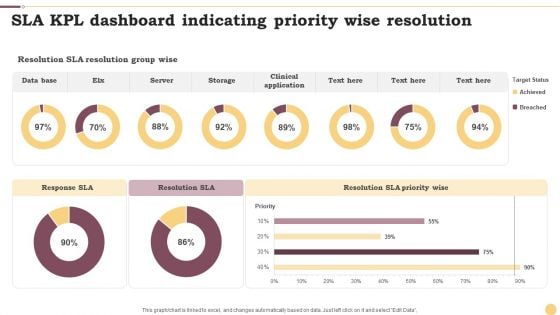
SLA KPL Dashboard Indicating Priority Wise Resolution Ppt Infographics Example File PDF
This graph or chart is linked to excel, and changes automatically based on data. Just left click on it and select Edit Data. Pitch your topic with ease and precision using this SLA KPL Dashboard Indicating Priority Wise Resolution Ppt Infographics Example File PDF. This layout presents information on Data Base, Server, Storage. It is also available for immediate download and adjustment. So, changes can be made in the color, design, graphics or any other component to create a unique layout.
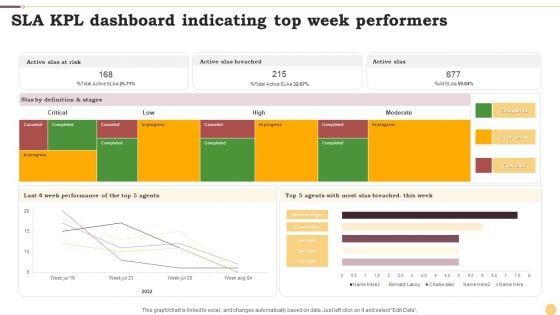
SLA KPL Dashboard Indicating Top Week Performers Ppt Infographics Examples PDF
This graph or chart is linked to excel, and changes automatically based on data. Just left click on it and select Edit Data. Showcasing this set of slides titled SLA KPL Dashboard Indicating Top Week Performers Ppt Infographics Examples PDF. The topics addressed in these templates are Active Slas Risk, Active Slas Breached, Active Slas. All the content presented in this PPT design is completely editable. Download it and make adjustments in color, background, font etc. as per your unique business setting.
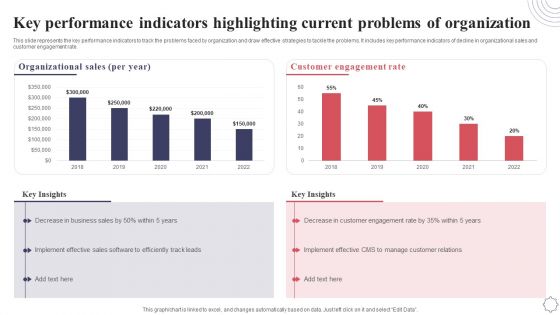
Key Performance Indicators Highlighting Current Problems Of Organization Application Deployment Project Plan Rules PDF
This slide represents the key performance indicators to track the problems faced by organization and draw effective strategies to tackle the problems. It includes key performance indicators of decline in organizational sales and customer engagement rate. Coming up with a presentation necessitates that the majority of the effort goes into the content and the message you intend to convey. The visuals of a PowerPoint presentation can only be effective if it supplements and supports the story that is being told. Keeping this in mind our experts created Key Performance Indicators Highlighting Current Problems Of Organization Application Deployment Project Plan Rules PDF to reduce the time that goes into designing the presentation. This way, you can concentrate on the message while our designers take care of providing you with the right template for the situation.
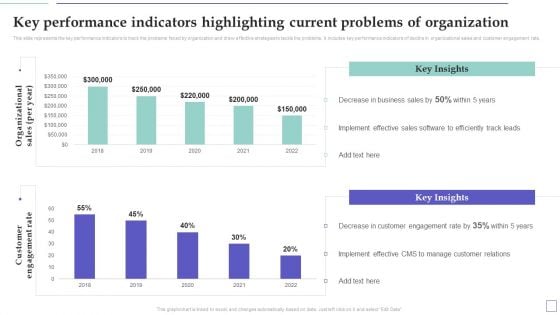
System Deployment Project Key Performance Indicators Highlighting Current Problems Information PDF
This slide represents the key performance indicators to track the problems faced by organization and draw effective strategies to tackle the problems. It includes key performance indicators of decline in organizational sales and customer engagement rate. Coming up with a presentation necessitates that the majority of the effort goes into the content and the message you intend to convey. The visuals of a PowerPoint presentation can only be effective if it supplements and supports the story that is being told. Keeping this in mind our experts created System Deployment Project Key Performance Indicators Highlighting Current Problems Information PDF to reduce the time that goes into designing the presentation. This way, you can concentrate on the message while our designers take care of providing you with the right template for the situation.
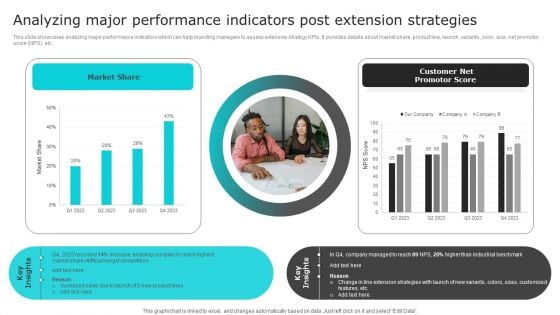
Nike Brand Expansion Analyzing Major Performance Indicators Post Extension Strategies Rules PDF
This slide showcases analyzing major performance indicators which can help branding managers to assess extension strategy KPIs. It provides details about market share, product line, launch, variants, color, size, net promotor score NPS, etc. Formulating a presentation can take up a lot of effort and time, so the content and message should always be the primary focus. The visuals of the PowerPoint can enhance the presenters message, so our Nike Brand Expansion Analyzing Major Performance Indicators Post Extension Strategies Rules PDF was created to help save time. Instead of worrying about the design, the presenter can concentrate on the message while our designers work on creating the ideal templates for whatever situation is needed. Slidegeeks has experts for everything from amazing designs to valuable content, we have put everything into Nike Brand Expansion Analyzing Major Performance Indicators Post Extension Strategies Rules PDF.
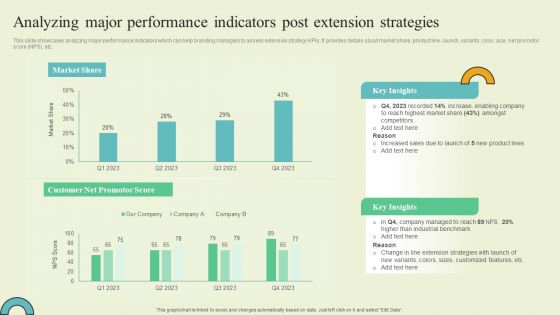
Extending Brand To Introduce New Commodities And Offerings Analyzing Major Performance Indicators Demonstration PDF
This slide showcases analyzing major performance indicators which can help branding managers to assess extension strategy KPIs. It provides details about market share, product line, launch, variants, color, size, net promotor score NPS, etc. Create an editable Extending Brand To Introduce New Commodities And Offerings Analyzing Major Performance Indicators Demonstration PDF that communicates your idea and engages your audience. Whether youre presenting a business or an educational presentation, pre designed presentation templates help save time. Extending Brand To Introduce New Commodities And Offerings Analyzing Major Performance Indicators Demonstration PDF is highly customizable and very easy to edit, covering many different styles from creative to business presentations. Slidegeeks has creative team members who have crafted amazing templates. So, go and get them without any delay.
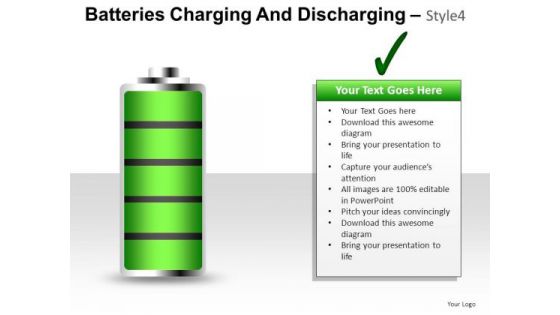
Indicator Batteries Charging And Discharging 4 PowerPoint Slides And Ppt Diagram Templates
Indicator Batteries Charging And Discharging 4 PowerPoint Slides And PPT Diagram Templates-These high quality powerpoint pre-designed slides and powerpoint templates have been carefully created by our professional team to help you impress your audience. All slides have been created and are 100% editable in powerpoint. Each and every property of any graphic - color, size, orientation, shading, outline etc. can be modified to help you build an effective powerpoint presentation. Any text can be entered at any point in the powerpoint template or slide. Simply DOWNLOAD, TYPE and PRESENT! Our Indicator Batteries Charging And Discharging 4 PowerPoint Slides And Ppt Diagram Templates help figure it out. Address the core aspects and dig up answers.

Indicator Batteries Charging And Discharging 5 PowerPoint Slides And Ppt Diagram Templates
Indicator Batteries Charging And Discharging 5 PowerPoint Slides And PPT Diagram Templates-These high quality powerpoint pre-designed slides and powerpoint templates have been carefully created by our professional team to help you impress your audience. All slides have been created and are 100% editable in powerpoint. Each and every property of any graphic - color, size, orientation, shading, outline etc. can be modified to help you build an effective powerpoint presentation. Any text can be entered at any point in the powerpoint template or slide. Simply DOWNLOAD, TYPE and PRESENT! Our Indicator Batteries Charging And Discharging 5 PowerPoint Slides And Ppt Diagram Templates will ensure your ideas are presented well. You will be glad you tried us out.
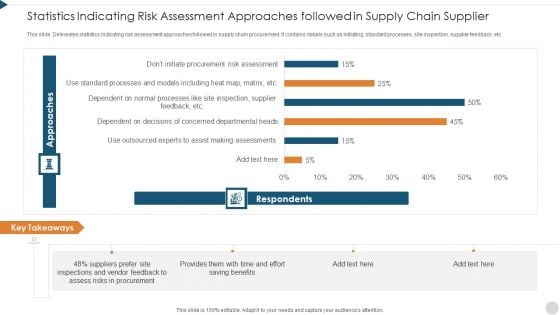
Statistics Indicating Risk Assessment Approaches Followed In Supply Chain Supplier Designs PDF
This slide. Delineates statistics indicating risk assessment approaches followed in supply chain procurement. It contains details such as initiating, standard processes, site inspection, supplier feedback, etc. Pitch your topic with ease and precision using this statistics indicating risk assessment approaches followed in supply chain supplier designs pdf. This layout presents information on key takeaways, approaches, respondents. It is also available for immediate download and adjustment. So, changes can be made in the color, design, graphics or any other component to create a unique layout.
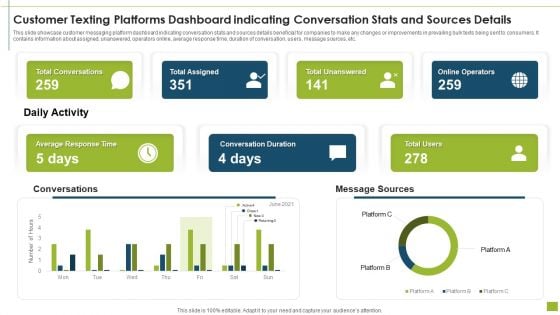
Customer Texting Platforms Dashboard Indicating Conversation Stats And Sources Details Ideas PDF
This slide showcase customer messaging platform dashboard indicating conversation stats and sources details beneficial for companies to make any changes or improvements in prevailing bulk texts being sent to consumers. It contains information about assigned, unanswered, operators online, average response time, duration of conversation, users, message sources, etc.Showcasing this set of slides titled customer texting platforms dashboard indicating conversation stats and sources details ideas pdf The topics addressed in these templates are total conversations, total assigned, total unanswered All the content presented in this PPT design is completely editable. Download it and make adjustments in color, background, font etc. as per your unique business setting.
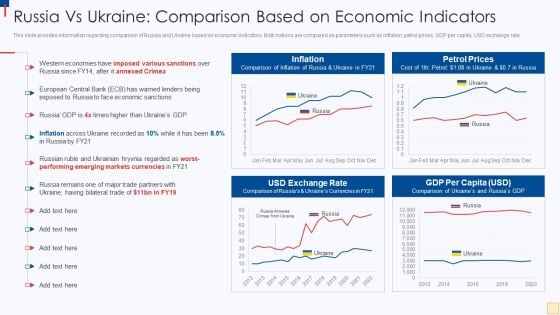
Ukraine Vs Russia Examining Russia Vs Ukraine Comparison Based On Economic Indicators Sample PDF
This slide provides information regarding comparison of Russia and Ukraine based on economic indicators. Both nations are compared on parameters such as inflation, petrol prices, GDP per capita, USD exchange rate. Deliver an awe inspiring pitch with this creative Ukraine Vs Russia Examining Russia Vs Ukraine Comparison Based On Economic Indicators Sample PDF bundle. Topics like Inflation, Petrol Prices, USD Exchange Rate, GDP Per Capita can be discussed with this completely editable template. It is available for immediate download depending on the needs and requirements of the user.
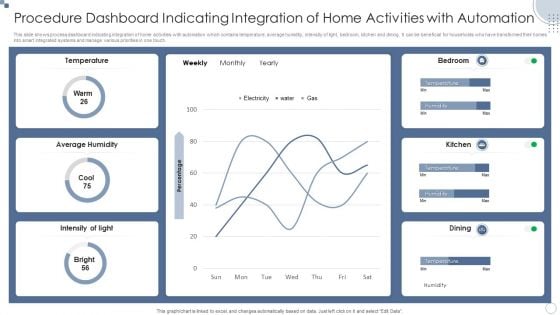
Procedure Dashboard Indicating Integration Of Home Activities With Automation Ppt PowerPoint Presentation File Files PDF
This slide shows process dashboard indicating integration of home activities with automation which contains temperature, average humidity, intensity of light, bedroom, kitchen and dining. It can be beneficial for households who have transformed their homes into smart integrated systems and manage various priorities in one touch.Showcasing this set of slides titled Procedure Dashboard Indicating Integration Of Home Activities With Automation Ppt PowerPoint Presentation File Files PDF. The topics addressed in these templates are Average Humidity, Temperature, Intensity Light. All the content presented in this PPT design is completely editable. Download it and make adjustments in color, background, font etc. as per your unique business setting.
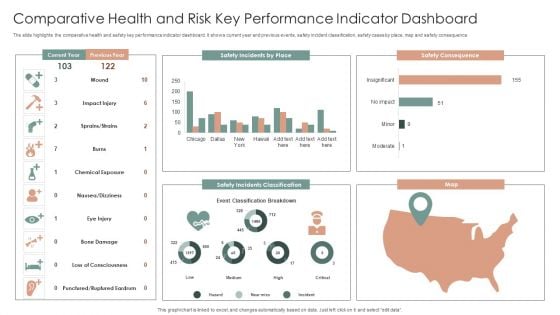
Comparative Health And Risk Key Performance Indicator Dashboard Ppt Portfolio Slide PDF
The slide highlights the comparative health and safety key performance indicator dashboard. It shows current year and previous events, safety incident classification, safety cases by place, map and safety consequence. Showcasing this set of slides titled Comparative Health And Risk Key Performance Indicator Dashboard Ppt Portfolio Slide PDF. The topics addressed in these templates are Safety Consequence, Safety Incidents Classification, Map. All the content presented in this PPT design is completely editable. Download it and make adjustments in color, background, font etc. as per your unique business setting.
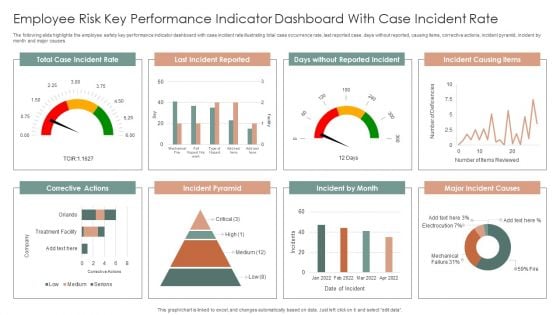
Employee Risk Key Performance Indicator Dashboard With Case Incident Rate Ppt Professional Information PDF
The following slide highlights the employee safety key performance indicator dashboard with case incident rate illustrating total case occurrence rate, last reported case, days without reported, causing items, corrective actions, incident pyramid, incident by month and major causes. Pitch your topic with ease and precision using this Employee Risk Key Performance Indicator Dashboard With Case Incident Rate Ppt Professional Information PDF. This layout presents information on Total Case, Incident Rate, Last Incident Reported, Incident Causing Items. It is also available for immediate download and adjustment. So, changes can be made in the color, design, graphics or any other component to create a unique layout.
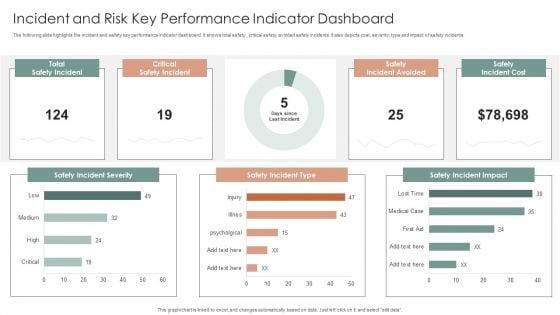
Incident And Risk Key Performance Indicator Dashboard Ppt Gallery Mockup PDF
The following slide highlights the incident and safety key performance indicator dashboard. It shows total safety, critical safety, avoided safety incidents. It also depicts cost, severity, type and impact of safety incidents. Showcasing this set of slides titled Incident And Risk Key Performance Indicator Dashboard Ppt Gallery Mockup PDF. The topics addressed in these templates are Safety Incident Severity, Safety Incident Type, Safety Incident Impact. All the content presented in this PPT design is completely editable. Download it and make adjustments in color, background, font etc. as per your unique business setting.

Patient Health And Risk Key Performance Indicator Dashboard Ppt Infographic Template Summary PDF
The following slide highlights the patient health and safety key performance indicator dashboard illustrating admission by department, admission by cost, patient satisfaction, total patients, operations cost, patient density, total staff, waiting time, treatment satisfaction and treatment confidence. Pitch your topic with ease and precision using this Patient Health And Risk Key Performance Indicator Dashboard Ppt Infographic Template Summary PDF. This layout presents information on Admission By Department, Admission Vs Cost, Patient Satisfaction. It is also available for immediate download and adjustment. So, changes can be made in the color, design, graphics or any other component to create a unique layout.
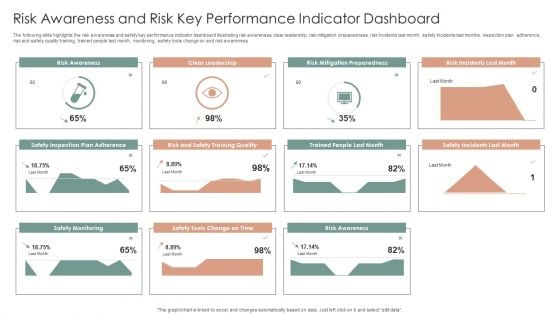
Risk Awareness And Risk Key Performance Indicator Dashboard Ppt Inspiration Ideas PDF
The following slide highlights the risk awareness and safety key performance indicator dashboard illustrating risk awareness, clear leadership, risk mitigation preparedness, risk incidents last month, safety incidents last months, inspection plan adherence, risk and safety quality training, trained people last month, monitoring, safety tools change on and risk awareness. Showcasing this set of slides titled Risk Awareness And Risk Key Performance Indicator Dashboard Ppt Inspiration Ideas PDF. The topics addressed in these templates are Safety Incident Avoided, Safety Incidents, Safety Incident, Accumulated Total. All the content presented in this PPT design is completely editable. Download it and make adjustments in color, background, font etc. as per your unique business setting.
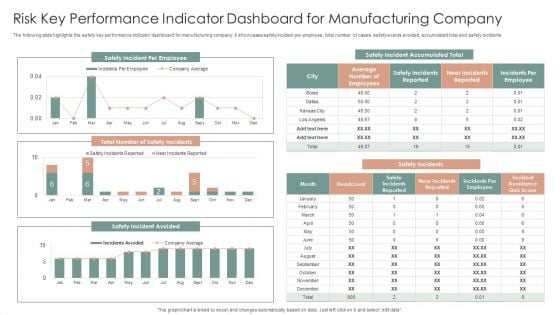
Risk Key Performance Indicator Dashboard For Manufacturing Company Ppt Gallery Graphics Design PDF
The following slide highlights the safety key performance indicator dashboard for manufacturing company. It showcases safety incident per employee, total number of cases, safety events avoided, accumulated total and safety incidents. Pitch your topic with ease and precision using this Risk Key Performance Indicator Dashboard For Manufacturing Company Ppt Gallery Graphics Design PDF. This layout presents information on Safety Incidents, Safety Incident Avoided, Safety Incident Accumulated. It is also available for immediate download and adjustment. So, changes can be made in the color, design, graphics or any other component to create a unique layout.
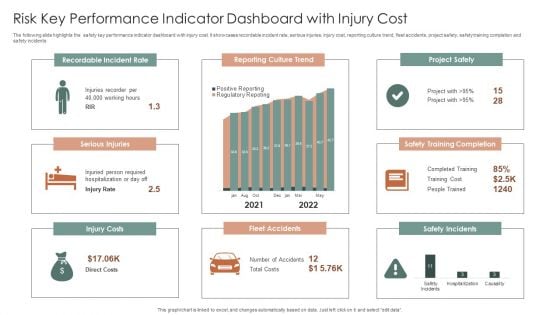
Risk Key Performance Indicator Dashboard With Injury Cost Ppt Summary Brochure PDF
The following slide highlights the safety key performance indicator dashboard with injury cost. It showcases recordable incident rate, serious injuries, injury cost, reporting culture trend, fleet accidents, project safety, safety training completion and safety incidents. Pitch your topic with ease and precision using this Risk Key Performance Indicator Dashboard With Injury Cost Ppt Summary Brochure PDF. This layout presents information on Recordable Incident Rate, Reporting Culture Trend, Project Safety. It is also available for immediate download and adjustment. So, changes can be made in the color, design, graphics or any other component to create a unique layout.
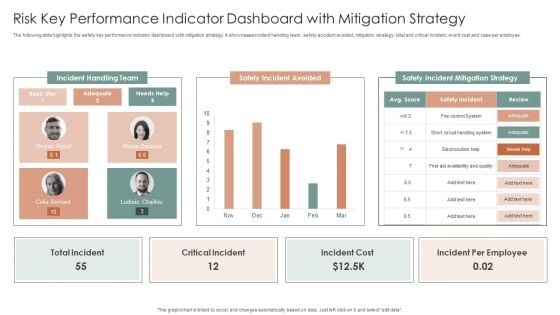
Risk Key Performance Indicator Dashboard With Mitigation Strategy Ppt Inspiration Design Templates PDF
The following slide highlights the safety key performance indicator dashboard with mitigation strategy. It showcases incident handling team, safety accident avoided, mitigation strategy, total and critical incident, event cost and case per employee. Showcasing this set of slides titled Risk Key Performance Indicator Dashboard With Mitigation Strategy Ppt Inspiration Design Templates PDF. The topics addressed in these templates are Incident Handling Team, Safety Incident Avoided, Safety Incident. All the content presented in this PPT design is completely editable. Download it and make adjustments in color, background, font etc. as per your unique business setting.
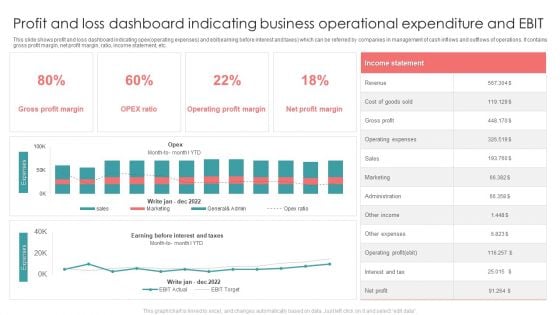
Profit And Loss Dashboard Indicating Business Operational Expenditure And EBIT Formats PDF
This slide shows profit and loss dashboard indicating opex operating expenses and ebit earning before interest and taxes which can be referred by companies in management of cash inflows and outflows of operations. It contains gross profit margin, net profit margin, ratio, income statement, etc. Showcasing this set of slides titled Profit And Loss Dashboard Indicating Business Operational Expenditure And EBIT Formats PDF. The topics addressed in these templates are Revenue, Gross Profit, Sales. All the content presented in this PPT design is completely editable. Download it and make adjustments in color, background, font etc. as per your unique business setting.
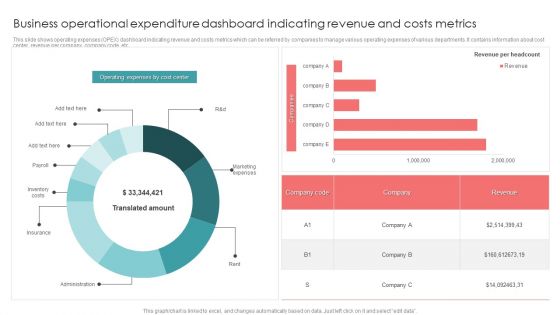
Business Operational Expenditure Dashboard Indicating Revenue And Costs Metrics Pictures PDF
This slide shows operating expenses OPEX dashboard indicating revenue and costs metrics which can be referred by companies to manage various operating expenses of various departments. It contains information about cost center, revenue per company, company code, etc. Pitch your topic with ease and precision using this Business Operational Expenditure Dashboard Indicating Revenue And Costs Metrics Pictures PDF. This layout presents information on Business Operational, Costs Metrics, Revenue. It is also available for immediate download and adjustment. So, changes can be made in the color, design, graphics or any other component to create a unique layout.
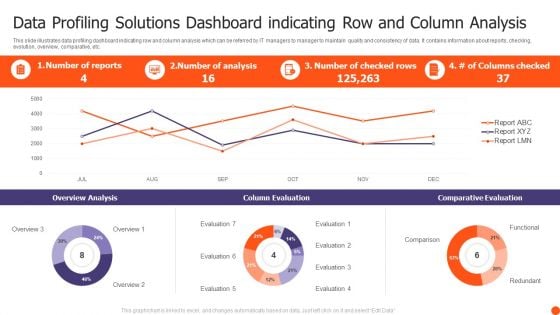
Data Profiling Solutions Dashboard Indicating Row And Column Analysis Summary PDF
This slide illustrates data profiling dashboard indicating row and column analysis which can be referred by IT managers to manager to maintain quality and consistency of data. It contains information about reports, checking, evolution, overview, comparative, etc. Showcasing this set of slides titled Data Profiling Solutions Dashboard Indicating Row And Column Analysis Summary PDF. The topics addressed in these templates are Overview Analysis, Column Evaluation, Comparative Evaluation. All the content presented in this PPT design is completely editable. Download it and make adjustments in color, background, font etc. as per your unique business setting.
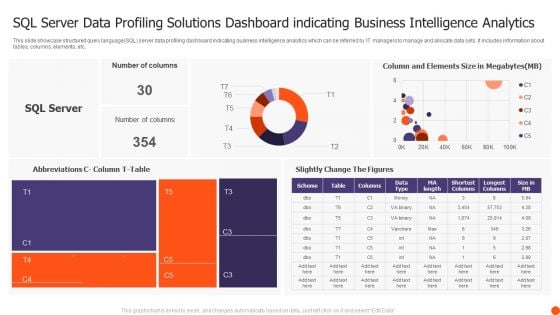
SQL Server Data Profiling Solutions Dashboard Indicating Business Intelligence Analytics Structure PDF
This slide showcase structured query language SQL server data profiling dashboard indicating business intelligence analytics which can be referred by IT managers to manage and allocate data sets. It includes information about tables, columns, elements, etc. Showcasing this set of slides titled SQL Server Data Profiling Solutions Dashboard Indicating Business Intelligence Analytics Structure PDF. The topics addressed in these templates are Number Columns, Slightly Change Figures, SQL Server. All the content presented in this PPT design is completely editable. Download it and make adjustments in color, background, font etc. as per your unique business setting.
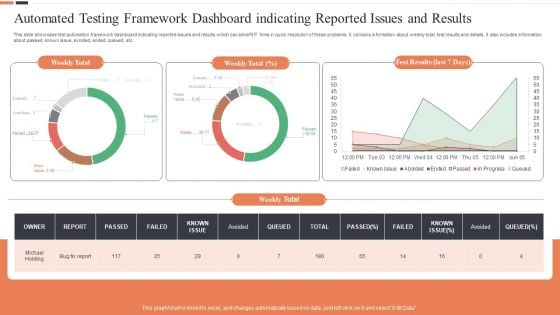
Automated Testing Framework Dashboard Indicating Reported Issues And Results Ideas PDF
This slide showcase test automation framework dashboard indicating reported issues and results which can benefit IT firms in quick resolution of these problems. It contains information about weekly total, test results and details. It also includes information about passed, known issue, avoided, ended, queued, etc. Showcasing this set of slides titled Automated Testing Framework Dashboard Indicating Reported Issues And Results Ideas PDF. The topics addressed in these templates are Weekly Total, Test Results, Last 7 Days. All the content presented in this PPT design is completely editable. Download it and make adjustments in color, background, font etc. as per your unique business setting.
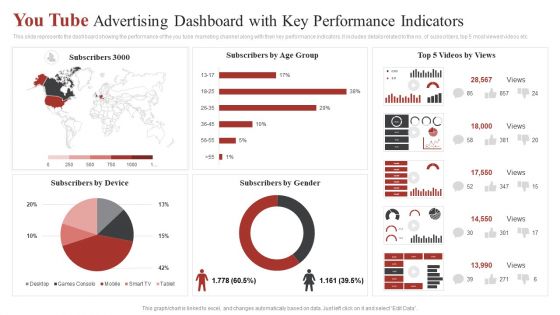
You Tube Advertising Dashboard With Key Performance Indicators Ppt Outline Graphics Example PDF
This slide represents the dashboard showing the performance of the you tube marketing channel along with their key performance indicators. It includes details related to the no. of subscribers, top 5 most viewed videos etc. Showcasing this set of slides titled You Tube Advertising Dashboard With Key Performance Indicators Ppt Outline Graphics Example PDF. The topics addressed in these templates are Subscribers Gender, Subscribers Age Group, Top 5 Videos. All the content presented in this PPT design is completely editable. Download it and make adjustments in color, background, font etc. as per your unique business setting.
Multiple Project Progress Tracking Report Dashboard With Key Performance Indicators Brochure PDF
This slide shows the dashboard representing status of various projects and tracking their performance with the help of key performance indicators which are as follows schedule, budget, resources, risk and issues and quality of projects.Pitch your topic with ease and precision using this Multiple Project Progress Tracking Report Dashboard With Key Performance Indicators Brochure PDF. This layout presents information on Risks Issues, Quality Open Defects, Techno Blogger. It is also available for immediate download and adjustment. So, changes can be made in the color, design, graphics or any other component to create a unique layout.
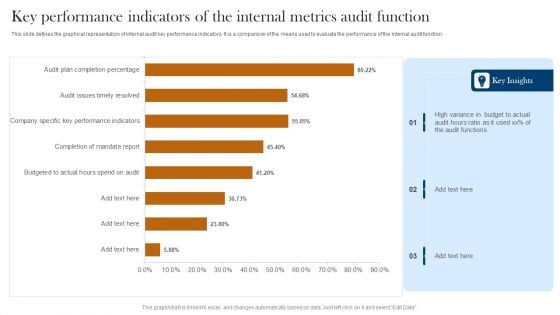
Key Performance Indicators Of The Internal Metrics Audit Function Infographics PDF
This slide defines the graphical representation of internal audit key performance indicators. It is a comparison of the means used to evaluate the performance of the internal audit function. Pitch your topic with ease and precision using this Key Performance Indicators Of The Internal Metrics Audit Function Infographics PDF. This layout presents information on High Variance, Budget To Actual, Audit Functions. It is also available for immediate download and adjustment. So, changes can be made in the color, design, graphics or any other component to create a unique layout.
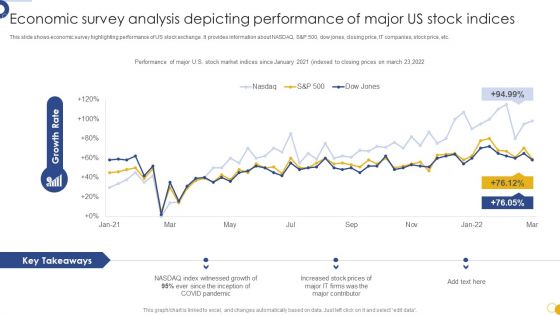
Economic Survey Analysis Depicting Performance Of Major US Stock Indices Summary PDF
This slide shows economic survey highlighting performance of US stock exchange. It provides information about NASDAQ, S and P 500, dow jones, closing price, IT companies, stock price, etc. Showcasing this set of slides titled Economic Survey Analysis Depicting Performance Of Major US Stock Indices Summary PDF. The topics addressed in these templates are Economic Survey Analysis, Depicting Performance Major, US Stock Indices. All the content presented in this PPT design is completely editable. Download it and make adjustments in color, background, font etc. as per your unique business setting.
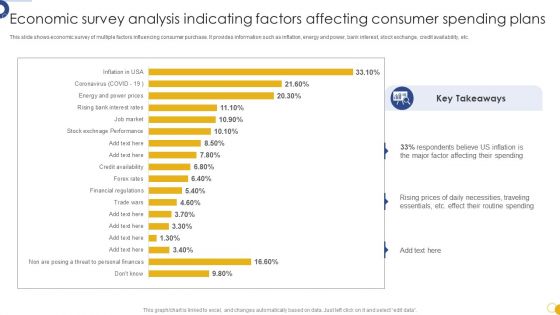
Economic Survey Analysis Indicating Factors Affecting Consumer Spending Plans Download PDF
This slide shows economic survey of multiple factors influencing consumer purchase. It provides information such as inflation, energy and power, bank interest, stock exchange, credit availability, etc. Pitch your topic with ease and precision using this Economic Survey Analysis Indicating Factors Affecting Consumer Spending Plans Download PDF. This layout presents information on Economic Survey Analysis, Indicating Factors Affecting, Consumer Spending Plans. It is also available for immediate download and adjustment. So, changes can be made in the color, design, graphics or any other component to create a unique layout.

Economic Survey Analysis Indicating Industry Wise Revenue In Texas Portrait PDF
This slide shows economic survey highlighting revenues of various industries in texas. It provides information such as diffusion index, manufacturing, service sector and retail. Showcasing this set of slides titled Economic Survey Analysis Indicating Industry Wise Revenue In Texas Portrait PDF. The topics addressed in these templates are Economic Survey Analysis, Indicating Industry Wise, Revenue In Texas. All the content presented in this PPT design is completely editable. Download it and make adjustments in color, background, font etc. as per your unique business setting.
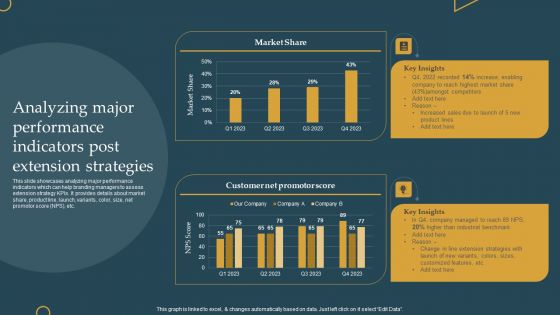
Advertising New Commodities Through Analyzing Major Performance Indicators Post Download PDF
This slide showcases analyzing major performance indicators which can help branding managers to assess extension strategy KPIs. It provides details about market share, product line, launch, variants, color, size, net promotor score NPS, etc. Boost your pitch with our creative Advertising New Commodities Through Analyzing Major Performance Indicators Post Download PDF. Deliver an awe-inspiring pitch that will mesmerize everyone. Using these presentation templates you will surely catch everyones attention. You can browse the ppts collection on our website. We have researchers who are experts at creating the right content for the templates. So you dont have to invest time in any additional work. Just grab the template now and use them.
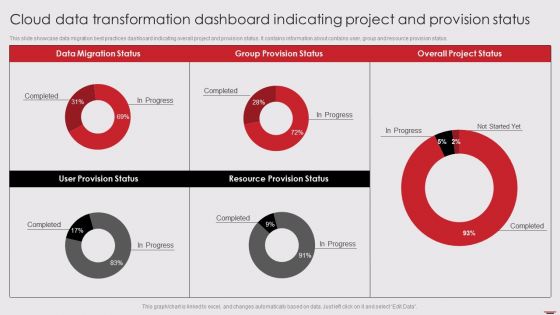
Cloud Data Transformation Dashboard Indicating Project And Provision Status Formats PDF
This slide showcase data migration best practices dashboard indicating overall project and provision status. It contains information about contains user, group and resource provision status. Showcasing this set of slides titled Cloud Data Transformation Dashboard Indicating Project And Provision Status Formats PDF. The topics addressed in these templates are Data Migration Status, Overall Project Status, Group Provision Status. All the content presented in this PPT design is completely editable. Download it and make adjustments in color, background, font etc. as per your unique business setting.
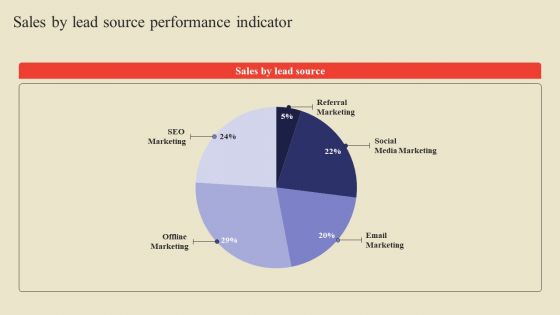
Sales By Lead Source Performance Indicator Ppt Show Visual Aids PDF
Create an editable Sales By Lead Source Performance Indicator Ppt Show Visual Aids PDF that communicates your idea and engages your audience. Whether you are presenting a business or an educational presentation, pre designed presentation templates help save time. Sales By Lead Source Performance Indicator Ppt Show Visual Aids PDF is highly customizable and very easy to edit, covering many different styles from creative to business presentations. Slidegeeks has creative team members who have crafted amazing templates. So, go and get them without any delay.
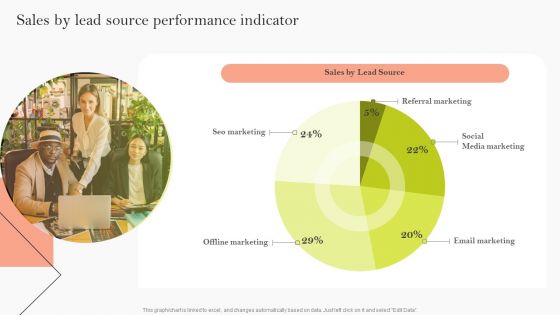
Sales By Lead Source Performance Indicator Ppt Pictures Graphics Template PDF
Explore a selection of the finest Sales By Lead Source Performance Indicator Ppt Pictures Graphics Template PDF here. With a plethora of professionally designed and pre made slide templates, you can quickly and easily find the right one for your upcoming presentation. You can use our Sales By Lead Source Performance Indicator Ppt Pictures Graphics Template PDF to effectively convey your message to a wider audience. Slidegeeks has done a lot of research before preparing these presentation templates. The content can be personalized and the slides are highly editable. Grab templates today from Slidegeeks.
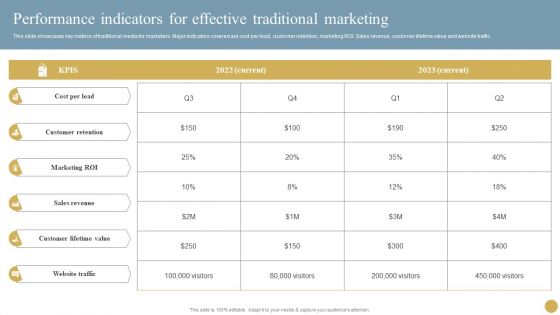
Optimizing Traditional Media To Boost Sales Performance Indicators For Effective Traditional Marketing Diagrams PDF
The best PPT templates are a great way to save time, energy, and resources. Slidegeeks have 100 percent editable powerpoint slides making them incredibly versatile. With these quality presentation templates, you can create a captivating and memorable presentation by combining visually appealing slides and effectively communicating your message. Download Optimizing Traditional Media To Boost Sales Performance Indicators For Effective Traditional Marketing Diagrams PDF from Slidegeeks and deliver a wonderful presentation.
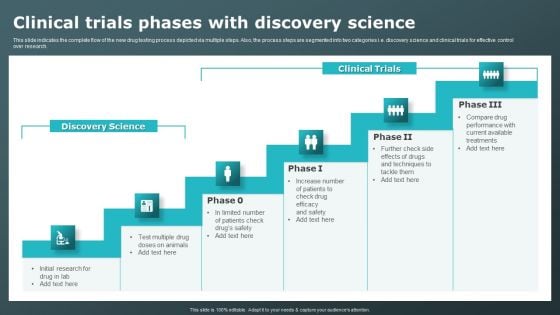
Clinical Trials Phases With Discovery Science Clinical Research Trial Phases Diagrams PDF
This slide indicates the complete flow of the new drug testing process depicted via multiple steps. Also, the process steps are segmented into two categories i.e. discovery science and clinical trials for effective control over research. The best PPT templates are a great way to save time, energy, and resources. Slidegeeks have 100 percent editable powerpoint slides making them incredibly versatile. With these quality presentation templates, you can create a captivating and memorable presentation by combining visually appealing slides and effectively communicating your message. Download Clinical Trials Phases With Discovery Science Clinical Research Trial Phases Diagrams PDF from Slidegeeks and deliver a wonderful presentation.
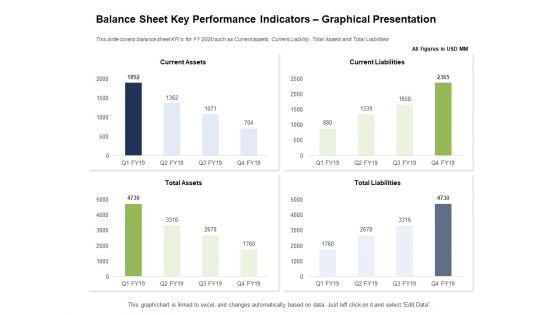
Ways To Bounce Back From Insolvency Balance Sheet Key Performance Indicators Graphical Presentation Brochure PDF
Presenting this set of slides with name ways to bounce back from insolvency balance sheet key performance indicators graphical presentation brochure pdf. The topics discussed in these slides are current assets, current liabilities, total assets, total liabilities. This is a completely editable PowerPoint presentation and is available for immediate download. Download now and impress your audience.
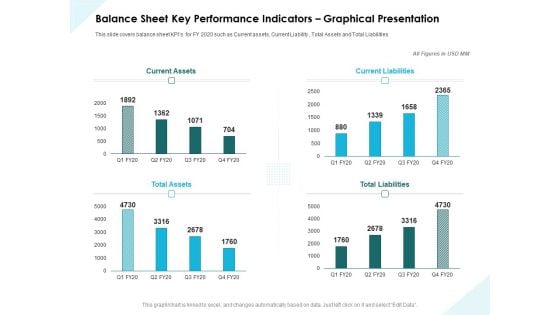
Issues Which Leads To Insolvency Balance Sheet Key Performance Indicators Graphical Presentation Information PDF
Presenting this set of slides with name issues which leads to insolvency balance sheet key performance indicators graphical presentation information pdf. The topics discussed in these slides are current assets, current liabilities, total assets, total liabilities. This is a completely editable PowerPoint presentation and is available for immediate download. Download now and impress your audience.
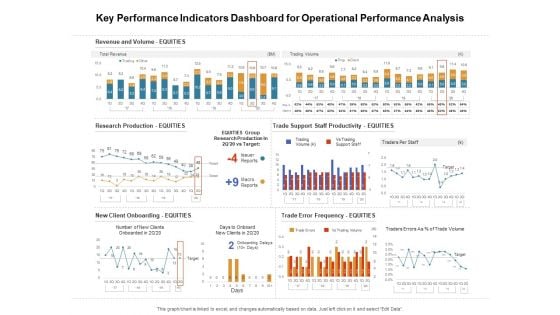
Venture Capitalist Control Board Key Performance Indicators Dashboard For Operational Performance Analysis Formats PDF
Presenting this set of slides with name venture capitalist control board key performance indicators dashboard for operational performance analysis formats pdf. The topics discussed in these slides are revenue and volume, research production, new client onboarding, trade support staff productivity, trade error frequency. This is a completely editable PowerPoint presentation and is available for immediate download. Download now and impress your audience.
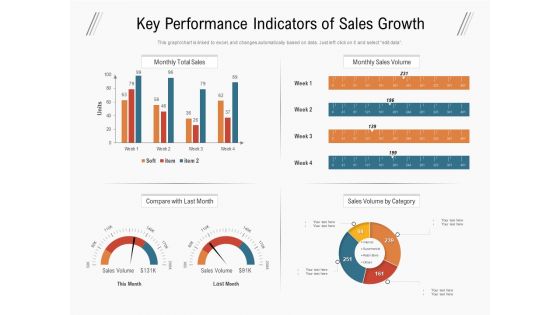
Key Performance Indicators Of Sales Growth Ppt PowerPoint Presentation Portfolio Clipart Images PDF
Presenting this set of slides with name key performance indicators of sales growth ppt powerpoint presentation portfolio clipart images pdf. The topics discussed in these slides are monthly total sales, monthly sales volume, compare with last month, sales volume by category. This is a completely editable PowerPoint presentation and is available for immediate download. Download now and impress your audience.
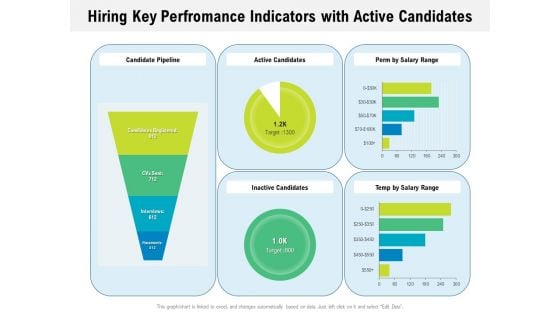
Hiring Key Perfromance Indicators With Active Candidates Ppt PowerPoint Presentation File Microsoft PDF
Presenting this set of slides with name hiring key performance indicators with active candidates ppt powerpoint presentation file microsoft pdf. The topics discussed in these slides are candidate pipeline, active candidates, perm by salary range, inactive candidates, temp by salary range. This is a completely editable PowerPoint presentation and is available for immediate download. Download now and impress your audience.
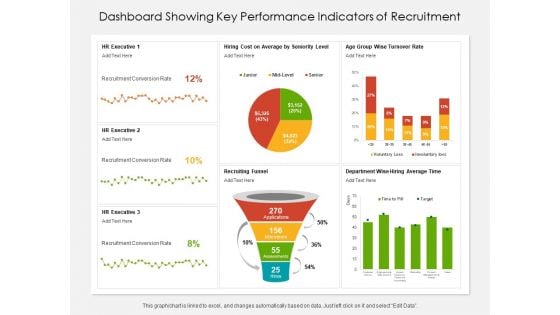
Dashboard Showing Key Performance Indicators Of Recruitment Ppt PowerPoint Presentation File Background Image PDF
Presenting this set of slides with name dashboard showing key performance indicators of recruitment ppt powerpoint presentation file background image pdf. The topics discussed in these slides are executive, funnel, department. This is a completely editable PowerPoint presentation and is available for immediate download. Download now and impress your audience.
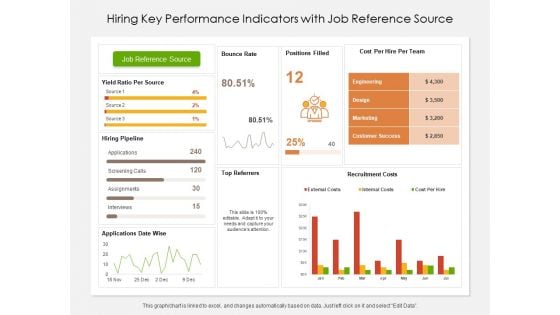
Hiring Key Performance Indicators With Job Reference Source Ppt PowerPoint Presentation Gallery Graphics Example PDF
Presenting this set of slides with name hiring key performance indicators with job reference source ppt powerpoint presentation gallery graphics example pdf. The topics discussed in these slides are source, cost, recruitment. This is a completely editable PowerPoint presentation and is available for immediate download. Download now and impress your audience.
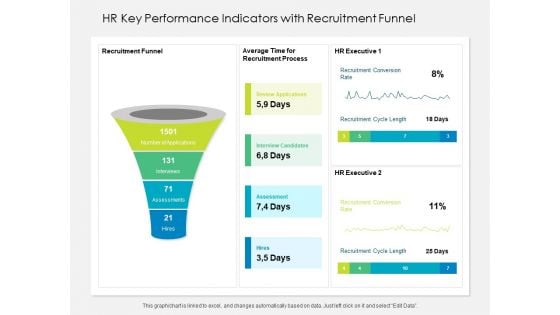
HR Key Performance Indicators With Recruitment Funnel Ppt PowerPoint Presentation File Formats PDF
Presenting this set of slides with name hr key performance indicators with recruitment funnel ppt powerpoint presentation file formats pdf. The topics discussed in these slides are funnel, process, recruitment. This is a completely editable PowerPoint presentation and is available for immediate download. Download now and impress your audience.
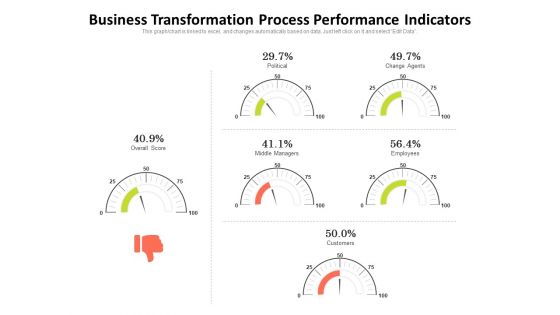
Business Transformation Process Performance Indicators Ppt PowerPoint Presentation Inspiration Pictures PDF
Presenting this set of slides with name business transformation process performance indicators ppt powerpoint presentation inspiration pictures pdf. The topics discussed in these slides are political, change agents, overall score, middle managers, employees, customers. This is a completely editable PowerPoint presentation and is available for immediate download. Download now and impress your audience.
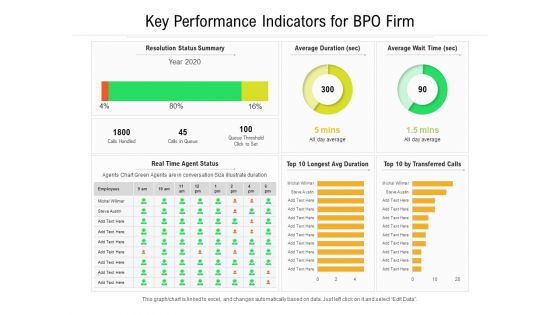
Key Performance Indicators For BPO Firm Ppt PowerPoint Presentation File Picture PDF
Presenting this set of slides with name key performance indicators for bpo firm ppt powerpoint presentation file picture pdf. The topics discussed in these slides are resolution, average, queue. This is a completely editable PowerPoint presentation and is available for immediate download. Download now and impress your audience.
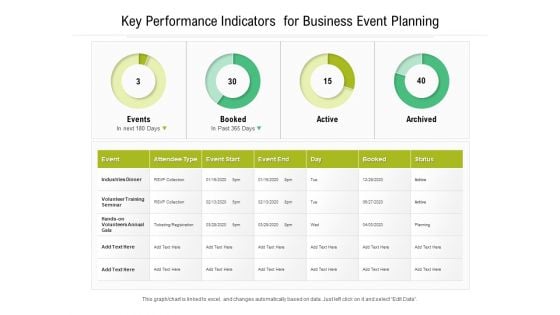
Key Performance Indicators For Business Event Planning Ppt PowerPoint Presentation Gallery Graphic Images PDF
Presenting this set of slides with name key performance indicators for business event planning ppt powerpoint presentation gallery graphic images pdf. The topics discussed in these slides are industries, training, volunteers. This is a completely editable PowerPoint presentation and is available for immediate download. Download now and impress your audience.
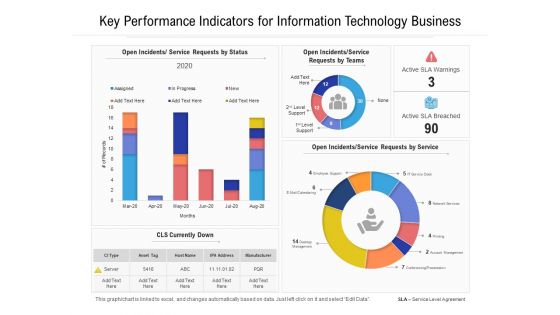
Key Performance Indicators For Information Technology Business Ppt PowerPoint Presentation File Graphics Example PDF
Presenting this set of slides with name key performance indicators for information technology business ppt powerpoint presentation file graphics example pdf. The topics discussed in these slides are service, manufacturer, management. This is a completely editable PowerPoint presentation and is available for immediate download. Download now and impress your audience.
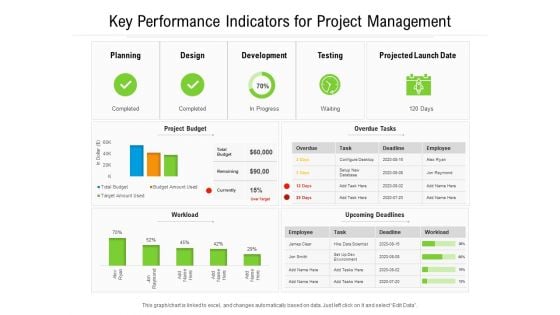
Key Performance Indicators For Project Management Ppt PowerPoint Presentation File Example File PDF
Presenting this set of slides with name key performance indicators for project management ppt powerpoint presentation file example file pdf. The topics discussed in these slides are planning, development, design. This is a completely editable PowerPoint presentation and is available for immediate download. Download now and impress your audience.
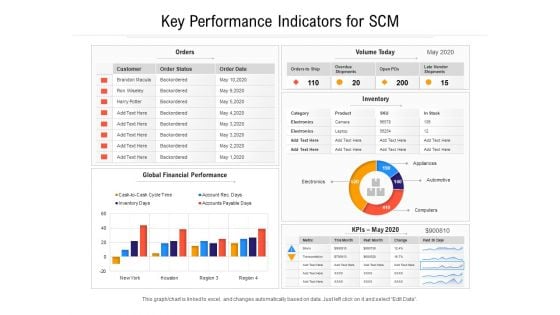
Key Performance Indicators For SCM Ppt PowerPoint Presentation File Graphic Tips PDF
Presenting this set of slides with name key performance indicators for scm ppt powerpoint presentation file graphic tips pdf. The topics discussed in these slides are global, financial, perform. This is a completely editable PowerPoint presentation and is available for immediate download. Download now and impress your audience.
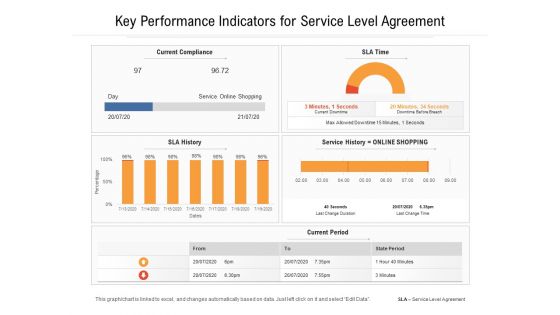
Key Performance Indicators For Service Level Agreement Ppt PowerPoint Presentation Gallery Samples PDF
Presenting this set of slides with name key performance indicators for service level agreement ppt powerpoint presentation gallery samples pdf. The topics discussed in these slides are service, current compliance, history. This is a completely editable PowerPoint presentation and is available for immediate download. Download now and impress your audience.
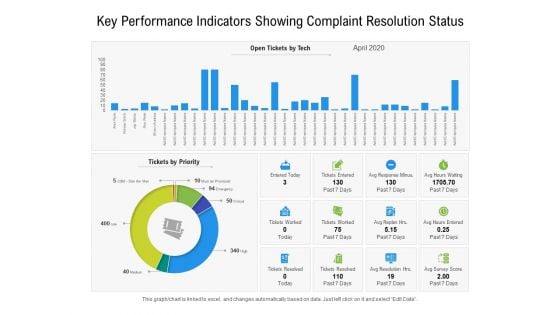
Key Performance Indicators Showing Complaint Resolution Status Ppt PowerPoint Presentation File Styles PDF
Presenting this set of slides with name key performance indicators showing complaint resolution status ppt powerpoint presentation file styles pdf. The topics discussed in these slides are priority, survey, response. This is a completely editable PowerPoint presentation and is available for immediate download. Download now and impress your audience.
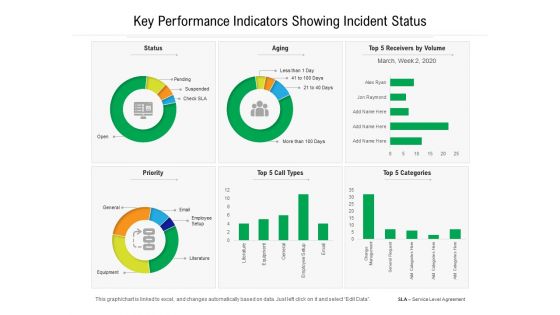
Key Performance Indicators Showing Incident Status Ppt PowerPoint Presentation Gallery Tips PDF
Presenting this set of slides with name key performance indicators showing incident status ppt powerpoint presentation gallery tips pdf. The topics discussed in these slides are priority, categories, aging. This is a completely editable PowerPoint presentation and is available for immediate download. Download now and impress your audience.
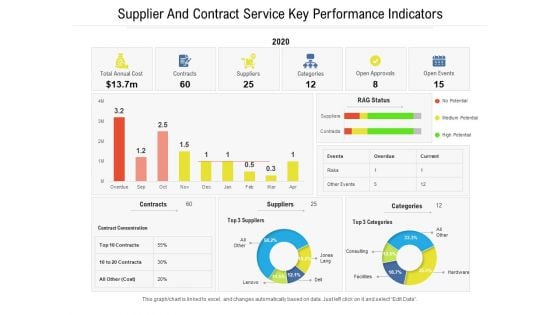
Supplier And Contract Service Key Performance Indicators Ppt PowerPoint Presentation File Inspiration PDF
Presenting this set of slides with name supplier and contract service key performance indicators ppt powerpoint presentation file inspiration pdf. The topics discussed in these slides are cost, suppliers, potential. This is a completely editable PowerPoint presentation and is available for immediate download. Download now and impress your audience.


 Continue with Email

 Home
Home


