Meter Icon
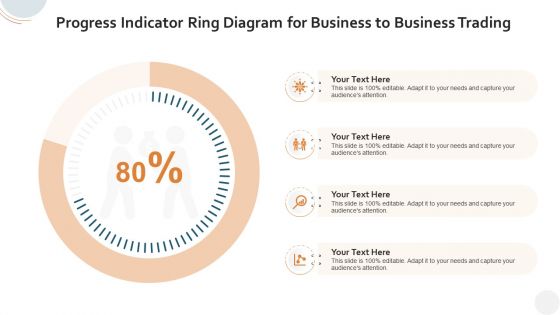
Progress Indicator Ring Diagram For Business To Business Trading Graphics PDF
Pitch your topic with ease and precision using this progress indicator ring diagram for business to business trading graphics pdf. This layout presents information on progress indicator ring diagram for business to business trading. It is also available for immediate download and adjustment. So, changes can be made in the color, design, graphics or any other component to create a unique layout.
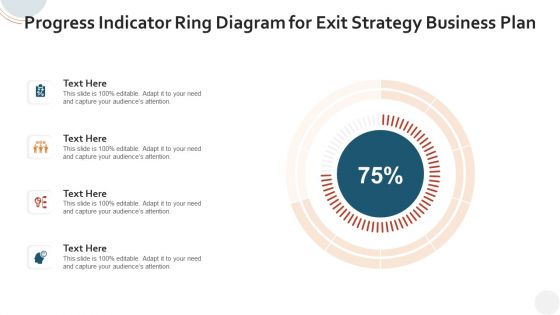
Progress Indicator Ring Diagram For Exit Strategy Business Plan Information PDF
Showcasing this set of slides titled progress indicator ring diagram for exit strategy business plan information pdf. The topics addressed in these templates are progress indicator ring diagram for exit strategy business plan. All the content presented in this PPT design is completely editable. Download it and make adjustments in color, background, font etc. as per your unique business setting.
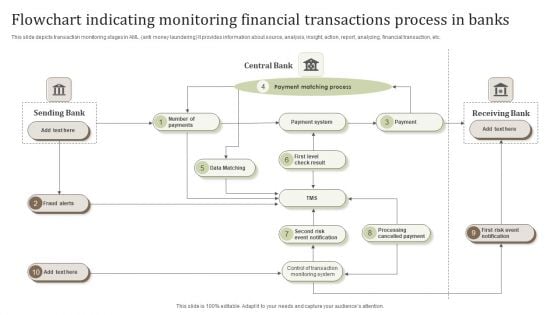
Flowchart Indicating Monitoring Financial Transactions Process In Banks Pictures PDF
This slide depicts transaction monitoring stages in AML anti money laundering It provides information about source, analysis, insight, action, report, analyzing, financial transaction, etc.Persuade your audience using this Flowchart Indicating Monitoring Financial Transactions Process In Banks Pictures PDF. This PPT design covers one stage, thus making it a great tool to use. It also caters to a variety of topics including Payment Matching Process, Cancelled Payment, Cancelled Payment. Download this PPT design now to present a convincing pitch that not only emphasizes the topic but also showcases your presentation skills.
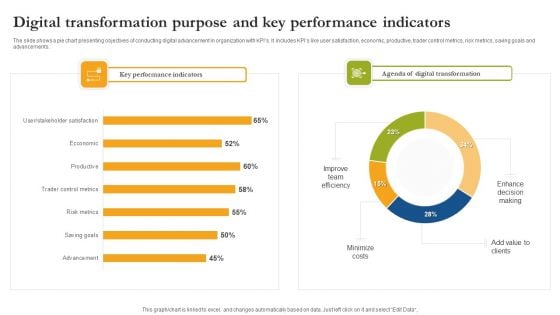
Digital Transformation Purpose And Key Performance Indicators Formats PDF
The slide shows a pie chart presenting objectives of conducting digital advancement in organization with KPIs. It includes KPIs like user satisfaction, economic, productive, trader control metrics, risk metrics, saving goals and advancements. Pitch your topic with ease and precision using this Digital Transformation Purpose And Key Performance Indicators Formats PDF. This layout presents information on Key Performance Indicators, Digital Transformation, Minimize Costs. It is also available for immediate download and adjustment. So, changes can be made in the color, design, graphics or any other component to create a unique layout.
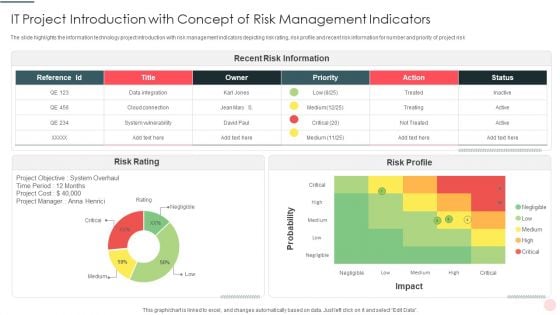
IT Project Introduction With Concept Of Risk Management Indicators Diagrams PDF
Pitch your topic with ease and precision using this IT Project Introduction With Concept Of Risk Management Indicators Diagrams PDF This layout presents information on System Vulnerability, Recent Risk Information, Probability It is also available for immediate download and adjustment. So, changes can be made in the color, design, graphics or any other component to create a unique layout.
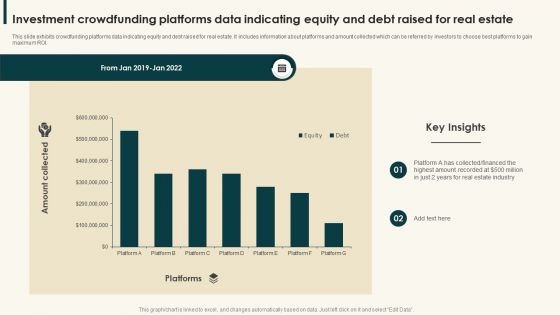
Investment Crowdfunding Platforms Data Indicating Equity And Debt Raised For Real Estate Diagrams PDF
This slide exhibits crowdfunding platforms data indicating equity and debt raised for real estate. It includes information about platforms and amount collected which can be referred by investors to choose best platforms to gain maximum ROI.Showcasing this set of slides titled Investment Crowdfunding Platforms Data Indicating Equity And Debt Raised For Real Estate Diagrams PDF. The topics addressed in these templates are Collected Financed, Highest Amount, Estate Industry. All the content presented in this PPT design is completely editable. Download it and make adjustments in color, background, font etc. as per your unique business setting.

Strategic Plan For Enterprise Key Performance Indicators Highlighting Current Problems Diagrams PDF
This slide represents the key performance indicators to track the problems faced by organization and draw effective strategies to tackle the problems. It includes key performance indicators of decline in organizational sales and customer engagement rate. Coming up with a presentation necessitates that the majority of the effort goes into the content and the message you intend to convey. The visuals of a PowerPoint presentation can only be effective if it supplements and supports the story that is being told. Keeping this in mind our experts created Strategic Plan For Enterprise Key Performance Indicators Highlighting Current Problems Diagrams PDF to reduce the time that goes into designing the presentation. This way, you can concentrate on the message while our designers take care of providing you with the right template for the situation.
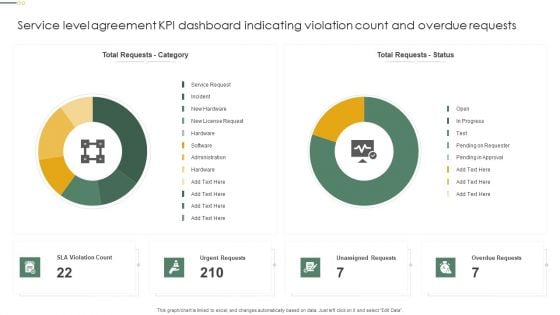
Service Level Agreement KPI Dashboard Indicating Violation Count And Overdue Requests Diagrams PDF
This graph or chart is linked to excel, and changes automatically based on data. Just left click on it and select Edit Data. Showcasing this set of slides titled Service Level Agreement KPI Dashboard Indicating Violation Count And Overdue Requests Diagrams PDF. The topics addressed in these templates are Total Requests Category, Total Requests Status, Urgent Requests. All the content presented in this PPT design is completely editable. Download it and make adjustments in color, background, font etc. as per your unique business setting.
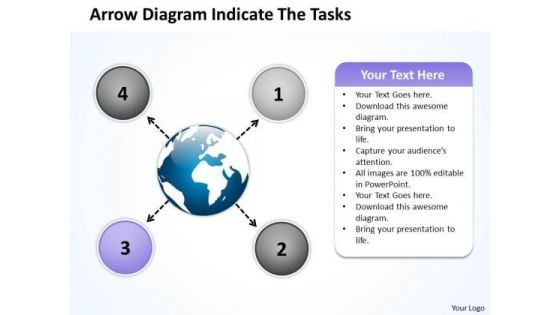
Arrow Diagram Indicate The Tasks Circular Flow Layout Process PowerPoint Slides
We present our arrow diagram indicate the tasks Circular Flow Layout Process PowerPoint Slides.Download and present our Business PowerPoint Templates because your thoughts are pointed and sharp as arrows. Present our Ring Charts PowerPoint Templates because it Draws the universal impact to highlight the similarities with your organizational structure and plans. Download our Marketing PowerPoint Templates because networking is an imperative in todays world. You need to access the views of others. Similarly you need to give access to them of your abilities. Use our Shapes PowerPoint Templates because different people with differing ideas and priorities perform together to score. Download our Process and Flows PowerPoint Templates because you have a great plan to put the pieces together, getting all the various contributors to gel for a successful completion.Use these PowerPoint slides for presentations relating to Arrows, choice, connect, design, direction, flows, four, info graph, instruction, layout, manual, marketing, modern, one, option, order, page, paper, pointing, process, product, promotion, sequence, simple, special, step, symbol. The prominent colors used in the PowerPoint template are Purple, Blue, Black. Presenters tell us our arrow diagram indicate the tasks Circular Flow Layout Process PowerPoint Slides are Majestic. Professionals tell us our info PowerPoint templates and PPT Slides are Breathtaking. PowerPoint presentation experts tell us our arrow diagram indicate the tasks Circular Flow Layout Process PowerPoint Slides are Clever. The feedback we get is that our info PowerPoint templates and PPT Slides are Nifty. Use our arrow diagram indicate the tasks Circular Flow Layout Process PowerPoint Slides are One-of-a-kind. Use our four PowerPoint templates and PPT Slides are readymade to fit into any presentation structure. Watch your plans fall into place. Our Arrow Diagram Indicate The Tasks Circular Flow Layout Process PowerPoint Slides aid in completion.
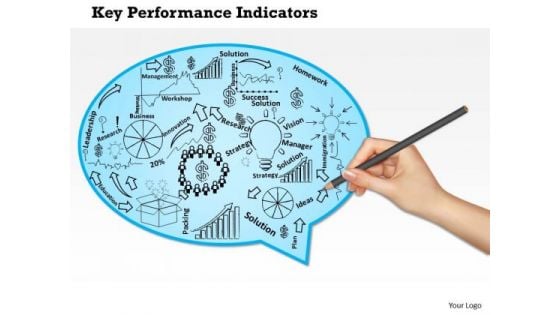
Business Framework Key Performance Indicators Of A Company PowerPoint Presentation
Our above diagram provides framework of key performance indicators for a company. This slide contains human hand drawing some objects for terms like innovation strategy, research, solution, management and leadership. Download this diagram to make professional presentations.
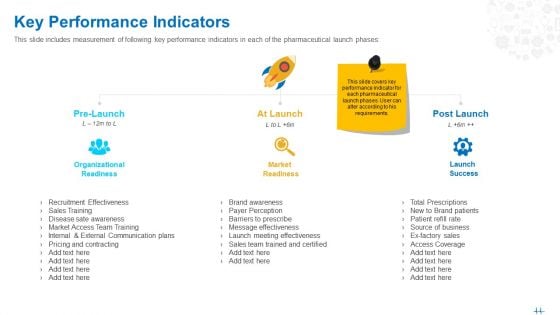
Health Clinic Marketing Key Performance Indicators Ppt Portfolio Visuals PDF
This slide includes measurement of following key performance indicators in each of the pharmaceutical launch phases This is a health clinic marketing key performance indicators ppt portfolio visuals pdf. template with various stages. Focus and dispense information on three stages using this creative set, that comes with editable features. It contains large content boxes to add your information on topics like organizational readiness, market readiness, launch success. You can also showcase facts, figures, and other relevant content using this PPT layout. Grab it now.
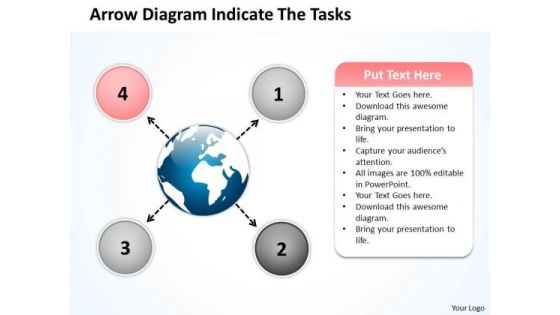
Arrow Diagram Indicate The Tasks Circle Circular Flow Layout Process PowerPoint Slides
We present our arrow diagram indicate the tasks circle Circular Flow Layout Process PowerPoint Slides.Download our Business PowerPoint Templates because this diagram helps you to show goal also clearly etched in your mind. Use our Ring Charts PowerPoint Templates because you have the ideas to develop the teams vision of where they need to be in the future. Download our Marketing PowerPoint Templates because networking is an imperative in todays world. You need to access the views of others. Similarly you need to give access to them of your abilities. Download and present our Shapes PowerPoint Templates because this slide shows each path to the smallest detail. Download our Process and Flows PowerPoint Templates because this Layout helps you to expand your plans to overcome obstacles and reassure the team that they shall continue to roll along merrily.Use these PowerPoint slides for presentations relating to Arrows, choice, connect, design, direction, flows, four, info graph, instruction, layout, manual, marketing, modern, one, option, order, page, paper, pointing, process, product, promotion, sequence, simple, special, step, symbol. The prominent colors used in the PowerPoint template are Pink, Blue, White. Presenters tell us our arrow diagram indicate the tasks circle Circular Flow Layout Process PowerPoint Slides will help you be quick off the draw. Just enter your specific text and see your points hit home. Professionals tell us our info PowerPoint templates and PPT Slides provide you with a vast range of viable options. Select the appropriate ones and just fill in your text. PowerPoint presentation experts tell us our arrow diagram indicate the tasks circle Circular Flow Layout Process PowerPoint Slides are Dazzling. The feedback we get is that our connect PowerPoint templates and PPT Slides will make you look like a winner. Use our arrow diagram indicate the tasks circle Circular Flow Layout Process PowerPoint Slides are Detailed. Use our four PowerPoint templates and PPT Slides are Spectacular. Our Arrow Diagram Indicate The Tasks Circle Circular Flow Layout Process PowerPoint Slides motivate your listeners. With our money back guarantee you have nothing to lose.
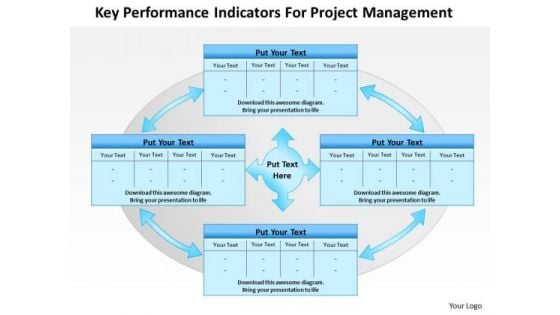
Business Framework Key Performance Indicators For Project Management PowerPoint Presentation
Our above diagram provides framework of key performance indicators for project management. It contains four interconnected text boxes. Download this diagram to make professional presentations on project management. This diagram enables the users to create their own display of the required processes in an easy way.
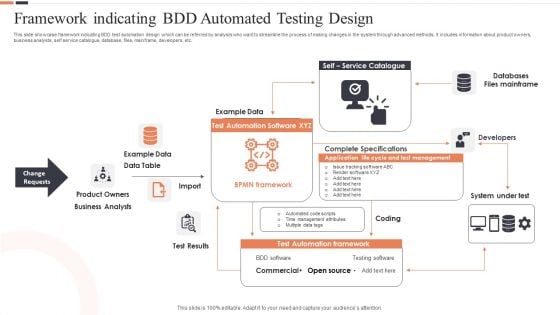
Framework Indicating Bdd Automated Testing Design Ppt Gallery Ideas PDF
This slide showcase framework indicating BDD test automation design which can be referred by analysts who want to streamline the process of making changes in the system through advanced methods. It includes information about product owners, business analysts, self service catalogue, database, files, mainframe, developers, etc. Persuade your audience using this Framework Indicating Bdd Automated Testing Design Ppt Gallery Ideas PDF. This PPT design covers four stages, thus making it a great tool to use. It also caters to a variety of topics including Example Data, Data Table, Product Owners, Business Analysts. Download this PPT design now to present a convincing pitch that not only emphasizes the topic but also showcases your presentation skills.
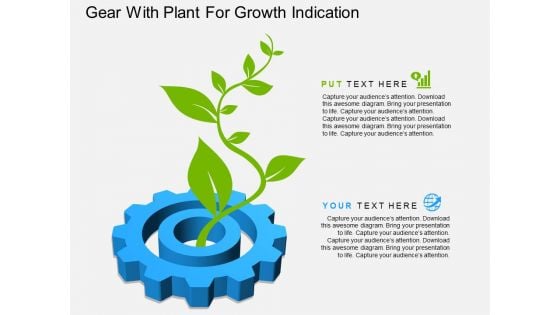
Gear With Plant For Growth Indication Powerpoint Template
This PowerPoint template has been designed with graphics of gear with plant. You may download this diagram slide to indicate growth process. Illustrate your plans to your listeners with this impressive template.
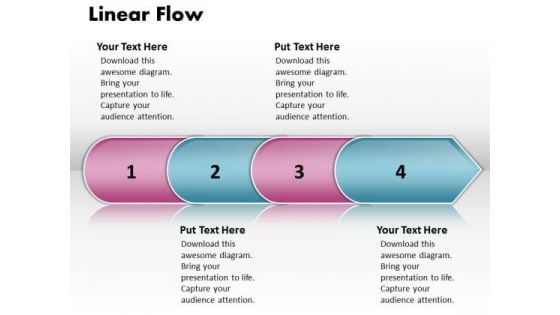
Ppt Linear Arrow 4 Phase Diagram PowerPoint Templates
PPT linear arrow 4 phase diagram PowerPoint Templates-This Four Phase PowerPoint graphic is designed specifically for corporate and academic use. Diagram is fully editable customizable-PPT linear arrow 4 phase diagram PowerPoint Templates-Arrow, Background, Collection, Completed, Concept, Confirmation, Design, Flow, Graph, Graphic, Illustration, Indication, Indicator, Information, Instruction, Interface, Internet, Layout, Measurement, Order, Phase, Pointer, Process, Progress, Reflection, Scale, Shape, Sign Be explicit with our Ppt Linear Arrow 4 Phase Diagram PowerPoint Templates. Express your views clearly and fully.
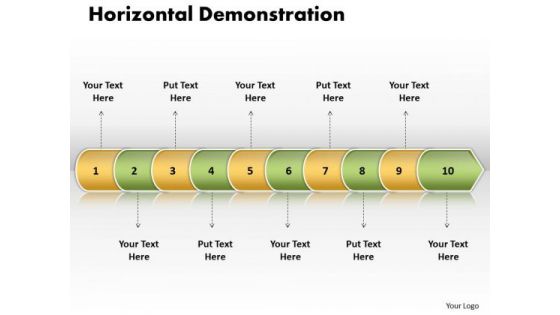
Ppt Linear Arrow 10 Phase Diagram PowerPoint Templates
PPT linear arrow 10 phase diagram PowerPoint Templates-Use this PowerPoint diagram to define basic work and data flow and quality management processes to increase efficiency of your business.-PPT linear arrow 10 phase diagram PowerPoint Templates-Arrow, Background, Collection, Completed, Concept, Confirmation, Design, Flow, Graph, Graphic, Illustration, Indication, Indicator, Information, Instruction, Interface, Internet, Layout, Measurement, Order, Phase, Pointer, Process, Progress, Reflection, Scale, Shape, Sign Start a company with our Ppt Linear Arrow 10 Phase Diagram PowerPoint Templates. Just download, type and present.
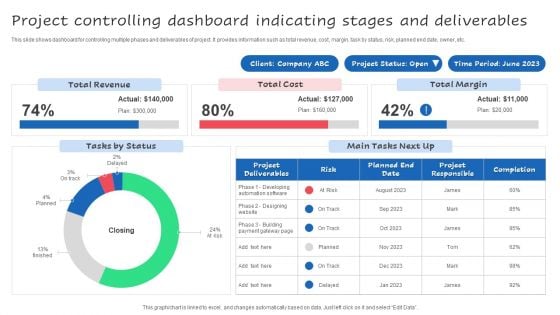
Project Controlling Dashboard Indicating Stages And Deliverables Ppt Styles Guide PDF
This slide shows dashboard for controlling multiple phases and deliverables of project. It provides information such as total revenue, cost, margin, task by status, risk, planned end date, owner, etc. Pitch your topic with ease and precision using this Project Controlling Dashboard Indicating Stages And Deliverables Ppt Styles Guide PDF. This layout presents information on Total Revenue, Total Margin, Total Cost. It is also available for immediate download and adjustment. So, changes can be made in the color, design, graphics or any other component to create a unique layout.
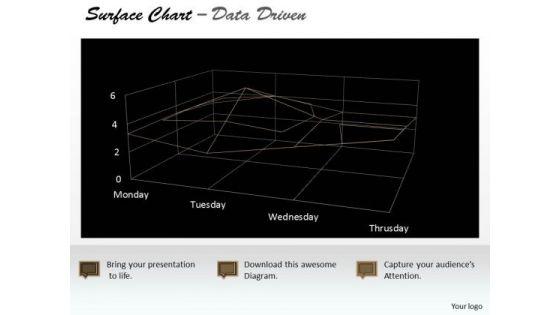
Data Analysis Template Driven Surface Chart Indicating Areas PowerPoint Slides Templates
Highlight Your Drive With Our data analysis template driven surface chart indicating areas powerpoint slides Templates . Prove The Fact That You Have Control.
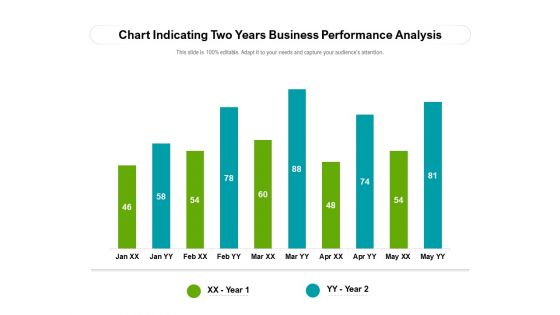
Chart Indicating Two Years Business Performance Analysis Ppt PowerPoint Presentation File Grid PDF
Showcasing this set of slides titled chart indicating two years business performance analysis ppt powerpoint presentation file grid pdf. The topics addressed in these templates are chart indicating two years business performance analysis. All the content presented in this PPT design is completely editable. Download it and make ajustments in color, background, font etc. as per your unique business setting.
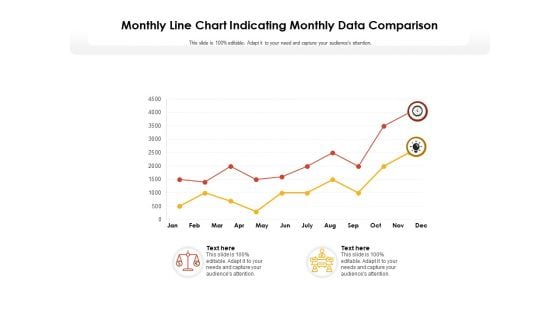
Monthly Line Chart Indicating Monthly Data Comparison Ppt PowerPoint Presentation Model Slide Portrait
Showcasing this set of slides titled monthly line chart indicating monthly data comparison ppt powerpoint presentation model slide portrait. The topics addressed in these templates are monthly line chart indicating monthly data comparison. All the content presented in this PPT design is completely editable. Download it and make adjustments in color, background, font etc. as per your unique business setting.
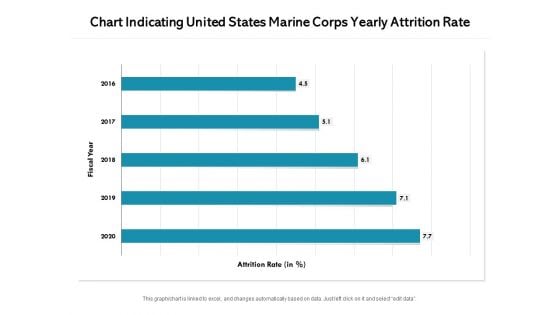
Chart Indicating United States Marine Corps Yearly Attrition Rate Ppt PowerPoint Presentation File Background Images PDF
Pitch your topic with ease and precision using this chart indicating united states marine corps yearly attrition rate ppt powerpoint presentation file background images pdf. This layout presents information on hart indicating united states marine corps yearly attrition rate. It is also available for immediate download and adjustment. So, changes can be made in the color, design, graphics or any other component to create a unique layout.
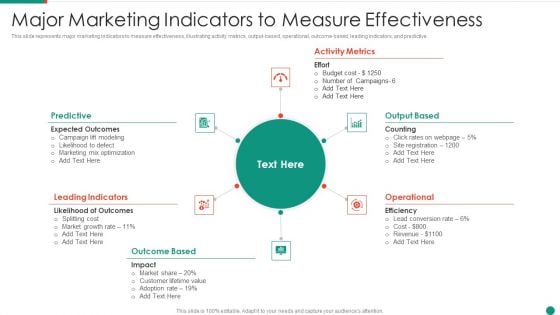
Major Marketing Indicators To Measure Effectiveness Mockup PDF
This slide represents major marketing indicators to measure effectiveness, illustrating activity metrics, output-based, operational, outcome-based, leading indicators, and predictive.Presenting Major Marketing Indicators To Measure Effectiveness Mockup PDF to dispense important information. This template comprises six stages. It also presents valuable insights into the topics including Leading Indicators, Outcome Based, Activity Metrics This is a completely customizable PowerPoint theme that can be put to use immediately. So, download it and address the topic impactfully.

Indicator Kpis Scorecard To Track Employee Personnel Performance Topics PDF
Presenting Indicator Kpis Scorecard To Track Employee Personnel Performance Topics PDF to dispense important information. This template comprises one stages. It also presents valuable insights into the topics including Key Performance Indicators, Averages, Customer Focus. This is a completely customizable PowerPoint theme that can be put to use immediately. So, download it and address the topic impactfully.
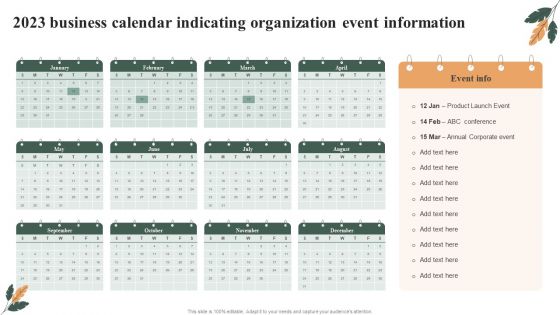
2023 Business Calendar Indicating Organization Event Information Portrait PDF
Presenting 2023 Business Calendar Indicating Organization Event Information Portrait PDF to dispense important information. This template comprises tweleve stages. It also presents valuable insights into the topics including Business Calendar Indicating, Organization Event Information. This is a completely customizable PowerPoint theme that can be put to use immediately. So, download it and address the topic impactfully.
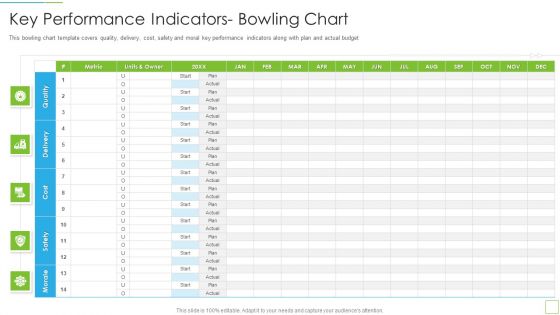
Hoshin Kanri Pitch Deck Key Performance Indicators Bowling Chart Introduction PDF
This bowling chart template covers quality, delivery, cost, safety and moral key performance indicators along with plan and actual budget Deliver an awe inspiring pitch with this creative hoshin kanri pitch deck key performance indicators bowling chart introduction pdf bundle. Topics like key performance indicators bowling chart can be discussed with this completely editable template. It is available for immediate download depending on the needs and requirements of the user.
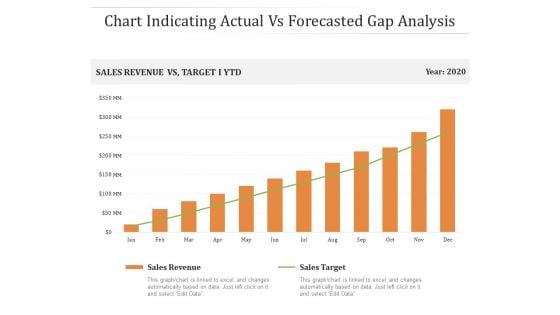
Chart Indicating Actual Vs Forecasted Gap Analysis Ppt PowerPoint Presentation Gallery Slides PDF
Presenting this set of slides with name chart indicating actual vs forecasted gap analysis ppt powerpoint presentation gallery slides pdf. The topics discussed in these slides are sales, target, revenue. This is a completely editable PowerPoint presentation and is available for immediate download. Download now and impress your audience.
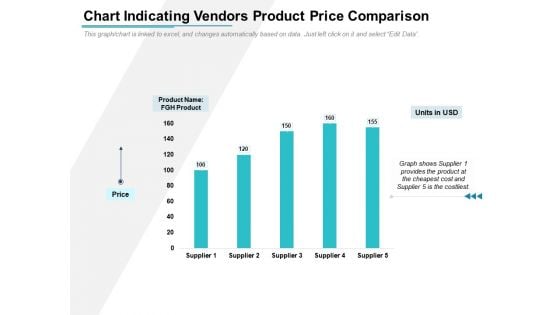
Chart Indicating Vendors Product Price Comparison Ppt PowerPoint Presentation Portfolio Infographics PDF
Showcasing this set of slides titled chart indicating vendors product price comparison ppt powerpoint presentation portfolio infographics pdf. The topics addressed in these templates are product, fgh product, units in usd, price, supplier. All the content presented in this PPT design is completely editable. Download it and make adjustments in color, background, font etc. as per your unique business setting.
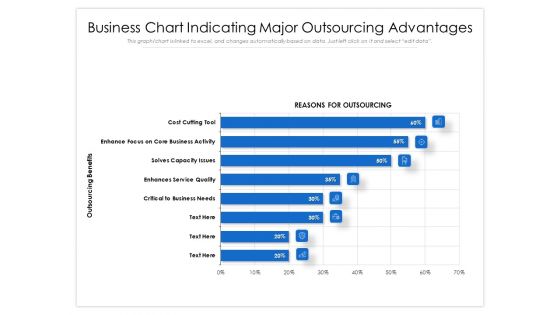
Business Chart Indicating Major Outsourcing Advantages Ppt PowerPoint Presentation File Template PDF
Showcasing this set of slides titled business chart indicating major outsourcing advantages ppt powerpoint presentation file template pdf. The topics addressed in these templates are cost, business, service. All the content presented in this PPT design is completely editable. Download it and make adjustments in color, background, font etc. as per your unique business setting.
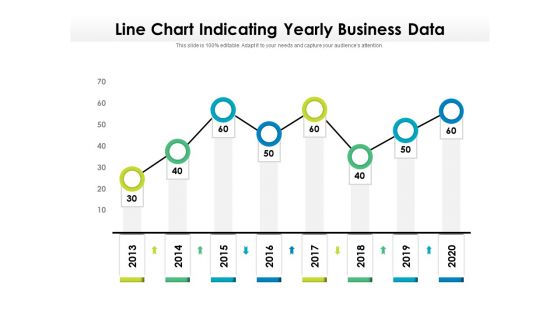
Line Chart Indicating Yearly Business Data Ppt PowerPoint Presentation Styles Deck PDF
Showcasing this set of slides titled line chart indicating yearly business data ppt powerpoint presentation styles deck pdf. The topics addressed in these templates are line chart indicating yearly business data, 2013 to 2020. All the content presented in this PPT design is completely editable. Download it and make adjustments in color, background, font etc. as per your unique business setting.
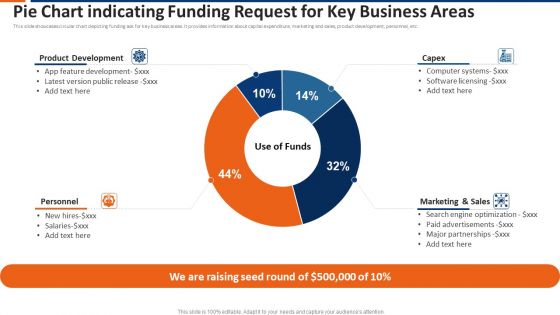
Pie Chart Indicating Funding Request For Key Business Areas Ppt Show Topics PDF
This slide showcases circular chart depicting funding ask for key business areas. It provides information about capital expenditure, marketing and sales, product development, personnel, etc. Pitch your topic with ease and precision using this pie chart indicating funding request for key business areas ppt show topics pdf. This layout presents information on product development, capex, marketing and sales, personnel. It is also available for immediate download and adjustment. So, changes can be made in the color, design, graphics or any other component to create a unique layout.
Plant With Bulb Education Growth Indication Powerpoint Template
This PowerPoint slide has been designed with graphics of plant and bulb. This diagram is designed to display education and growth. This professional slide helps in making an instant impact on viewers.
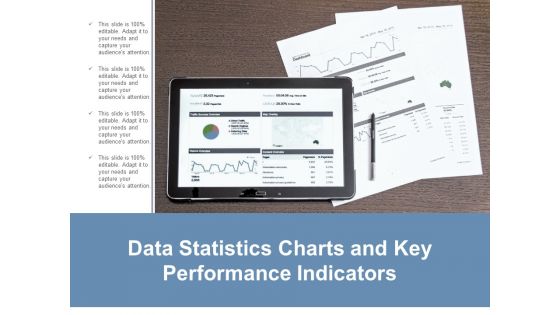
Data Statistics Charts And Key Performance Indicators Ppt Powerpoint Presentation Layouts Guide
This is a data statistics charts and key performance indicators ppt powerpoint presentation layouts guide. This is a four stage process. The stages in this process are business metrics, business kpi, business dashboard.
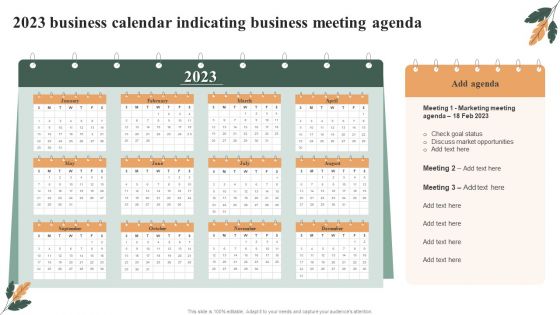
2023 Business Calendar Indicating Business Meeting Agenda Download PDF
Presenting 2023 Business Calendar Indicating Business Meeting Agenda Download PDF to dispense important information. This template comprises tweleve stages. It also presents valuable insights into the topics including Marketing Meeting, Market Opportunities, Check Goal Status. This is a completely customizable PowerPoint theme that can be put to use immediately. So, download it and address the topic impactfully.
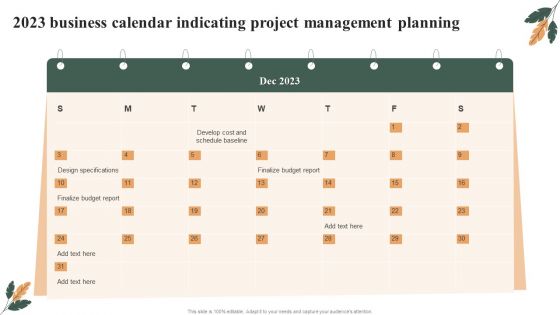
2023 Business Calendar Indicating Project Management Planning Brochure PDF
Presenting 2023 Business Calendar Indicating Project Management Planning Brochure PDF to dispense important information. This template comprises one stages. It also presents valuable insights into the topics including Design Specifications, Finalize Budget Report, Develop Cost. This is a completely customizable PowerPoint theme that can be put to use immediately. So, download it and address the topic impactfully.
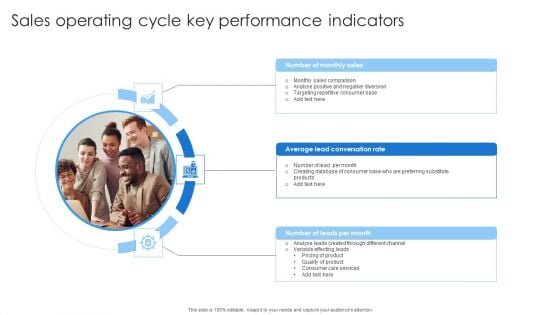
Sales Operating Cycle Key Performance Indicators Professional PDF
Presenting Sales Operating Cycle Key Performance Indicators Professional PDF to dispense important information. This template comprises three stages. It also presents valuable insights into the topics including Sales Comparison, Lead Conversation, Quality Product. This is a completely customizable PowerPoint theme that can be put to use immediately. So, download it and address the topic impactfully.
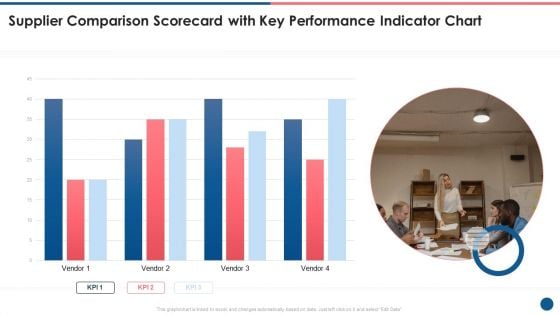
Supplier Scorecard Supplier Comparison Scorecard With Key Performance Indicator Chart Formats PDF
This is a supplier scorecard supplier comparison scorecard with key performance indicator chart formats pdf template with various stages. Focus and dispense information on one stages using this creative set, that comes with editable features. It contains large content boxes to add your information on topics like supplier comparison scorecard, key performance, indicator chart. You can also showcase facts, figures, and other relevant content using this PPT layout. Grab it now.
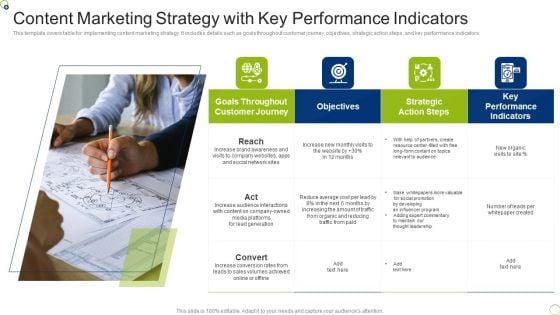
Content Marketing Strategy With Key Performance Indicators Microsoft PDF
This template covers table for implementing content marketing strategy. It includes details such as goals throughout customer journey, objectives, strategic action steps, and key performance indicators. Presenting Content Marketing Strategy With Key Performance Indicators Microsoft PDF to dispense important information. This template comprises four stages. It also presents valuable insights into the topics including Resource, Strategic, Cost. This is a completely customizable PowerPoint theme that can be put to use immediately. So, download it and address the topic impactfully.
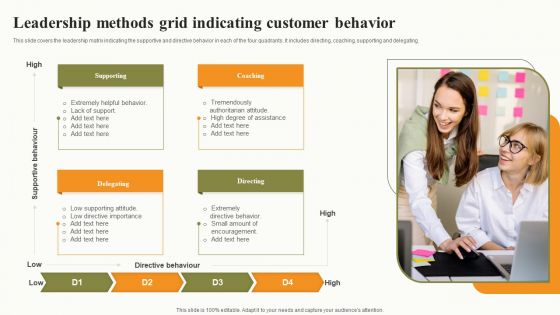
Leadership Methods Grid Indicating Customer Behavior Graphics PDF
This slide covers the leadership matrix indicating the supportive and directive behavior in each of the four quadrants. It includes directing, coaching, supporting and delegating. Presenting Leadership Methods Grid Indicating Customer Behavior Graphics PDF to dispense important information. This template comprises four stages. It also presents valuable insights into the topics including Directing, Supporting, Coaching, Delegating. This is a completely customizable PowerPoint theme that can be put to use immediately. So, download it and address the topic impactfully.
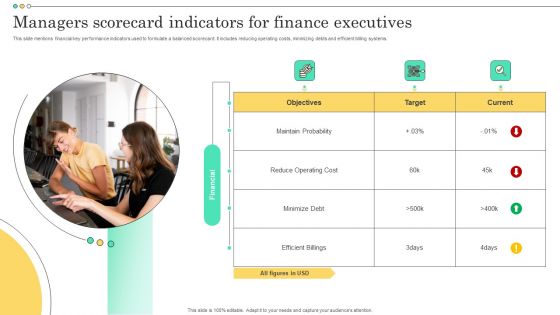
Managers Scorecard Indicators For Finance Executives Topics PDF
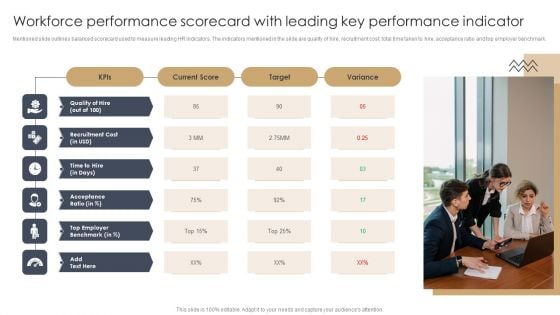
Workforce Performance Scorecard With Leading Key Performance Indicator Information PDF
Mentioned slide outlines balanced scorecard used to measure leading HR indicators. The indicators mentioned in the slide are quality of hire, recruitment cost, total time taken to hire, acceptance ratio and top employer benchmark.Presenting Workforce Performance Scorecard With Leading Key Performance Indicator Information PDF to dispense important information. This template comprises one stage. It also presents valuable insights into the topics including Top Employer, Acceptance Ratio, Recruitment Cost. This is a completely customizable PowerPoint theme that can be put to use immediately. So, download it and address the topic impactfully.
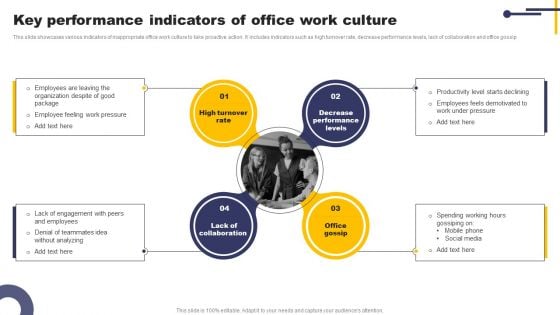
Key Performance Indicators Of Office Work Culture Inspiration PDF
This slide showcases various indicators of inappropriate office work culture to take proactive action. It includes indicators such as high turnover rate, decrease performance levels, lack of collaboration and office gossip. Presenting Key Performance Indicators Of Office Work Culture Inspiration PDF to dispense important information. This template comprises four stages. It also presents valuable insights into the topics including High Turnover Rate, Decrease Performance Levels, Office Gossip. This is a completely customizable PowerPoint theme that can be put to use immediately. So, download it and address the topic impactfully.
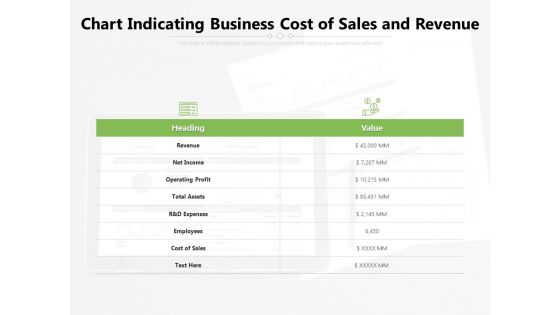
Chart Indicating Business Cost Of Sales And Revenue Ppt PowerPoint Presentation File Gridlines PDF
Presenting this set of slides with name chart indicating business cost of sales and revenue ppt powerpoint presentation file gridlines pdf. The topics discussed in these slides are revenue, operating, assets. This is a completely editable PowerPoint presentation and is available for immediate download. Download now and impress your audience.
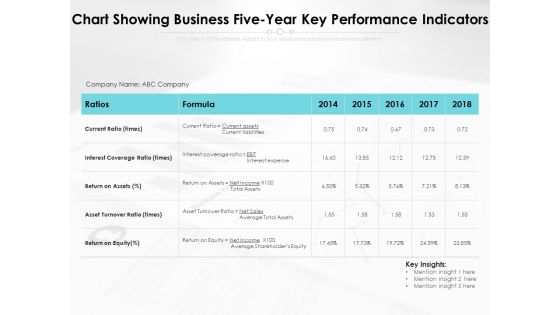
Chart Showing Business Five Year Key Performance Indicators Ppt PowerPoint Presentation File Infographics PDF
Presenting this set of slides with name chart showing business five year key performance indicators ppt powerpoint presentation file infographics pdf. The topics discussed in these slides are liabilities, equity, assets. This is a completely editable PowerPoint presentation and is available for immediate download. Download now and impress your audience.
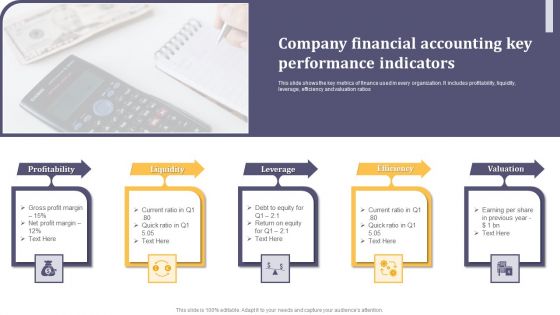
Company Financial Accounting Key Performance Indicators Ppt Slides PDF
This slide shows the key metrics of finance used in every organization. It includes profitability, liquidity, leverage, efficiency and valuation ratios. Presenting Company Financial Accounting Key Performance Indicators Ppt Slides PDF to dispense important information. This template comprises five stages. It also presents valuable insights into the topics including Profitability, Liquidity, Leverage. This is a completely customizable PowerPoint theme that can be put to use immediately. So, download it and address the topic impactfully.
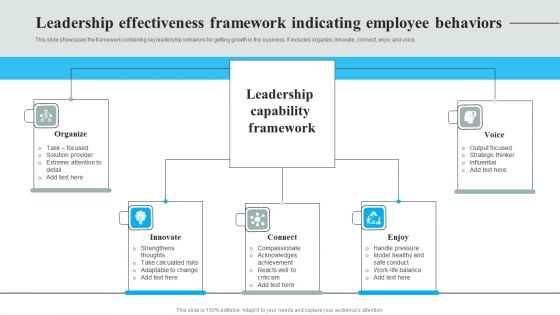
Leadership Effectiveness Framework Indicating Employee Behaviors Elements PDF
This slide showcases the framework containing key leadership behaviors for getting growth in the business. It includes organize, innovate, connect, enjoy and voice. Presenting Leadership Effectiveness Framework Indicating Employee Behaviors Elements PDF to dispense important information. This template comprises five stages. It also presents valuable insights into the topics including Organize, Innovate, Connect, Enjoy, Voice. This is a completely customizable PowerPoint theme that can be put to use immediately. So, download it and address the topic impactfully.
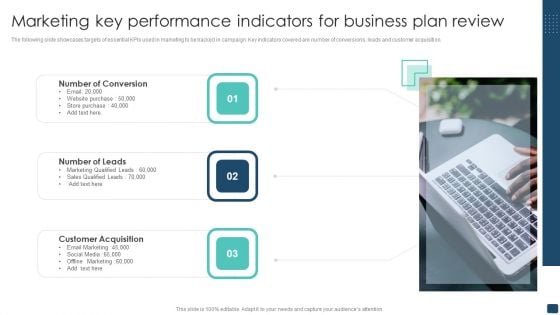
Marketing Key Performance Indicators For Business Plan Review Template PDF
The following slide showcases targets of essential KPIs used in marketing to be tracked in campaign. Key indicators covered are number of conversions, leads and customer acquisition. Presenting Marketing Key Performance Indicators For Business Plan Review Template PDF to dispense important information. This template comprises three stages. It also presents valuable insights into the topics including Number Of Conversion, Number Of Leads, Customer Acquisition. This is a completely customizable PowerPoint theme that can be put to use immediately. So, download it and address the topic impactfully.
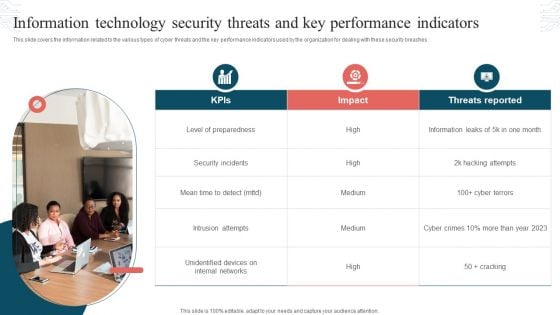
Information Technology Security Threats And Key Performance Indicators Formats PDF
This slide covers the information related to the various types of cyber threats and the key performance indicators used by the organization for dealing with these security breaches. Presenting Information Technology Security Threats And Key Performance Indicators Formats PDF to dispense important information. This template comprises three stages. It also presents valuable insights into the topics including Threats Reported, Security Incidents, Intrusion Attempts. This is a completely customizable PowerPoint theme that can be put to use immediately. So, download it and address the topic impactfully.
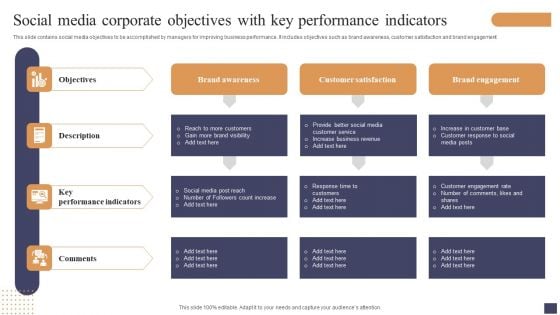
Social Media Corporate Objectives With Key Performance Indicators Pictures PDF
This slide contains social media objectives to be accomplished by managers for improving business performance. It includes objectives such as brand awareness, customer satisfaction and brand engagement. Presenting Social Media Corporate Objectives With Key Performance Indicators Pictures PDF to dispense important information. This template comprises four stages. It also presents valuable insights into the topics including Objectives, Description, Key Performance Indicators . This is a completely customizable PowerPoint theme that can be put to use immediately. So, download it and address the topic impactfully.
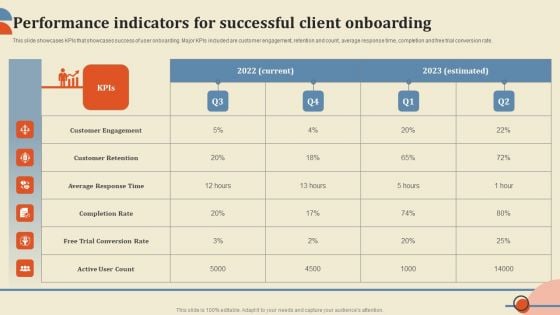
Performance Indicators For Successful Client Onboarding Brochure PDF
This slide showcases KPIs that showcases success of user onboarding. Major KPIs included are customer engagement, retention and count, average response time, completion and free trial conversion rate. Retrieve professionally designed Performance Indicators For Successful Client Onboarding Brochure PDF to effectively convey your message and captivate your listeners. Save time by selecting pre made slideshows that are appropriate for various topics, from business to educational purposes. These themes come in many different styles, from creative to corporate, and all of them are easily adjustable and can be edited quickly. Access them as PowerPoint templates or as Google Slides themes. You do not have to go on a hunt for the perfect presentation because Slidegeeks got you covered from everywhere.
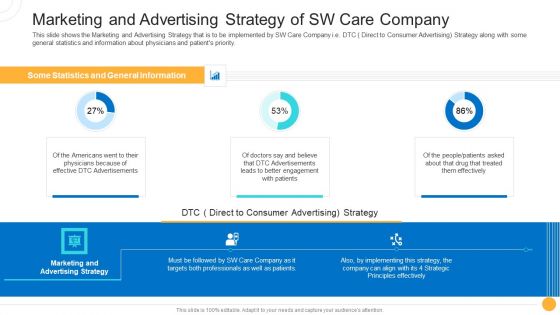
Drug Indicator Extension In A Pharmaceuticals Company Marketing And Advertising Strategy Of SW Care Company Themes PDF
This slide shows the Marketing and Advertising Strategy that is to be implemented by SW Care Company i.e. DTC Direct to Consumer Advertising Strategy along with some general statistics and information about physicians and patients priority. Deliver an awe inspiring pitch with this creative drug indicator extension in a pharmaceuticals company marketing and advertising strategy of sw care company themes pdf bundle. Topics like effective, engagement, strategic, implementing, marketing can be discussed with this completely editable template. It is available for immediate download depending on the needs and requirements of the user.
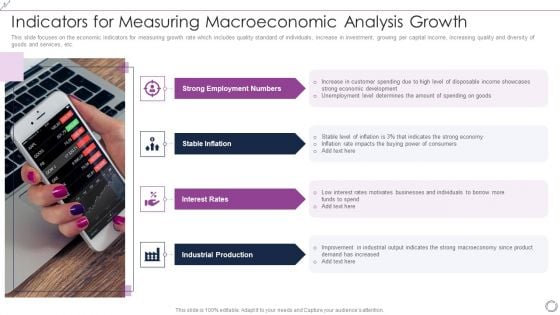
Indicators For Measuring Macroeconomic Analysis Growth Slides PDF
This slide focuses on the economic indicators for measuring growth rate which includes quality standard of individuals, increase in investment, growing per capital income, increasing quality and diversity of goods and services, etc. PresentingIndicators For Measuring Macroeconomic Analysis Growth Slides PDF to dispense important information. This template comprises four stages. It also presents valuable insights into the topics including Strong Employment Numbers, Stable Inflation, Interest Rates, Industrial Production. This is a completely customizable PowerPoint theme that can be put to use immediately. So, download it and address the topic impactfully.
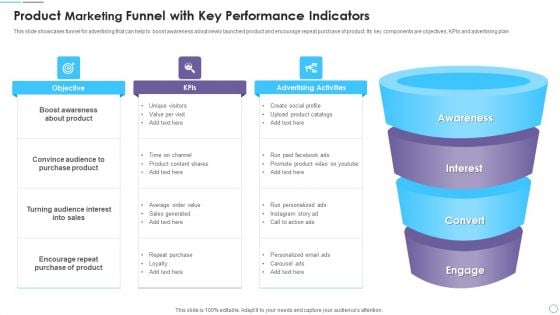
Product Marketing Funnel With Key Performance Indicators Guidelines PDF
This slide showcases funnel for advertising that can help to boost awareness about newly launched product and encourage repeat purchase of product. Its key components are objectives, KPIs and advertising plan. Presenting Product Marketing Funnel With Key Performance Indicators Guidelines PDF to dispense important information. This template comprises four stages. It also presents valuable insights into the topics including Awareness, Interest, Convert, Engage. This is a completely customizable PowerPoint theme that can be put to use immediately. So, download it and address the topic impactfully.
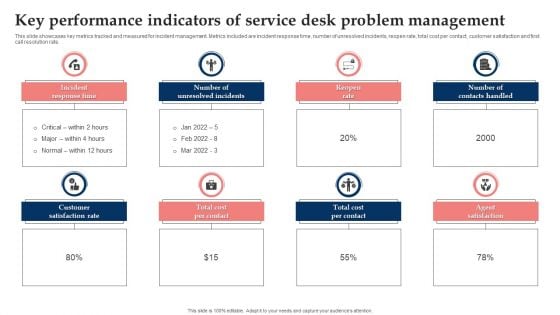
Key Performance Indicators Of Service Desk Problem Management Elements PDF
This slide showcases key metrics tracked and measured for incident management. Metrics included are incident response time, number of unresolved incidents, reopen rate, total cost per contact, customer satisfaction and first call resolution rate. Presenting Key Performance Indicators Of Service Desk Problem Management Elements PDF to dispense important information. This template comprises eight stages. It also presents valuable insights into the topics including Incident Response Time, Number Of Unresolved Incidents, Number Of Contacts Handled. This is a completely customizable PowerPoint theme that can be put to use immediately. So, download it and address the topic impactfully.
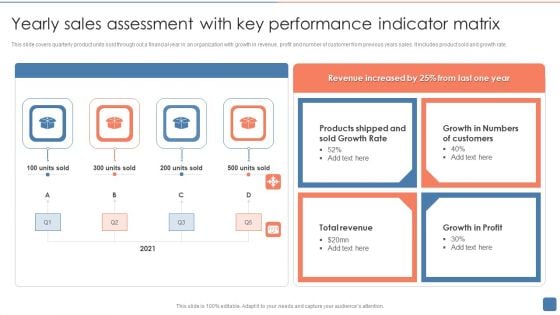
Yearly Sales Assessment With Key Performance Indicator Matrix Introduction PDF
This slide covers quarterly product units sold through out a financial year in an organization with growth in revenue, profit and number of customer from previous years sales. It includes product sold and growth rate. Presenting Yearly Sales Assessment With Key Performance Indicator Matrix Introduction PDF to dispense important information. This template comprises four stages. It also presents valuable insights into the topics including Sold Growth Rate, Customers, Growth In Profit. This is a completely customizable PowerPoint theme that can be put to use immediately. So, download it and address the topic impactfully.
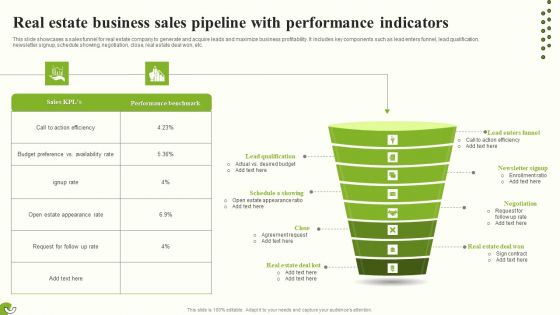
Real Estate Business Sales Pipeline With Performance Indicators Background PDF
This slide showcases a sales funnel for real estate company to generate and acquire leads and maximize business profitability. It includes key components such as lead enters funnel, lead qualification, newsletter signup, schedule showing, negotiation, close, real estate deal won, etc. Presenting Real Estate Business Sales Pipeline With Performance Indicators Background PDF to dispense important information. This template comprises eight stages. It also presents valuable insights into the topics including Budget Preference, Newsletter Signup, Real Estate Deal Won. This is a completely customizable PowerPoint theme that can be put to use immediately. So, download it and address the topic impactfully.
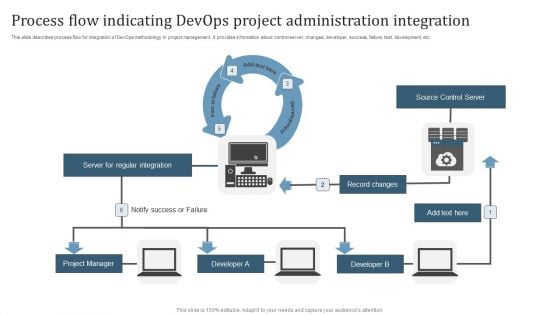
Process Flow Indicating Devops Project Administration Integration Microsoft PDF
This slide describes process flow for integration of DevOps methodology in project management. It provides information about control server, changes, developer, success, failure, test, development, etc. Presenting Process Flow Indicating Devops Project Administration Integration Microsoft PDF to dispense important information. This template comprises three stages. It also presents valuable insights into the topics including Server For Regular Integration, Source Control Server, Record Changes. This is a completely customizable PowerPoint theme that can be put to use immediately. So, download it and address the topic impactfully.
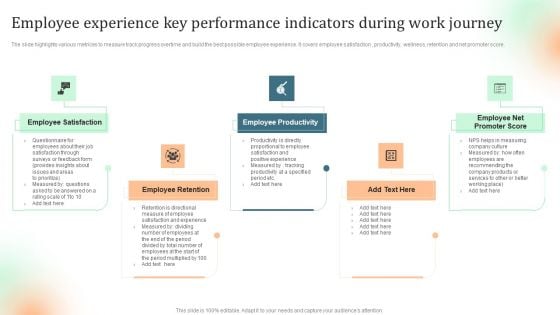
Employee Experience Key Performance Indicators During Work Journey Topics PDF
The slide highlights various metrices to measure track progress overtime and build the best possible employee experience. It covers employee satisfaction , productivity, wellness, retention and net promoter score. Presenting Employee Experience Key Performance Indicators During Work Journey Topics PDF to dispense important information. This template comprises five stages. It also presents valuable insights into the topics including Employee Productivity, Employee Retention, Employee Satisfaction. This is a completely customizable PowerPoint theme that can be put to use immediately. So, download it and address the topic impactfully.
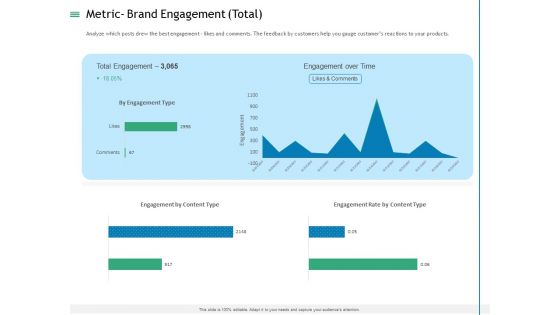
Measuring Influencer Marketing ROI Metric Brand Engagement Total Themes PDF
Analyze which posts drew the best engagement likes and comments. The feedback by customers help you gauge customers reactions to your products. Deliver an awe-inspiring pitch with this creative measuring influencer marketing roi metric brand engagement total themes pdf bundle. Topics like engagement over time, total engagement, engagement by content type can be discussed with this completely editable template. It is available for immediate download depending on the needs and requirements of the user.
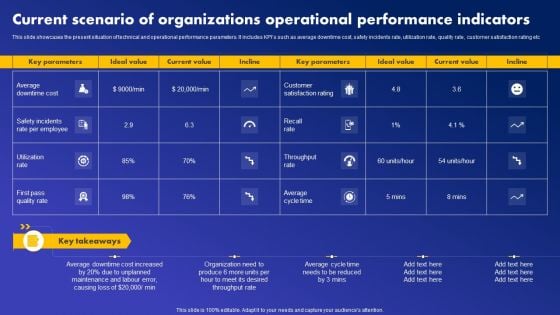
Current Scenario Of Organizations Operational Performance Indicators Professional PDF
This slide showcases the present situation of technical and operational performance parameters. It includes KPIs such as average downtime cost, safety incidents rate, utilization rate, quality rate, customer satisfaction rating etc Whether you have daily or monthly meetings, a brilliant presentation is necessary. Current Scenario Of Organizations Operational Performance Indicators Professional PDF can be your best option for delivering a presentation. Represent everything in detail using Current Scenario Of Organizations Operational Performance Indicators Professional PDF and make yourself stand out in meetings. The template is versatile and follows a structure that will cater to your requirements. All the templates prepared by Slidegeeks are easy to download and edit. Our research experts have taken care of the corporate themes as well. So, give it a try and see the results.


 Continue with Email

 Home
Home


