Meter Icon
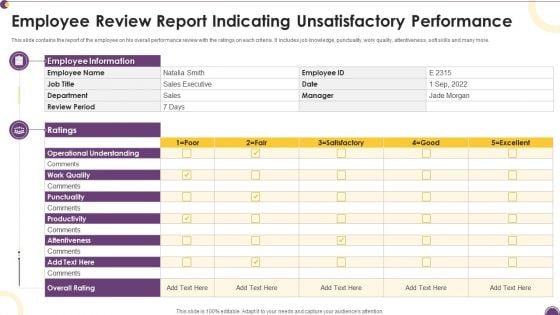
Employee Review Report Indicating Unsatisfactory Performance Themes PDF
This slide contains the report of the employee on his overall performance review with the ratings on each criteria. It includes job knowledge, punctuality, work quality, attentiveness, soft skills and many more.Pitch your topic with ease and precision using this Employee Review Report Indicating Unsatisfactory Performance Themes PDF. This layout presents information on Operational Understanding, Employee Information, Punctuality. It is also available for immediate download and adjustment. So, changes can be made in the color, design, graphics or any other component to create a unique layout.
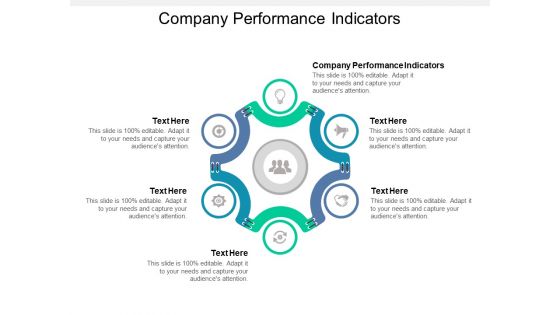
Company Performance Indicators Ppt PowerPoint Presentation Diagram Images
This is a company performance indicators ppt powerpoint presentation diagram images. This is a six stage process. The stages in this process are company performance indicators.
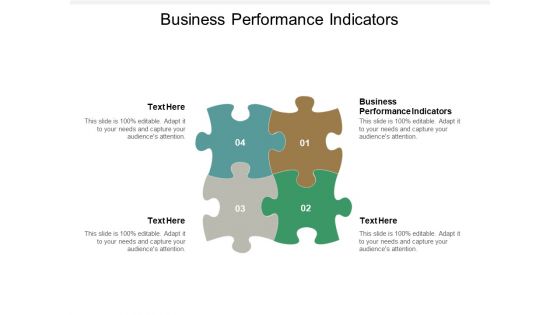
Business Performance Indicators Ppt PowerPoint Presentation Visual Aids Diagrams Cpb
This is a business performance indicators ppt powerpoint presentation visual aids diagrams cpb. This is a four stage process. The stages in this process are business performance indicators.
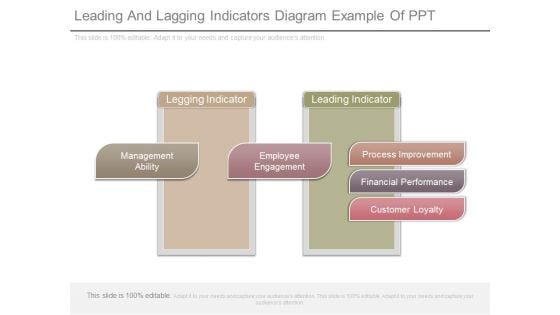
Leading And Lagging Indicators Diagram Example Of Ppt
This is a leading and lagging indicators diagram example of ppt. This is a two stage process. The stages in this process are legging indicator, management ability, employee engagement, leading indicator, process improvement, financial performance, customer loyalty.
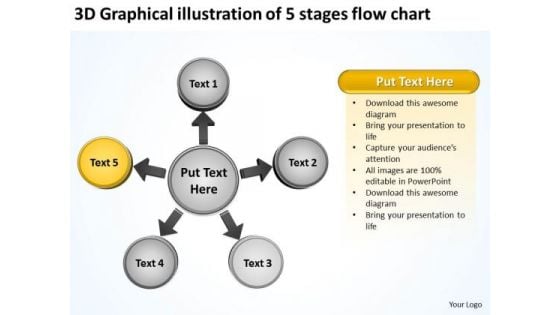
3d Graphical Illustration Of 5 Stages Flow Chart Arrow Circular Spoke Diagram PowerPoint Slides
We present our 3d graphical illustration of 5 stages flow chart arrow Circular Spoke Diagram PowerPoint Slides.Present our Business PowerPoint Templates because you are ready to flap your wings and launch off. All poised are you to touch the sky with glory. Present our Circle charts PowerPoint Templates because they are the indicators of the path you have in mind. Download our Arrows PowerPoint Templates because you can put down your ideas and present them using our innovative templates. Present our Shapes PowerPoint Templates because it Shines the light on your thoughts and motivates your team to improve the quality of celebration for all around you. Use our Flow charts PowerPoint Templates because you have the ideas to develop the teams vision of where they need to be in the future.Use these PowerPoint slides for presentations relating to Abstract, arrow, arrow, circle, business, concept, career, center, stage, chart, circle circle, connection, contrast, cycle, diagram, direction, flow flowchart, future, graph, icon, illustration, isolate, isolated, job, life, loop, money, motion network, recycle, refresh, ring, rotation, sick, sign, symbol, simply, target, wealth. The prominent colors used in the PowerPoint template are Yellow, Gray, White. People tell us our 3d graphical illustration of 5 stages flow chart arrow Circular Spoke Diagram PowerPoint Slides are Romantic. PowerPoint presentation experts tell us our business PowerPoint templates and PPT Slides are Vintage. Presenters tell us our 3d graphical illustration of 5 stages flow chart arrow Circular Spoke Diagram PowerPoint Slides are Fantastic. PowerPoint presentation experts tell us our circle PowerPoint templates and PPT Slides are Functional. People tell us our 3d graphical illustration of 5 stages flow chart arrow Circular Spoke Diagram PowerPoint Slides are Nifty. People tell us our center PowerPoint templates and PPT Slides will generate and maintain the level of interest you desire. They will create the impression you want to imprint on your audience. Our 3d Graphical Illustration Of 5 Stages Flow Chart Arrow Circular Spoke Diagram PowerPoint Slides stay away from farce. They treat every event correctly.
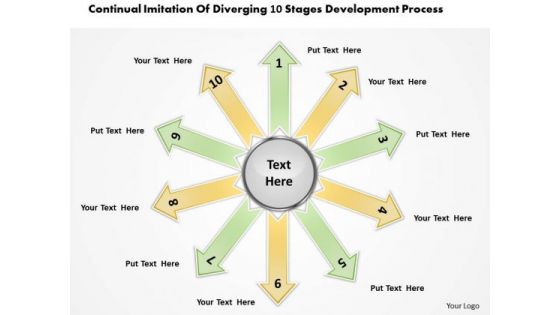
Imitation Of Diverging 10 Stages Development Process Ppt Pie Diagram PowerPoint Templates
We present our imitation of diverging 10 stages development process ppt Pie Diagram PowerPoint templates.Download our Arrows PowerPoint Templates because this layout helps you to see satisfaction spread across the room as they unravel your gifted views. Use our Circle Charts PowerPoint Templates because this Layout can explain the relevance of the different layers and stages in getting down to your core competence, ability and desired result. Use our Shapes PowerPoint Templates because it has inspired a whole new world of medical endeavour. Download our Business PowerPoint Templates because you can Lead your flock steadily to greater heights. Look around at the vast potential of achievement around you. Present our Flow Charts PowerPoint Templates because this is an excellent slide to detail and highlight your thought process, your views and your positive expectations..Use these PowerPoint slides for presentations relating to arrow, arrowheads, badge, banner, blue, button, cerulean, cobalt, colored, colorful, connection, cursor, cyan, design element, designator, icon, indicator, interface, internet, link, load, magenta, marker, matted, menu tool, navigation panel, next, orientation, page site, pictogram, pink, pointer, red, right, satined, sign, signpost, smooth, symbol, . The prominent colors used in the PowerPoint template are Yellow, Green, Gray. Presenters tell us our imitation of diverging 10 stages development process ppt Pie Diagram PowerPoint templates are Attractive. You can be sure our button PowerPoint templates and PPT Slides will make the presenter successul in his career/life. Professionals tell us our imitation of diverging 10 stages development process ppt Pie Diagram PowerPoint templates will impress their bosses and teams. People tell us our button PowerPoint templates and PPT Slides are Elevated. People tell us our imitation of diverging 10 stages development process ppt Pie Diagram PowerPoint templates provide great value for your money. Be assured of finding the best projection to highlight your words. Professionals tell us our blue PowerPoint templates and PPT Slides are Pretty. Give a fillip to your plans with our Imitation Of Diverging 10 Stages Development Process Ppt Pie Diagram PowerPoint Templates. They will get that extra attention you seek.
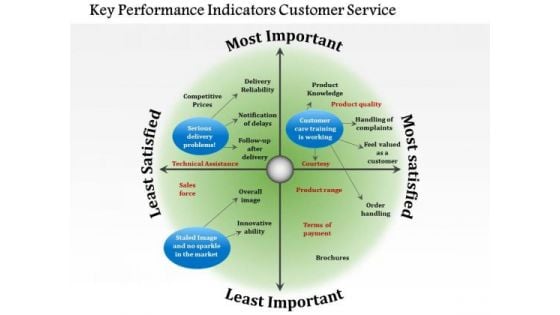
Business Diagram Key Performance Indicators Customer Service PowerPoint Ppt Presentation
Our above diagram provides framework of key performance indicators for customer service. It contains circular diagram in four segments depicting concepts of delivery problems, customer care training. Download this diagram to make professional presentations on customer service.
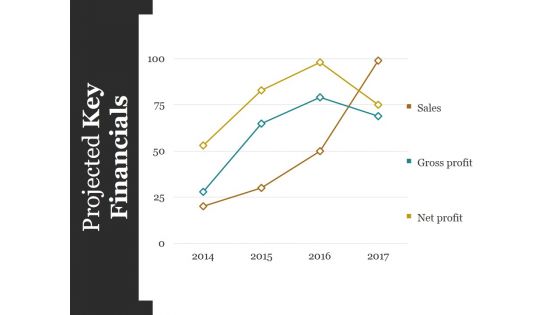
Projected Key Financials Template Ppt PowerPoint Presentation Styles Graphics Design
This is a projected key financials template ppt powerpoint presentation styles graphics design. This is a four stage process. The stages in this process are sales, gross profit, net profit.
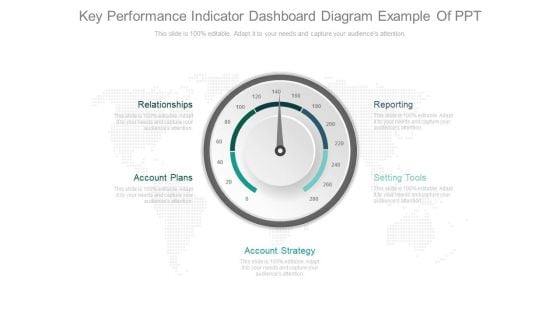
Key Performance Indicator Dashboard Diagram Example Of Ppt
This is a key performance indicator dashboard diagram example of ppt. This is a five stage process. The stages in this process are relationships, account plans, account strategy, setting tools, reporting.
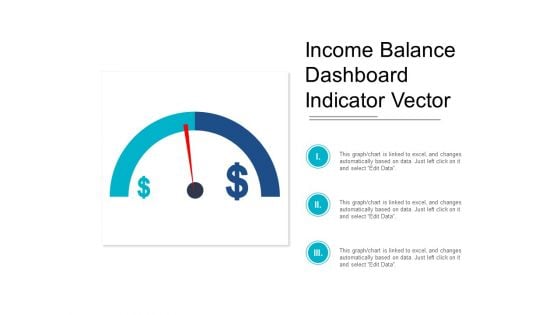
Income Balance Dashboard Indicator Vector Ppt PowerPoint Presentation Professional Diagrams
This is a income balance dashboard indicator vector ppt powerpoint presentation professional diagrams. This is a three stage process. The stages in this process are growth, increase sales, increase revenue.
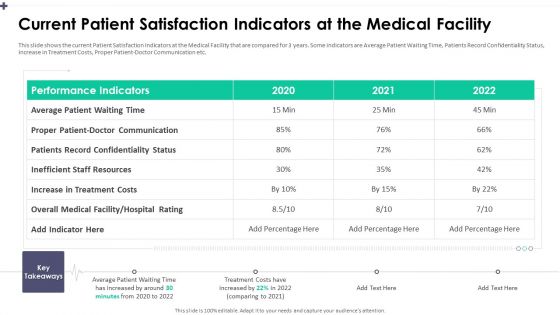
Current Patient Satisfaction Indicators At The Medical Facility Diagrams PDF
This slide shows the current Patient Satisfaction Indicators at the Medical Facility that are compared for 3 years. Some indicators are Average Patient Waiting Time, Patients Record Confidentiality Status, Increase in Treatment Costs, Proper Patient Doctor Communication etc.Deliver and pitch your topic in the best possible manner with this patients record confidentiality, inefficient staff resources, performance indicators. Use them to share invaluable insights on patients record confidentiality, inefficient staff resources, performance indicators and impress your audience. This template can be altered and modified as per your expectations. So, grab it now.
Software Tool Leading And Lagging Performance Tracking Indicators Diagrams PDF
This slide showcase the lagging and leading performance indicators after the implementation of a software tool. It includes customer integration data, email campaign revenue generated,session time, email deliverability, email click rates etc. Persuade your audience using this Software Tool Leading And Lagging Performance Tracking Indicators Diagrams PDF. This PPT design covers Two stages, thus making it a great tool to use. It also caters to a variety of topics including Software Tool Leading, Lagging Performance, Tracking Indicators. Download this PPT design now to present a convincing pitch that not only emphasizes the topic but also showcases your presentation skills.
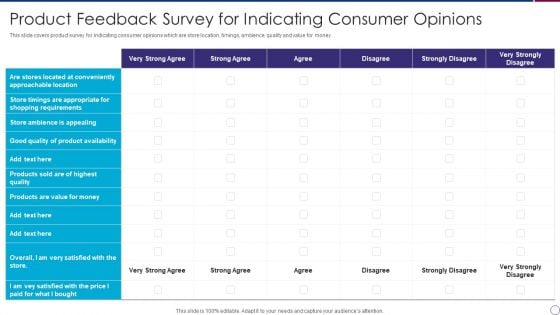
Product Feedback Survey For Indicating Consumer Opinions Diagrams PDF
This slide covers product survey for indicating consumer opinions which are store location, timings, ambience, quality and value for money.Showcasing this set of slides titled Product Feedback Survey For Indicating Consumer Opinions Diagrams PDF The topics addressed in these templates are Approachable Location, Product Availability, Ambience Appealing All the content presented in this PPT design is completely editable. Download it and make adjustments in color, background, font etc. as per your unique business setting.
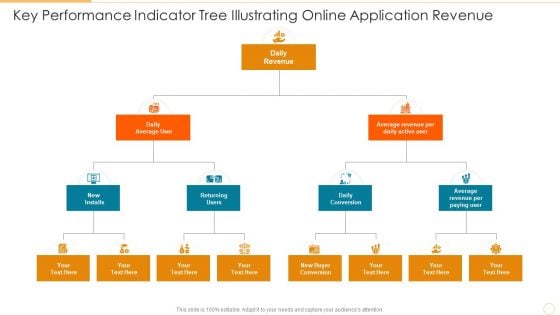
Key Performance Indicator Tree Illustrating Online Application Revenue Download PDF
Presenting key performance indicator tree illustrating online application revenue download pdf to dispense important information. This template comprises three stages. It also presents valuable insights into the topics including daily conversion, returning users, daily revenue. This is a completely customizable PowerPoint theme that can be put to use immediately. So, download it and address the topic impactfully.
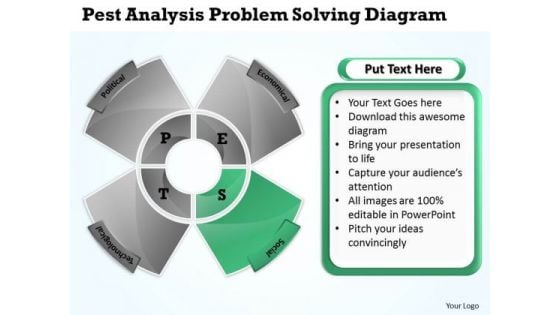
Business Structure Diagram Pest Analysis Problem Solving PowerPoint Slides
We present our business structure diagram pest analysis problem solving PowerPoint Slides.Download and present our Advertising PowerPoint Templates because It will let you Set new benchmarks with our PowerPoint Templates and Slides. They will keep your prospects well above par. Download our Shapes PowerPoint Templates because Our PowerPoint Templates and Slides will bullet point your ideas. See them fall into place one by one. Use our Business PowerPoint Templates because our PowerPoint Templates and Slides are the string of your bow. Fire of your ideas and conquer the podium. Present our Process and Flows PowerPoint Templates because Our PowerPoint Templates and Slides will embellish your thoughts. See them provide the desired motivation to your team. Download our Metaphors-Visual Concepts PowerPoint Templates because Our PowerPoint Templates and Slides ensures Effective communication. They help you put across your views with precision and clarity.Use these PowerPoint slides for presentations relating to Actions, analyze, business, commerce, concept, conceptual, define, design, diagram, direction, guidelines, icon, implement, improve, indicators, integration, key, manage, management, mba, model, optimize, organization, performance, process, resentation, resource, review, selling, solution, solve, system, theoretical, theory, tool. The prominent colors used in the PowerPoint template are Green, Gray, Black. The feedback we get is that our business structure diagram pest analysis problem solving PowerPoint Slides will save the presenter time. The feedback we get is that our conceptual PowerPoint templates and PPT Slides are second to none. Professionals tell us our business structure diagram pest analysis problem solving PowerPoint Slides are readymade to fit into any presentation structure. Professionals tell us our concept PowerPoint templates and PPT Slides are topically designed to provide an attractive backdrop to any subject. Presenters tell us our business structure diagram pest analysis problem solving PowerPoint Slides are effectively colour coded to prioritise your plans They automatically highlight the sequence of events you desire. You can be sure our business PowerPoint templates and PPT Slides are designed to make your presentations professional. Our Business Structure Diagram Pest Analysis Problem Solving PowerPoint Slides will keep u sane. Your thoughts will bolt across the line.
Indication Traffic Direction PowerPoint Slides And Ppt Diagram Templates
Indication Traffic Direction PowerPoint Slides And PPT Diagram Templates-These high quality powerpoint pre-designed slides and powerpoint templates have been carefully created by our professional team to help you impress your audience. All slides have been created and are 100% editable in powerpoint. Each and every property of any graphic - color, size, orientation, shading, outline etc. can be modified to help you build an effective powerpoint presentation. Any text can be entered at any point in the powerpoint template or slide. Simply DOWNLOAD, TYPE and PRESENT! Decrease conflict with your thoughts.Enable communication with our Indication Traffic Direction PowerPoint Slides And Ppt Diagram Templates.
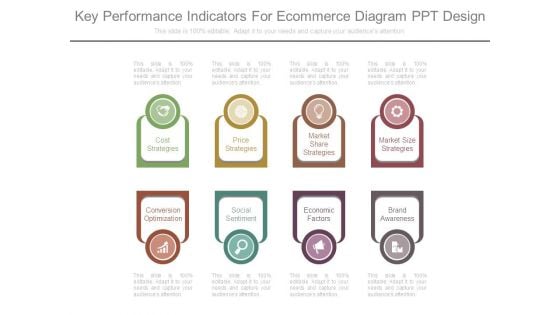
Key Performance Indicators For Ecommerce Diagram Ppt Design
This is a key performance indicators for ecommerce diagram ppt design. This is a eight stage process. The stages in this process are cost strategies, price strategies, market share strategies, market size strategies, conversion optimization, social sentiment, economic factors, brand awareness.
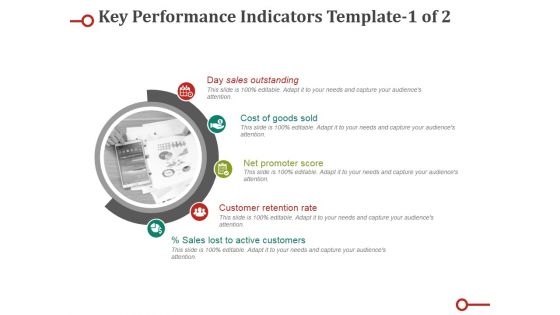
Key Performance Indicators Template Ppt PowerPoint Presentation Professional Diagrams
This is a key performance indicators template ppt powerpoint presentation professional diagrams. This is a five stage process. The stages in this process are day sales outstanding, cost of goods sold, net promoter score, customer retention rate, sales lost to active customers.
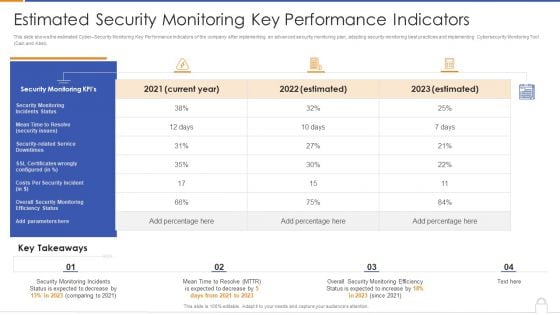
Estimated Security Monitoring Key Performance Indicators Diagrams PDF
Deliver and pitch your topic in the best possible manner with this estimated security monitoring key performance indicators diagrams pdf. Use them to share invaluable insights on security monitoring, security related service downtimes, overall security monitoring and impress your audience. This template can be altered and modified as per your expectations. So, grab it now.
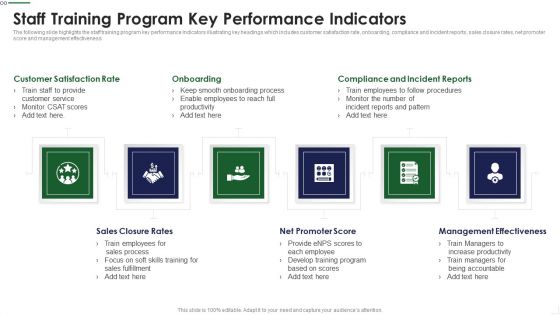
Staff Training Program Key Performance Indicators Diagrams PDF
The following slide highlights the staff training program key performance Indicators illustrating key headings which includes customer satisfaction rate, onboarding, compliance and incident reports, sales closure rates, net promoter score and management effectiveness Presenting Staff Training Program Key Performance Indicators Diagrams PDF to provide visual cues and insights. Share and navigate important information on six stages that need your due attention. This template can be used to pitch topics like Turnover Quarter, Turnover Type, Turnover Reasons In addtion, this PPT design contains high resolution images, graphics, etc, that are easily editable and available for immediate download.
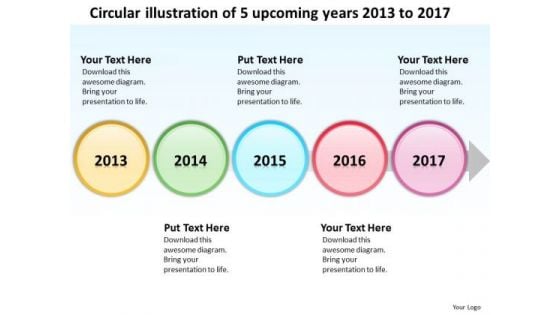
Circular Illustration Of 5 Upcoming Years 2013 To 2017 PowerPoint Templates Ppt Slides Graphics
We present our Circular illustration of 5 upcoming years 2013 to 2017 PowerPoint Templates PPT Slides Graphics.Download and present our Marketing PowerPoint Templates because generation of sales is the core of any business. Present our Timelines PowerPoint Templates because they are the indicators of the path you have in mind. Download our Business PowerPoint Templates because the fruits of your labour are beginning to show.Enlighten them on the great plans you have for their enjoyment. Present our Arrows PowerPoint Templates because this diagram helps you to show goal also clearly etched in your mind. Download and present our Time planning PowerPoint Templates because this diagram helps you to discuss each step slowly but surely move up the pyramid narrowing down to the best and most success oriented project.Use these PowerPoint slides for presentations relating to Art, Background, Button, Call, City, Colorful, Concept, Country, Destination, Editable, Flag, Fuel, Geography, Graphic, Home, Icon, Illustration, Journey, Land, Locate, Location, Macro, Map, Mapping, Mark, Navigate, Needle, Petrol, Pin, Pinpoint, Place, Pointing, Pump, Push, Pushpin, Restaurant, Road, Roadmap, Service, Set, Shiny, Space, Symbol, Town, Travel, Trip. The prominent colors used in the PowerPoint template are Red, Green, Blue. PowerPoint presentation experts tell us our Circular illustration of 5 upcoming years 2013 to 2017 PowerPoint Templates PPT Slides Graphics are designed to make your presentations professional. Customers tell us our Call PowerPoint templates and PPT Slides are Charming. Customers tell us our Circular illustration of 5 upcoming years 2013 to 2017 PowerPoint Templates PPT Slides Graphics are Fashionable. Customers tell us our Concept PowerPoint templates and PPT Slides are designed to make your presentations professional. PowerPoint presentation experts tell us our Circular illustration of 5 upcoming years 2013 to 2017 PowerPoint Templates PPT Slides Graphics are Great. People tell us our Colorful PowerPoint templates and PPT Slides are aesthetically designed to attract attention. We guarantee that they will grab all the eyeballs you need. It is time to say farewell to failure. Our Circular Illustration Of 5 Upcoming Years 2013 To 2017 PowerPoint Templates Ppt Slides Graphics assure achievement.
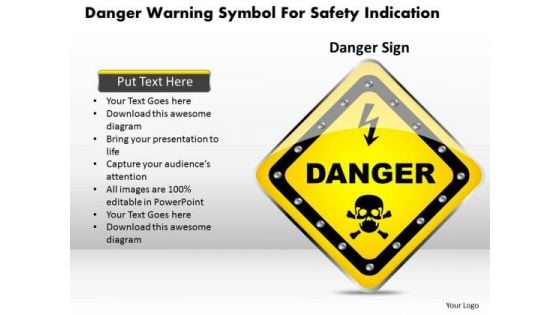
Business Diagram Danger Warning Symbol For Safety Indication Presentation Template
This Power Point template has been designed with graphic of danger board. This diagram contains the concept of safety warning for danger area. Use this diagram for your warning and safety related presentation.
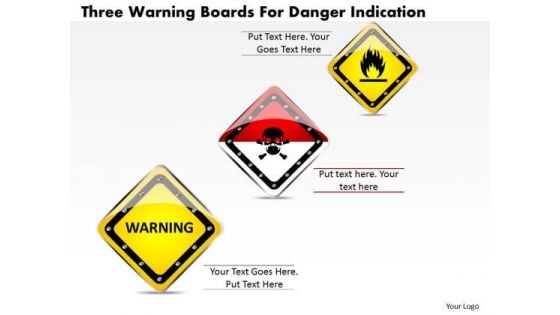
Business Diagram Three Warning Boards For Danger Indication Presentation Template
This Power Point image template has been designed with graphic of three different sign boards. These signs are designed to identify dangerous places. Use this diagram for safety and prevention related topics.
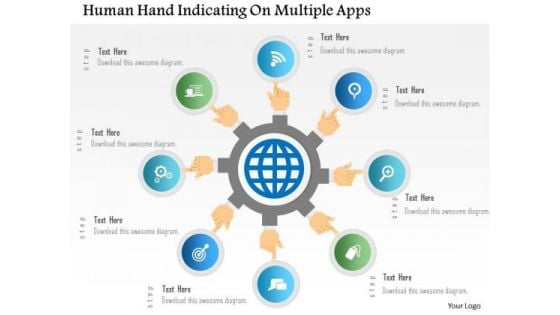
Business Diagram Human Hand Indicating On Multiple Apps PowerPoint Template
Graphic of human hand with multiple apps has been used to craft this PPT. This PPT diagram contains the concept of app usage. Use this PPT for your technology and data related topics in any presentation.

Business Diagram Thermometer Graphics Indicating Progress Presentation Template
This power point template diagram has been designed with graphic of thermometer and bar graph. This PPT contains the concept of growth analysis. Use this PPT for business and marketing related presentations.

Chart Indicates Diminishing Graph And Chart Cash Payment Mode Inspiration PDF
Showcasing this set of slides titled Chart Indicates Diminishing Graph And Chart Cash Payment Mode Inspiration PDF. The topics addressed in these templates are Chart Indicates Diminishing Graph, Chart Cash Payment Mode. All the content presented in this PPT design is completely editable. Download it and make adjustments in color, background, font etc. as per your unique business setting.

Chart Indicates Diminishing Graph And Chart Retail Value And Volume Download PDF
Pitch your topic with ease and precision using this Chart Indicates Diminishing Graph And Chart Retail Value And Volume Download PDF. This layout presents information on Chart Indicates Diminishing Graph, Chart Retail Value And Volume. It is also available for immediate download and adjustment. So, changes can be made in the color, design, graphics or any other component to create a unique layout.
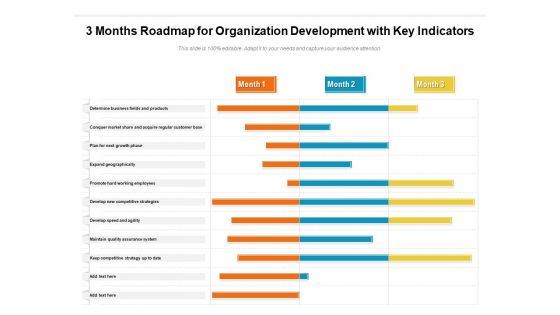
3 Months Roadmap For Organization Development With Key Indicators Guidelines
Presenting the 3 months roadmap for organization development with key indicators guidelines. The template includes a roadmap that can be used to initiate a strategic plan. Not only this, the PowerPoint slideshow is completely editable and you can effortlessly modify the font size, font type, and shapes according to your needs. This PPT slide can be easily reached in standard screen and widescreen aspect ratios. The set is also available in various formats like PDF, PNG, and JPG. So download and use it multiple times as per your knowledge.
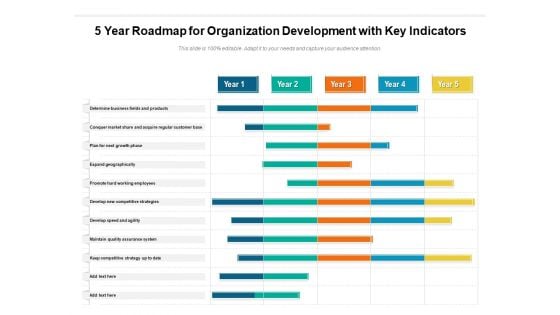
5 Year Roadmap For Organization Development With Key Indicators Clipart
Presenting the 5 year roadmap for organization development with key indicators clipart. The template includes a roadmap that can be used to initiate a strategic plan. Not only this, the PowerPoint slideshow is completely editable and you can effortlessly modify the font size, font type, and shapes according to your needs. This PPT slide can be easily reached in standard screen and widescreen aspect ratios. The set is also available in various formats like PDF, PNG, and JPG. So download and use it multiple times as per your knowledge.
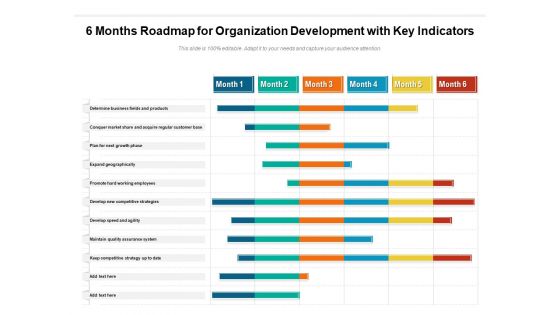
6 Months Roadmap For Organization Development With Key Indicators Topics
Presenting the 6 months roadmap for organization development with key indicators topics. The template includes a roadmap that can be used to initiate a strategic plan. Not only this, the PowerPoint slideshow is completely editable and you can effortlessly modify the font size, font type, and shapes according to your needs. This PPT slide can be easily reached in standard screen and widescreen aspect ratios. The set is also available in various formats like PDF, PNG, and JPG. So download and use it multiple times as per your knowledge.
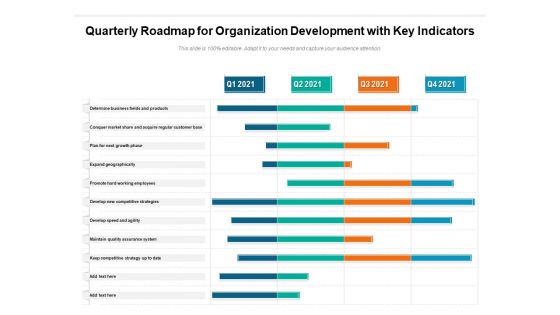
Quarterly Roadmap For Organization Development With Key Indicators Sample
Presenting the quarterly roadmap for organization development with key indicators sample. The template includes a roadmap that can be used to initiate a strategic plan. Not only this, the PowerPoint slideshow is completely editable and you can effortlessly modify the font size, font type, and shapes according to your needs. This PPT slide can be easily reached in standard screen and widescreen aspect ratios. The set is also available in various formats like PDF, PNG, and JPG. So download and use it multiple times as per your knowledge.
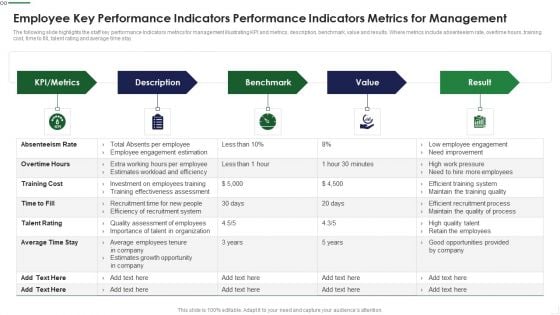
Employee Key Performance Indicators Performance Indicators Metrics For Management Professional PDF
The following slide highlights the staff key performance Indicators metrics for management illustrating KPI and metrics, description, benchmark, value and results. Where metrics include absenteeism rate, overtime hours, training cost, time to fill, talent rating and average time stay Presenting Employee Key Performance Indicators Performance Indicators Metrics For Management Professional PDF to dispense important information. This template comprises five stages. It also presents valuable insights into the topics including Employee Engagement, Recruitment System, Talent Organization This is a completely customizable PowerPoint theme that can be put to use immediately. So, download it and address the topic impactfully.
Dashboard For Tracking Global Share Market Indices Formats PDF
Following slide represent a comprehensive dashboard to track stock market indices of different countries. The indices mentioned in the slide are DOW jones, NASDAQ, S and P along with the highest and lowest price of indices on a particular day. Showcasing this set of slides titled Dashboard For Tracking Global Share Market Indices Formats PDF. The topics addressed in these templates are Global Share, Market Indices, Abbreviations. All the content presented in this PPT design is completely editable. Download it and make adjustments in color, background, font etc. as per your unique business setting.
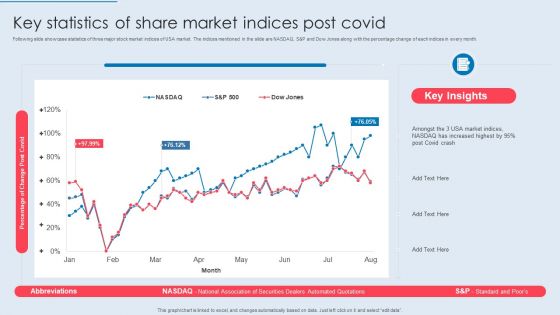
Key Statistics Of Share Market Indices Post Covid Sample PDF
Following slide showcase statistics of three major stock market indices of USA market. The indices mentioned in the slide are NASDAQ, S and P and Dow Jones along with the percentage change of each indices in every month. Showcasing this set of slides titled Key Statistics Of Share Market Indices Post Covid Sample PDF. The topics addressed in these templates are Percentage Change Post Covid, Increased Highest, Indices Post Covid. All the content presented in this PPT design is completely editable. Download it and make adjustments in color, background, font etc. as per your unique business setting.
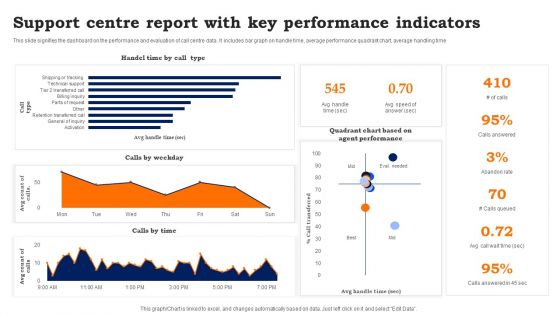
Support Centre Report With Key Performance Indicators Information PDF
This slide signifies the dashboard on the performance and evaluation of call centre data. It includes bar graph on handle time, average performance quadrant chart, average handling time. Showcasing this set of slides titled Support Centre Report With Key Performance Indicators Information PDF. The topics addressed in these templates are Support Centre Report, Key Performance Indicators. All the content presented in this PPT design is completely editable. Download it and make adjustments in color, background, font etc. as per your unique business setting.
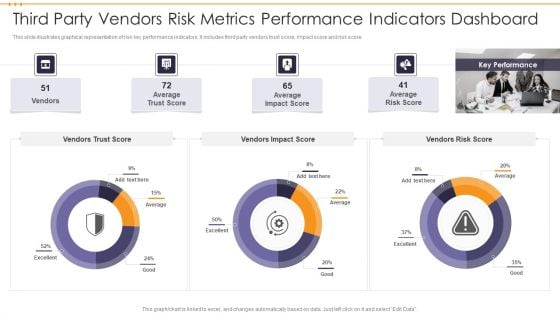
Third Party Vendors Risk Metrics Performance Indicators Dashboard Topics PDF
This slide illustrates graphical representation of risk key performance indicators. It includes third party vendors trust score, impact score and risk score. Pitch your topic with ease and precision using this Third Party Vendors Risk Metrics Performance Indicators Dashboard Topics PDF. This layout presents information on Third Party Vendors Risk Metrics Performance Indicators Dashboard. It is also available for immediate download and adjustment. So, changes can be made in the color, design, graphics or any other component to create a unique layout.

HR Framework Dashboard Indicating Kpis Of Employees Introduction PDF
This slide represents human resource HR structure dashboard indicating key performance indicators KPIs of employees. it provides information regarding absenteeism, overtime hours, training costs etc.Pitch your topic with ease and precision using this HR Framework Dashboard Indicating Kpis Of Employees Introduction PDF. This layout presents information on Absenteeism Rate, Costs, Average. It is also available for immediate download and adjustment. So, changes can be made in the color, design, graphics or any other component to create a unique layout.
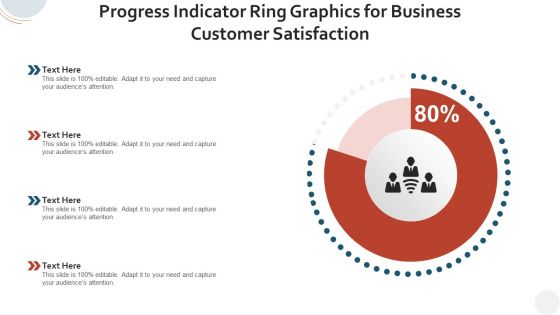
Progress Indicator Ring Graphics For Business Customer Satisfaction Background PDF
Pitch your topic with ease and precision using this progress indicator ring graphics for business customer satisfaction background pdf. This layout presents information on progress indicator ring graphics for business customer satisfaction. It is also available for immediate download and adjustment. So, changes can be made in the color, design, graphics or any other component to create a unique layout.
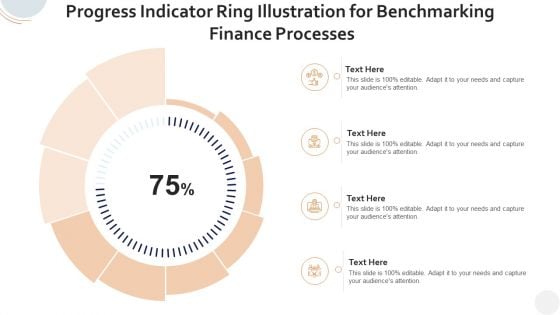
Progress Indicator Ring Illustration For Benchmarking Finance Processes Clipart PDF
Pitch your topic with ease and precision using this progress indicator ring illustration for benchmarking finance processes clipart pdf. This layout presents information on progress indicator ring illustration for benchmarking finance processes. It is also available for immediate download and adjustment. So, changes can be made in the color, design, graphics or any other component to create a unique layout.
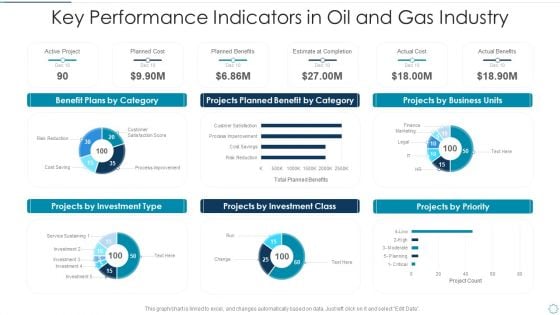
Key Performance Indicators In Oil And Gas Industry Template PDF
Showcasing this set of slides titled key performance indicators in oil and gas industry template pdf. The topics addressed in these templates are key performance indicators in oil and gas industry. All the content presented in this PPT design is completely editable. Download it and make adjustments in color, background, font etc. as per your unique business setting.
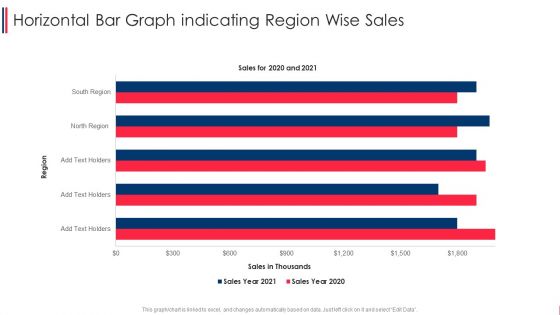
Horizontal Bar Graph Indicating Region Wise Sales Formats PDF
Pitch your topic with ease and precision using this horizontal bar graph indicating region wise sales formats pdf. This layout presents information on horizontal bar graph indicating region wise sales. It is also available for immediate download and adjustment. So, changes can be made in the color, design, graphics or any other component to create a unique layout.
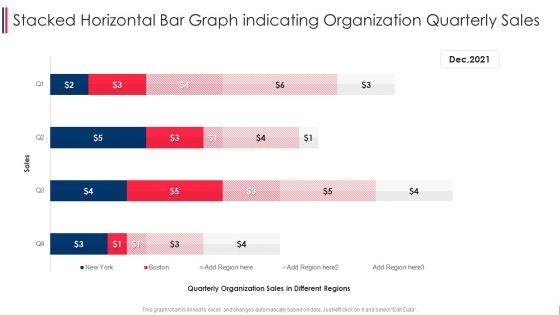
Stacked Horizontal Bar Graph Indicating Organization Quarterly Sales Graphics PDF
Pitch your topic with ease and precision using this stacked horizontal bar graph indicating organization quarterly sales graphics pdf. This layout presents information on stacked horizontal bar graph indicating organization quarterly sales. It is also available for immediate download and adjustment. So, changes can be made in the color, design, graphics or any other component to create a unique layout.
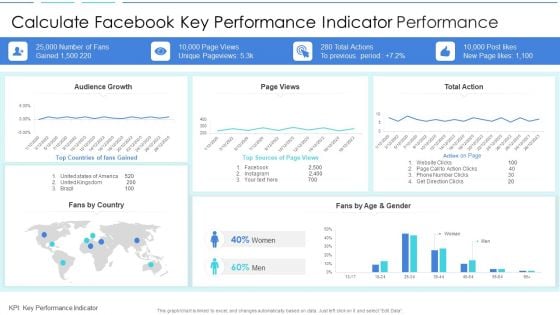
Calculate Facebook Key Performance Indicator Performance Sample PDF
Pitch your topic with ease and precision using this calculate facebook key performance indicator performance sample pdf. This layout presents information on calculate facebook key performance indicator performance. It is also available for immediate download and adjustment. So, changes can be made in the color, design, graphics or any other component to create a unique layout.
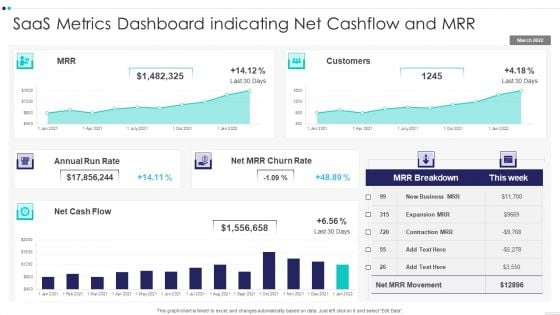
Saas Metrics Dashboard Indicating Net Cashflow And MRR Demonstration PDF
Pitch your topic with ease and precision using this Saas Metrics Dashboard Indicating Net Cashflow And MRR Demonstration PDF This layout presents information on Saas Metrics Dashboard Indicating Net Cashflow And MRR It is also available for immediate download and adjustment. So, changes can be made in the color, design, graphics or any other component to create a unique layout.
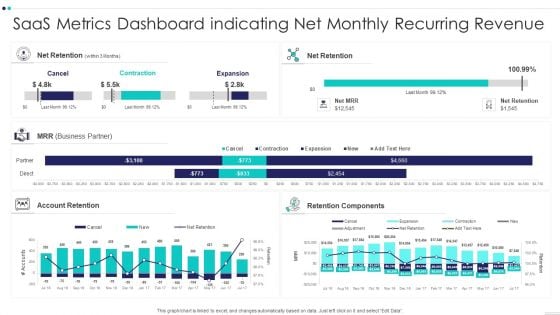
Saas Metrics Dashboard Indicating Net Monthly Recurring Revenue Information PDF
Showcasing this set of slides titled Saas Metrics Dashboard Indicating Net Monthly Recurring Revenue Information PDF The topics addressed in these templates are Saas Metrics Dashboard Indicating Net Monthly Recurring Revenue All the content presented in this PPT design is completely editable. Download it and make adjustments in color, background, font etc. as per your unique business setting.
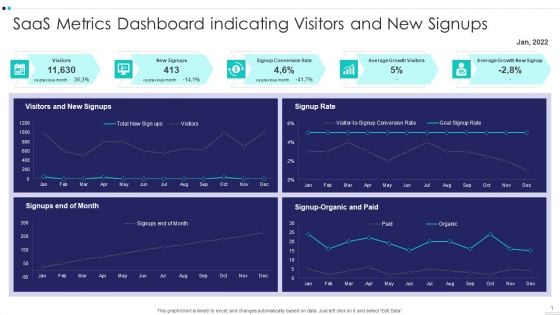
Saas Metrics Dashboard Indicating Visitors And New Signups Elements PDF
Pitch your topic with ease and precision using this Saas Metrics Dashboard Indicating Visitors And New Signups Elements PDF This layout presents information on Saas Metrics Dashboard Indicating Visitors And New Signups It is also available for immediate download and adjustment. So, changes can be made in the color, design, graphics or any other component to create a unique layout.
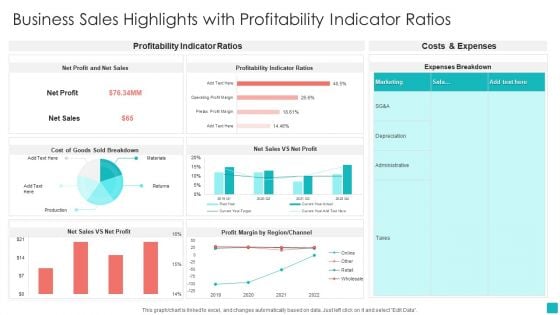
Business Sales Highlights With Profitability Indicator Ratios Download PDF
Showcasing this set of slides titled Business Sales Highlights With Profitability Indicator Ratios Download PDF. The topics addressed in these templates are Net Profit, Net Sales, Profitability Indicator Ratios. All the content presented in this PPT design is completely editable. Download it and make adjustments in color, background, font etc. as per your unique business setting.
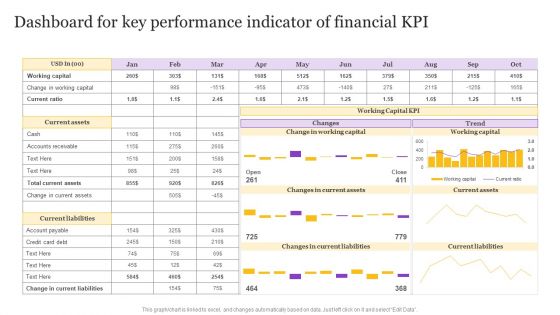
Dashboard For Key Performance Indicator Of Financial KPI Background PDF
Pitch your topic with ease and precision using this Dashboard For Key Performance Indicator Of Financial KPI Background PDF. This layout presents information on Dashboard For Key, Performance Indicator, Financial KPI. It is also available for immediate download and adjustment. So, changes can be made in the color, design, graphics or any other component to create a unique layout.
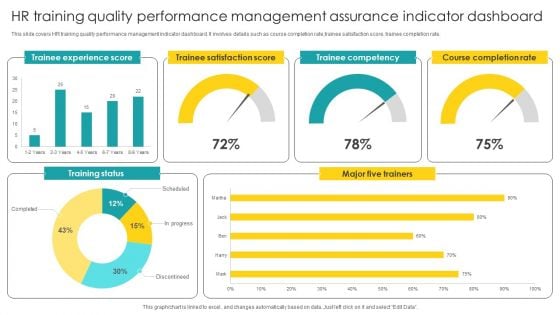
HR Training Quality Performance Management Assurance Indicator Dashboard Structure PDF
Showcasing this set of slides titled HR Training Quality Performance Management Assurance Indicator Dashboard Structure PDF. The topics addressed in these templates are Performance Management, Assurance Indicator Dashboard. All the content presented in this PPT design is completely editable. Download it and make adjustments in color, background, font etc. as per your unique business setting.
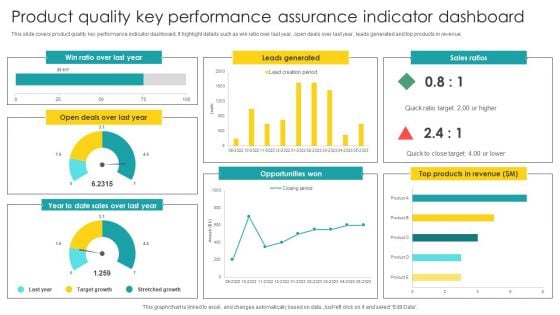
Product Quality Key Performance Assurance Indicator Dashboard Graphics PDF
Showcasing this set of slides titled Product Quality Key Performance Assurance Indicator Dashboard Graphics PDF. The topics addressed in these templates are Key Performance, Assurance Indicator, Dashboard. All the content presented in this PPT design is completely editable. Download it and make adjustments in color, background, font etc. as per your unique business setting.
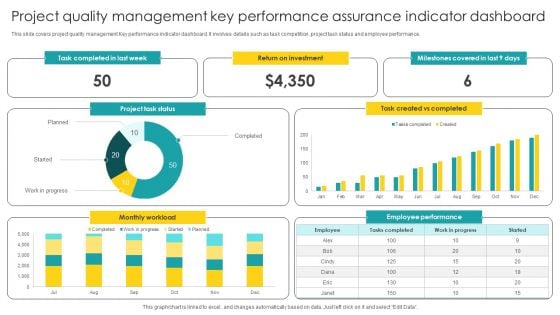
Project Quality Management Key Performance Assurance Indicator Dashboard Guidelines PDF
Pitch your topic with ease and precision using this Project Quality Management Key Performance Assurance Indicator Dashboard Guidelines PDF. This layout presents information on Management Key, Performance Assurance, Indicator Dashboard. It is also available for immediate download and adjustment. So, changes can be made in the color, design, graphics or any other component to create a unique layout.
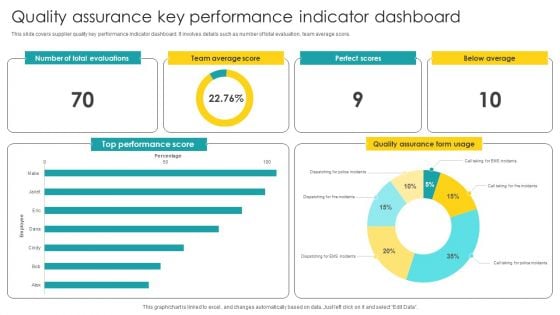
Quality Assurance Key Performance Indicator Dashboard Structure PDF
Showcasing this set of slides titled Quality Assurance Key Performance Indicator Dashboard Structure PDF. The topics addressed in these templates are Key Performance, Indicator Dashboard. All the content presented in this PPT design is completely editable. Download it and make adjustments in color, background, font etc. as per your unique business setting.
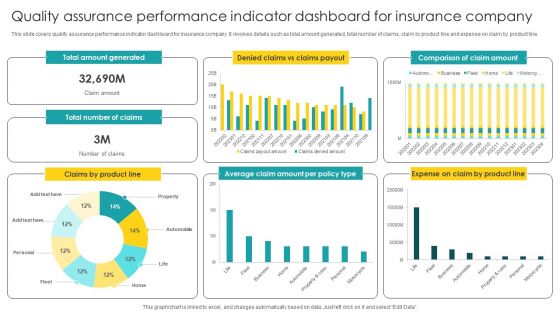
Quality Assurance Performance Indicator Dashboard For Insurance Company Brochure PDF
Pitch your topic with ease and precision using this Quality Assurance Performance Indicator Dashboard For Insurance Company Brochure PDF. This layout presents information on Performance Indicator, Dashboard For Insurance Company. It is also available for immediate download and adjustment. So, changes can be made in the color, design, graphics or any other component to create a unique layout.
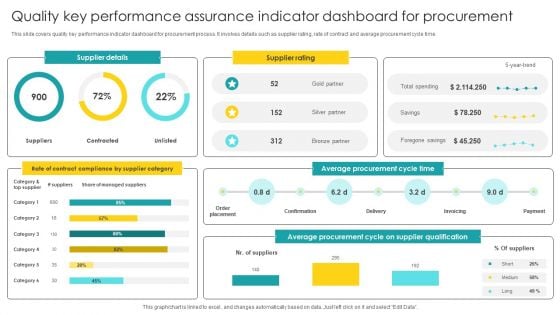
Quality Key Performance Assurance Indicator Dashboard For Procurement Elements PDF
Pitch your topic with ease and precision using this Quality Key Performance Assurance Indicator Dashboard For Procurement Elements PDF. This layout presents information on Indicator Dashboard, Procurement. It is also available for immediate download and adjustment. So, changes can be made in the color, design, graphics or any other component to create a unique layout.
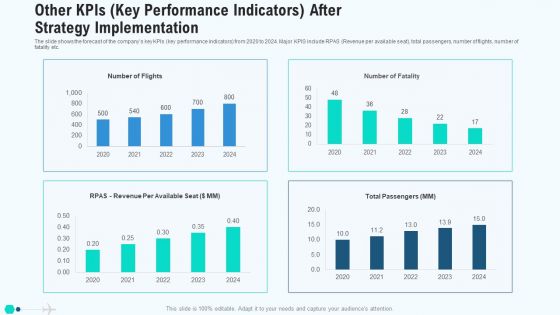
Other Kpis Key Performance Indicators After Strategy Implementation Mockup PDF
The slide shows the forecast of the companys key KPIs key performance indicators from 2020 to 2024. Major KPIS include RPAS Revenue per available seat, total passengers, number of flights, number of fatality etc. Deliver and pitch your topic in the best possible manner with this other kpis key performance indicators after strategy implementation mockup pdf. Use them to share invaluable insights on other kpis key performance indicators after strategy implementation and impress your audience. This template can be altered and modified as per your expectations. So, grab it now.
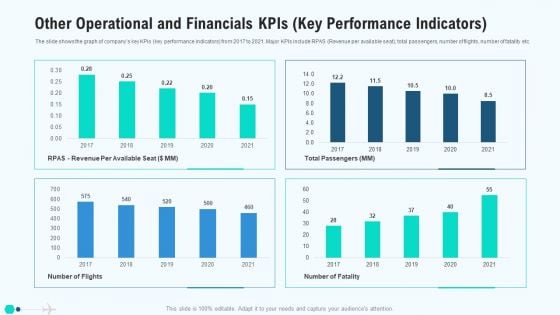
Other Operational And Financials Kpis Key Performance Indicators Clipart PDF
The slide shows the graph of companys key KPIs key performance indicators from 2017 to 2021. Major KPIs include RPAS Revenue per available seat, total passengers, number of flights, number of fatality etc. Deliver an awe inspiring pitch with this creative other operational and financials kpis key performance indicators clipart pdf bundle. Topics like other operational and financials kpis key performance indicators can be discussed with this completely editable template. It is available for immediate download depending on the needs and requirements of the user.
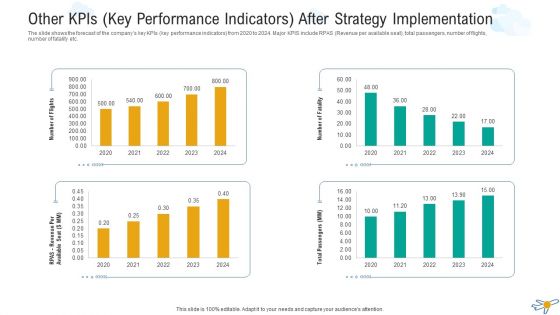
Other Kpis Key Performance Indicators After Strategy Implementation Microsoft PDF
The slide shows the forecast of the companys key KPIs key performance indicators from 2020 to 2024. Major KPIS include RPAS Revenue per available seat, total passengers, number of flights, number of fatality etc. Deliver and pitch your topic in the best possible manner with this other kpis key performance indicators after strategy implementation microsoft pdf. Use them to share invaluable insights on other kpis key performance indicators after strategy implementation and impress your audience. This template can be altered and modified as per your expectations. So, grab it now.
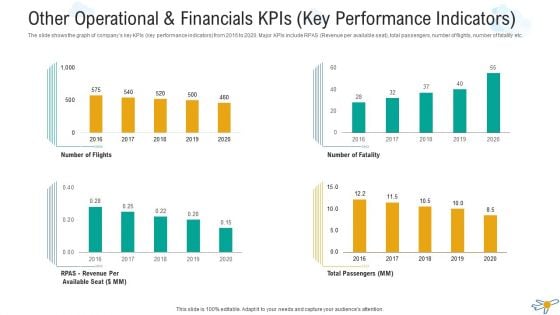
Other Operational And Financials Kpis Key Performance Indicators Professional PDF
The slide shows the graph of companys key KPIs key performance indicators from 2016 to 2020. Major KPIs include RPAS Revenue per available seat, total passengers, number of flights, number of fatality etc. Deliver an awe-inspiring pitch with this creative other operational and financials kpis key performance indicators professional pdf bundle. Topics like other operational and financials kpis key performance indicators can be discussed with this completely editable template. It is available for immediate download depending on the needs and requirements of the user.
Other Kpis Key Performance Indicators After Strategy Implementation Infographics PDF
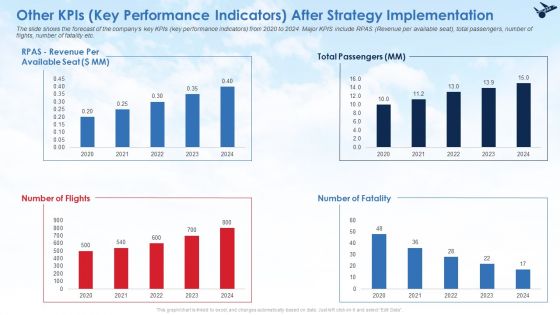
The slide shows the forecast of the companys key KPIs key performance indicators from 2020 to 2024. Major KPIS include RPAS Revenue per available seat, total passengers, number of flights, number of fatality etc. Deliver and pitch your topic in the best possible manner with this other kpis key performance indicators after strategy implementation infographics pdf. Use them to share invaluable insights on other kpis key performance indicators after strategy implementation and impress your audience. This template can be altered and modified as per your expectations. So, grab it now.
Other Operational And Financials Kpis Key Performance Indicators Ideas PDF
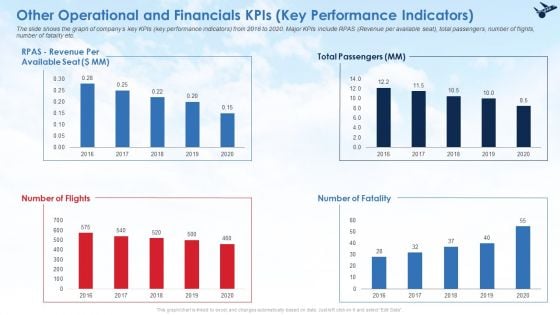
The slide shows the graph of companys key KPIs key performance indicators from 2016 to 2020. Major KPIs include RPAS Revenue per available seat, total passengers, number of flights, number of fatality etc. Deliver an awe inspiring pitch with this creative other operational and financials kpis key performance indicators ideas pdf bundle. Topics like other operational and financials kpis key performance indicators can be discussed with this completely editable template. It is available for immediate download depending on the needs and requirements of the user.


 Continue with Email

 Home
Home


