Meter Icon
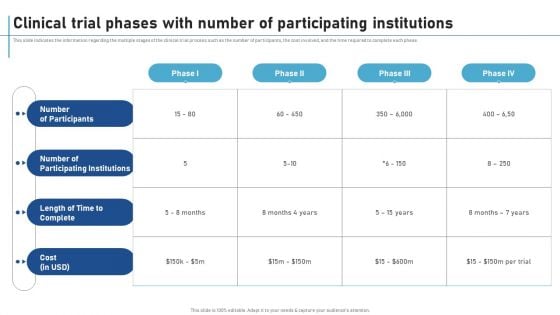
Clinical Trial Phases With Number Of Participating Institutions New Clinical Drug Trial Process Topics PDF
This slide indicates the information regarding the multiple stages of the clinical trial process such as the number of participants, the cost involved, and the time required to complete each phase. Want to ace your presentation in front of a live audience Our Clinical Trial Phases With Number Of Participating Institutions New Clinical Drug Trial Process Topics PDF can help you do that by engaging all the users towards you. Slidegeeks experts have put their efforts and expertise into creating these impeccable powerpoint presentations so that you can communicate your ideas clearly. Moreover, all the templates are customizable, and easy-to-edit and downloadable. Use these for both personal and commercial use.
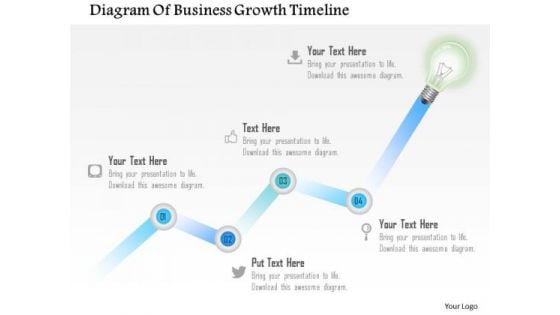
Business Diagram Diagram Of Business Growth Timeline Presentation Template
A sequential time line diagram has been used to design this business slide. This diagram contains the concept of growth indication. Use this professional slide for your business and success related presentations.
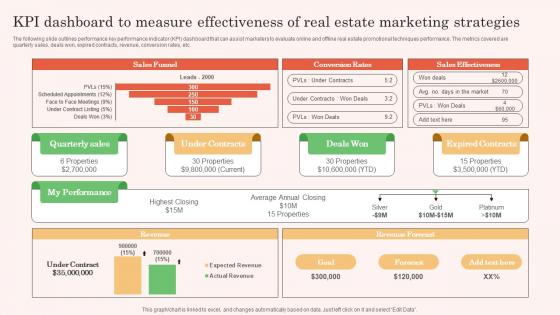
KPI Dashboard To Measure Effectivenesss Real Estate Property Marketing Themes Pdf
The following slide outlines performance key performance indicator KPI dashboard that can assist marketers to evaluate online and offline real estate promotional techniques performance. The metrics covered are quarterly sales, deals won, expired contracts, revenue, conversion rates, etc. Take your projects to the next level with our ultimate collection of KPI Dashboard To Measure Effectivenesss Real Estate Property Marketing Themes Pdf. Slidegeeks has designed a range of layouts that are perfect for representing task or activity duration, keeping track of all your deadlines at a glance. Tailor these designs to your exact needs and give them a truly corporate look with your own brand colors they all make your projects stand out from the rest. The following slide outlines performance key performance indicator KPI dashboard that can assist marketers to evaluate online and offline real estate promotional techniques performance. The metrics covered are quarterly sales, deals won, expired contracts, revenue, conversion rates, etc.
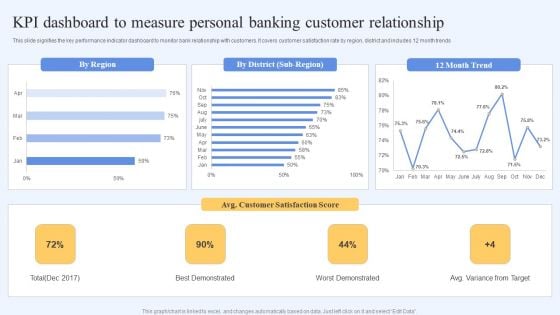
Kpi Dashboard To Measure Personal Banking Customer Relationship Themes PDF
This slide signifies the key performance indicator dashboard to monitor bank relationship with customers. It covers customer satisfaction rate by region, district and includes 12 month trends. Pitch your topic with ease and precision using this Kpi Dashboard To Measure Personal Banking Customer Relationship Themes PDF. This layout presents information on Customer Satisfaction, Best Demonstrated, Worst Demonstrated. It is also available for immediate download and adjustment. So, changes can be made in the color, design, graphics or any other component to create a unique layout.
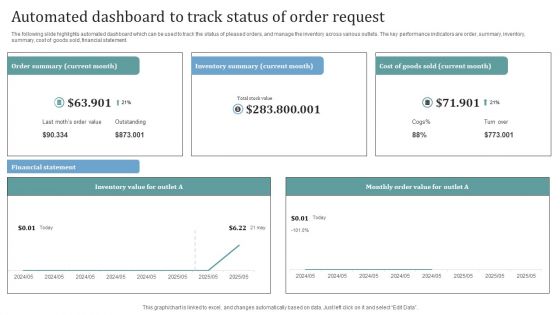
Automated Dashboard To Track Status Of Order Request Themes PDF
The following slide highlights automated dashboard which can be used to track the status of pleased orders, and manage the inventory across various outlets. The key performance indicators are order, summary, inventory, summary, cost of goods sold, financial statement. Showcasing this set of slides titled Automated Dashboard To Track Status Of Order Request Themes PDF. The topics addressed in these templates are Inventory Value, Inventory Summary, Cost. All the content presented in this PPT design is completely editable. Download it and make adjustments in color, background, font etc. as per your unique business setting.
Dashboard For Tracking Green Financing Activities Themes PDF
This slide presents a finance dashboard to track the progress of sustainability activities based on finance allocations. The key performing indicators are overall progress, energy usage by month, budget allocation and application etc. Showcasing this set of slides titled Dashboard For Tracking Green Financing Activities Themes PDF. The topics addressed in these templates are Activities, Application, Dashboard. All the content presented in this PPT design is completely editable. Download it and make adjustments in color, background, font etc. as per your unique business setting.
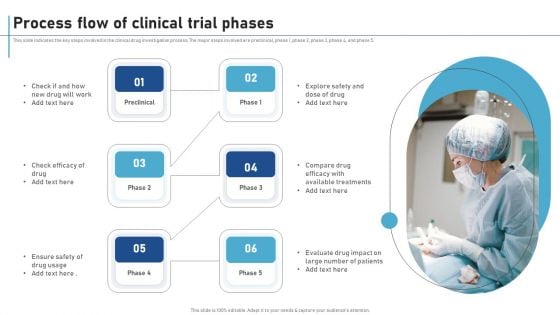
Process Flow Of Clinical Trial Phases New Clinical Drug Trial Process Introduction PDF
This slide indicates the key steps involved in the clinical drug investigation process. The major steps involved are preclinical, phase 1, phase 2, phase 3, phase 4, and phase 5. Welcome to our selection of the Process Flow Of Clinical Trial Phases New Clinical Drug Trial Process Introduction PDF. These are designed to help you showcase your creativity and bring your sphere to life. Planning and Innovation are essential for any business that is just starting out. This collection contains the designs that you need for your everyday presentations. All of our PowerPoints are 100 percent editable, so you can customize them to suit your needs. This multi-purpose template can be used in various situations. Grab these presentation templates today.
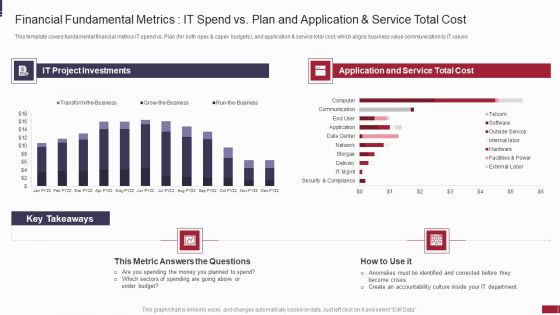
IT Value Story Significant To Corporate Leadership Financial Fundamental Metrics Diagrams PDF
These indicators assist IT leaders in stewarding technology expenditures and investments, and they are essential to managing the IT company. These measures aid in the management of the departments financial health and may indicate levers for cost reduction, improved resource allocation, and enhanced accountability. Deliver and pitch your topic in the best possible manner with this it value story significant to corporate leadership financial fundamental metrics diagrams pdf. Use them to share invaluable insights on organizations, budget, metric, cost and impress your audience. This template can be altered and modified as per your expectations. So, grab it now.
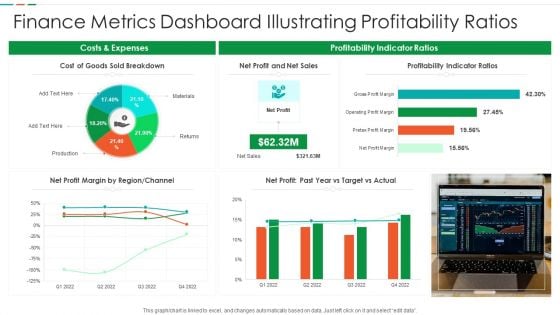
Finance Metrics Dashboard Illustrating Profitability Ratios Diagrams PDF
This graph or chart is linked to excel, and changes automatically based on data. Just left click on it and select edit data. Pitch your topic with ease and precision using this Finance Metrics Dashboard Illustrating Profitability Ratios Diagrams PDF. This layout presents information on Cost Goods Sold, Net Profit Net, Sales Profitability Indicator. It is also available for immediate download and adjustment. So, changes can be made in the color, design, graphics or any other component to create a unique layout.
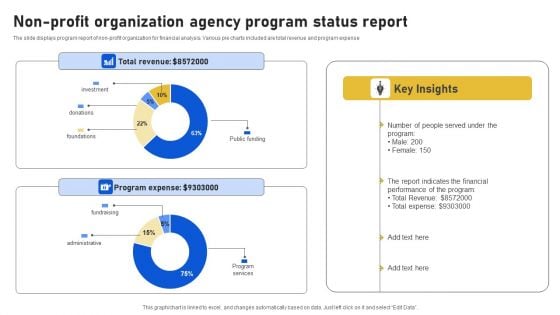
Non-Profit Organization Agency Program Status Report Diagrams PDF
The slide displays program report of non-profit organization for financial analysis. Various pie charts included are total revenue and program expense. Showcasing this set of slides titled Non-Profit Organization Agency Program Status Report Diagrams PDF. The topics addressed in these templates are Total Revenue, Program Expense, Report Indicates. All the content presented in this PPT design is completely editable. Download it and make adjustments in color, background, font etc. as per your unique business setting.
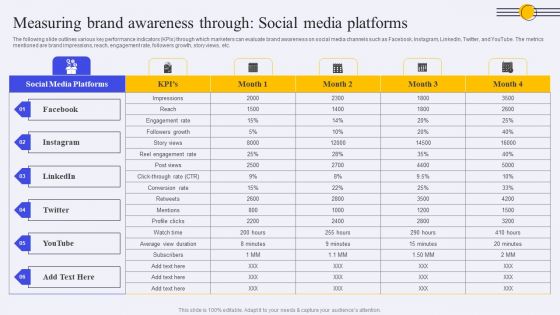
Measuring Brand Awareness Through Social Media Platforms Ppt PowerPoint Presentation Diagram Graph Charts PDF
The following slide outlines various key performance indicators KPIs through which marketers can evaluate brand awareness on social media channels such as Facebook, Instagram, LinkedIn, Twitter, and YouTube. The metrics mentioned are brand impressions, reach, engagement rate, followers growth, story views, etc. The best PPT templates are a great way to save time, energy, and resources. Slidegeeks have 100 percent editable powerpoint slides making them incredibly versatile. With these quality presentation templates, you can create a captivating and memorable presentation by combining visually appealing slides and effectively communicating your message. Download Measuring Brand Awareness Through Social Media Platforms Ppt PowerPoint Presentation Diagram Graph Charts PDF from Slidegeeks and deliver a wonderful presentation.

Restaurant Employees Training Analysis Dashboard Diagrams PDF
This slide shows dashboard that monitor and provide training employee information and actionable insights. It contains various indicators such as number of participants, hours of training, subject, occupancy rate, budget and cost of training. Showcasing this set of slides titled Restaurant Employees Training Analysis Dashboard Diagrams PDF. The topics addressed in these templates are Participant Training Type, Training Subject Matter, Hours Of Training Target. All the content presented in this PPT design is completely editable. Download it and make adjustments in color, background, font etc. as per your unique business setting.

Commercial Marketing KPI With Return On Investment Diagrams PDF
This slide templates covers about trade marketing key performing indicators with website visitors, leads by channel, social media reach with yearly goal achievement.Pitch your topic with ease and precision using this Commercial Marketing KPI With Return On Investment Diagrams PDF. This layout presents information on Marketing Spend, Return Investment, Budget Remaining. It is also available for immediate download and adjustment. So, changes can be made in the color, design, graphics or any other component to create a unique layout.

Evaluating Projected Vs Actual Sales Performance Diagrams PDF
The following slide depicts the evaluation of existing sales performance to set future standards and determine opportunities for improvement. It mainly includes key performance indicators KPIs such as pipeline, forecast, attainment, gap etc. There are so many reasons you need a Evaluating Projected Vs Actual Sales Performance Diagrams PDF. The first reason is you can not spend time making everything from scratch, Thus, Slidegeeks has made presentation templates for you too. You can easily download these templates from our website easily.
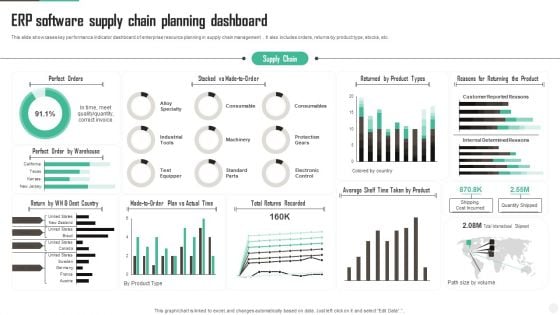
ERP Software Supply Chain Planning Dashboard Diagrams PDF
This slide showcases key performance indicator dashboard of enterprise resource planning in supply chain management . It also includes orders, returns by product type, stocks, etc. Showcasing this set of slides titled ERP Software Supply Chain Planning Dashboard Diagrams PDF Sample. The topics addressed in these templates are Perfect Orders, Dest Country, Actual Time. All the content presented in this PPT design is completely editable. Download it and make adjustments in color, background, font etc. as per your unique business setting.
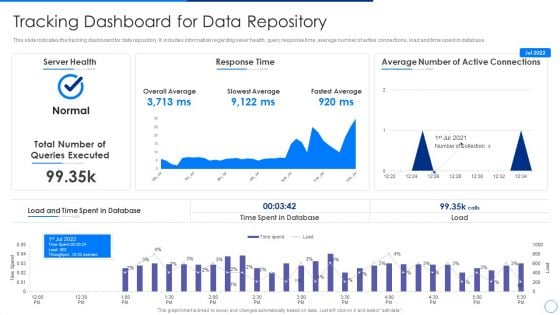
Scale Up Plan For Data Inventory Model Tracking Dashboard For Data Repository Themes PDF
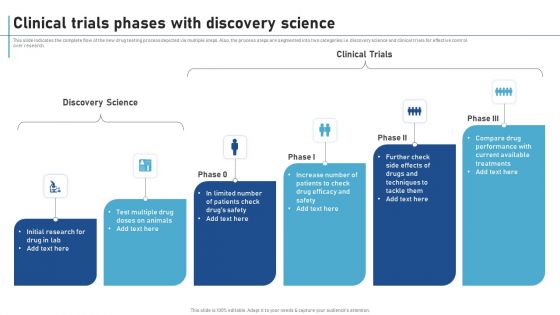
Clinical Trials Phases With Discovery Science New Clinical Drug Trial Process Pictures PDF
This slide indicates the complete flow of the new drug testing process depicted via multiple steps. Also, the process steps are segmented into two categories i.e. discovery science and clinical trials for effective control over research. Slidegeeks is here to make your presentations a breeze with Clinical Trials Phases With Discovery Science New Clinical Drug Trial Process Pictures PDF With our easy-to-use and customizable templates, you can focus on delivering your ideas rather than worrying about formatting. With a variety of designs to choose from, you are sure to find one that suits your needs. And with animations and unique photos, illustrations, and fonts, you can make your presentation pop. So whether you are giving a sales pitch or presenting to the board, make sure to check out Slidegeeks first.

Santa House Signpost Holidays PowerPoint Themes And PowerPoint Slides 0811
Microsoft PowerPoint Theme and Slide with wooden signpost with santa's hat indicating santa's house with snow Spice up the discourse with our Santa House Signpost Holidays PowerPoint Themes And PowerPoint Slides 0811. Strengthen the flavour of your thoughts.

Solutions Business PowerPoint Themes And PowerPoint Slides 0811
Microsoft PowerPoint Theme and Slide with metal signpost indicating three solutions Be prepared for every eventuality. Plan your defences with our Solutions Business PowerPoint Themes And PowerPoint Slides 0811.
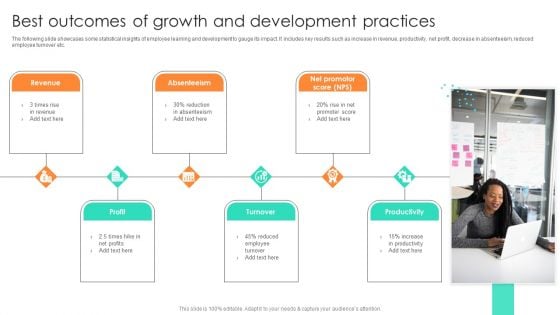
Best Outcomes Of Growth And Development Practices Template PDF
The following slide showcases some statistical insights of employee learning and development to gauge its impact. It includes key results such as increase in revenue, productivity, net profit, decrease in absenteeism, reduced employee turnover etc. Presenting Best Outcomes Of Growth And Development Practices Template PDF to dispense important information. This template comprises six stages. It also presents valuable insights into the topics including Revenue, Absenteeism, Profit. This is a completely customizable PowerPoint theme that can be put to use immediately. So, download it and address the topic impactfully.

Solution Signpost Business PowerPoint Templates And PowerPoint Themes 0312
Microsoft Powerpoint Templates and Background with metal signpost indicating three solutions Consultour Solution Signpost Business PowerPoint Templates And PowerPoint Themes 0312 for any advice. Get answers that are ethical and actionable.

Success Teamwork Signpost Metaphor PowerPoint Templates And PowerPoint Themes 0412
Microsoft Powerpoint Templates and Background with metal signpost indicating three solutions Maintain the continuity of your thoughts. Our Success Teamwork Signpost Metaphor PowerPoint Templates And PowerPoint Themes 0412 will be the fillers.

Success Signpost Metaphor PowerPoint Templates And PowerPoint Themes 0412
Microsoft Powerpoint Templates and Background with pole indicating success Play your cards well with our Success Signpost Metaphor PowerPoint Templates And PowerPoint Themes 0412. Give your thoughts a good deal.

Solution Signpost Business PowerPoint Templates And PowerPoint Themes 0412
Microsoft Powerpoint Templates and Background with metal signpost indicating three solutions Use any of the facets our Solution Signpost Business PowerPoint Templates And PowerPoint Themes 0412 offer. They rank really high on employability.

Solutions Signpost Metaphor PowerPoint Templates And PowerPoint Themes 0512
Microsoft Powerpoint Templates and Background with metal signpost indicating three solutions Bring on the heat with our Solutions Signpost Metaphor PowerPoint Templates And PowerPoint Themes 0512. All your doubts will begin to evaporate.

Break Time PowerPoint Templates And PowerPoint Themes 1012
Break Time PowerPoint Templates And PowerPoint Themes 1012-Microsoft Powerpoint Templates and Background with break time to indicate the clock-Break Time PowerPoint Templates And PowerPoint Themes 1012-This PowerPoint template can be used for presentations relating to-Break time to indicate the clock, business, communication, food, clocks, holidays Our Break Time PowerPoint Templates And PowerPoint Themes 1012 add it all up. Count on them to deliver the numbers.

Business Diagram Two Different Nuclear Warning Sign Boards Presentation Template
This PowerPoint template has been designed with graphic of two warning sign for danger indication. The importance of safety in the work place can be defined with this diagram. This slide may be used to represent nuclear safety and danger indication topics.

Performance Management Models Diagram Powerpoint Layout
This is a performance management models diagram powerpoint layout. This is a six stage process. The stages in this process are mission, strategic goals, strategic priorities, performance indicators, performance targets, performance results, execution, planning.
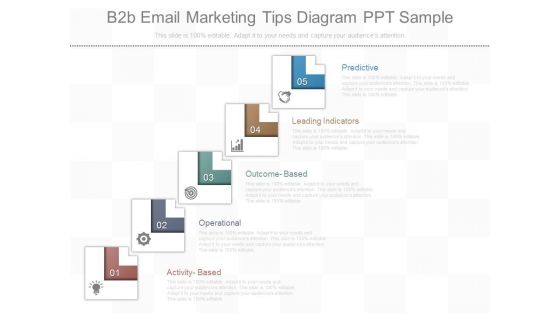
B2b Email Marketing Tips Diagram Ppt Sample
This is a b2b email marketing tips diagram ppt sample. This is a five stage process. The stages in this process are predictive, leading indicators, outcome based, operational, activity based.
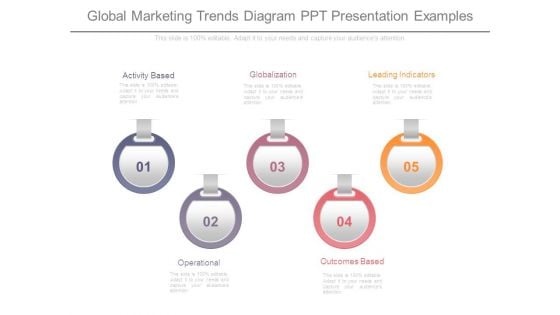
Global Marketing Trends Diagram Ppt Presentation Examples
This is a global marketing trends diagram ppt presentation examples. This is a five stage process. The stages in this process are activity based, globalization, leading indicators, outcomes based, operational.
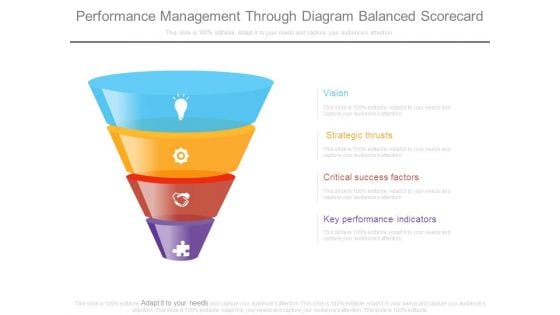
Performance Management Through Diagram Balanced Scorecard
This is a performance management through diagram balanced scorecard. This is a four stage process. The stages in this process are vision, strategic thrusts, critical success factors, key performance indicators.
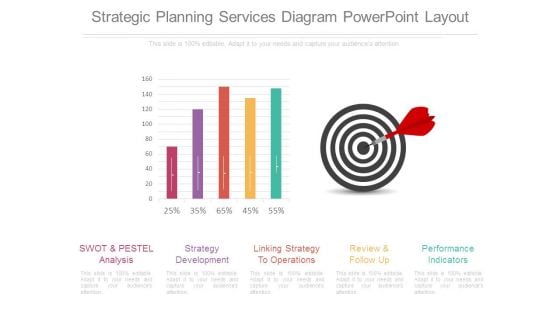
Strategic Planning Services Diagram Powerpoint Layout
This is a strategic planning services diagram powerpoint layout. This is a five stage process. The stages in this process are swot and pestel analysis, strategy development, linking strategy to operations, review and follow up, performance indicators.
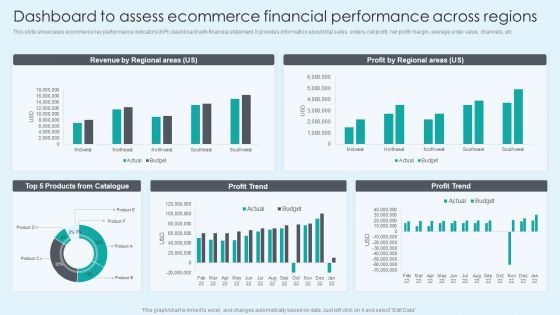
Dashboard To Assess Ecommerce Financial Performance Across Regions Themes PDF
This slide showcases ecommerce key performance indicators KPI dashboard with financial statement. It provides information about total sales, orders, net profit, net profit margin, average order value, channels, etc. Here you can discover an assortment of the finest PowerPoint and Google Slides templates. With these templates, you can create presentations for a variety of purposes while simultaneously providing your audience with an eye catching visual experience. Download Dashboard To Assess Ecommerce Financial Performance Across Regions Themes PDF to deliver an impeccable presentation. These templates will make your job of preparing presentations much quicker, yet still, maintain a high level of quality. Slidegeeks has experienced researchers who prepare these templates and write high quality content for you. Later on, you can personalize the content by editing the Dashboard To Assess Ecommerce Financial Performance Across Regions Themes PDF.
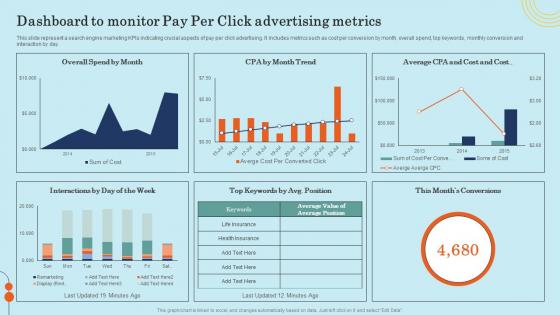
Dashboard To Monitor Pay Per Click Advertising Metrics Effective General Insurance Marketing Themes Pdf
This slide represent a search engine marketing KPIs indicating crucial aspects of pay per click advertising. It includes metrics such as cost per conversion by month, overall spend, top keywords, monthly conversion and interaction by day. Do you have to make sure that everyone on your team knows about any specific topic I yes, then you should give Dashboard To Monitor Pay Per Click Advertising Metrics Effective General Insurance Marketing Themes Pdf a try. Our experts have put a lot of knowledge and effort into creating this impeccable Dashboard To Monitor Pay Per Click Advertising Metrics Effective General Insurance Marketing Themes Pdf. You can use this template for your upcoming presentations, as the slides are perfect to represent even the tiniest detail. You can download these templates from the Slidegeeks website and these are easy to edit. So grab these today. This slide represent a search engine marketing KPIs indicating crucial aspects of pay per click advertising. It includes metrics such as cost per conversion by month, overall spend, top keywords, monthly conversion and interaction by day.
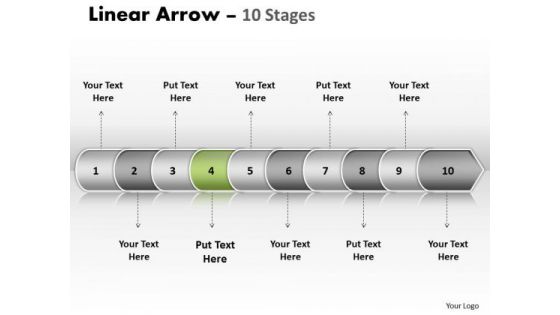
Usa Ppt Background Linear Arrow 10 State PowerPoint Project Diagram 5 Image
USA PPT Background linear arrow 10 state powerpoint project diagram 5 Image-Use this diagram to emphasize the process of your corporate growth. Highlight your ideas broad- based on strong fundamentals and illustrate how they step by step achieve the set growth factor.-USA PPT Background linear arrow 10 state powerpoint project diagram 5 Image-Arrow, Background, Collection, Completed, Concept, Confirmation, Design, Flow, Graph, Graphic, Illustration, Indication, Indicator, Information, Instruction, Interface, Internet, Layout, Measurement, Order, Phase, Pointer, Process, Progress, Reflection, Scale, Shape, Sign When in doubt fall back on our Usa Ppt Background Linear Arrow 10 State PowerPoint Project Diagram 5 Image. All your apprehensions will fall away.
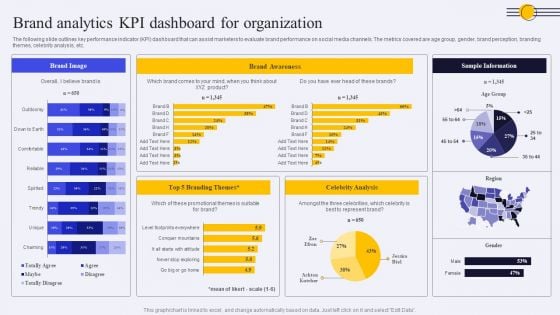
Brand Analytics KPI Dashboard For Organization Ppt PowerPoint Presentation Diagram PDF
The following slide outlines key performance indicator KPI dashboard that can assist marketers to evaluate brand performance on social media channels. The metrics covered are age group, gender, brand perception, branding themes, celebrity analysis, etc. Take your projects to the next level with our ultimate collection of Brand Analytics KPI Dashboard For Organization Ppt PowerPoint Presentation Diagram PDF. Slidegeeks has designed a range of layouts that are perfect for representing task or activity duration, keeping track of all your deadlines at a glance. Tailor these designs to your exact needs and give them a truly corporate look with your own brand colors they will make your projects stand out from the rest.
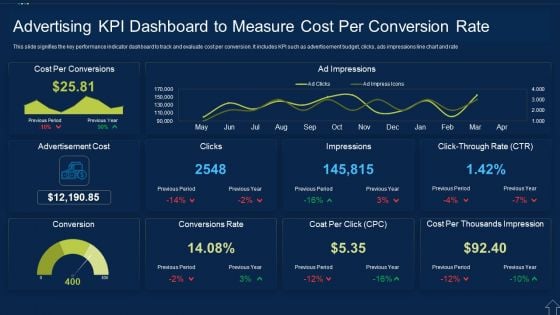
Advertising KPI Dashboard To Measure Cost Per Conversion Rate Themes PDF
This slide signifies the key performance indicator dashboard to track and evaluate cost per conversion. It includes KPI such as advertisement budget, clicks, ads impressions line chart and rate Showcasing this set of slides titled Advertising KPI Dashboard To Measure Cost Per Conversion Rate Themes PDF The topics addressed in these templates are Advertising Kpi Dashboard To Measure Cost Per Conversion Rate All the content presented in this PPT design is completely editable. Download it and make adjustments in color, background, font etc. as per your unique business setting.
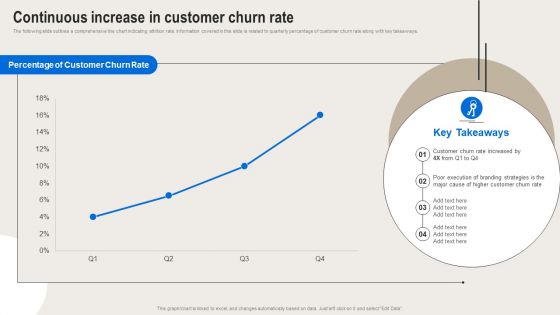
Formulating Branding Strategy To Enhance Revenue And Sales Continuous Increase In Customer Churn Rate Themes PDF
The following slide outlines a comprehensive line chart indicating attrition rate. Information covered in this slide is related to quarterly percentage of customer churn rate along with key takeaways. Boost your pitch with our creative Formulating Branding Strategy To Enhance Revenue And Sales Continuous Increase In Customer Churn Rate Themes PDF. Deliver an awe-inspiring pitch that will mesmerize everyone. Using these presentation templates you will surely catch everyones attention. You can browse the ppts collection on our website. We have researchers who are experts at creating the right content for the templates. So you do not have to invest time in any additional work. Just grab the template now and use them.
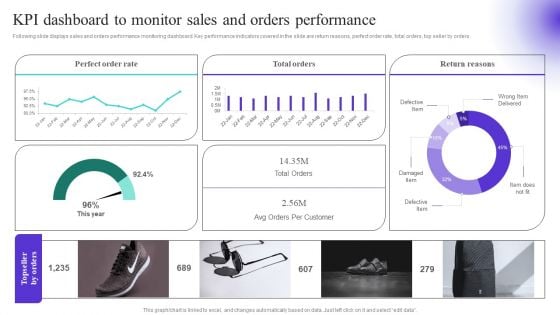
KPI Dashboard To Monitor Sales And Orders Performance Diagrams PDF
Following slide displays sales and orders performance monitoring dashboard. Key performance indicators covered in the slide are return reasons, perfect order rate, total orders, top seller by orders. Create an editable KPI Dashboard To Monitor Sales And Orders Performance Diagrams PDF that communicates your idea and engages your audience. Whether you are presenting a business or an educational presentation, pre designed presentation templates help save time. KPI Dashboard To Monitor Sales And Orders Performance Diagrams PDF is highly customizable and very easy to edit, covering many different styles from creative to business presentations. Slidegeeks has creative team members who have crafted amazing templates. So, go and get them without any delay.
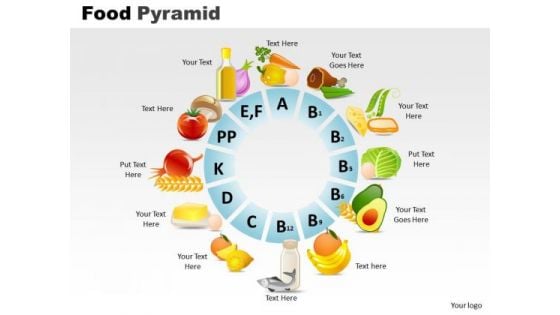
PowerPoint Slides Food Pyramid Editable Ppt Themes
PowerPoint Slides Food Pyramid Editable PPT Themes-A chart indicates various foods filling capacity and nutrition level in an amazing way to inspire people to adopt balance diet-Illustration, balanced, bar, bread, bun, butter, cake, calorie, calories, candy, carbohydrates, cereals, cheese, dairy, diet, egg, fats, fish, food, fresh, fruits, grains, guide, healthy, isolated, market, meat, nutritious, oil, outline, proteins, pyramid, shape, vector, vectors, vegetables-PowerPoint Slides Food Pyramid Editable PPT Themes Ascertain goals with our PowerPoint Slides Food Pyramid Editable Ppt Themes. Download without worries with our money back guaranteee.
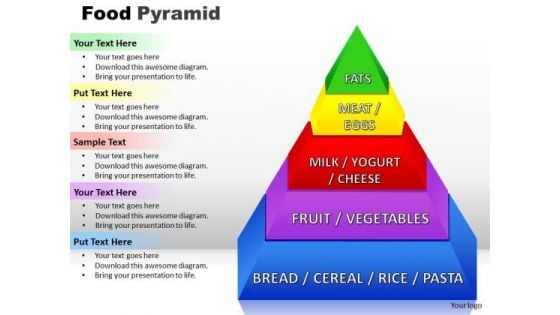
PowerPoint Templates Food Pyramid Growth Ppt Theme
PowerPoint Templates Food Pyramid Growth PPT Theme-This chart indicates various foods filling capacity and nutrition level in an amazing way to inspire people to adopt balance diet.-Illustration, balanced, bar, bread, bun, butter, cake, calorie, calories, candy, carbohydrates, cereals, cheese, dairy, diet, egg, fats, fish, food, fresh, fruits, grains, guide, healthy, isolated, market, meat, nutritious, oil, outline, proteins, pyramid, shape, vector, vectors, vegetables-PowerPoint Templates Food Pyramid Growth PPT Theme Our PowerPoint Templates Food Pyramid Growth Ppt Theme give you the correct feel. Connect with your audience in a convincing way.
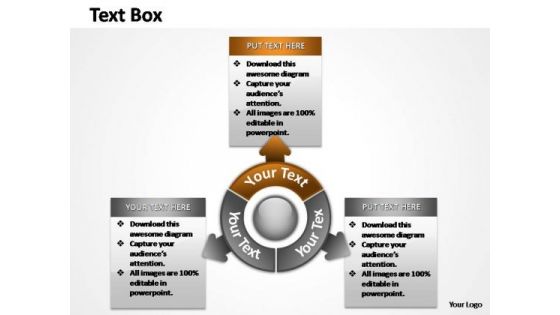
PowerPoint Slide Layout Strategy Steps Ppt Slide Designs
Arrows Indicates the way to growth. Use this diagram for improved controls to drive your business towards the right direction Complete the circle with our PowerPoint Slide Layout Strategy Steps Ppt Slide Designs. Explore every direction with your thoughts.
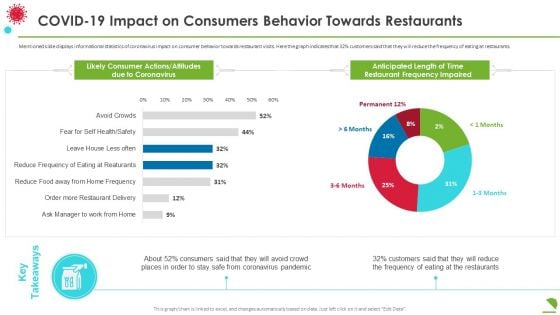
Covid19 Impact On Consumers Behavior Towards Restaurants Diagrams PDF
Mentioned slide displays informational statistics of coronavirus impact on consumer behavior towards restaurant visits. Here the graph indicates that 32 percentage customers said that they will reduce the frequency of eating at restaurants. Deliver an awe inspiring pitch with this creative covid19 impact on consumers behavior towards restaurants diagrams pdf bundle. Topics like covid 19 impact on consumers behavior towards restaurants can be discussed with this completely editable template. It is available for immediate download depending on the needs and requirements of the user.
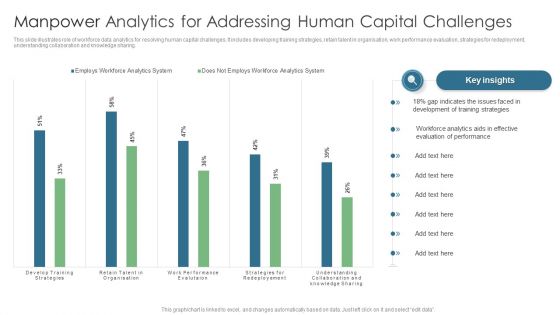
Manpower Analytics For Addressing Human Capital Challenges Diagrams PDF
This slide illustrates role of workforce data analytics for resolving human capital challenges. It includes developing training strategies, retain talent in organisation, work performance evaluation, strategies for redeployment, understanding collaboration and knowledge sharing. Showcasing this set of slides titled Manpower Analytics For Addressing Human Capital Challenges Diagrams PDF. The topics addressed in these templates are Gap Indicates, Training Strategies, Evaluation Performance. All the content presented in this PPT design is completely editable. Download it and make adjustments in color, background, font etc. as per your unique business setting.
Executive Dashboards For Tracking Financial Health Of Enterprise Diagrams PDF
This slide represents the CEO dashboard to track the financial health of an organization. It includes key performance indicators such as revenue, expenses, activity ratio, gross profit margin, EBIT etc. Pitch your topic with ease and precision using this Executive Dashboards For Tracking Financial Health Of Enterprise Diagrams PDF. This layout presents information on Revenue, Expense, Activity Ratio. It is also available for immediate download and adjustment. So, changes can be made in the color, design, graphics or any other component to create a unique layout.
Multi Cloud Infrastructure Management Cloud Performance Tracking Dashboard Diagrams PDF
This slide covers the Key performance indicators for tracking performance of the cloud such as violations break down, sources, rules and severity. From laying roadmaps to briefing everything in detail, our templates are perfect for you. You can set the stage with your presentation slides. All you have to do is download these easy-to-edit and customizable templates. Multi Cloud Infrastructure Management Cloud Performance Tracking Dashboard Diagrams PDF will help you deliver an outstanding performance that everyone would remember and praise you for. Do download this presentation today.
Plan Dashboard For Tracking Location Wise Revenue Diagrams PDF
This slide presents a dashboard which will assist managers to track the revenue of each branch having geographical presence in different corners of the world. The key performance indicators are total revenue, location wise rent, branch performance among many others.Pitch your topic with ease and precision using this Plan Dashboard For Tracking Location Wise Revenue Diagrams PDF. This layout presents information on Taxes Paid, Current Month, Branch Performance, Previous Quarter. It is also available for immediate download and adjustment. So, changes can be made in the color, design, graphics or any other component to create a unique layout.
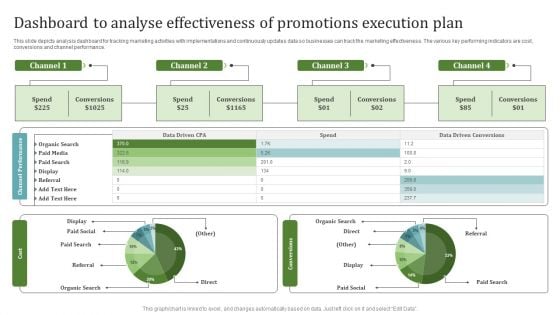
Dashboard To Analyse Effectiveness Of Promotions Execution Plan Diagrams PDF
This slide depicts analysis dashboard for tracking marketing activities with implementations and continuously updates data so businesses can track the marketing effectiveness. The various key performing indicators are cost, conversions and channel performance. Showcasing this set of slides titled Dashboard To Analyse Effectiveness Of Promotions Execution Plan Diagrams PDF. The topics addressed in these templates are Channel Performance, Cost, Conversions. All the content presented in this PPT design is completely editable. Download it and make adjustments in color, background, font etc. as per your unique business setting.
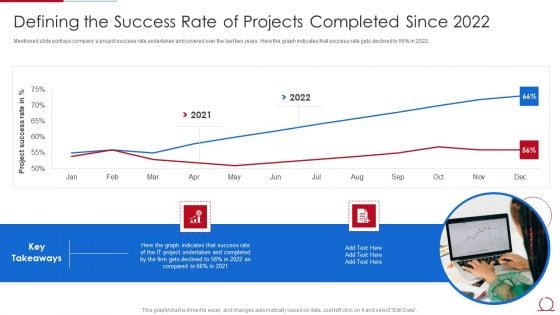
Quality Assurance Model For Agile IT Defining The Success Rate Of Projects Completed Themes PDF
Mentioned slide portrays companys project success rate undertaken and covered over the last two years. Here the graph indicates that success rate gets declined to 56 percent in 2022. Deliver an awe inspiring pitch with this creative quality assurance model for agile it defining the success rate of projects completed themes pdf bundle. Topics like success rate, it project, 2021 to 2022 can be discussed with this completely editable template. It is available for immediate download depending on the needs and requirements of the user.

Quality Assurance Model For Agile IT Forecasted Impact Of Adopting Agile Model Themes PDF
Mentioned slide portrays forecasted companys project success rate after adopting agile mode. Here the graph indicates that success rate will get increased to 73 percent in 2023. Deliver and pitch your topic in the best possible manner with this quality assurance model for agile it forecasted impact of adopting agile model themes pdf. Use them to share invaluable insights on success rate, it project, 2022 to 2023 and impress your audience. This template can be altered and modified as per your expectations. So, grab it now.
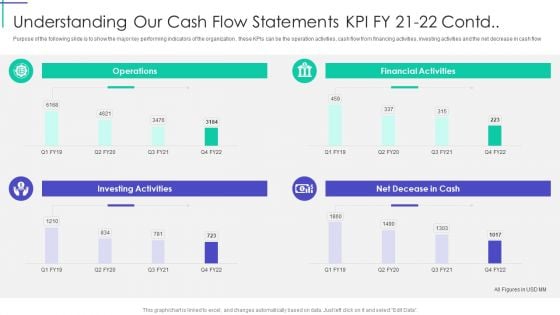
Understanding Our Cash Flow Statements KPI Fy 21 To 22 Contd Themes PDF
Purpose of the following slide is to show the major key performing indicators of the organization , these KPIs can be the operation activities, cash flow from financing activities, investing activities and the net decrease in cash flow Deliver and pitch your topic in the best possible manner with this Understanding Our Cash Flow Statements KPI Fy 21 To 22 Contd Themes PDF. Use them to share invaluable insights on Investing Activities, Financial Activities, Operations and impress your audience. This template can be altered and modified as per your expectations. So, grab it now.
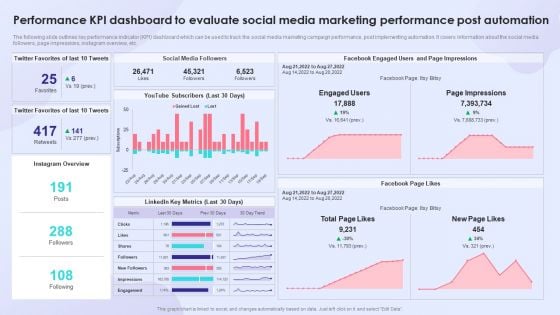
Performance KPI Dashboard To Evaluate Social Media Marketing Performance Post Automation Themes PDF
The following slide outlines key performance indicator KPI dashboard which can be used to track the social media marketing campaign performance, post implementing automation. It covers information about the social media followers, page impressions, instagram overview, etc. Deliver and pitch your topic in the best possible manner with this Performance KPI Dashboard To Evaluate Social Media Marketing Performance Post Automation Themes PDF. Use them to share invaluable insights on Social Media Followers, Linkedin Key Metrics, Performance KPI Dashboard and impress your audience. This template can be altered and modified as per your expectations. So, grab it now.
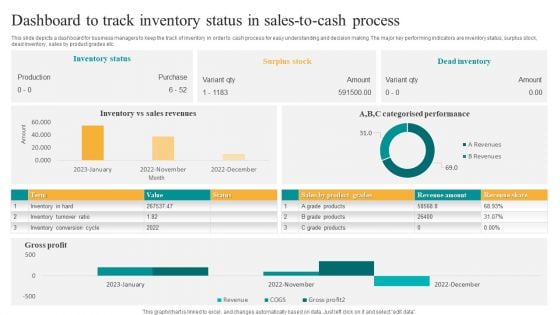
Dashboard To Track Inventory Status In Sales To Cash Process Themes PDF
This slide depicts a dashboard for business managers to keep the track of inventory in order to cash process for easy understanding and decision making. The major key performing indicators are inventory status, surplus stock, dead inventory, sales by product grades etc. Showcasing this set of slides titled Dashboard To Track Inventory Status In Sales To Cash Process Themes PDF. The topics addressed in these templates are Inventory Status, Surplus Stock, Dead Inventory. All the content presented in this PPT design is completely editable. Download it and make adjustments in color, background, font etc. as per your unique business setting.
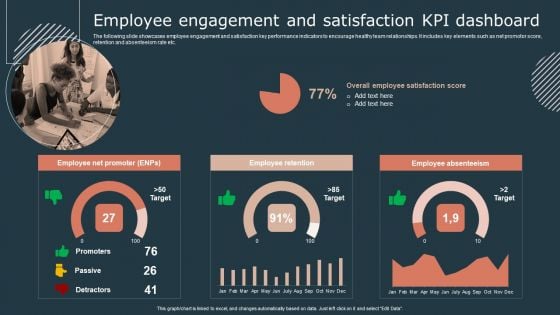
Effective Workforce Participation Action Planning Employee Engagement And Satisfaction Kpi Dashboard Themes PDF
The following slide showcases employee engagement and satisfaction key performance indicators to encourage healthy team relationships. It includes key elements such as net promotor score, retention and absenteeism rate etc. From laying roadmaps to briefing everything in detail, our templates are perfect for you. You can set the stage with your presentation slides. All you have to do is download these easy to edit and customizable templates. Effective Workforce Participation Action Planning Employee Engagement And Satisfaction Kpi Dashboard Themes PDF will help you deliver an outstanding performance that everyone would remember and praise you for. Do download this presentation today.
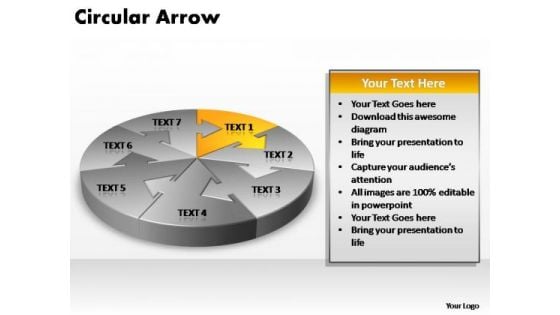
PowerPoint Template Chart Circular Arrow Ppt Slide Designs
PowerPoint Template Chart Circular Arrow PPT Slide Designs-The arrows indicate the progression of the process. Constant monitoring of the processes provides you with opportunities to concentrate on the core competencies in your business and improve the standards for more effective results.-PowerPoint Template Chart Circular Arrow PPT Slide Designs Our PowerPoint Template Chart Circular Arrow Ppt Slide Designs will be a feather in your cap. They will add to your enduring charm.
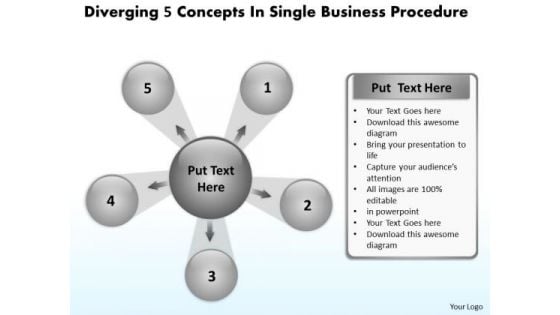
World Business PowerPoint Templates Procedure Cycle Layout Diagram
We present our world business powerpoint templates procedure Cycle Layout Diagram.Download and present our Leadership PowerPoint Templates because you know Coincidentally it will always point to the top. Use our Arrows PowerPoint Templates because this slide can help to bullet point your views. Present our Process and Flows PowerPoint Templates because they are the indicators of the path you have in mind. Download and present our Business PowerPoint Templates because the fruits of your labour are beginning to show.Enlighten them on the great plans you have for their enjoyment. Present our Circle Charts PowerPoint Templates because knowledge is power goes the popular saying.Use these PowerPoint slides for presentations relating to Arrows, Business, Chart, Circle, Company, Concept, Continuity, Continuous, Cycle, Dependency, Diagram, Direction, Dynamic, Endless, Feeds, Graph, Iteration, Iterative, Method, Path, Phase, Presentation, Process, Production, Progress, Progression, Report, Rotation, Sequence, Succession, Vector. The prominent colors used in the PowerPoint template are White, Gray, Black. Customers tell us our world business powerpoint templates procedure Cycle Layout Diagram will get their audience's attention. PowerPoint presentation experts tell us our Cycle PowerPoint templates and PPT Slides are Efficacious. We assure you our world business powerpoint templates procedure Cycle Layout Diagram are Spectacular. Customers tell us our Cycle PowerPoint templates and PPT Slides are Stylish. We assure you our world business powerpoint templates procedure Cycle Layout Diagram are Fantastic. People tell us our Chart PowerPoint templates and PPT Slides provide great value for your money. Be assured of finding the best projection to highlight your words. Let your thoughts exert some pressure. Our World Business PowerPoint Templates Procedure Cycle Layout Diagram will do the deed.
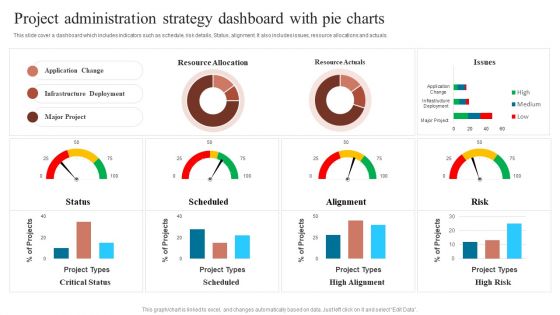
Project Administration Strategy Dashboard With Pie Charts Sample PDF
This slide cover a dashboard which includes indicators such as schedule, risk details, Status, alignment. It also includes issues, resource allocations and actuals. Pitch your topic with ease and precision using this Project Administration Strategy Dashboard With Pie Charts Sample PDF. This layout presents information on Communication Goal, Communication Tool, Increase Revenue. It is also available for immediate download and adjustment. So, changes can be made in the color, design, graphics or any other component to create a unique layout.
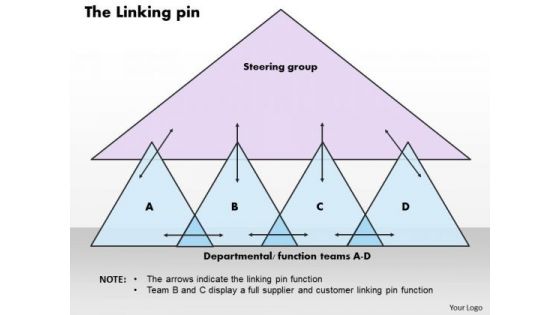
Business Framework The Linking Pin PowerPoint Presentation
This diagram displays framework for the linking pin. It contains diagram of linking triangles. This template is perfect for presentations on the linking pin, steering group, departmental function teams a d, note, the arrows indicate the linking pin function, and team b and c display a full supplier and customer linking pin function.
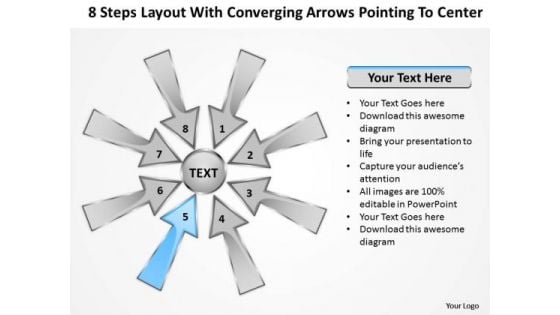
Steps Layout With Converging Arrows Pointing To Center Charts And Diagrams PowerPoint Slides
We present our steps layout with converging arrows pointing to center Charts and Diagrams PowerPoint Slides.Present our Arrows PowerPoint Templates because it focuses the light on the path to sure shot success. Download and present our Circle Charts PowerPoint Templates because you have a good idea of the roadmap to your desired destination. Download and present our Shapes PowerPoint Templates because this diagram provides trainers a tool to teach the procedure in a highly visual, engaging way. Present our Business PowerPoint Templates because it enlightens your team and colleagues on the critical factors involved. Present our Flow Charts PowerPoint Templates because it outlines the process with this innovative graphic to authenticate your plan of achieving the goal of added value/profit.Use these PowerPoint slides for presentations relating to 3d, abstract, all, around, arrow, aspect, attention, attract, blue, center, collect, colorful, conceptual, converge, course, cutout, direct, direction, factor, gather, globalization, go, green, guide, illustration, indicate, integration, isolated, location, many, movement, point, pointer, rainbow, reach, red, round, show, sides, sign, source, sphere, strategy, summon, symbol, target, unity, way, white, yellow. The prominent colors used in the PowerPoint template are Blue, Gray, Black. Presenters tell us our steps layout with converging arrows pointing to center Charts and Diagrams PowerPoint Slides are Royal. The feedback we get is that our aspect PowerPoint templates and PPT Slides are Clever. Presenters tell us our steps layout with converging arrows pointing to center Charts and Diagrams PowerPoint Slides are designed to make your presentations professional. You can be sure our attention PowerPoint templates and PPT Slides are Spectacular. People tell us our steps layout with converging arrows pointing to center Charts and Diagrams PowerPoint Slides are Ultra. PowerPoint presentation experts tell us our attract PowerPoint templates and PPT Slides are Endearing. Monitor plans with our Steps Layout With Converging Arrows Pointing To Center Charts And Diagrams PowerPoint Slides. Download without worries with our money back guaranteee.
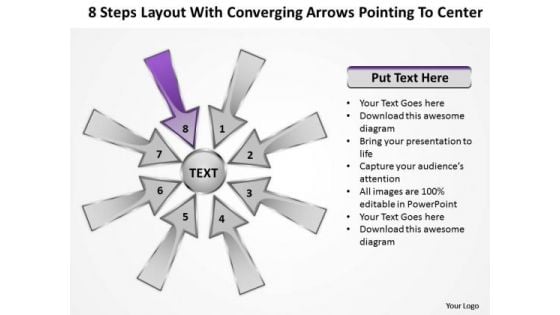
Steps Layout With Converging Arrow Pointing To Center Ppt Charts And Diagrams PowerPoint Slides
We present our steps layout with converging arrow pointing to center ppt Charts and Diagrams PowerPoint Slides.Present our Arrows PowerPoint Templates because Our PowerPoint Templates and Slides are the chords of your song. String them along and provide the lilt to your views. Use our Circle Charts PowerPoint Templates because you have a clear vision of the cake you want. Download our Shapes PowerPoint Templates because they will help you to organise the logic of your views. Present our Business PowerPoint Templates because you are ready to flap your wings and launch off. All poised are you to touch the sky with glory. Use our Flow Charts PowerPoint Templates because you are ready to flap your wings and launch off. All poised are you to touch the sky with glory.Use these PowerPoint slides for presentations relating to 3d, abstract, all, around, arrow, aspect, attention, attract, blue, center, collect, colorful, conceptual, converge, course, cutout, direct, direction, factor, gather, globalization, go, green, guide, illustration, indicate, integration, isolated, location, many, movement, point, pointer, rainbow, reach, red, round, show, sides, sign, source, sphere, strategy, summon, symbol, target, unity, way, white, yellow. The prominent colors used in the PowerPoint template are Purple, Gray, Black. Presenters tell us our steps layout with converging arrow pointing to center ppt Charts and Diagrams PowerPoint Slides are Chic. The feedback we get is that our all PowerPoint templates and PPT Slides are Swanky. Presenters tell us our steps layout with converging arrow pointing to center ppt Charts and Diagrams PowerPoint Slides are Pretty. You can be sure our aspect PowerPoint templates and PPT Slides are incredible easy to use. People tell us our steps layout with converging arrow pointing to center ppt Charts and Diagrams PowerPoint Slides are Graceful. PowerPoint presentation experts tell us our aspect PowerPoint templates and PPT Slides are Charming. Analyse the figures with our Steps Layout With Converging Arrow Pointing To Center Ppt Charts And Diagrams PowerPoint Slides. You will find answers emerging.


 Continue with Email

 Home
Home


