Meter Icon
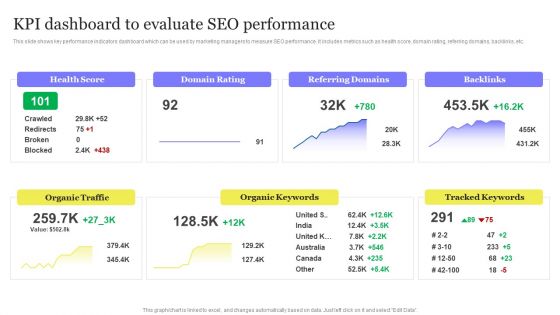
Enhancing Digital Visibility Using SEO Content Strategy KPI Dashboard To Evaluate SEO Performance Diagrams PDF
This slide shows key performance indicators dashboard which can be used by marketing managers to measure SEO performance. It includes metrics such as health score, domain rating, referring domains, backlinks, etc. This Enhancing Digital Visibility Using SEO Content Strategy KPI Dashboard To Evaluate SEO Performance Diagrams PDF is perfect for any presentation, be it in front of clients or colleagues. It is a versatile and stylish solution for organizing your meetings. The Enhancing Digital Visibility Using SEO Content Strategy KPI Dashboard To Evaluate SEO Performance Diagrams PDF features a modern design for your presentation meetings. The adjustable and customizable slides provide unlimited possibilities for acing up your presentation. Slidegeeks has done all the homework before launching the product for you. So, do not wait, grab the presentation templates today
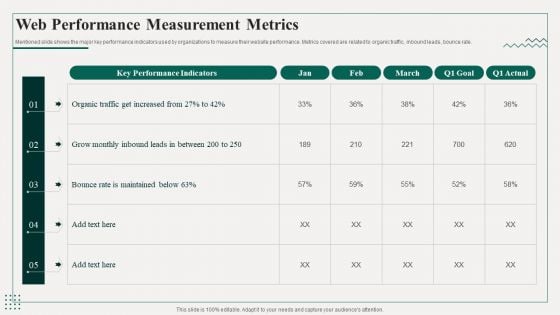
Promotion Playbook For Content Development Web Performance Measurement Metrics Diagrams PDF
Mentioned slide shows the major key performance indicators used by organizations to measure their website performance. Metrics covered are related to organic traffic, inbound leads, bounce rate.Deliver an awe inspiring pitch with this creative Promotion Playbook For Content Development Web Performance Measurement Metrics Diagrams PDF bundle. Topics like Performance Indicators, Monthly Inbound, Bounce Maintained can be discussed with this completely editable template. It is available for immediate download depending on the needs and requirements of the user.
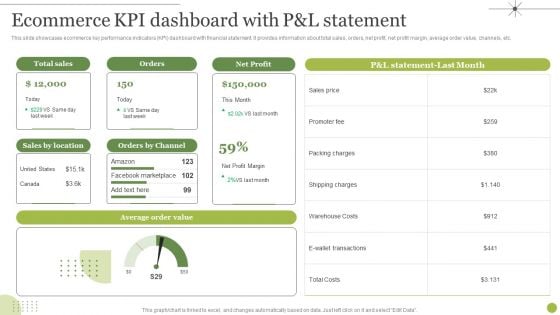
Managing E Commerce Business Accounting Ecommerce KPI Dashboard With P And L Statement Diagrams PDF
This slide showcases ecommerce key performance indicators KPI dashboard with financial statement. It provides information about total sales, orders, net profit, net profit margin, average order value, channels, etc. Present like a pro with Managing E Commerce Business Accounting Ecommerce KPI Dashboard With P And L Statement Diagrams PDF Create beautiful presentations together with your team, using our easy to use presentation slides. Share your ideas in real time and make changes on the fly by downloading our templates. So whether you are in the office, on the go, or in a remote location, you can stay in sync with your team and present your ideas with confidence. With Slidegeeks presentation got a whole lot easier. Grab these presentations today.

Introduction To Mobile SEM KPI Metrics Dashboard To Monitor Mobile SEO Performance Diagrams PDF
The purpose of this slide is to outline key performance indicator KPI dashboard which will assist the marketer to analyze mobile search engine optimization SEO performance. The key metrics mentioned in the slide are total sessions, search engine rankings etc. Take your projects to the next level with our ultimate collection of Introduction To Mobile SEM KPI Metrics Dashboard To Monitor Mobile SEO Performance Diagrams PDF. Slidegeeks has designed a range of layouts that are perfect for representing task or activity duration, keeping track of all your deadlines at a glance. Tailor these designs to your exact needs and give them a truly corporate look with your own brand colors they will make your projects stand out from the rest.
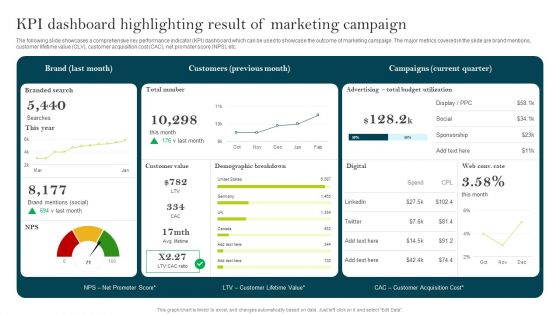
KPI Dashboard Highlighting Result Of Marketing Campaign Ppt PowerPoint Presentation Diagram Lists PDF
The following slide showcases a comprehensive key performance indicator KPI dashboard which can be used to showcase the outcome of marketing campaign. The major metrics covered in the slide are brand mentions, customer lifetime value CLV, customer acquisition cost CAC, net promoter score NPS, etc. Are you in need of a template that can accommodate all of your creative concepts This one is crafted professionally and can be altered to fit any style. Use it with Google Slides or PowerPoint. Include striking photographs, symbols, depictions, and other visuals. Fill, move around, or remove text boxes as desired. Test out color palettes and font mixtures. Edit and save your work, or work with colleagues. Download KPI Dashboard Highlighting Result Of Marketing Campaign Ppt PowerPoint Presentation Diagram Lists PDF and observe how to make your presentation outstanding. Give an impeccable presentation to your group and make your presentation unforgettable.
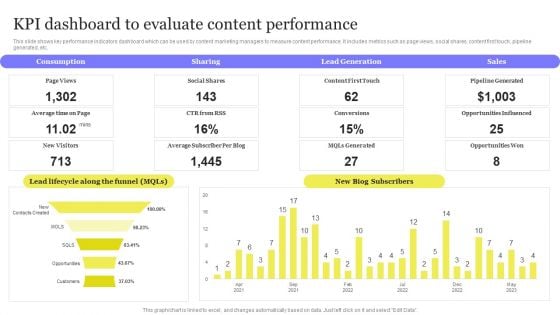
Enhancing Digital Visibility Using SEO Content Strategy KPI Dashboard To Evaluate Content Performance Diagrams PDF
This slide shows key performance indicators dashboard which can be used by content marketing managers to measure content performance. It includes metrics such as page views, social shares, content first touch, pipeline generated, etc. This modern and well arranged Enhancing Digital Visibility Using SEO Content Strategy KPI Dashboard To Evaluate Content Performance Diagrams PDF provides lots of creative possibilities. It is very simple to customize and edit with the Powerpoint Software. Just drag and drop your pictures into the shapes. All facets of this template can be edited with Powerpoint no extra software is necessary. Add your own material, put your images in the places assigned for them, adjust the colors, and then you can show your slides to the world, with an animated slide included.

Assessing Impact Of Sales Risk Management With Kpi Dashboard Diagrams PDF
The following slide highlights some key performance indicators KPIs to measure the influence of executing sales risk management strategies on revenue performance. It includes elements such as target attainment rate, gross profit, annual growth rate etc. Boost your pitch with our creative Assessing Impact Of Sales Risk Management With Kpi Dashboard Diagrams PDF. Deliver an awe inspiring pitch that will mesmerize everyone. Using these presentation templates you will surely catch everyones attention. You can browse the ppts collection on our website. We have researchers who are experts at creating the right content for the templates. So you do not have to invest time in any additional work. Just grab the template now and use them.
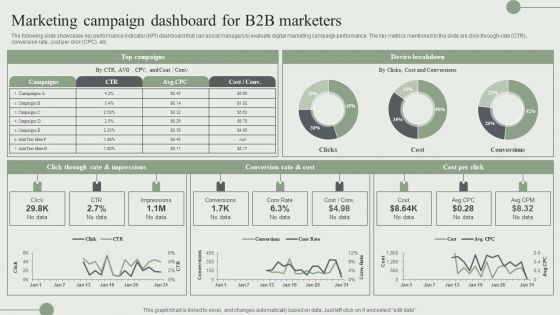
Marketing Campaign Dashboard For B2B Marketers Ppt PowerPoint Presentation File Diagrams PDF
The following slide showcases key performance indicator KPI dashboard that can assist managers to evaluate digital marketing campaign performance. The key metrics mentioned in the slide are click-through-rate CTR, conversion rate, cost per click CPC, etc. Present like a pro with Marketing Campaign Dashboard For B2B Marketers Ppt PowerPoint Presentation File Diagrams PDF Create beautiful presentations together with your team, using our easy to use presentation slides. Share your ideas in real time and make changes on the fly by downloading our templates. So whether you are in the office, on the go, or in a remote location, you can stay in sync with your team and present your ideas with confidence. With Slidegeeks presentation got a whole lot easier. Grab these presentations today.
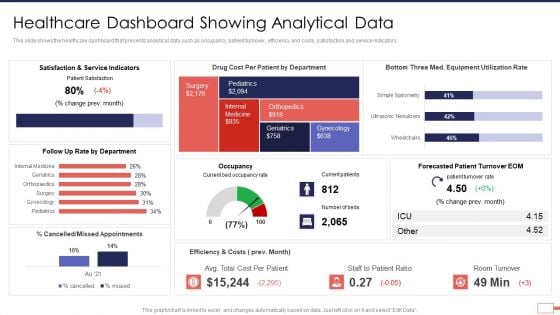
Iot Digital Twin Technology Post Covid Expenditure Management Healthcare Dashboard Showing Analytical Data Brochure PDF
This slide shows the healthcare dashboard that presents analytical data such as occupancy, patient turnover, efficiency and costs, satisfaction and service indicators. Deliver an awe inspiring pitch with this creative iot digital twin technology post covid expenditure management healthcare dashboard showing analytical data brochure pdf bundle. Topics like service, indicators, cost, appointments, turnover can be discussed with this completely editable template. It is available for immediate download depending on the needs and requirements of the user.
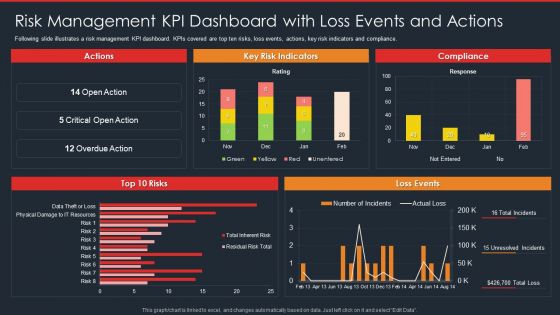
Data Safety Initiatives Risk Management KPI Dashboard With Loss Events And Actions Rules PDF
Following slide illustrates a risk management KPI dashboard. KPIs covered are top ten risks, loss events, actions, key risk indicators and compliance. Deliver an awe inspiring pitch with this creativedata safety initiatives overview of new it policy framework pictures pdf bundle. Topics like actions, key risk indicators, compliance, top 10 risks, loss events can be discussed with this completely editable template. It is available for immediate download depending on the needs and requirements of the user.
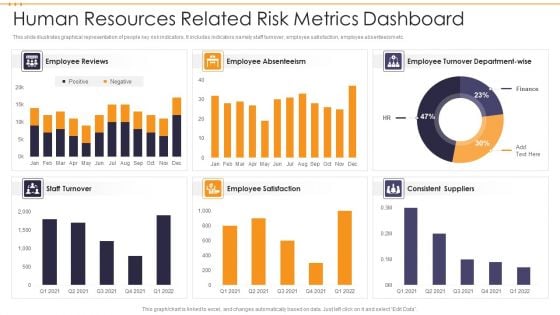
Human Resources Related Risk Metrics Dashboard Information PDF
This slide illustrates graphical representation of people key risk indicators. It includes indicators namely staff turnover, employee satisfaction, employee absenteeism etc. Pitch your topic with ease and precision using this Human Resources Related Risk Metrics Dashboard Information PDF. This layout presents information on Human Resources Related Risk Metrics Dashboard. It is also available for immediate download and adjustment. So, changes can be made in the color, design, graphics or any other component to create a unique layout.
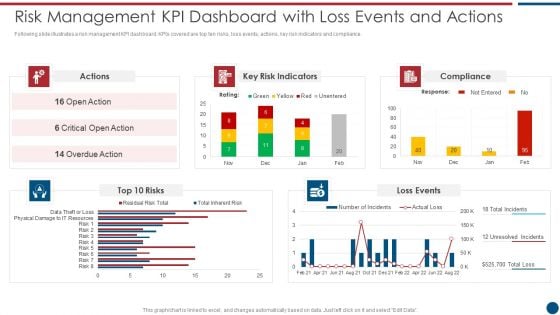
Risk Based Procedures To IT Security Risk Management KPI Dashboard With Loss Events And Actions Mockup PDF
Following slide illustrates a risk management KPI dashboard. KPIs covered are top ten risks, loss events, actions, key risk indicators and compliance. Deliver an awe inspiring pitch with this creative Risk Based Procedures To IT Security Risk Management KPI Dashboard With Loss Events And Actions Mockup PDF bundle. Topics like Key Risk, Indicators Compliance, Loss Events can be discussed with this completely editable template. It is available for immediate download depending on the needs and requirements of the user.

IT Security Risk Management Approach Introduction Risk Management KPI Dashboard With Loss Events Brochure PDF
Following slide illustrates a risk management KPI dashboard. KPIs covered are top ten risks, loss events, actions, key risk indicators and compliance. Deliver an awe inspiring pitch with this creative IT Security Risk Management Approach Introduction Risk Management KPI Dashboard With Loss Events Brochure PDF bundle. Topics like Key Risk Indicators, Risk Management can be discussed with this completely editable template. It is available for immediate download depending on the needs and requirements of the user.

Adult Population That Are Actively Paying Customers Of Dating Service Formats PDF
Mentioned slide portrays worldwide informational stats of adult population that are actively paying customers of dating service. Here the graph indicates that country with the largest share is the United States.Deliver an awe inspiring pitch with this creative Adult Population That Are Actively Paying Customers Of Dating Service Formats PDF bundle. Topics like Graph Indicates, Dating Service, United States can be discussed with this completely editable template. It is available for immediate download depending on the needs and requirements of the user.
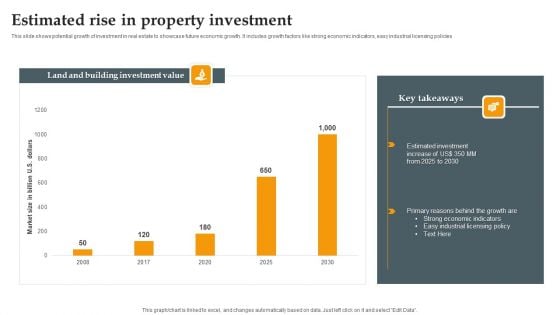
Estimated Rise In Property Investment Introduction PDF
This slide shows potential growth of investment in real estate to showcase future economic growth. It includes growth factors like strong economic indicators, easy industrial licensing policies. Showcasing this set of slides titled Estimated Rise In Property Investment Introduction PDF. The topics addressed in these templates are Estimated Investment, Strong Economic Indicators, Growth. All the content presented in this PPT design is completely editable. Download it and make adjustments in color, background, font etc. as per your unique business setting.
HR Manager KPI Dashboard With Employee Attrition Tracking Report Brochure PDF
This slide covers performance key indicators for HR manager. It also indicates employee turnover count, new recruitment, retention, training and development of new employees. Showcasing this set of slides titled HR Manager KPI Dashboard With Employee Attrition Tracking Report Brochure PDF. The topics addressed in these templates are Recruitment, Employee Turnover, Development. All the content presented in this PPT design is completely editable. Download it and make adjustments in color, background, font etc. as per your unique business setting.
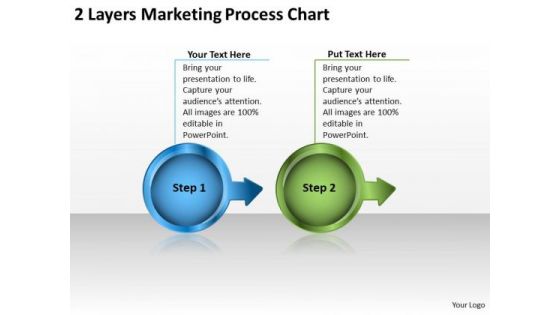
2 Layers Marketing Process Chart Flow PowerPoint Templates
We present our 2 layers marketing process chart flow PowerPoint templates.Use our Circle Charts PowerPoint Templates because,You can Inform your team of the various means they have to achieve them. Use our Arrows PowerPoint Templates because,You should Lay down the fundamentals to build upon. Use our Leadership PowerPoint Templates because,They are the indicators of the path you have in mind. Use our Business PowerPoint Templates because, Your fledgling career is in the chrysallis stage. Nurture it and watch it grow into a beautiful butterfly Use our Process and Flows PowerPoint Templates because,With the help of our Slides you can Illustrate the means to prevent or control them using our imaginative templates.Use these PowerPoint slides for presentations relating to 3d, abstract, analysis, chart, collaborate, communication, concept, conceptual, diagram, digital, flow, group, guide, idea, layer, leadership, management, marketing, meeting, organization, path, plan, present, presentation, process, program, section, strategy, team, teamwork, . The prominent colors used in the PowerPoint template are Blue, Green, Black. People tell us our 2 layers marketing process chart flow PowerPoint templates are Enchanting. The feedback we get is that our diagram PowerPoint templates and PPT Slides are Fun. People tell us our 2 layers marketing process chart flow PowerPoint templates are Nostalgic. Presenters tell us our concept PowerPoint templates and PPT Slides are Stylish. The feedback we get is that our 2 layers marketing process chart flow PowerPoint templates are incredible easy to use. Professionals tell us our diagram PowerPoint templates and PPT Slides are Efficacious. Make a powerful statement with our 2 Layers Marketing Process Chart Flow PowerPoint Templates. You'll always stay ahead of the game.
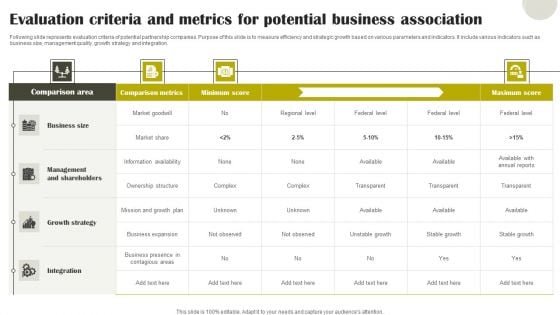
Evaluation Criteria And Metrics For Potential Business Association Diagrams PDF
Following slide represents evaluation criteria of potential partnership companies. Purpose of this slide is to measure efficiency and strategic growth based on various parameters and indicators. It include various indicators such as business size, management quality, growth strategy and integration. Showcasing this set of slides titled Evaluation Criteria And Metrics For Potential Business Association Diagrams PDF. The topics addressed in these templates are Growth Strategy, Management And Shareholders, Business Size. All the content presented in this PPT design is completely editable. Download it and make adjustments in color, background, font etc. as per your unique business setting.
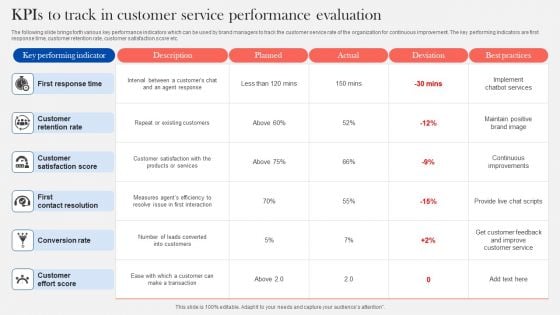
Kpis To Track In Customer Service Performance Evaluation Diagrams PDF
The following slide brings forth various key performance indicators which can be used by brand managers to track the customer service rate of the organization for continuous improvement. The key performing indicators are first response time, customer retention rate, customer satisfaction score etc. Showcasing this set of slides titled Kpis To Track In Customer Service Performance Evaluation Diagrams PDF. The topics addressed in these templates are First Response Time, Customer Retention Rate, Customer Satisfaction Score. All the content presented in this PPT design is completely editable. Download it and make adjustments in color, background, font etc. as per your unique business setting.
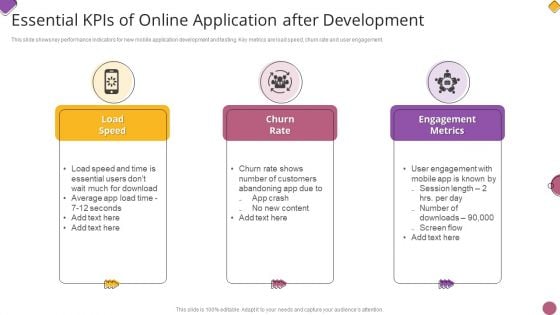
Essential Kpis Of Online Application After Development Themes PDF
This slide shows key performance indicators for new mobile application development and testing. Key metrics are load speed, churn rate and user engagement.Presenting Essential Kpis Of Online Application After Development Themes PDF to dispense important information. This template comprises three stages. It also presents valuable insights into the topics including Engagement Metrics, Engagement, Much Download. This is a completely customizable PowerPoint theme that can be put to use immediately. So, download it and address the topic impactfully.
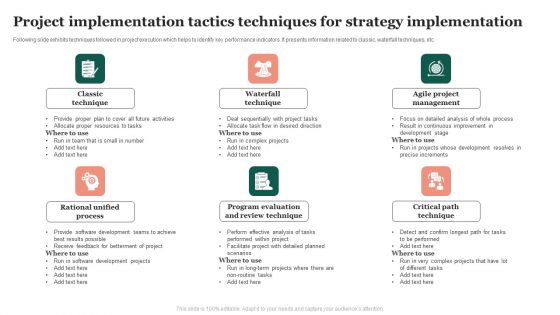
Project Implementation Tactics Techniques For Strategy Implementation Themes PDF
Following slide exhibits techniques followed in project execution which helps to identify key performance indicators. It presents information related to classic, waterfall techniques, etc. Presenting Project Implementation Tactics Techniques For Strategy Implementation Themes PDF to dispense important information. This template comprises three stages. It also presents valuable insights into the topics including Waterfall Technique, Classic Technique, Rational Unified Process. This is a completely customizable PowerPoint theme that can be put to use immediately. So, download it and address the topic impactfully.
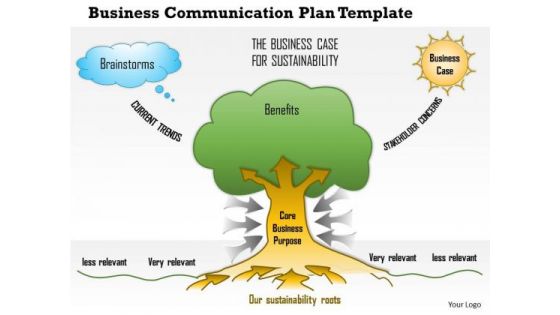
Business Framework Business Communication Plan PowerPoint Presentation
Explain the importance of business communication plan with this power point diagram slide. To display BCP we have used graphic of plan. This image indicate the internal and external communication points for any business. Use this image for business communication related topics and build innovative presentations for your clients.
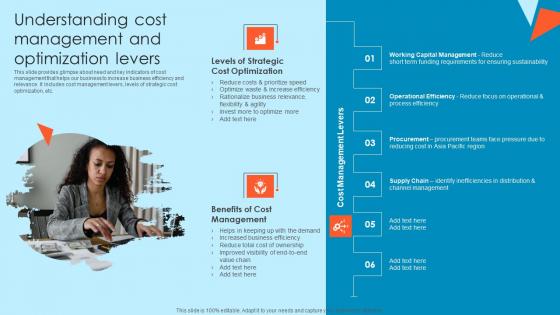
Understanding Cost Management And Optimization Tactical Financial Governance Themes Pdf
This slide provides glimpse about need and key indicators of cost management that helps our business to increase business efficiency and relevance. It includes cost management levers, levels of strategic cost optimization, etc.If your project calls for a presentation, then Slidegeeks is your go-to partner because we have professionally designed, easy-to-edit templates that are perfect for any presentation. After downloading, you can easily edit Understanding Cost Management And Optimization Tactical Financial Governance Themes Pdf and make the changes accordingly. You can rearrange slides or fill them with different images. Check out all the handy templates This slide provides glimpse about need and key indicators of cost management that helps our business to increase business efficiency and relevance. It includes cost management levers, levels of strategic cost optimization, etc.
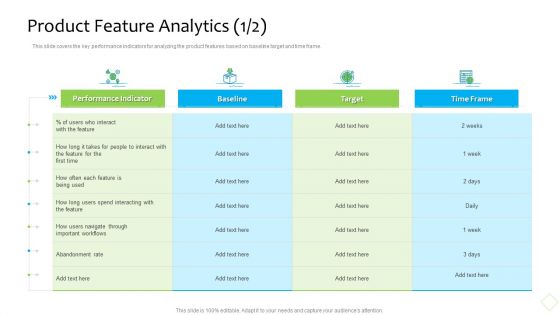
Product Demand Administration Product Feature Analytics Target Themes PDF
This slide covers the key performance indicators for analyzing the product features based on baseline target and time frame. Deliver an awe inspiring pitch with this creative product demand administration product feature analytics target themes pdf bundle. Topics like product feature analytics can be discussed with this completely editable template. It is available for immediate download depending on the needs and requirements of the user.
Corporate Franchisor Tracking Different Franchisees Marketing Performance Themes PDF
This slide provides information regarding corporate franchisor tracking various franchisees marketing performance in terms of website speed score, cost per lead, conversion rate, etc. Deliver an awe inspiring pitch with this creative Corporate Franchisor Tracking Different Franchisees Marketing Performance Themes PDF bundle. Topics like Marketing Performance, Indicators, Conversion Rate can be discussed with this completely editable template. It is available for immediate download depending on the needs and requirements of the user.
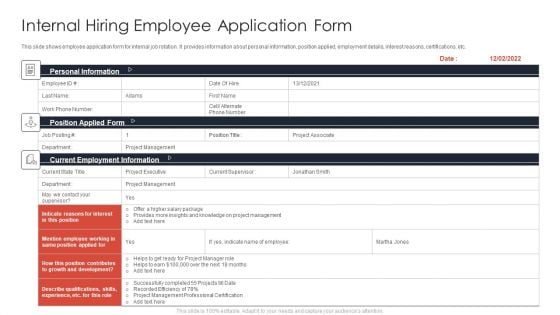
Internal Hiring Employee Application Form Ppt Layouts Themes PDF
This slide shows employee application form for internal job rotation. It provides information about personal information, position applied, employment details, interest reasons, certifications, etc. Pitch your topic with ease and precision using this Internal Hiring Employee Application Form Ppt Layouts Themes PDF. This layout presents information on Personal Information, Indicate Reasons, Mention Employee Working. It is also available for immediate download and adjustment. So, changes can be made in the color, design, graphics or any other component to create a unique layout.
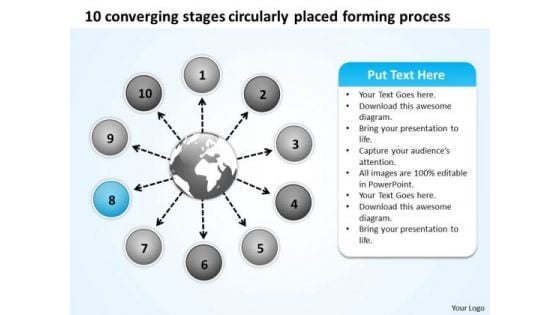
Stages Circularly Placed Forming Process Flow Diagram PowerPoint Slides
We present our stages circularly placed forming process Flow Diagram PowerPoint Slides.Download our Arrows PowerPoint Templates because they are the indicators of the path you have in mind. Download and present our Process and Flows PowerPoint Templates because this template helps you to bring your audiences to the table. Download and present our Business PowerPoint Templates because your ideas too are pinpointedly focused on you goals. Present our Shapes PowerPoint Templates because this is An innovative slide design depicting driving home the relevance of a steady rhythm. Use our Circle Charts PowerPoint Templates because it Creates a winner with your passion and dream.Use these PowerPoint slides for presentations relating to Arrow, Business, Chart, Circle, Design, Diagram, Direction, Document, Market, Marketing, Multiple, Navigation, Network, Options, Plan, Presentation, Process, Results, Shiny, Sphere, Statistics, Structure, Template, Three, Vector, Website, Wheel. The prominent colors used in the PowerPoint template are Blue light, White, Gray. People tell us our stages circularly placed forming process Flow Diagram PowerPoint Slides are Striking. People tell us our Diagram PowerPoint templates and PPT Slides are Pretty. The feedback we get is that our stages circularly placed forming process Flow Diagram PowerPoint Slides are Ritzy. Presenters tell us our Design PowerPoint templates and PPT Slides are Fabulous. Customers tell us our stages circularly placed forming process Flow Diagram PowerPoint Slides are designed by professionals The feedback we get is that our Document PowerPoint templates and PPT Slides are Reminiscent. Engage the experts with our Stages Circularly Placed Forming Process Flow Diagram PowerPoint Slides. They will be compelled to display admiration.
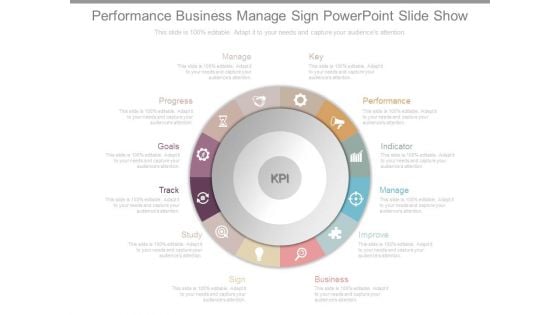
Performance Business Manage Sign Powerpoint Slide Show
This is a performance business manage sign powerpoint slide show. This is a twelve stage process. The stages in this process are key, performance, indicator, manage, improve, business, sign, study, track, goals, progress, manage, kpi.
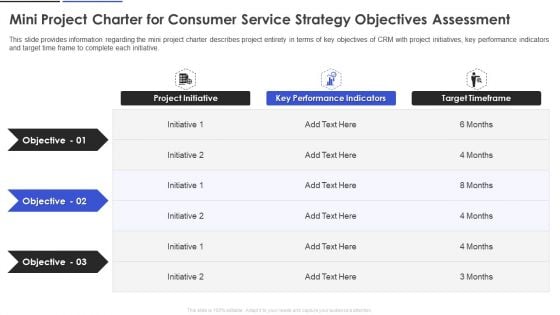
Mini Project Charter For Consumer Service Strategy Objectives Assessment Themes PDF
This slide provides information regarding the mini project charter describes project entirety in terms of key objectives of CRM with project initiatives, key performance indicators and target time frame to complete each initiative. Deliver an awe inspiring pitch with this creative Mini Project Charter For Consumer Service Strategy Objectives Assessment Themes PDF bundle. Topics like Project Initiative, Key Performance Indicators, Target Timeframe can be discussed with this completely editable template. It is available for immediate download depending on the needs and requirements of the user.
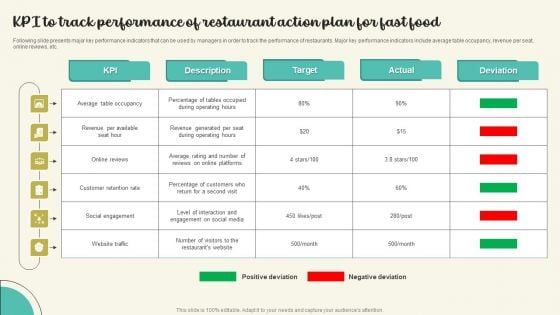
KPI To Track Performance Of Restaurant Action Plan For Fast Food Themes PDF
Following slide presents major key performance indicators that can be used by managers in order to track the performance of restaurants. Major key performance indicators include average table occupancy, revenue per seat, online reviews, etc. Showcasing this set of slides titled KPI To Track Performance Of Restaurant Action Plan For Fast Food Themes PDF. The topics addressed in these templates are Customer Retention Rate, Social Engagement, Website Traffic. All the content presented in this PPT design is completely editable. Download it and make adjustments in color, background, font etc. as per your unique business setting.
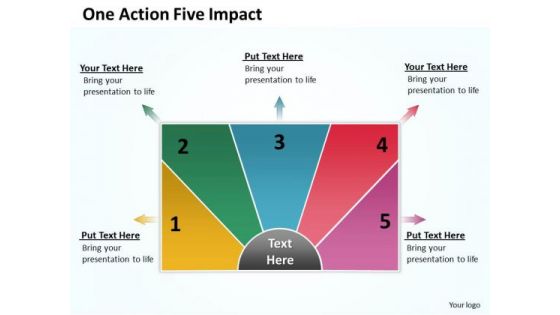
One Action Five Impact Circular Flow Diagram PowerPoint Templates
We present our one action five impact Circular Flow Diagram PowerPoint templates.Download and present our Business PowerPoint Templates because a lot of dissimilar elements needing to gel to strike the deal. Download our Arrows PowerPoint Templates because you are aware of some pitfalls ahead where you need to be cautious not to overrun and avoid a stall. Download and present our Shapes PowerPoint Templates because it helps you to satiate the brains of your team with a taste of the final product. Use our Process and Flows PowerPoint Templates because this one depicts the popular chart. Use our Signs PowerPoint Templates because this emphasises on the relevance and importance of all milestones along the way.Use these PowerPoint slides for presentations relating to Arrow, Background, Banner, Bar, Blue, Collection, Completed, Completion, Concept, Confirmation, Design, Five, Flow, Four, Graph, Graphic, Illustration, Indication, Indicator, Information, Instruction, Interface, Internet, Layout, Measurement, Modern, Number, One, Order, Phase, Pointer, Process, Progress, Reflection, Scale, Send, Set, Shape, Stage, Status, Step. The prominent colors used in the PowerPoint template are Blue, Red, Green. We assure you our one action five impact Circular Flow Diagram PowerPoint templates are Elevated. Customers tell us our Banner PowerPoint templates and PPT Slides are incredible easy to use. The feedback we get is that our one action five impact Circular Flow Diagram PowerPoint templates are Nifty. We assure you our Concept PowerPoint templates and PPT Slides are effectively colour coded to prioritise your plans They automatically highlight the sequence of events you desire. People tell us our one action five impact Circular Flow Diagram PowerPoint templates will generate and maintain the level of interest you desire. They will create the impression you want to imprint on your audience. We assure you our Blue PowerPoint templates and PPT Slides are Efficient. With our One Action Five Impact Circular Flow Diagram PowerPoint Templates you will never be fearful. Accept any challenge that may crop up.
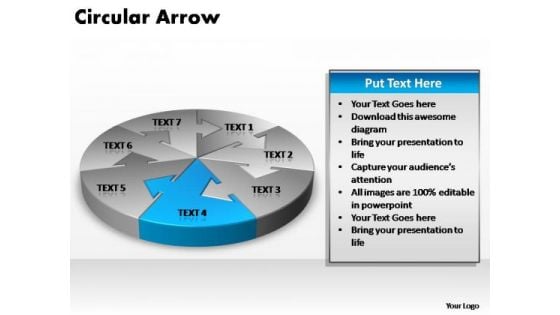
PowerPoint Template Graphic Circular Arrow Ppt Slides
PowerPoint Template Graphic Circular Arrow PPT Slides-The arrows indicate the progression of the process. Constant monitoring of the processes provides you with opportunities to concentrate on the core competencies in your business and improve the standards for more effective results.-PowerPoint Template Graphic Circular Arrow PPT Slides Curb assumptions with our PowerPoint Template Graphic Circular Arrow Ppt Slides. Face up to them with the facts.
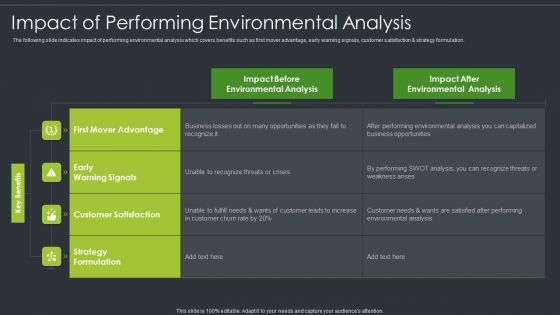
Impact Of Performing Environmental Analysis Diagrams PDF
The following slide indicates impact of performing environmental analysis which covers benefits such as first mover advantage, early warning signals, customer satisfaction and strategy formulation. Showcasing this set of slides titled Impact Of Performing Environmental Analysis Diagrams PDF. The topics addressed in these templates are Customer Satisfaction, Environmental, Strategy Formulation . All the content presented in this PPT design is completely editable. Download it and make adjustments in color, background, font etc. as per your unique business setting.
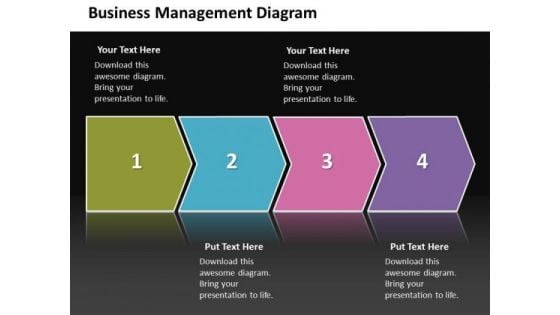
Ppt Linear Steps Business Process Management Diagram PowerPoint Free Templates
PPT linear steps business process management diagram powerpoint free Templates-Grab the attention of your team with this eye catching template presenting indicators of the path you have in mind. Use this diagram to enthuse your colleagues-PPT linear steps business process management diagram powerpoint free Templates-3d, Arrow, Background, Banner, Business, Chart, Colorful, Diagram, Direction, Element, Financial, Flow, Gradient, Illustration, Isolated, Mirrored, Placeholder, Presentation, Process, Steps Conservation of energy is the aim. Address environmental concerns with our Ppt Linear Steps Business Process Management Diagram PowerPoint Free Templates.
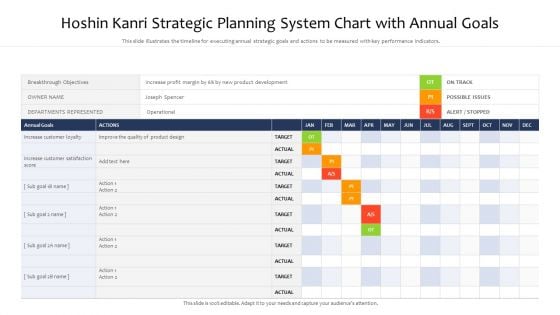
Hoshin Kanri Strategic Planning System Chart With Annual Goals Ppt PowerPoint Presentation Gallery Graphics Design PDF
This slide illustrates the timeline for executing annual strategic goals and actions to be measured with key performance indicators. Showcasing this set of slides titled hoshin kanri strategic planning system chart with annual goals ppt powerpoint presentation gallery graphics design pdf. The topics addressed in these templates are product design, product development, annual goals. All the content presented in this PPT design is completely editable. Download it and make adjustments in color, background, font etc. as per your unique business setting.
Project Management Under Supervision Projects Tracking Chart With Multiple Stages Ideas PDF
This dashboard indicates the progress of multiple projects with completion status during different stages and client feedback. Deliver and pitch your topic in the best possible manner with this project management under supervision projects tracking chart with multiple stages ideas pdf. Use them to share invaluable insights on analysis, design, development, testing, live and impress your audience. This template can be altered and modified as per your expectations. So, grab it now.
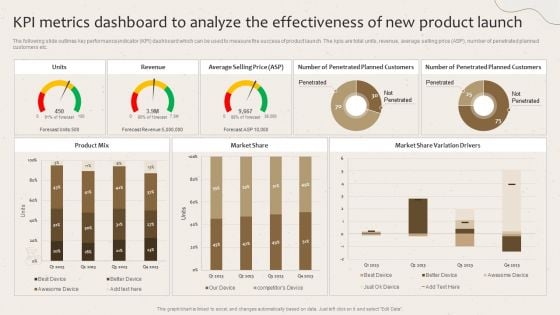
Kpi Metrics Dashboard To Analyze The Effectiveness Of New Product Launch Launching New Beverage Product Diagrams PDF
The following slide outlines key performance indicator KPI dashboard which can be used to measure the success of product launch. The kpis are total units, revenue, average selling price ASP, number of penetrated planned customers etc. Create an editable Kpi Metrics Dashboard To Analyze The Effectiveness Of New Product Launch Launching New Beverage Product Diagrams PDF that communicates your idea and engages your audience. Whether you are presenting a business or an educational presentation, pre-designed presentation templates help save time. Kpi Metrics Dashboard To Analyze The Effectiveness Of New Product Launch Launching New Beverage Product Diagrams PDF is highly customizable and very easy to edit, covering many different styles from creative to business presentations. Slidegeeks has creative team members who have crafted amazing templates. So, go and get them without any delay.
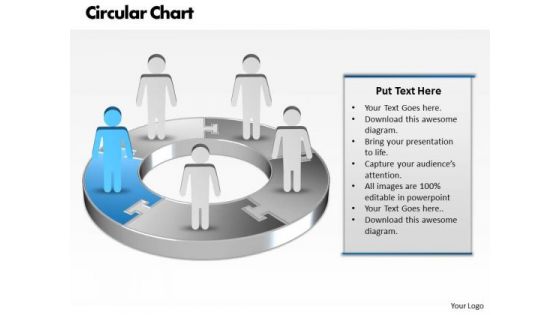
Ppt Blue Men Standing On Business Pie Organization Chart PowerPoint Template Templates
PPT blue men standing on business pie organization chart powerpoint template Templates-Use this Business based PowerPoint Diagram to represent the Business issues Graphically. It indicates arrange, block out, blueprint, cast, delineate, design, devise, draft, graph , lay out, outline, plot, project, shape, sketch etc.-PPT blue men standing on business pie organization chart powerpoint template Templates-arrow, art, basic, blank, business, capital, chart, chevron, clip, clipart, colorful, conglomerates, consumer, copy, cyclical, energy, financial, flow, goods, graph, graphic, healthcare, illustration, infographic, information, investment, isolated, market, materials, non, round, sectors, services, slide, space, stock, technology, text, Our Ppt Blue Men Standing On Business Pie Organization Chart PowerPoint Template Templates are never a drag. The audience will be always attentive.

KPI Dashboard For Monitoring Warehouse Operations Strategic Plan For Enhancing Inspiration Pdf
Mentioned slide illustrates warehouse operations dashboard with key performance indicators KPIs. KPIs included are operating cost, order rate, total shipment by country and on-time shipment. Retrieve professionally designed KPI Dashboard For Monitoring Warehouse Operations Strategic Plan For Enhancing Inspiration Pdf to effectively convey your message and captivate your listeners. Save time by selecting pre-made slideshows that are appropriate for various topics, from business to educational purposes. These themes come in many different styles, from creative to corporate, and all of them are easily adjustable and can be edited quickly. Access them as PowerPoint templates or as Google Slides themes. You do not have to go on a hunt for the perfect presentation because Slidegeeks got you covered from everywhere. Mentioned slide illustrates warehouse operations dashboard with key performance indicators KPIs. KPIs included are operating cost, order rate, total shipment by country and on-time shipment.
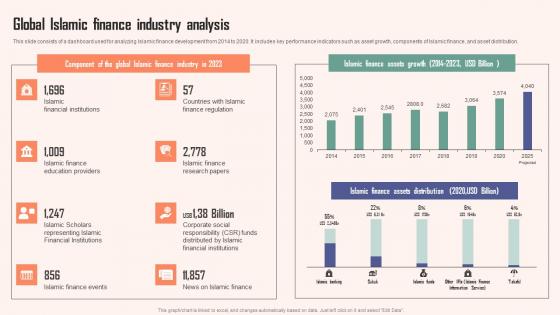
Global Islamic Finance Industry Analysis Comprehensive Guide Islamic Introduction PDF
This slide consists of a dashboard used for analyzing Islamic finance development from 2014 to 2020. It includes key performance indicators such as asset growth, components of Islamic finance, and asset distribution. Retrieve professionally designed Global Islamic Finance Industry Analysis Comprehensive Guide Islamic Introduction PDF to effectively convey your message and captivate your listeners. Save time by selecting pre-made slideshows that are appropriate for various topics, from business to educational purposes. These themes come in many different styles, from creative to corporate, and all of them are easily adjustable and can be edited quickly. Access them as PowerPoint templates or as Google Slides themes. You do not have to go on a hunt for the perfect presentation because Slidegeeks got you covered from everywhere. This slide consists of a dashboard used for analyzing Islamic finance development from 2014 to 2020. It includes key performance indicators such as asset growth, components of Islamic finance, and asset distribution.
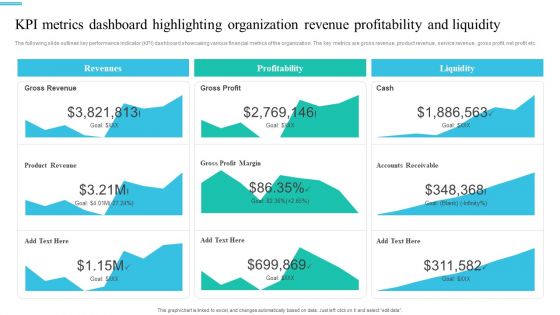
Monetary Planning And Evaluation Guide KPI Metrics Dashboard Highlighting Organization Revenue Profitability And Liquidity Ppt Diagram Images PDF
The following slide outlines key performance indicator KPI dashboard showcasing various financial metrics of the organization. The key metrics are gross revenue, product revenue, service revenue, gross profit, net profit etc. Coming up with a presentation necessitates that the majority of the effort goes into the content and the message you intend to convey. The visuals of a PowerPoint presentation can only be effective if it supplements and supports the story that is being told. Keeping this in mind our experts created Monetary Planning And Evaluation Guide KPI Metrics Dashboard Highlighting Organization Revenue Profitability And Liquidity Ppt Diagram Images PDF to reduce the time that goes into designing the presentation. This way, you can concentrate on the message while our designers take care of providing you with the right template for the situation.

Colorful Party Balloons Background PowerPoint Templates And PowerPoint Themes 1112
We present our Colorful Party Balloons Background PowerPoint Templates And PowerPoint Themes 1112.Use our Holidays PowerPoint Templates because, Heighten the anticipation of your audience with this slide listing . Use our Events PowerPoint Templates because,Designed to attract the attention of your audience. Use our Christmas PowerPoint Templates because, A time of festivity, good cheer and bonding with friends and family. Use our Festival PowerPoint Templates because,This one depicts the popular chart. Use our Shapes PowerPoint Templates because,They are indicators of the path you have in mind.Use these PowerPoint slides for presentations relating to Colorful party balloons, holidays, events, christmas, festival, shapes . The prominent colors used in the PowerPoint template are Green, Red, Yellow Present your views with our Colorful Party Balloons Background PowerPoint Templates And PowerPoint Themes 1112. You will come out on top.
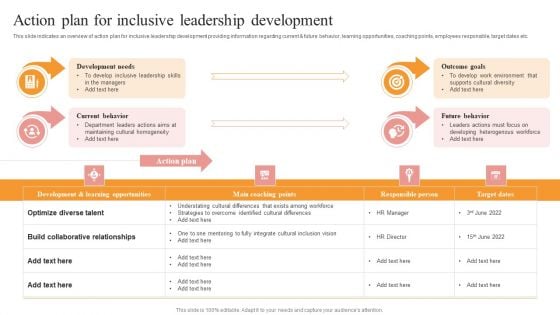
Action Plan For Inclusive Leadership Development Themes PDF
This slide indicates an overview of action plan for inclusive leadership development providing information regarding current and future behavior, learning opportunities, coaching points, employees responsible, target dates etc. If you are looking for a format to display your unique thoughts, then the professionally designed Action Plan For Inclusive Leadership Development Themes PDF is the one for you. You can use it as a Google Slides template or a PowerPoint template. Incorporate impressive visuals, symbols, images, and other charts. Modify or reorganize the text boxes as you desire. Experiment with shade schemes and font pairings. Alter, share or cooperate with other people on your work. Download Action Plan For Inclusive Leadership Development Themes PDF and find out how to give a successful presentation. Present a perfect display to your team and make your presentation unforgettable.
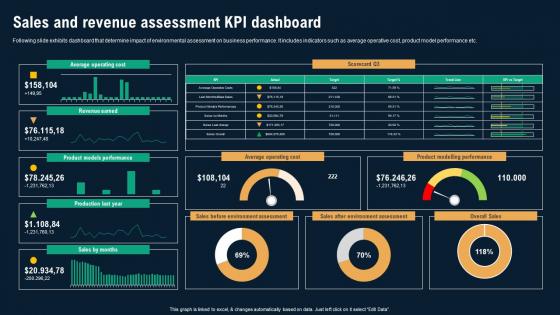
Sales And Revenue Assessment KPI Dashboard Business Environmental Analysis Ideas Pdf
Following slide exhibits dashboard that determine impact of environmental assessment on business performance. It includes indicators such as average operative cost, product model performance etc. There are so many reasons you need a Sales And Revenue Assessment KPI Dashboard Business Environmental Analysis Ideas Pdf The first reason is you can not spend time making everything from scratch, Thus, Slidegeeks has made presentation templates for you too. You can easily download these templates from our website easily. Following slide exhibits dashboard that determine impact of environmental assessment on business performance. It includes indicators such as average operative cost, product model performance etc.
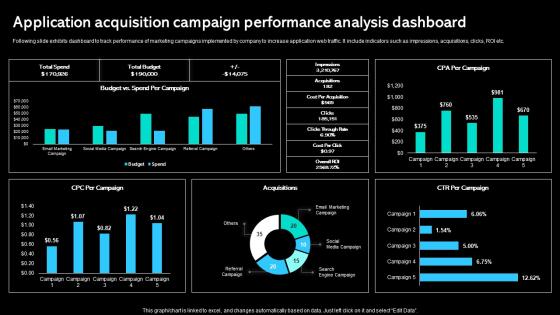
Application Acquisition Campaign Performance Analysis Paid Marketing Approach Infographics Pdf
Following slide exhibits dashboard to track performance of marketing campaigns implemented by company to increase application web traffic. It include indicators such as impressions, acquisitions, clicks, ROI etc. There are so many reasons you need a Application Acquisition Campaign Performance Analysis Paid Marketing Approach Infographics Pdf The first reason is you can not spend time making everything from scratch, Thus, Slidegeeks has made presentation templates for you too. You can easily download these templates from our website easily. Following slide exhibits dashboard to track performance of marketing campaigns implemented by company to increase application web traffic. It include indicators such as impressions, acquisitions, clicks, ROI etc.
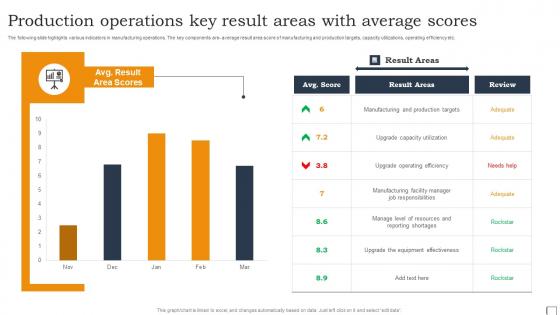
Production Operations Key Result Areas With Average Scores Structure Pdf
The following slide highlights various indicators in manufacturing operations. The key components are- average result area score of manufacturing and production targets, capacity utilizations, operating efficiency etc. Showcasing this set of slides titled Production Operations Key Result Areas With Average Scores Structure Pdf. The topics addressed in these templates are Result Areas. All the content presented in this PPT design is completely editable. Download it and make adjustments in color, background, font etc. as per your unique business setting. The following slide highlights various indicators in manufacturing operations. The key components are- average result area score of manufacturing and production targets, capacity utilizations, operating efficiency etc.
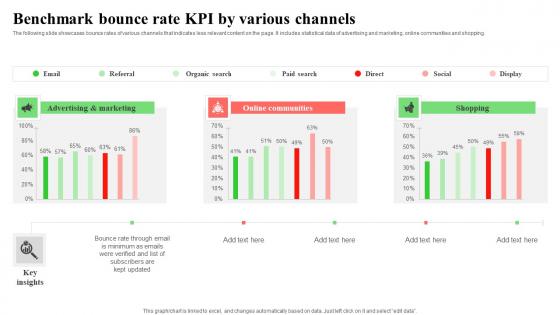
Benchmark Bounce Rate KPI By Various Channels Infographics Pdf
The following slide showcases bounce rates of various channels that indicates less relevant content on the page. It includes statistical data of advertising and marketing, online communities and shopping. Pitch your topic with ease and precision using this Benchmark Bounce Rate KPI By Various Channels Infographics Pdf. This layout presents information on Advertising,Marketing, Online Communities. It is also available for immediate download and adjustment. So, changes can be made in the color, design, graphics or any other component to create a unique layout. The following slide showcases bounce rates of various channels that indicates less relevant content on the page. It includes statistical data of advertising and marketing, online communities and shopping.
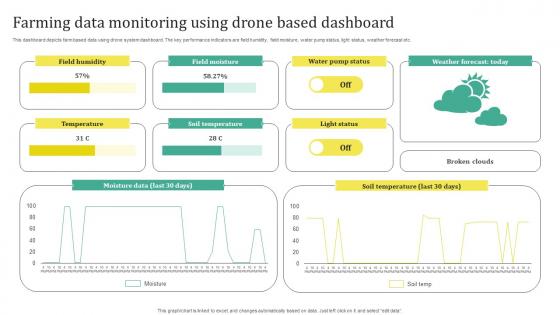
Farming Data Monitoring Using Drone Based Dashboard Sample Pdf
This dashboard depicts farm based data using drone system dashboard. The key performance indicators are field humidity, field moisture, water pump status, light status, weather forecast etc. Pitch your topic with ease and precision using this Farming Data Monitoring Using Drone Based Dashboard Sample Pdf. This layout presents information on Temperature, Soil Temperature, Light Status. It is also available for immediate download and adjustment. So, changes can be made in the color, design, graphics or any other component to create a unique layout. This dashboard depicts farm based data using drone system dashboard. The key performance indicators are field humidity, field moisture, water pump status, light status, weather forecast etc.
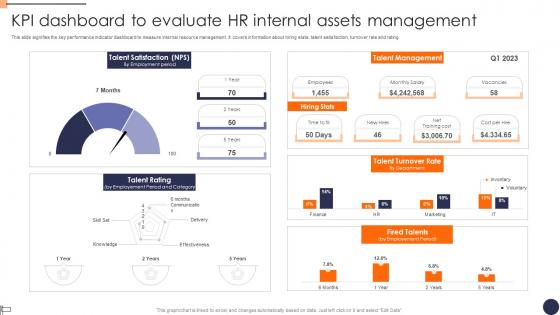
KPI Dashboard To Evaluate HR Internal Assets Management Structure Pdf
This slide signifies the key performance indicator dashboard to measure internal resource management. It covers information about hiring stats, talent satisfaction, turnover rate and rating. Showcasing this set of slides titled KPI Dashboard To Evaluate HR Internal Assets Management Structure Pdf. The topics addressed in these templates are About Hiring Stats, Talent Satisfaction, Turnover. All the content presented in this PPT design is completely editable. Download it and make adjustments in color, background, font etc. as per your unique business setting. This slide signifies the key performance indicator dashboard to measure internal resource management. It covers information about hiring stats, talent satisfaction, turnover rate and rating.
Financial Performance Online Marketplace Pitch Deck
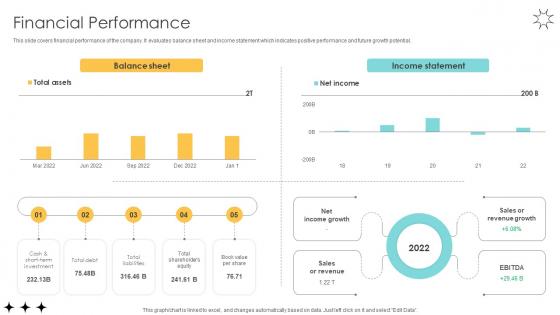
This slide covers financial performance of the company. It evaluates balance sheet and income statement which indicates positive performance and future growth potential. From laying roadmaps to briefing everything in detail, our templates are perfect for you. You can set the stage with your presentation slides. All you have to do is download these easy-to-edit and customizable templates. Financial Performance Online Marketplace Pitch Deck will help you deliver an outstanding performance that everyone would remember and praise you for. Do download this presentation today. This slide covers financial performance of the company. It evaluates balance sheet and income statement which indicates positive performance and future growth potential.
Financial Performance Real Estate Platform Investor Funding Elevator Pitch Deck
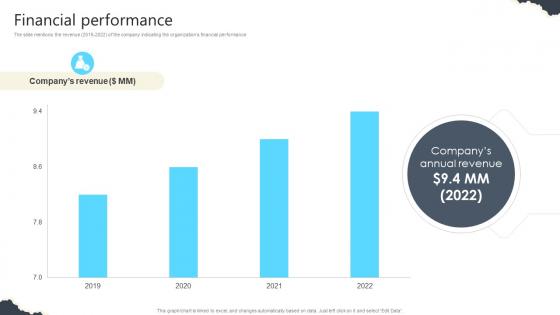
The slide mentions the revenue 2019-2022 of the company indicating the organizations financial performance. Present like a pro with Financial Performance Real Estate Platform Investor Funding Elevator Pitch Deck. Create beautiful presentations together with your team, using our easy-to-use presentation slides. Share your ideas in real-time and make changes on the fly by downloading our templates. So whether you are in the office, on the go, or in a remote location, you can stay in sync with your team and present your ideas with confidence. With Slidegeeks presentation got a whole lot easier. Grab these presentations today. The slide mentions the revenue 2019-2022 of the company indicating the organizations financial performance.
Financial Performance Computational Software Company Investor Funding Ppt Example
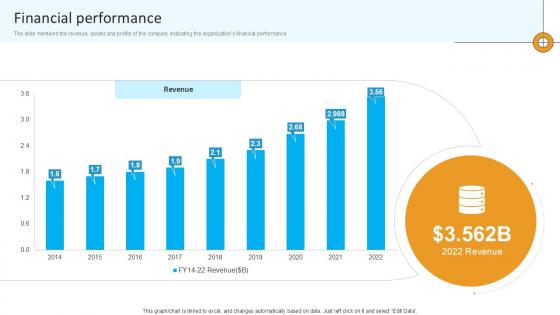
The slide mentions the revenue, assets and profits of the company indicating the organizations financial performance. From laying roadmaps to briefing everything in detail, our templates are perfect for you. You can set the stage with your presentation slides. All you have to do is download these easy-to-edit and customizable templates. Financial Performance Computational Software Company Investor Funding Ppt Example will help you deliver an outstanding performance that everyone would remember and praise you for. Do download this presentation today. The slide mentions the revenue, assets and profits of the company indicating the organizations financial performance
Financial Performance Investment Company Investor Funding Elevator Ppt Slide
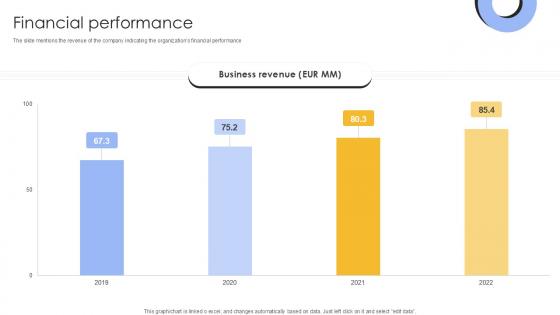
The slide mentions the revenue of the company indicating the organizations financial performance. Find a pre-designed and impeccable Financial Performance Investment Company Investor Funding Elevator Ppt Slide. The templates can ace your presentation without additional effort. You can download these easy-to-edit presentation templates to make your presentation stand out from others. So, what are you waiting for Download the template from Slidegeeks today and give a unique touch to your presentation. The slide mentions the revenue of the company indicating the organizations financial performance
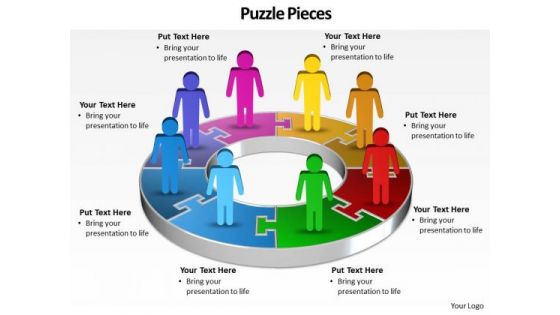
Ppt A Team Of Business People Standing On Pie PowerPoint Bar Chart Ks2 Pieces Templates
PPT a team of business people standing on pie powerpoint bar chart ks2 pieces Templates-This Business PowerPoint Diagram shows 3d linear abstraction to represent Business related issues. It uses three steps. It indicates employment, field, function, game, line, and livelihood. It is helpful to organize information. -PPT a team of business people standing on pie powerpoint bar chart ks2 pieces Templates-Abstract, Arrow, Art, Artistic, Background, Business, Colorful, Communication, Computer-Graphics, Concept, Creation, Data, Decoration, Decorative, Design, Design-Element, Digital, Direction, Effect, Elegance, Element, Energy, Flow, Go, Idea, Illustration, Modern, Movement, Network, Symbol Break out of the cocoon with our Ppt A Team Of Business People Standing On Pie PowerPoint Bar Chart Ks2 Pieces Templates. Let your thoughts take to the air.
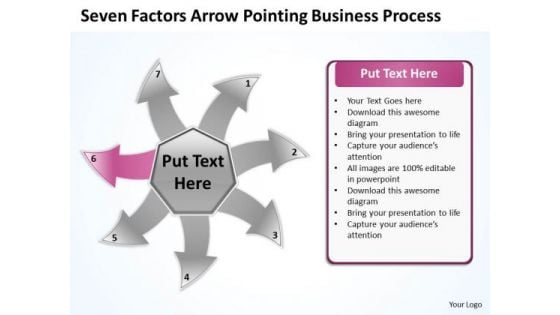
Free Business PowerPoint Templates Process Cycle Circular Flow Layout Chart
We present our free business powerpoint templates process cycle Circular Flow Layout Chart.Use our Communication PowerPoint Templates because the plans are in your head, stage by stage, year by year. Present our Arrows PowerPoint Templates because you have had your share of being a goldfish in a small bowl.you are ready to launch out and spread your wings. Download and present our Circle Charts PowerPoint Templates because they are the indicators of the path you have in mind. Download our Business PowerPoint Templates because your thoughts are pointed and sharp as arrows. Present our Shapes PowerPoint Templates because your group can behave steady in the top bracket.Use these PowerPoint slides for presentations relating to Arrow, Bio, Business, Chart, Circle, Concept, Control, Cycle, Design, Development, Diagram, Eco, Ecology, Environmental, Evaluate, Flow, Flowchart, Fresh, Graphic, Green, Idea, Infographic, Iterative, Life, Lifecycle, Management, Method, Model, Natural, Nature, Organic, Process, Quality, Recycle, Research, Schema, Spiral, Step, Strategy, Success, System. The prominent colors used in the PowerPoint template are Pink, Gray, White. Customers tell us our free business powerpoint templates process cycle Circular Flow Layout Chart are Adorable. Customers tell us our Concept PowerPoint templates and PPT Slides are Tranquil. Presenters tell us our free business powerpoint templates process cycle Circular Flow Layout Chart are Romantic. PowerPoint presentation experts tell us our Design PowerPoint templates and PPT Slides are Tranquil. Customers tell us our free business powerpoint templates process cycle Circular Flow Layout Chart are Efficient. Professionals tell us our Chart PowerPoint templates and PPT Slides provide you with a vast range of viable options. Select the appropriate ones and just fill in your text. Our Free Business PowerPoint Templates Process Cycle Circular Flow Layout Chart remain within bounds. They will never exceed their brief.
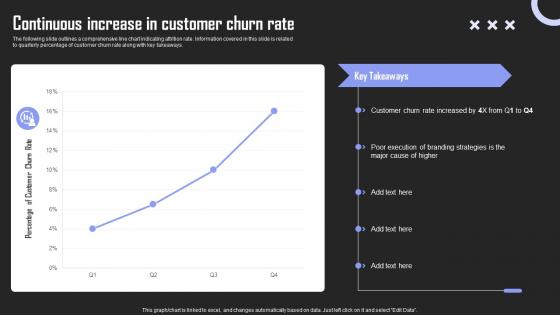
Continuous Increase Rate Brand Building Techniques To Gain Competitive Edge Summary Pdf
The following slide outlines a comprehensive line chart indicating attrition rate. Information covered in this slide is related to quarterly percentage of customer churn rate along with key takeaways. Whether you have daily or monthly meetings, a brilliant presentation is necessary. Continuous Increase Rate Brand Building Techniques To Gain Competitive Edge Summary Pdf can be your best option for delivering a presentation. Represent everything in detail using Continuous Increase Rate Brand Building Techniques To Gain Competitive Edge Summary Pdf and make yourself stand out in meetings. The template is versatile and follows a structure that will cater to your requirements. All the templates prepared by Slidegeeks are easy to download and edit. Our research experts have taken care of the corporate themes as well. So, give it a try and see the results. The following slide outlines a comprehensive line chart indicating attrition rate. Information covered in this slide is related to quarterly percentage of customer churn rate along with key takeaways.
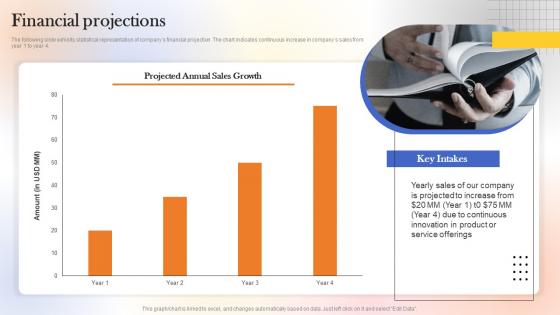
Financial Projections Web Designing Platform Fundraising Pitch Deck Microsoft Pdf
The following slide exhibits statistical representation of companys financial projection. The chart indicates continuous increase in companys sales from year 1 to year 4. Whether you have daily or monthly meetings, a brilliant presentation is necessary. Financial Projections Web Designing Platform Fundraising Pitch Deck Microsoft Pdf can be your best option for delivering a presentation. Represent everything in detail using Financial Projections Web Designing Platform Fundraising Pitch Deck Microsoft Pdf and make yourself stand out in meetings. The template is versatile and follows a structure that will cater to your requirements. All the templates prepared by Slidegeeks are easy to download and edit. Our research experts have taken care of the corporate themes as well. So, give it a try and see the results. The following slide exhibits statistical representation of companys financial projection. The chart indicates continuous increase in companys sales from year 1 to year 4.
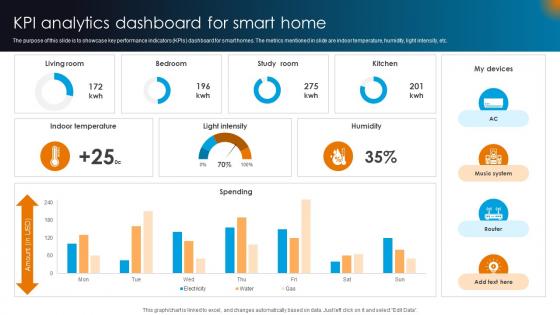
Integrating AI With IoT Kpi Analytics Dashboard For Smart Home IoT SS V
The purpose of this slide is to showcase key performance indicators KPIs dashboard for smart homes. The metrics mentioned in slide are indoor temperature, humidity, light intensity, etc. Are you searching for a Integrating AI With IoT Kpi Analytics Dashboard For Smart Home IoT SS V that is uncluttered, straightforward, and original Its easy to edit, and you can change the colors to suit your personal or business branding. For a presentation that expresses how much effort you have put in, this template is ideal With all of its features, including tables, diagrams, statistics, and lists, its perfect for a business plan presentation. Make your ideas more appealing with these professional slides. Download Integrating AI With IoT Kpi Analytics Dashboard For Smart Home IoT SS V from Slidegeeks today. The purpose of this slide is to showcase key performance indicators KPIs dashboard for smart homes. The metrics mentioned in slide are indoor temperature, humidity, light intensity, etc.
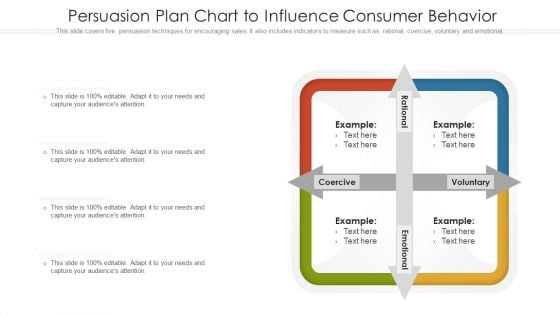
Persuasion Plan Chart To Influence Consumer Behavior Ppt PowerPoint Presentation Summary Design Templates PDF
This slide covers five persuasion techniques for encouraging sales. It also includes indicators to measure such as rational, coercive, voluntary and emotional. Persuade your audience using this persuasion plan chart to influence consumer behavior ppt powerpoint presentation summary design templates pdf. This PPT design covers four stages, thus making it a great tool to use. It also caters to a variety of topics including persuasion plan chart to influence consumer behavior. Download this PPT design now to present a convincing pitch that not only emphasizes the topic but also showcases your presentation skills.
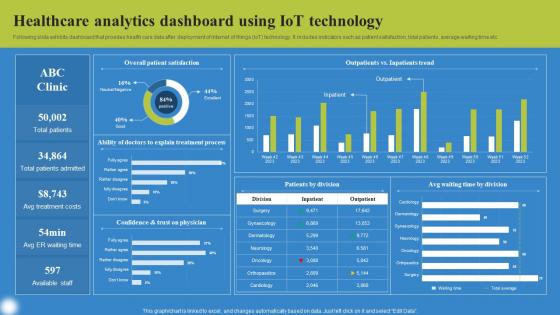
Healthcare Analytics Dashboard Using Deploying IoT Solutions For Enhanced Healthcare Background Pdf
Following slide exhibits dashboard that provides health care data after deployment of internet of things IoT technology. It includes indicators such as patient satisfaction, total patients, average waiting time etc. Do you know about Slidesgeeks Healthcare Analytics Dashboard Using Deploying IoT Solutions For Enhanced Healthcare Background Pdf These are perfect for delivering any kind od presentation. Using it, create PowerPoint presentations that communicate your ideas and engage audiences. Save time and effort by using our pre designed presentation templates that are perfect for a wide range of topic. Our vast selection of designs covers a range of styles, from creative to business, and are all highly customizable and easy to edit. Download as a PowerPoint template or use them as Google Slides themes. Following slide exhibits dashboard that provides health care data after deployment of internet of things IoT technology. It includes indicators such as patient satisfaction, total patients, average waiting time etc.


 Continue with Email

 Home
Home


