Meter Slides
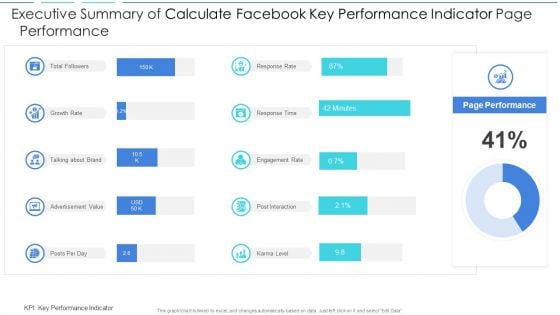
Executive Summary Of Calculate Facebook Key Performance Indicator Page Performance Download PDF
Showcasing this set of slides titled executive summary of calculate facebook key performance indicator page performance download pdf. The topics addressed in these templates are executive summary of calculate facebook key performance indicator page performance. All the content presented in this PPT design is completely editable. Download it and make adjustments in color, background, font etc. as per your unique business setting.

Total Cost Of Ownership Dashboard Indicating Cost Breakdown And Storage Analysis Rules PDF
Showcasing this set of slides titled total cost of ownership dashboard indicating cost breakdown and storage analysis rules pdf. The topics addressed in these templates are total cost of ownership dashboard indicating cost breakdown and storage analysis. All the content presented in this PPT design is completely editable. Download it and make adjustments in color, background, font etc. as per your unique business setting.
Icon Indicating Quality Control Management In Assembly Line Process Portrait PDF
Showcasing this set of slides titled icon indicating quality control management in assembly line process portrait pdf. The topics addressed in these templates are icon indicating quality control management in assembly line process. All the content presented in this PPT design is completely editable. Download it and make adjustments in color, background, font etc. as per your unique business setting.
Icon Of Key Performance Indicators For Continuous Performance Measurement Professional PDF
Showcasing this set of slides titled Icon Of Key Performance Indicators For Continuous Performance Measurement Professional PDF The topics addressed in these templates are Icon Of Key Performance, Indicators For Continuous, Performance Measurement All the content presented in this PPT design is completely editable. Download it and make adjustments in color, background, font etc. as per your unique business setting.

Security KPI Dashboard With Various Key Performance Indicators Ppt Portfolio Objects PDF
Showcasing this set of slides titled Security KPI Dashboard With Various Key Performance Indicators Ppt Portfolio Objects PDF. The topics addressed in these templates are Security Kpi Dashboard, Performance Indicators, Analyst Assigned. All the content presented in this PPT design is completely editable. Download it and make adjustments in color, background, font etc. as per your unique business setting.

Chart Indicates Diminishing Graph And Chart Cash Payment Mode Inspiration PDF
Showcasing this set of slides titled Chart Indicates Diminishing Graph And Chart Cash Payment Mode Inspiration PDF. The topics addressed in these templates are Chart Indicates Diminishing Graph, Chart Cash Payment Mode. All the content presented in this PPT design is completely editable. Download it and make adjustments in color, background, font etc. as per your unique business setting.
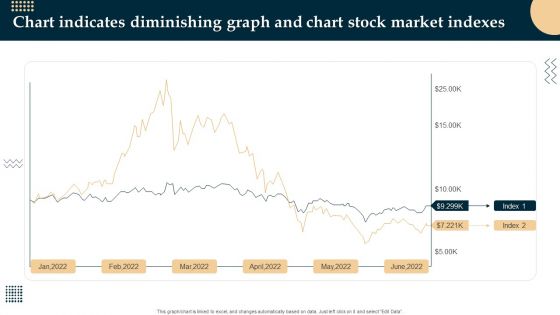
Chart Indicates Diminishing Graph And Chart Stock Market Indexes Themes PDF
Showcasing this set of slides titled Chart Indicates Diminishing Graph And Chart Stock Market Indexes Themes PDF. The topics addressed in these templates are Chart Indicates Diminishing Graph, Chart Stock Market Indexes. All the content presented in this PPT design is completely editable. Download it and make adjustments in color, background, font etc. as per your unique business setting.
Plant Management Icon Indicating Industrial Wastewater Treatment System Ppt Styles Maker PDF
Showcasing this set of slides titled Plant Management Icon Indicating Industrial Wastewater Treatment System Ppt Styles Maker PDF. The topics addressed in these templates are Plant Management, Icon Indicating Industrial, Wastewater Treatment System. All the content presented in this PPT design is completely editable. Download it and make adjustments in color, background, font etc. as per your unique business setting.
Leading And Lagging Indicators Scorecard For A Manufacturing Firm Icon Icons PDF
Showcasing this set of slides titled Leading And Lagging Indicators Scorecard For A Manufacturing Firm Icon Icons PDF. The topics addressed in these templates are Leading And Lagging, Indicators Scorecard, Manufacturing Firm. All the content presented in this PPT design is completely editable. Download it and make adjustments in color, background, font etc. as per your unique business setting.
Blockchain Platform For Industries Nodes Icon Indicating Smooth Process Summary PDF
Showcasing this set of slides titled Blockchain Platform For Industries Nodes Icon Indicating Smooth Process Summary PDF. The topics addressed in these templates are Blockchain Platform Industries Nodes, Icon Indicating Smooth Process. All the content presented in this PPT design is completely editable. Download it and make adjustments in color, background, font etc. as per your unique business setting.

Call Center Quality Key Performance Assurance Indicator Metrics Dashboard Portrait PDF
Showcasing this set of slides titled Call Center Quality Key Performance Assurance Indicator Metrics Dashboard Portrait PDF. The topics addressed in these templates are Key Performance, Assurance Indicator, Metrics Dashboard. All the content presented in this PPT design is completely editable. Download it and make adjustments in color, background, font etc. as per your unique business setting.
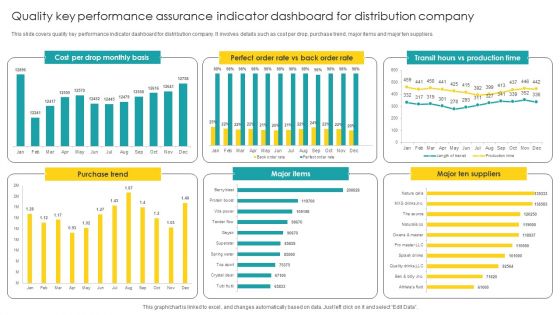
Quality Key Performance Assurance Indicator Dashboard For Distribution Company Mockup PDF
Showcasing this set of slides titled Quality Key Performance Assurance Indicator Dashboard For Distribution Company Mockup PDF. The topics addressed in these templates are Performance Assurance, Indicator Dashboard, Distribution Company. All the content presented in this PPT design is completely editable. Download it and make adjustments in color, background, font etc. as per your unique business setting.
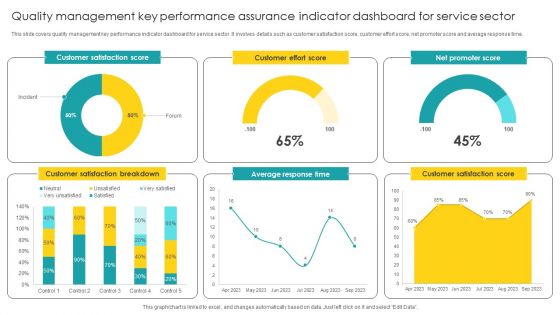
Quality Management Key Performance Assurance Indicator Dashboard For Service Sector Designs PDF
Showcasing this set of slides titled Quality Management Key Performance Assurance Indicator Dashboard For Service Sector Designs PDF. The topics addressed in these templates are Assurance Indicator, Dashboard For Service Sector. All the content presented in this PPT design is completely editable. Download it and make adjustments in color, background, font etc. as per your unique business setting.
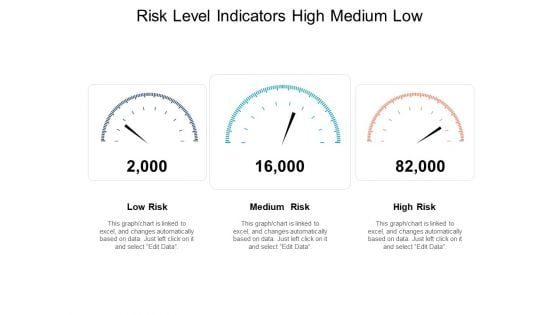
Risk Level Indicators High Medium Low Ppt PowerPoint Presentation Pictures Template
Presenting this set of slides with name risk level indicators high medium low ppt powerpoint presentation pictures template. This is a three stage process. The stages in this process are high low risk, risk con, warning. This is a completely editable PowerPoint presentation and is available for immediate download. Download now and impress your audience.
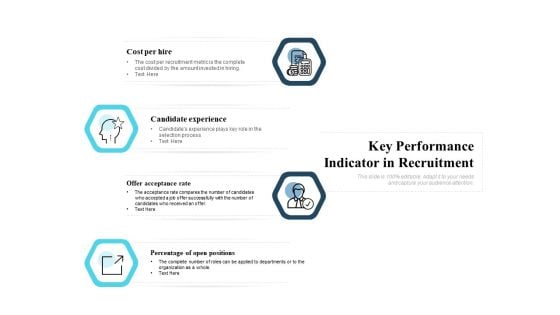
Key Performance Indicator In Recruitment Ppt PowerPoint Presentation Show Graphic Tips
Presenting this set of slides with name key performance indicator in recruitment ppt powerpoint presentation show graphic tips. This is a four stage process. The stages in this process are cost per hire, candidate experience, offer acceptance rate, percentage of open positions. This is a completely editable PowerPoint presentation and is available for immediate download. Download now and impress your audience.
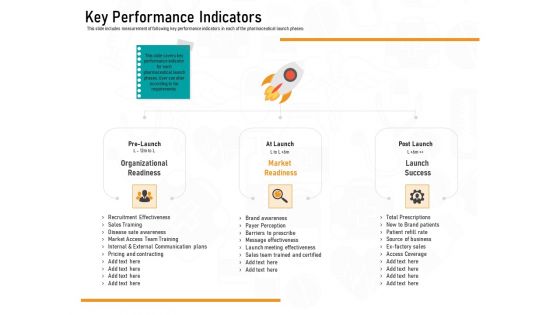
Medicine Promotion Key Performance Indicators Ppt PowerPoint Presentation Ideas Slideshow PDF
Presenting this set of slides with name medicine promotion key performance indicators ppt powerpoint presentation ideas slideshow pdf. This is a three stage process. The stages in this process are pre launch, organizational, readiness, at launch, market, readiness, post launch, launch success. This is a completely editable PowerPoint presentation and is available for immediate download. Download now and impress your audience.
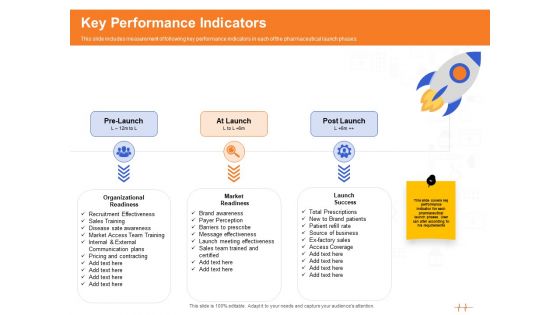
Wellness Program Promotion Key Performance Indicators Ppt PowerPoint Presentation Infographics Inspiration PDF
Presenting this set of slides with name wellness program promotion key performance indicators ppt powerpoint presentation infographics inspiration pdf. This is a three stage process. The stages in this process are pre launch, organizational, readiness, at launch, market, readiness, post launch, launch success. This is a completely editable PowerPoint presentation and is available for immediate download. Download now and impress your audience.
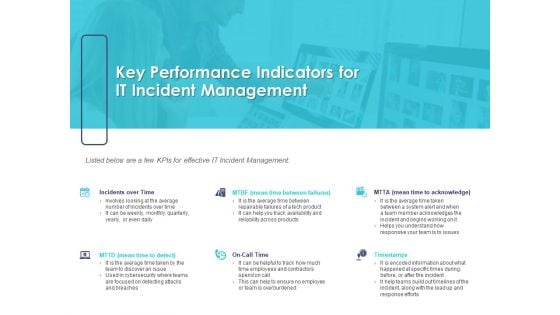
Managing ITIL Incidents Planning Key Performance Indicators For IT Incident Management Diagrams PDF
Presenting this set of slides with name managing itil incidents planning key performance indicators for it incident management diagrams pdf. This is a six stage process. The stages in this process are management, effective, acknowledge, cybersecurity. This is a completely editable PowerPoint presentation and is available for immediate download. Download now and impress your audience.
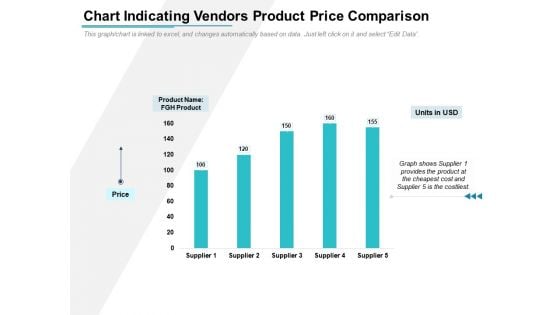
Chart Indicating Vendors Product Price Comparison Ppt PowerPoint Presentation Portfolio Infographics PDF
Showcasing this set of slides titled chart indicating vendors product price comparison ppt powerpoint presentation portfolio infographics pdf. The topics addressed in these templates are product, fgh product, units in usd, price, supplier. All the content presented in this PPT design is completely editable. Download it and make adjustments in color, background, font etc. as per your unique business setting.
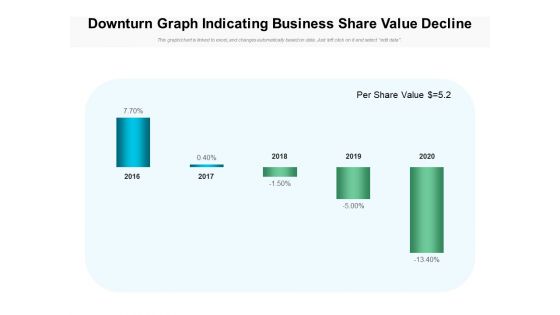
Downturn Graph Indicating Business Share Value Decline Ppt PowerPoint Presentation Professional Elements PDF
Showcasing this set of slides titled downturn graph indicating business share value decline ppt powerpoint presentation professional elements pdf. The topics addressed in these templates are per share value, 2016 to 2020. All the content presented in this PPT design is completely editable. Download it and make adjustments in color, background, font etc. as per your unique business setting.
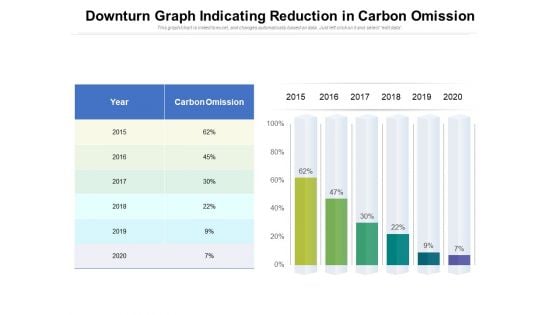
Downturn Graph Indicating Reduction In Carbon Omission Ppt PowerPoint Presentation Outline Inspiration PDF
Showcasing this set of slides titled downturn graph indicating reduction in carbon omission ppt powerpoint presentation outline inspiration pdf. The topics addressed in these templates are carbon omission, year, 2015 to 2020. All the content presented in this PPT design is completely editable. Download it and make adjustments in color, background, font etc. as per your unique business setting.
Indicator Of Electronic Gadgets Quarterly Of Market Competitiveness Ppt PowerPoint Presentation Icon Background Images PDF
Showcasing this set of slides titled indicator of electronic gadgets quarterly of market competitiveness ppt powerpoint presentation icon background images pdf. The topics addressed in these templates are gadget, market share, quarterly. All the content presented in this PPT design is completely editable. Download it and make adjustments in color, background, font etc. as per your unique business setting.
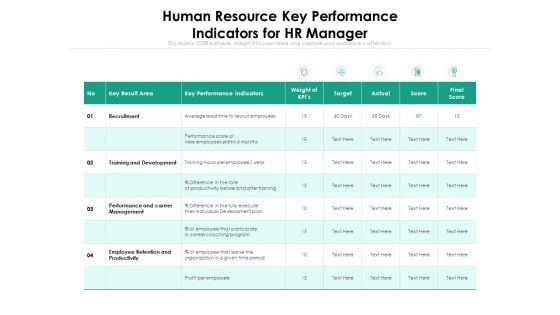
Human Resource Key Performance Indicators For HR Manager Ppt PowerPoint Presentation Gallery Examples PDF
Showcasing this set of slides titled human resource key performance indicators for hr manager ppt powerpoint presentation gallery examples pdf. The topics addressed in these templates are training, development, management. All the content presented in this PPT design is completely editable. Download it and make adjustments in color, background, font etc. as per your unique business setting.

Human Resource Key Performance Indicators Showing Training Cost Of Employees Ppt PowerPoint Presentation File Deck PDF
Showcasing this set of slides titled human resource key performance indicators showing training cost of employees ppt powerpoint presentation file deck pdf. The topics addressed in these templates are cost, sources, market. All the content presented in this PPT design is completely editable. Download it and make adjustments in color, background, font etc. as per your unique business setting.
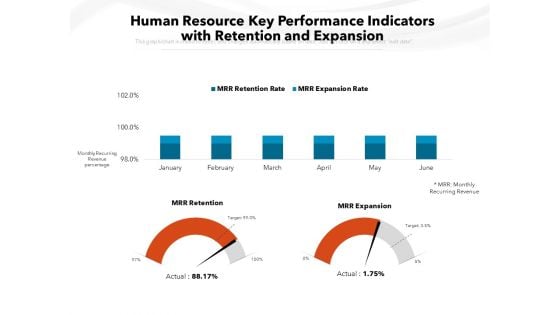
Human Resource Key Performance Indicators With Retention And Expansion Ppt PowerPoint Presentation File Background Designs PDF
Showcasing this set of slides titled human resource key performance indicators with retention and expansion ppt powerpoint presentation file background designs pdf. The topics addressed in these templates are revenue, retention, expansion. All the content presented in this PPT design is completely editable. Download it and make adjustments in color, background, font etc. as per your unique business setting.
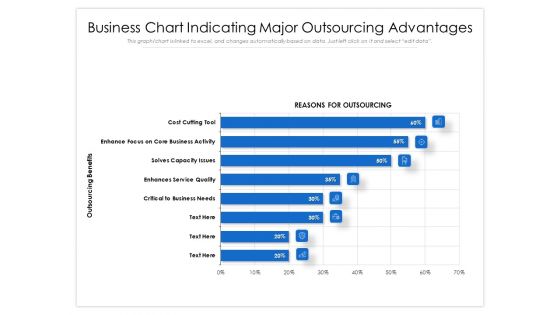
Business Chart Indicating Major Outsourcing Advantages Ppt PowerPoint Presentation File Template PDF
Showcasing this set of slides titled business chart indicating major outsourcing advantages ppt powerpoint presentation file template pdf. The topics addressed in these templates are cost, business, service. All the content presented in this PPT design is completely editable. Download it and make adjustments in color, background, font etc. as per your unique business setting.
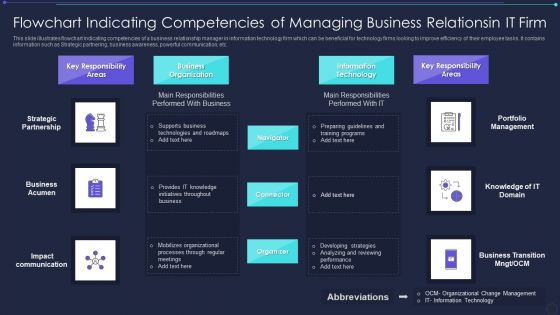
Flowchart Indicating Competencies Of Managing Business Relationsin It Firm Designs PDF
Showcasing this set of slides titled flowchart indicating competencies of managing business relationsin it firm designs pdf. The topics addressed in these templates are strategic partnership, business acumen, impact communication. All the content presented in this PPT design is completely editable. Download it and make adjustments in color, background, font etc. as per your unique business setting.
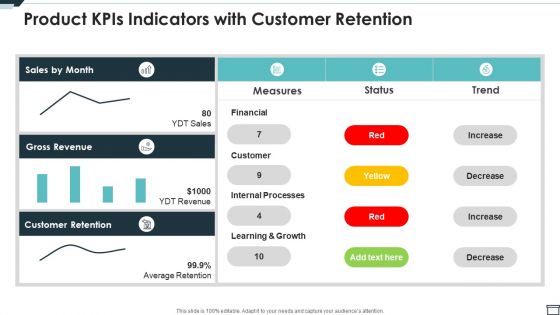
Product Kpis Indicators With Customer Retention Ppt PowerPoint Presentation File Examples PDF
Showcasing this set of slides titled product kpis indicators with customer retention ppt powerpoint presentation file examples pdf. The topics addressed in these templates are customer, financial, measures. All the content presented in this PPT design is completely editable. Download it and make adjustments in color, background, font etc. as per your unique business setting.
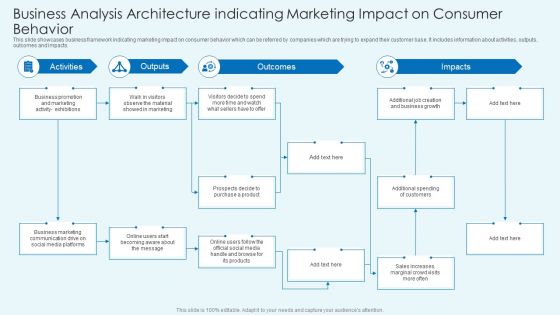
Business Analysis Architecture Indicating Marketing Impact On Consumer Behavior Structure PDF
Showcasing this set of slides titled Business Analysis Architecture Indicating Marketing Impact On Consumer Behavior Structure PDF. The topics addressed in these templates are Business Promotion, Showed In Marketing, Business Marketing. All the content presented in this PPT design is completely editable. Download it and make adjustments in color, background, font etc. as per your unique business setting.
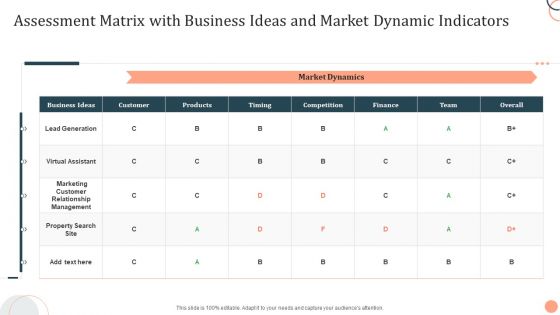
Assessment Matrix With Business Ideas And Market Dynamic Indicators Guidelines PDF
Showcasing this set of slides titled Assessment Matrix With Business Ideas And Market Dynamic Indicators Guidelines PDF. The topics addressed in these templates are Business Ideas, Products, Customer. All the content presented in this PPT design is completely editable. Download it and make adjustments in color, background, font etc. as per your unique business setting.

Employee Feedback Dashboard With Key Metrics Elements PDF
The following slide depicts the key insights of the feedback survey to gauge employee engagement at different department levels. It includes metrics such as engagement score, response rate, no. of comments etc.Showcasing this set of slides titled Employee Feedback Dashboard With Key Metrics Elements PDF The topics addressed in these templates are Employee Feedback Dashboard With Key Metrics All the content presented in this PPT design is completely editable. Download it and make adjustments in color, background, font etc. as per your unique business setting.
Budget Benchmark Report For Oncology Clinical Studies At Global Level Icons PDF
The slide showcases budget benchmarking to gauge and improve financial results by selecting few operating ratios by which company wants to measure its results and manage assets. Showcasing this set of slides titled Budget Benchmark Report For Oncology Clinical Studies At Global Level Icons PDF. The topics addressed in these templates are Benchmark Source, Key Insights, Actual Budget. All the content presented in this PPT design is completely editable. Download it and make adjustments in color, background, font etc. as per your unique business setting.
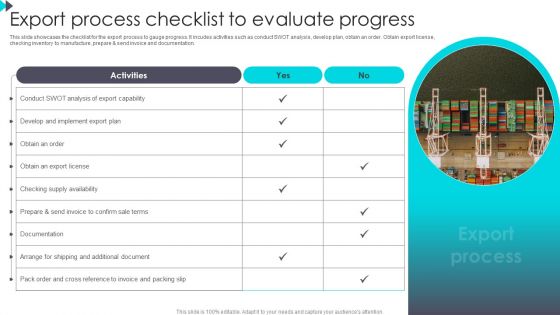
Export Process Checklist To Evaluate Progress Sample PDF
This slide showcases the checklist for the export process to gauge progress. It incudes activities such as conduct SWOT analysis, develop plan, obtain an order. Obtain export license, checking inventory to manufacture, prepare and send invoice and documentation. Showcasing this set of slides titled Export Process Checklist To Evaluate Progress Sample PDF. The topics addressed in these templates are Checking Supply Availability, Confirm Sale Terms, Packing Slip. All the content presented in this PPT design is completely editable. Download it and make adjustments in color, background, font etc. as per your unique business setting.
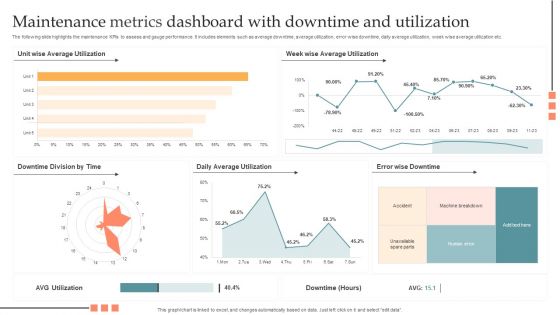
Maintenance Metrics Dashboard With Downtime And Utilization Pictures PDF
The following slide highlights the maintenance KPIs to assess and gauge performance. It includes elements such as average downtime, average utilization, error wise downtime, daily average utilization, week wise average utilization etc. Showcasing this set of slides titled Maintenance Metrics Dashboard With Downtime And Utilization Pictures PDF. The topics addressed in these templates are Maintenance Metrics Dashboard, Downtime And Utilization. All the content presented in this PPT design is completely editable. Download it and make adjustments in color, background, font etc. as per your unique business setting.
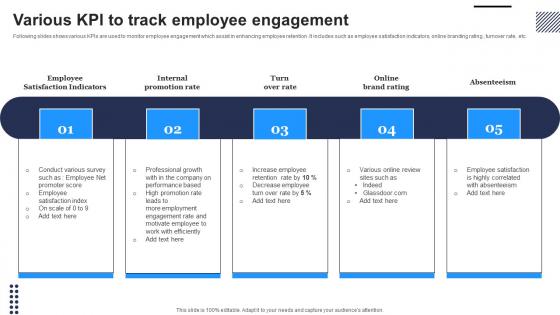
Various KPI To Track Employee Engagement Portrait Pdf
Following slides shows various KPIs are used to monitor employee engagement which assist in enhancing employee retention .It includes such as employee satisfaction indicators, online branding rating , turnover rate, etc. Showcasing this set of slides titled Various KPI To Track Employee Engagement Portrait Pdf The topics addressed in these templates are Employee Satisfaction Indicators, Internal Promotion Rate All the content presented in this PPT design is completely editable. Download it and make adjustments in color, background, font etc. as per your unique business setting. Following slides shows various KPIs are used to monitor employee engagement which assist in enhancing employee retention .It includes such as employee satisfaction indicators, online branding rating , turnover rate, etc.
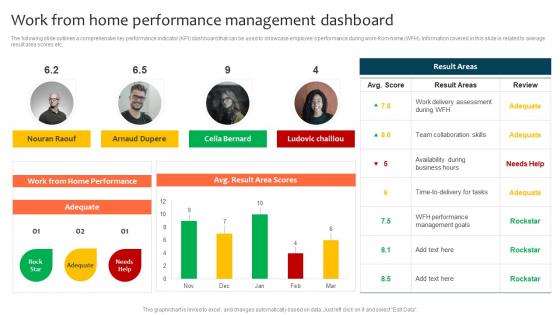
Work From Home Performance Management Dashboard Optimizing Staff Retention Rate Topics Pdf
The following slide outlines a comprehensive key performance indicator KPI dashboard that can be used to showcase employees performance during work-from-home WFH. Information covered in this slide is related to average result area scores etc. This Work From Home Performance Management Dashboard Optimizing Staff Retention Rate Topics Pdf is perfect for any presentation, be it in front of clients or colleagues. It is a versatile and stylish solution for organizing your meetings. The Work From Home Performance Management Dashboard Optimizing Staff Retention Rate Topics Pdf features a modern design for your presentation meetings. The adjustable and customizable slides provide unlimited possibilities for acing up your presentation. Slidegeeks has done all the homework before launching the product for you. So, do not wait, grab the presentation templates today The following slide outlines a comprehensive key performance indicator KPI dashboard that can be used to showcase employees performance during work-from-home WFH. Information covered in this slide is related to average result area scores etc.
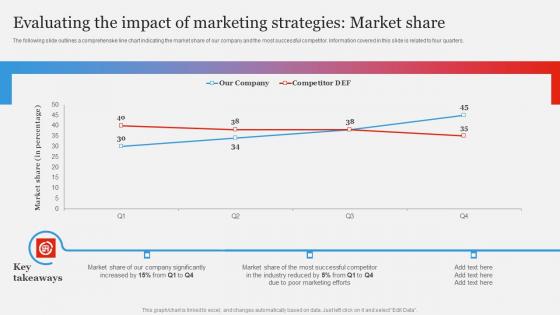
Branding Strategy To Gain Competitive Edge Evaluating Impact Marketing Demonstration Pdf
The following slide outlines a comprehensive line chart indicating the market share of our company and the most successful competitor. Information covered in this slide is related to four quarters. Slidegeeks is one of the best resources for PowerPoint templates. You can download easily and regulate Branding Strategy To Gain Competitive Edge Evaluating Impact Marketing Demonstration Pdf for your personal presentations from our wonderful collection. A few clicks is all it takes to discover and get the most relevant and appropriate templates. Use our Templates to add a unique zing and appeal to your presentation and meetings. All the slides are easy to edit and you can use them even for advertisement purposes. The following slide outlines a comprehensive line chart indicating the market share of our company and the most successful competitor. Information covered in this slide is related to four quarters.
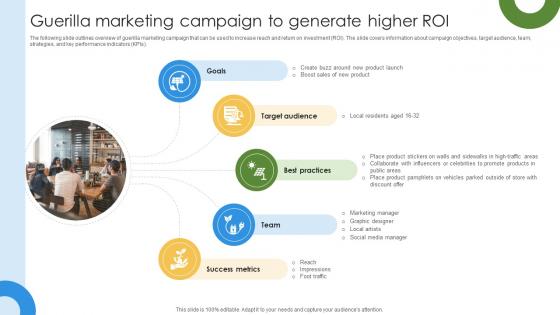
Marketing Growth Strategy Guerilla Marketing Campaign To Generate Higher Roi Strategy SS V
The following slide outlines overview of guerilla marketing campaign that can be used to increase reach and return on investment ROI. The slide covers information about campaign objectives, target audience, team, strategies, and key performance indicators KPIs. If your project calls for a presentation, then Slidegeeks is your go-to partner because we have professionally designed, easy-to-edit templates that are perfect for any presentation. After downloading, you can easily edit Marketing Growth Strategy Guerilla Marketing Campaign To Generate Higher Roi Strategy SS V and make the changes accordingly. You can rearrange slides or fill them with different images. Check out all the handy templates The following slide outlines overview of guerilla marketing campaign that can be used to increase reach and return on investment ROI. The slide covers information about campaign objectives, target audience, team, strategies, and key performance indicators KPIs.

Marketing Growth Strategy KPI Dashboard To Evaluate Sales Performance Strategy SS V
The following slide outlines key performance indicator KPI dashboard to monitor sales performance of company. The key metrics covered in slide are total sales by location, monthly sales trend, average revenue AR by clients, etc. This Marketing Growth Strategy KPI Dashboard To Evaluate Sales Performance Strategy SS V is perfect for any presentation, be it in front of clients or colleagues. It is a versatile and stylish solution for organizing your meetings. The Marketing Growth Strategy KPI Dashboard To Evaluate Sales Performance Strategy SS V features a modern design for your presentation meetings. The adjustable and customizable slides provide unlimited possibilities for acing up your presentation. Slidegeeks has done all the homework before launching the product for you. So, do not wait, grab the presentation templates today The following slide outlines key performance indicator KPI dashboard to monitor sales performance of company. The key metrics covered in slide are total sales by location, monthly sales trend, average revenue AR by clients, etc.
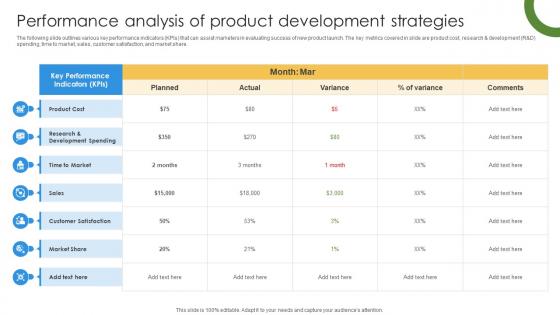
Marketing Growth Strategy To Strengthen Brand Performance Analysis Of Product Strategy SS V
The following slide outlines various key performance indicators KPIs that can assist marketers in evaluating success of new product launch. The key metrics covered in slide are product cost, research and development R and D spending, time to market, sales, customer satisfaction, and market share. If your project calls for a presentation, then Slidegeeks is your go-to partner because we have professionally designed, easy-to-edit templates that are perfect for any presentation. After downloading, you can easily edit Marketing Growth Strategy To Strengthen Brand Performance Analysis Of Product Strategy SS V and make the changes accordingly. You can rearrange slides or fill them with different images. Check out all the handy templates The following slide outlines various key performance indicators KPIs that can assist marketers in evaluating success of new product launch. The key metrics covered in slide are product cost, research and development R and D spending, time to market, sales, customer satisfaction, and market share.
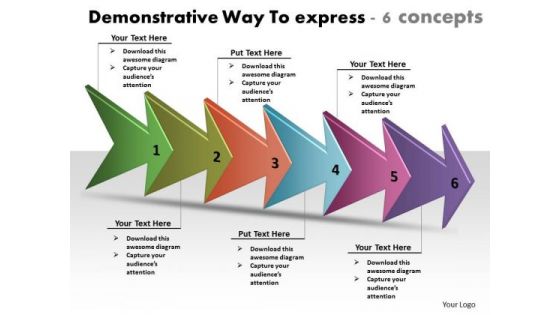
Demonstrative Way To Express 6 Concepts Network Mapping Freeware PowerPoint Templates
We present our demonstrative way to express 6 concepts network mapping freeware PowerPoint templates.Use our Arrows PowerPoint Templates because,You have configured your targets, identified your goals as per priority and importance. Use our Shapes PowerPoint Templates because,You can Raise your Company stocks at the Opening Bell. Use our Signs PowerPoint Templates because,They are the indicators of the path you have in mind. Use our Business PowerPoint Templates because,This layout helps you to bring some important aspects of your business process to the notice of all concerned. Streamline the flow of information across the board Use our Process and Flows PowerPoint Templates because,This slide is Designed to help bullet-point your views and thoughts.Use these PowerPoint slides for presentations relating to adventure, africa, blue, car, danger, democracy, demonstrations, desert, distance, dust, excursion, fels, ferien, flat, gebirge, hamada, holiday destination, horizon, housing, jeep, landscape, might, picking, piste, politics, rally, rallye, road, sahara, sand desert, sky, tourism, travelling, tunis, tunisia, turbulences, vacation. The prominent colors used in the PowerPoint template are Purple, Pink, Blue. People tell us our demonstrative way to express 6 concepts network mapping freeware PowerPoint templates are Dazzling. The feedback we get is that our desert PowerPoint templates and PPT Slides are Attractive. People tell us our demonstrative way to express 6 concepts network mapping freeware PowerPoint templates will help them to explain complicated concepts. Presenters tell us our demonstrations PowerPoint templates and PPT Slides are Great. The feedback we get is that our demonstrative way to express 6 concepts network mapping freeware PowerPoint templates are Colorful. Professionals tell us our car PowerPoint templates and PPT Slides are Chic. Our Demonstrative Way To Express 6 Concepts Network Mapping Freeware PowerPoint Templates are like an excellent buffet. An array of delicious dishes to choose from.
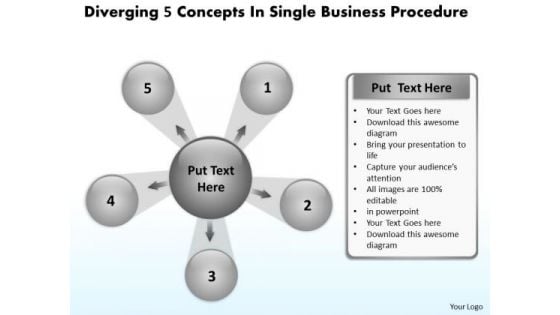
World Business PowerPoint Templates Procedure Cycle Layout Diagram
We present our world business powerpoint templates procedure Cycle Layout Diagram.Download and present our Leadership PowerPoint Templates because you know Coincidentally it will always point to the top. Use our Arrows PowerPoint Templates because this slide can help to bullet point your views. Present our Process and Flows PowerPoint Templates because they are the indicators of the path you have in mind. Download and present our Business PowerPoint Templates because the fruits of your labour are beginning to show.Enlighten them on the great plans you have for their enjoyment. Present our Circle Charts PowerPoint Templates because knowledge is power goes the popular saying.Use these PowerPoint slides for presentations relating to Arrows, Business, Chart, Circle, Company, Concept, Continuity, Continuous, Cycle, Dependency, Diagram, Direction, Dynamic, Endless, Feeds, Graph, Iteration, Iterative, Method, Path, Phase, Presentation, Process, Production, Progress, Progression, Report, Rotation, Sequence, Succession, Vector. The prominent colors used in the PowerPoint template are White, Gray, Black. Customers tell us our world business powerpoint templates procedure Cycle Layout Diagram will get their audience's attention. PowerPoint presentation experts tell us our Cycle PowerPoint templates and PPT Slides are Efficacious. We assure you our world business powerpoint templates procedure Cycle Layout Diagram are Spectacular. Customers tell us our Cycle PowerPoint templates and PPT Slides are Stylish. We assure you our world business powerpoint templates procedure Cycle Layout Diagram are Fantastic. People tell us our Chart PowerPoint templates and PPT Slides provide great value for your money. Be assured of finding the best projection to highlight your words. Let your thoughts exert some pressure. Our World Business PowerPoint Templates Procedure Cycle Layout Diagram will do the deed.
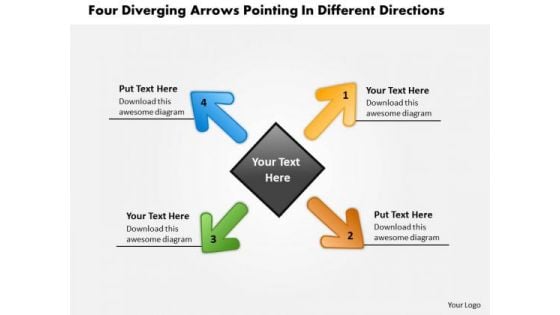
Arrows Pointing Different Directions Circular Flow Chart PowerPoint Templates
We present our arrows pointing different directions Circular Flow Chart PowerPoint templates.Download our Arrows PowerPoint Templates because you can Amplify your views, ideas and thoughts from very basic aspects to the highly technical and complicated issus using this template as a tool. Download our Business PowerPoint Templates because you can Flutter your wings and enchant the world. Impress them with the innate attractiveness of your thoughts and words. Download our Shapes PowerPoint Templates because this slide depicts the occasion for gifting and giving. Download our Metaphors-Visual Concepts PowerPoint Templates because you can Present your views on the methods using our self-explanatory templates. Use our Flow Charts PowerPoint Templates because it Saves your time as a prized possession, an ideal aid to give an ideal presentation.Use these PowerPoint slides for presentations relating to arrow, arrowheads, badge, banner, blue, button, cerulean, cobalt, colored, colorful, connection, cursor, cyan, design element, designator, directional, download, emblem, gray shadow, green, icon, indicator, interface, internet, link, load, magenta, marker, matted, menu tool, navigation panel, next, orientation, page site, pictogram, pink, pointer, red, right, satined, sign, signpost, smooth, symbol, upload, vector illustration, web, web 2.0, white background. The prominent colors used in the PowerPoint template are Green, Blue, Orange. Presenters tell us our arrows pointing different directions Circular Flow Chart PowerPoint templates have awesome images to get your point across. You can be sure our colored PowerPoint templates and PPT Slides are Functional. Professionals tell us our arrows pointing different directions Circular Flow Chart PowerPoint templates are visually appealing. People tell us our banner PowerPoint templates and PPT Slides are Nice. People tell us our arrows pointing different directions Circular Flow Chart PowerPoint templates are Efficacious. Professionals tell us our blue PowerPoint templates and PPT Slides are Royal. Burst through the ceiling with our Arrows Pointing Different Directions Circular Flow Chart PowerPoint Templates. Rise strongly above created barriers.
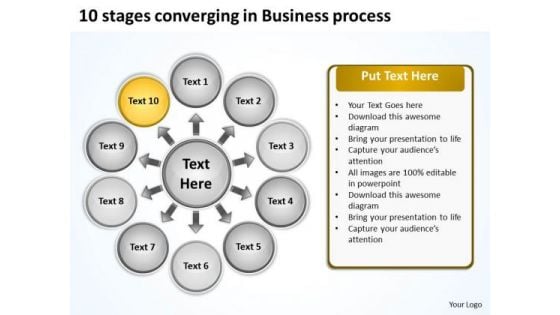
PowerPoint Templates Free Download Process Circular Flow Diagram
We present our powerpoint templates free download process Circular Flow Diagram.Download our Ring charts PowerPoint Templates because you must Evolve the strategy to take you down the required path with appropriate, efficient and effective marketing along the way. Download and present our Circle charts PowerPoint Templates because this slide Probe the minds of your colleagues, see their faces light up as they assimilate and understand the value of your suggestions. Download and present our Business PowerPoint Templates because it helps you to explain your plans in all earnest to your colleagues and raise the bar for all. Present our Process and Flows PowerPoint Templates because you know that the core of any organisation is the people who work for it. Use our Marketing PowerPoint Templates because networking is an imperative in todays world. You need to access the views of others. Similarly you need to give access to them of your abilities.Use these PowerPoint slides for presentations relating to Arrowheads, cerulean, circle, circulation, cobalt,colorful, cyan, cycle, element,emblem, grayshadow, green,icon, indicator, interface, internet, label,link, load, marker, motion, movement,navigationpanel, next, orientation, pagsite, pink, pointer, previous, process, reload, rotation, satined, sign, signpost,smooth, sticker, sticky, symbol. The prominent colors used in the PowerPoint template are Yellow, Orange, Gray. Customers tell us our powerpoint templates free download process Circular Flow Diagram are Ultra. We assure you our cobalt PowerPoint templates and PPT Slides are Magical. PowerPoint presentation experts tell us our powerpoint templates free download process Circular Flow Diagram are Awesome. People tell us our cyan PowerPoint templates and PPT Slides are Nice. We assure you our powerpoint templates free download process Circular Flow Diagram are Tasteful. Use our cobalt PowerPoint templates and PPT Slides are Efficient. Become a leader with our PowerPoint Templates Free Download Process Circular Flow Diagram. You will come out on top.
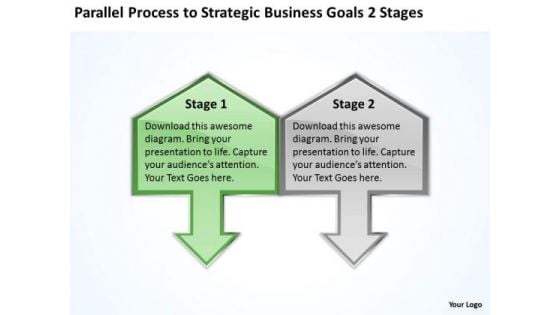
PowerPoint Templates Goals 2 Stages Business Development Plan
We present our powerpoint templates goals 2 stages business development plan.Download and present our Process and Flows PowerPoint Templates because You can Channelise the thoughts of your team with our PowerPoint Templates and Slides. Urge them to focus on the goals you have set. Present our Flow charts PowerPoint Templates because you have to coordinate and motivate your team. Download our Marketing PowerPoint Templates because Our PowerPoint Templates and Slides are truly out of this world. Even the MIB duo has been keeping tabs on our team. Download and present our Success PowerPoint Templates because the success of your venture depends on the performance of every team member. Download and present our Shapes PowerPoint Templates because this an appropriate template to get your ideas across to your target audience.Use these PowerPoint slides for presentations relating to Steps, arrows, design, diagram, directional, drop, element, fahrenheit, flow, gauge, graph, graphic, green, heat, hot, icon, illustration, info graphic, orange, pointer, process, progress, red, segments, set, shadow, steps. The prominent colors used in the PowerPoint template are Green, White, Gray. People tell us our powerpoint templates goals 2 stages business development plan are Lush. You can be sure our flow PowerPoint templates and PPT Slides are designed by professionals People tell us our powerpoint templates goals 2 stages business development plan are Fabulous. PowerPoint presentation experts tell us our diagram PowerPoint templates and PPT Slides are Delightful. You can be sure our powerpoint templates goals 2 stages business development plan are Stylish. People tell us our fahrenheit PowerPoint templates and PPT Slides are Efficacious. Exploit the ability of our PowerPoint Templates Goals 2 Stages Business Development Plan. They have many a useful attribute.
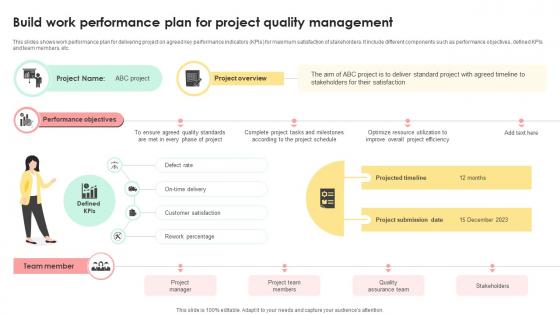
Administering Quality Assurance Build Work Performance Plan For Project Quality Management PM SS V
This slides shows work performance plan for delivering project on agreed key performance indicators KPIs for maximum satisfaction of stakeholders. It include different components such as performance objectives, defined KPIs and team members, etc. Slidegeeks is one of the best resources for PowerPoint templates. You can download easily and regulate Administering Quality Assurance Build Work Performance Plan For Project Quality Management PM SS V for your personal presentations from our wonderful collection. A few clicks is all it takes to discover and get the most relevant and appropriate templates. Use our Templates to add a unique zing and appeal to your presentation and meetings. All the slides are easy to edit and you can use them even for advertisement purposes. This slides shows work performance plan for delivering project on agreed key performance indicators KPIs for maximum satisfaction of stakeholders. It include different components such as performance objectives, defined KPIs and team members, etc.
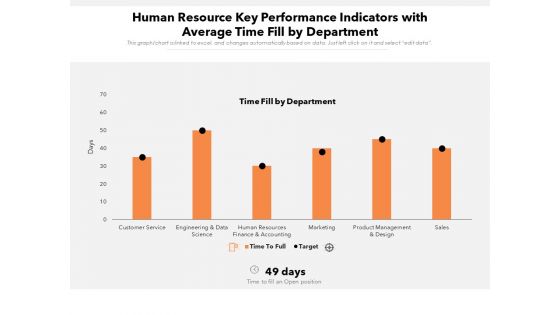
Human Resource Key Performance Indicators With Average Time Fill By Department Ppt PowerPoint Presentation Gallery Example Introduction PDF
Showcasing this set of slides titled human resource key performance indicators with average time fill by department ppt powerpoint presentation gallery example introduction pdf. The topics addressed in these templates are sales, service, finance. All the content presented in this PPT design is completely editable. Download it and make adjustments in color, background, font etc. as per your unique business setting.
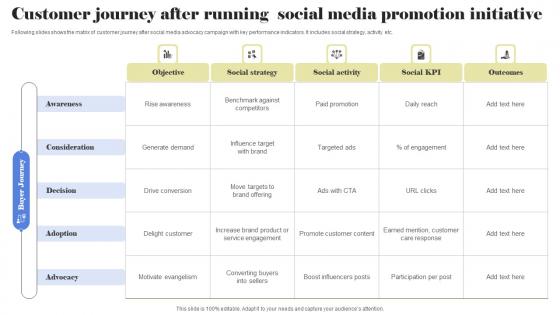
Customer Journey After Running Social Media Promotion Initiative Themes Pdf
Following slides shows the matrix of customer journey after social media advocacy campaign with key performance indicators. It includes social strategy, activity etc. Pitch your topic with ease and precision using this Customer Journey After Running Social Media Promotion Initiative Themes Pdf This layout presents information on Generate Demand, Rise Awareness, Motivate Evangelism It is also available for immediate download and adjustment. So, changes can be made in the color, design, graphics or any other component to create a unique layout. Following slides shows the matrix of customer journey after social media advocacy campaign with key performance indicators. It includes social strategy, activity etc.
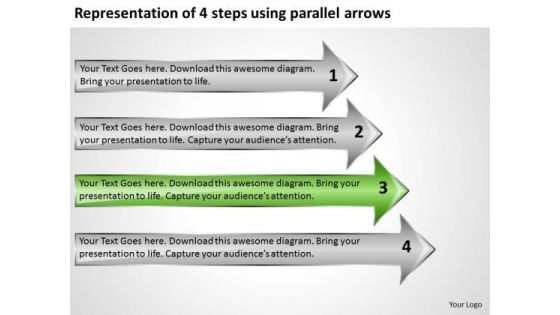
Representation Of 4 Steps Using Parallel Arrows Model Business Plans PowerPoint Templates
We present our representation of 4 steps using parallel arrows model business plans PowerPoint templates.Download and present our Arrows PowerPoint Templates because this diagram helps you to discuss each step slowly but surely move up the pyramid narrowing down to the best and most success oriented project. Download and present our Flow charts PowerPoint Templates because with the help of our Slides you can Illustrate your plans to your listeners with the same accuracy. Present our Process and Flows PowerPoint Templates because this slide helps you to give your team an overview of your capability and insight into the minute details of the overall picture highlighting the interdependence at every operational level. Present our Business PowerPoint Templates because you have had your share of being a goldfish in a small bowl.you are ready to launch out and spread your wings. Present our Marketing PowerPoint Templates because you can Present your views on the methods using our self-explanatory templates.Use these PowerPoint slides for presentations relating to Arrows, flow charts, success, four arrows, steps, flow steps, process arrows, arrows steps, shapes, charts, colorful, centigrade, chart, clip, clipart, cold, design, diagram, directional, drop, element, fahrenheit, flow, gauge, graph, graphic,blue, heat, hot, icon, illustration, info graphic, pointer, process, progress, segments, set. The prominent colors used in the PowerPoint template are Green, White, Gray. People tell us our representation of 4 steps using parallel arrows model business plans PowerPoint templates are Gorgeous. You can be sure our arrows PowerPoint templates and PPT Slides are Liberated. People tell us our representation of 4 steps using parallel arrows model business plans PowerPoint templates provide great value for your money. Be assured of finding the best projection to highlight your words. PowerPoint presentation experts tell us our four PowerPoint templates and PPT Slides are Luxurious. You can be sure our representation of 4 steps using parallel arrows model business plans PowerPoint templates are Fashionable. People tell us our arrows PowerPoint templates and PPT Slides will get their audience's attention. Be clear and crisp with our Representation Of 4 Steps Using Parallel Arrows Model Business Plans PowerPoint Templates. All dillemas will begin to disappear.
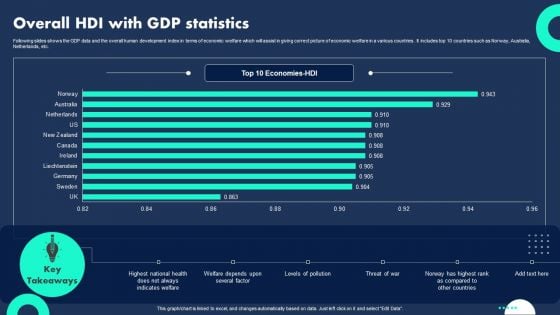
Overall HDI With Gdp Statistics Professional PDF
Following slides shows the GDP data and the overall human development index in terms of economic welfare which will assist in giving correct picture of economic welfare in a various countries . It includes top 10 countries such as Norway, Australia, Netherlands, etc. Showcasing this set of slides titled Overall HDI With Gdp Statistics Professional PDF. The topics addressed in these templates are Indicates Welfare, Welfare Depends, Levels Pollution. All the content presented in this PPT design is completely editable. Download it and make adjustments in color, background, font etc. as per your unique business setting.
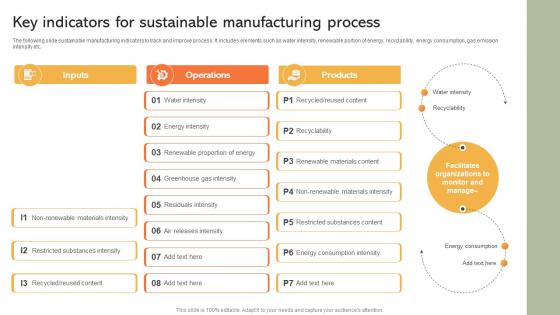
Key Indicators For Sustainable Manufacturing Implementing Manufacturing Strategy SS V
The following slide sustainable manufacturing indicators to track and improve process. It includes elements such as water intensity, renewable portion of energy, recyclability, energy consumption, gas emission intensity etc. Presenting this PowerPoint presentation, titled Key Indicators For Sustainable Manufacturing Implementing Manufacturing Strategy SS V, with topics curated by our researchers after extensive research. This editable presentation is available for immediate download and provides attractive features when used. Download now and captivate your audience. Presenting this Key Indicators For Sustainable Manufacturing Implementing Manufacturing Strategy SS V. Our researchers have carefully researched and created these slides with all aspects taken into consideration. This is a completely customizable Key Indicators For Sustainable Manufacturing Implementing Manufacturing Strategy SS V that is available for immediate downloading. Download now and make an impact on your audience. Highlight the attractive features available with our PPTs. The following slide sustainable manufacturing indicators to track and improve process. It includes elements such as water intensity, renewable portion of energy, recyclability, energy consumption, gas emission intensity etc.
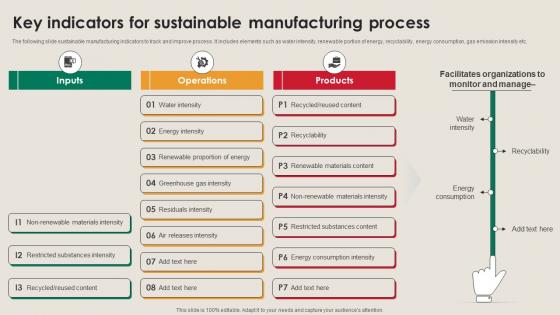
Key Indicators For Sustainable Manufacturing Strategy Driving Industry 4 0
The following slide sustainable manufacturing indicators to track and improve process. It includes elements such as water intensity, renewable portion of energy, recyclability, energy consumption, gas emission intensity etc. Presenting this PowerPoint presentation, titled Key Indicators For Sustainable Manufacturing Strategy Driving Industry 4 0, with topics curated by our researchers after extensive research. This editable presentation is available for immediate download and provides attractive features when used. Download now and captivate your audience. Presenting this Key Indicators For Sustainable Manufacturing Strategy Driving Industry 4 0. Our researchers have carefully researched and created these slides with all aspects taken into consideration. This is a completely customizable Key Indicators For Sustainable Manufacturing Strategy Driving Industry 4 0 that is available for immediate downloading. Download now and make an impact on your audience. Highlight the attractive features available with our PPTs. The following slide sustainable manufacturing indicators to track and improve process. It includes elements such as water intensity, renewable portion of energy, recyclability, energy consumption, gas emission intensity etc.
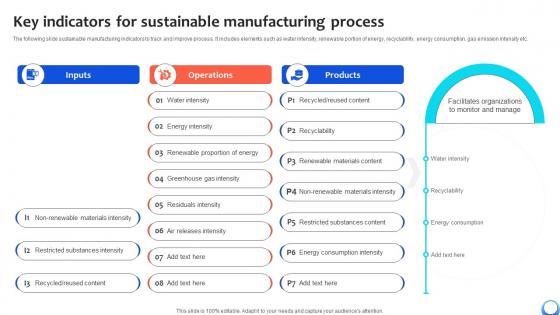
Key Indicators For Sustainable Manufacturing Automating Production Process Strategy SS V
The following slide sustainable manufacturing indicators to track and improve process. It includes elements such as water intensity, renewable portion of energy, recyclability, energy consumption, gas emission intensity etc. Presenting this PowerPoint presentation, titled Key Indicators For Sustainable Manufacturing Automating Production Process Strategy SS V, with topics curated by our researchers after extensive research. This editable presentation is available for immediate download and provides attractive features when used. Download now and captivate your audience. Presenting this Key Indicators For Sustainable Manufacturing Automating Production Process Strategy SS V. Our researchers have carefully researched and created these slides with all aspects taken into consideration. This is a completely customizable Key Indicators For Sustainable Manufacturing Automating Production Process Strategy SS V that is available for immediate downloading. Download now and make an impact on your audience. Highlight the attractive features available with our PPTs. The following slide sustainable manufacturing indicators to track and improve process. It includes elements such as water intensity, renewable portion of energy, recyclability, energy consumption, gas emission intensity etc.
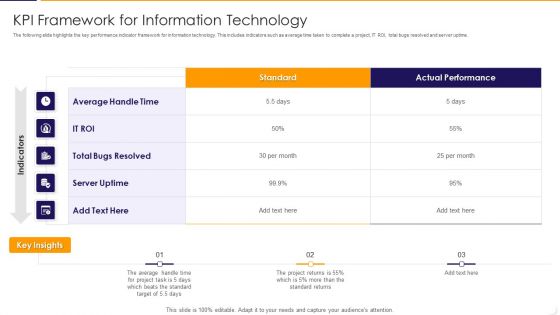
KPI Framework For Information Technology Ppt PowerPoint Presentation Gallery Clipart Images PDF
The following slide highlights the key performance indicator framework for information technology. This includes indicators such as average time taken to complete a project, IT ROI, total bugs resolved and server uptime. Showcasing this set of slides titled kpi framework for information technology ppt powerpoint presentation gallery clipart images pdf The topics addressed in these templates are average, target, performance All the content presented in this PPT design is completely editable. Download it and make adjustments in color, background, font etc. as per your unique business setting.
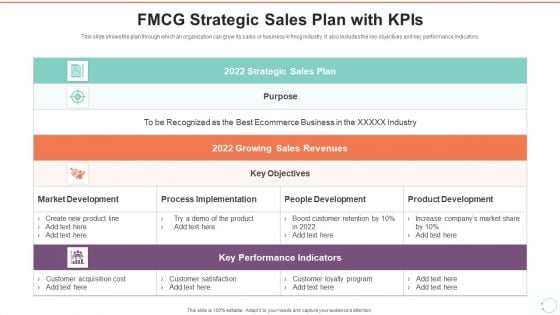
FMCG Strategic Sales Plan With Kpis Template PDF
This slide shows the plan through which an organization can grow its sales or business in fmcg industry. It also includes the key objectives and key performance indicators. Showcasing this set of slides titled FMCG Strategic Sales Plan With Kpis Template PDF The topics addressed in these templates are Strategic Sales Plan, Growing Sales Revenues, Key Performance Indicators All the content presented in this PPT design is completely editable. Download it and make adjustments in color, background, font etc. as per your unique business setting.
Insider Threat In Cyber Security User Tracking Sheet With Impact Assessment Inspiration PDF
This slide shows user tracking sheet for insider threat with impact assessment. It provides details such as user behavior, indicator type, impact on security information and event manage SIEM, impact on interference framework, etc. Showcasing this set of slides titled Insider Threat In Cyber Security User Tracking Sheet With Impact Assessment Inspiration PDF. The topics addressed in these templates are Indicator Type, Impact On SIEM, Interference Framework. All the content presented in this PPT design is completely editable. Download it and make adjustments in color, background, font etc. as per your unique business setting.
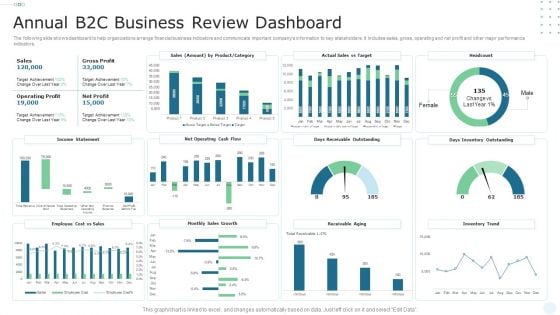
Annual B2C Business Review Dashboard Microsoft PDF
The following slide shows dashboard to help organizations arrange financial business indicators and communicate important companys information to key stakeholders. It includes sales, gross, operating and net profit and other major performance indicators. Showcasing this set of slides titled Annual B2C Business Review Dashboard Microsoft PDF. The topics addressed in these templates are Gross Profit, Sales, Operating Profit. All the content presented in this PPT design is completely editable. Download it and make adjustments in color, background, font etc. as per your unique business setting.
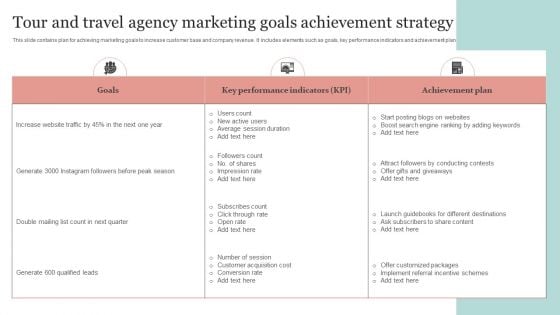
Tour And Travel Agency Marketing Goals Achievement Strategy Ppt PowerPoint Presentation Professional Display PDF
This slide contains plan for achieving marketing goals to increase customer base and company revenue. It includes elements such as goals, key performance indicators and achievement plan.Showcasing this set of slides titled Tour And Travel Agency Marketing Goals Achievement Strategy Ppt PowerPoint Presentation Professional Display PDF. The topics addressed in these templates are Performance Indicators, Achievement Plan, Double Mailing. All the content presented in this PPT design is completely editable. Download it and make adjustments in color, background, font etc. as per your unique business setting.
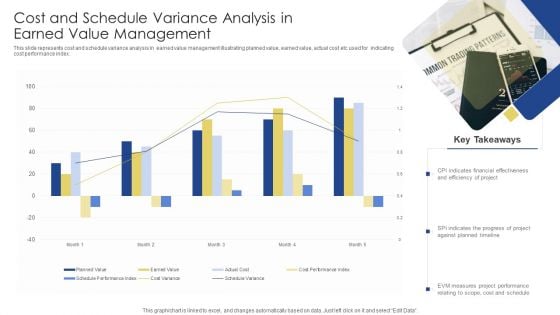
Cost And Schedule Variance Analysis In Earned Value Management Ppt Pictures Design Ideas PDF
This slide represents cost and schedule variance analysis in earned value management illustrating planned value, earned value, actual cost etc used for indicating cost performance index. Showcasing this set of slides titled Cost And Schedule Variance Analysis In Earned Value Management Ppt Pictures Design Ideas PDF. The topics addressed in these templates are CPI Indicates, Financial Effectiveness, Efficiency Project. All the content presented in this PPT design is completely editable. Download it and make adjustments in color, background, font etc. as per your unique business setting.
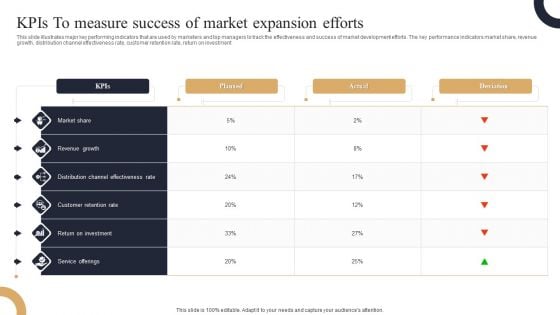
Kpis To Measure Success Of Market Expansion Efforts Portrait PDF
This slide illustrates major key performing indicators that are used by marketers and top managers to track the effectiveness and success of market development efforts. The key performance indicators market share, revenue growth, distribution channel effectiveness rate, customer retention rate, return on investment. Showcasing this set of slides titled Kpis To Measure Success Of Market Expansion Efforts Portrait PDF. The topics addressed in these templates are Revenue Growth, Market Share, Return On Investment. All the content presented in this PPT design is completely editable. Download it and make adjustments in color, background, font etc. as per your unique business setting.


 Continue with Email

 Home
Home


