Meter Slides
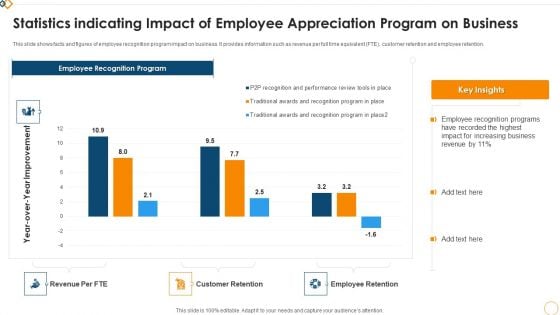
Statistics Indicating Impact Of Employee Appreciation Program On Business Graphics PDF
This slide shows facts and figures of employee recognition program impact on business. It provides information such as revenue per full time equivalent FTE, customer retention and employee retention. Showcasing this set of slides titled Statistics Indicating Impact Of Employee Appreciation Program On Business Graphics PDF. The topics addressed in these templates are Employee Recognition Program, Revenue Per FTE, Customer Retention. All the content presented in this PPT design is completely editable. Download it and make adjustments in color, background, font etc. as per your unique business setting.
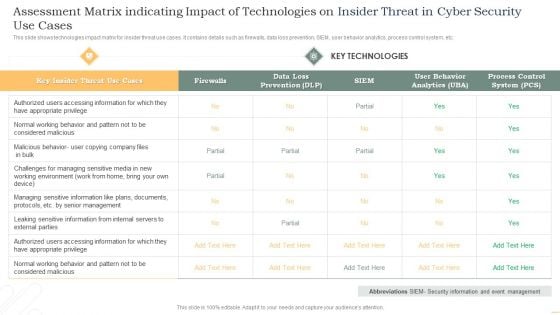
Assessment Matrix Indicating Impact Of Technologies On Insider Threat In Cyber Security Use Cases Themes PDF
This slide shows technologies impact matrix for insider threat use cases. It contains details such as firewalls, data loss prevention, SIEM, user behavior analytics, process control system, etc. Showcasing this set of slides titled Assessment Matrix Indicating Impact Of Technologies On Insider Threat In Cyber Security Use Cases Themes PDF. The topics addressed in these templates are Key Insider, Threat, Use Cases, Key Technologies. All the content presented in this PPT design is completely editable. Download it and make adjustments in color, background, font etc. as per your unique business setting.

5 R2R Key Performance Indicators Ppt PowerPoint Presentation Model Topics PDF
Following slide outlines critical R2R KPIs. Time to close, number of entry corrections, voice of transactions per FTE, growth of CA and process costs are some of the KPIs, which will assist accounts department to measure its overall performance.Showcasing this set of slides titled 5 R2R Key Performance Indicators Ppt PowerPoint Presentation Model Topics PDF. The topics addressed in these templates are Volume Transactions, Process Cost, Entry Corrections. All the content presented in this PPT design is completely editable. Download it and make adjustments in color, background, font etc. as per your unique business setting.
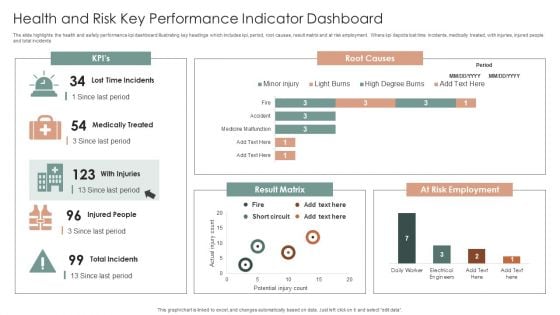
Health And Risk Key Performance Indicator Dashboard Ppt Layouts Graphics Design PDF
The slide highlights the health and safety performance kpi dashboard illustrating key headings which includes kpi, period, root causes, result matrix and at risk employment. Where kpi depicts lost time incidents, medically treated, with injuries, injured people and total incidents. Showcasing this set of slides titled Health And Risk Key Performance Indicator Dashboard Ppt Layouts Graphics Design PDF. The topics addressed in these templates are Root Causes, Result Matrix, At Risk Employment. All the content presented in this PPT design is completely editable. Download it and make adjustments in color, background, font etc. as per your unique business setting.
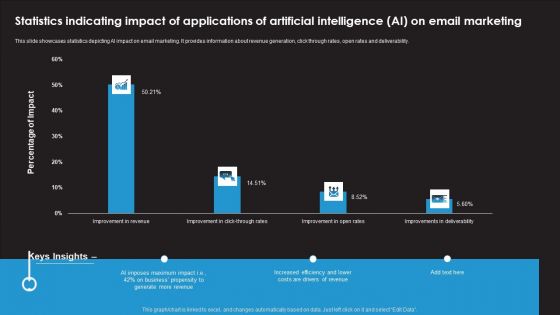
Statistics Indicating Impact Of Applications Of Artificial Intelligence AI On Email Marketing Inspiration PDF
This slide showcases statistics depicting AI impact on email marketing. It provides information about revenue generation, click through rates, open rates and deliverability. Showcasing this set of slides titled Statistics Indicating Impact Of Applications Of Artificial Intelligence AI On Email Marketing Inspiration PDF. The topics addressed in these templates are AI Imposes Maximum Impact, Business Propensity, Increased Efficiency. All the content presented in this PPT design is completely editable. Download it and make adjustments in color, background, font etc. as per your unique business setting.
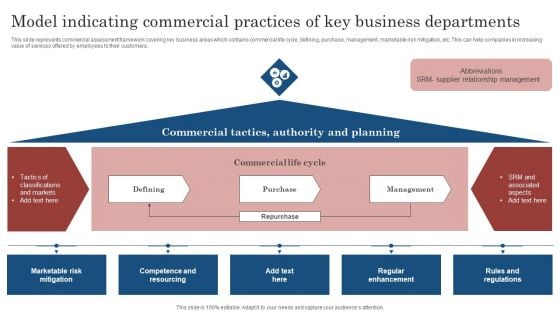
Model Indicating Commercial Practices Of Key Business Departments Ppt File Graphics Design PDF
This slide represents commercial assessment framework covering key business areas which contains commercial life cycle, defining, purchase, management, marketable risk mitigation, etc. This can help companies in increasing value of services offered by employees to their customers. Showcasing this set of slides titled Model Indicating Commercial Practices Of Key Business Departments Ppt File Graphics Design PDF. The topics addressed in these templates are Commercial Tactics, Authority And Planning, Management. All the content presented in this PPT design is completely editable. Download it and make adjustments in color, background, font etc. as per your unique business setting.
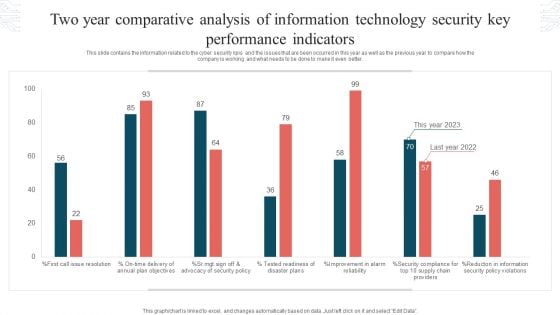
Two Year Comparative Analysis Of Information Technology Security Key Performance Indicators Graphics PDF
This slide contains the information related to the cyber security kpis and the issues that are been occurred in this year as well as the previous year to compare how the company is working and what needs to be done to make it even better. Showcasing this set of slides titled Two Year Comparative Analysis Of Information Technology Security Key Performance Indicators Graphics PDF. The topics addressed in these templates are Tested Readiness, Disaster Plans, Security Policy Violations. All the content presented in this PPT design is completely editable. Download it and make adjustments in color, background, font etc. as per your unique business setting.

Coca Cola Emotional Marketing Strategy Analyzing Brands Key Financial Indicators Topics PDF
This slide illustrates analyzing companys valuation and qualifying accounts. It provides details such as charged costs and expenses, deductions, sales returns, allowances, reserves, etc. Slidegeeks is one of the best resources for PowerPoint templates. You can download easily and regulate Coca Cola Emotional Marketing Strategy Analyzing Brands Key Financial Indicators Topics PDF for your personal presentations from our wonderful collection. A few clicks is all it takes to discover and get the most relevant and appropriate templates. Use our Templates to add a unique zing and appeal to your presentation and meetings. All the slides are easy to edit and you can use them even for advertisement purposes.
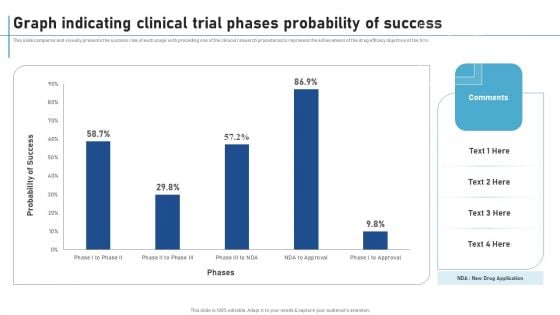
Graph Indicating Clinical Trial Phases Probability Of Success New Clinical Drug Trial Process Information PDF
This slide compares and visually presents the success rate of each stage with preceding one of the clinical research procedures to represent the achievement of the drug efficacy objective of the firm. If your project calls for a presentation, then Slidegeeks is your go-to partner because we have professionally designed, easy-to-edit templates that are perfect for any presentation. After downloading, you can easily edit Graph Indicating Clinical Trial Phases Probability Of Success New Clinical Drug Trial Process Information PDF and make the changes accordingly. You can rearrange slides or fill them with different images. Check out all the handy templates
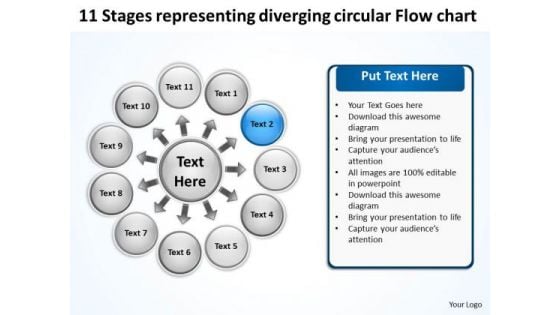
Representing Diverging Circular Flow Chart Process Diagram PowerPoint Templates
We present our representing diverging circular flow chart Process Diagram PowerPoint templates.Use our Ring charts PowerPoint Templates because your group can behave steady in the top bracket. Present our Circle charts PowerPoint Templates because this diagram helps you to harness the opportunities, celebrate your performance till date and focus on greater growth and expansion in coming years. Present our Process and Flows PowerPoint Templates because this slide helps you to give your team an overview of your capability and insight into the minute details of the overall picture highlighting the interdependence at every operational level. Download our Business PowerPoint Templates because you can Flutter your wings and enchant the world. Impress them with the innate attractiveness of your thoughts and words. Download our Marketing PowerPoint Templates because this slide represents the tools of the trade.Use these PowerPoint slides for presentations relating to Button,cerulean, circle, circulation, cobalt,colorful, cyan, cycle, element,emblem, grayshadow, green,icon, indicator, interface, internet, label,link, load, marker, motion, movement,navigationpanel, next, orientation, pagsite, pink, pointer, previous, process, reload, rotation, satined, sign, signpost,smooth, sticker, sticky, symbol. The prominent colors used in the PowerPoint template are Blue, Black, White. Customers tell us our representing diverging circular flow chart Process Diagram PowerPoint templates are Precious. We assure you our cycle PowerPoint templates and PPT Slides are Breathtaking. PowerPoint presentation experts tell us our representing diverging circular flow chart Process Diagram PowerPoint templates are Stunning. People tell us our circulation PowerPoint templates and PPT Slides are Tasteful. We assure you our representing diverging circular flow chart Process Diagram PowerPoint templates are Lush. Use our cyan PowerPoint templates and PPT Slides are Upbeat. Govern your team with our Representing Diverging Circular Flow Chart Process Diagram PowerPoint Templates. Download without worries with our money back guaranteee.
Indicators Employee Engagement Ppt PowerPoint Presentation Layouts Gridlines Cpb
Presenting this set of slides with name indicators employee engagement ppt powerpoint presentation layouts gridlines cpb. This is a four stage process. The stages in this process are indicators employee engagement. This is a completely editable PowerPoint presentation and is available for immediate download. Download now and impress your audience.
Battery Level Indicator Vector Icon Ppt PowerPoint Presentation Outline Layouts
Presenting this set of slides with name battery level indicator vector icon ppt powerpoint presentation outline layouts. This is a six stage process. The stages in this process are battery level indicator vector icon. This is a completely editable PowerPoint presentation and is available for immediate download. Download now and impress your audience.
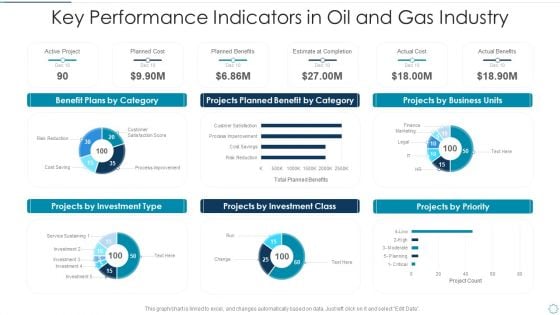
Key Performance Indicators In Oil And Gas Industry Template PDF
Showcasing this set of slides titled key performance indicators in oil and gas industry template pdf. The topics addressed in these templates are key performance indicators in oil and gas industry. All the content presented in this PPT design is completely editable. Download it and make adjustments in color, background, font etc. as per your unique business setting.
Painpoints Icon Indicating Poor Customer Experience Mockup PDF
Showcasing this set of slides titled painpoints icon indicating poor customer experience mockup pdf. The topics addressed in these templates are painpoints icon indicating poor customer experience. All the content presented in this PPT design is completely editable. Download it and make adjustments in color, background, font etc. as per your unique business setting.
Customer Communication Icon Indicating Product Value Message Infographics PDF
Showcasing this set of slides titled customer communication icon indicating product value message infographics pdf. The topics addressed in these templates are customer communication icon indicating product value message. All the content presented in this PPT design is completely editable. Download it and make adjustments in color, background, font etc. as per your unique business setting.
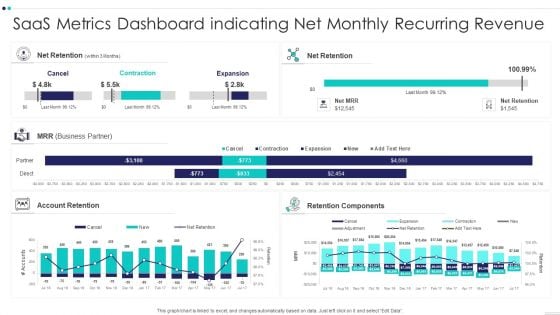
Saas Metrics Dashboard Indicating Net Monthly Recurring Revenue Information PDF
Showcasing this set of slides titled Saas Metrics Dashboard Indicating Net Monthly Recurring Revenue Information PDF The topics addressed in these templates are Saas Metrics Dashboard Indicating Net Monthly Recurring Revenue All the content presented in this PPT design is completely editable. Download it and make adjustments in color, background, font etc. as per your unique business setting.
House Insurance Icon Indicating Digital Browser Guidelines PDF
Showcasing this set of slides titled House Insurance Icon Indicating Digital Browser Guidelines PDF. The topics addressed in these templates are House Insurance Icon Indicating Digital Browser. All the content presented in this PPT design is completely editable. Download it and make adjustments in color, background, font etc. as per your unique business setting.
Employee Key Performance Indicators Dashboard Icon Designs PDF
Showcasing this set of slides titled Employee Key Performance Indicators Dashboard Icon Designs PDF The topics addressed in these templates are Employee Key, Performance Indicators, Dashboard Icon All the content presented in this PPT design is completely editable. Download it and make adjustments in color, background, font etc. as per your unique business setting.
Icon Indicating Alternative Market Growth And Development Tactics Introduction PDF
Showcasing this set of slides titled Icon Indicating Alternative Market Growth And Development Tactics Introduction PDF. The topics addressed in these templates are Icon Indicating Alternative, Market Growth, Development Tactics. All the content presented in this PPT design is completely editable. Download it and make adjustments in color, background, font etc. as per your unique business setting.
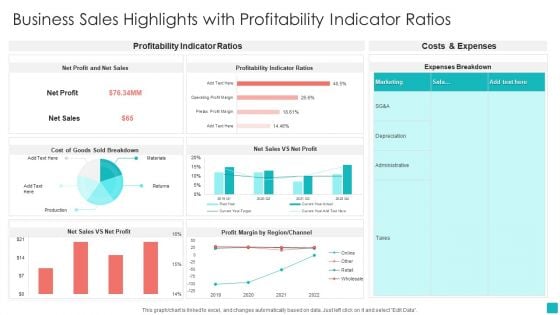
Business Sales Highlights With Profitability Indicator Ratios Download PDF
Showcasing this set of slides titled Business Sales Highlights With Profitability Indicator Ratios Download PDF. The topics addressed in these templates are Net Profit, Net Sales, Profitability Indicator Ratios. All the content presented in this PPT design is completely editable. Download it and make adjustments in color, background, font etc. as per your unique business setting.
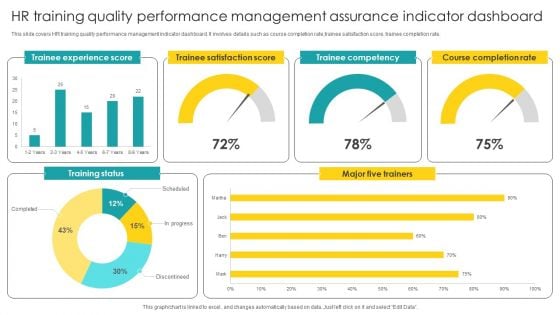
HR Training Quality Performance Management Assurance Indicator Dashboard Structure PDF
Showcasing this set of slides titled HR Training Quality Performance Management Assurance Indicator Dashboard Structure PDF. The topics addressed in these templates are Performance Management, Assurance Indicator Dashboard. All the content presented in this PPT design is completely editable. Download it and make adjustments in color, background, font etc. as per your unique business setting.
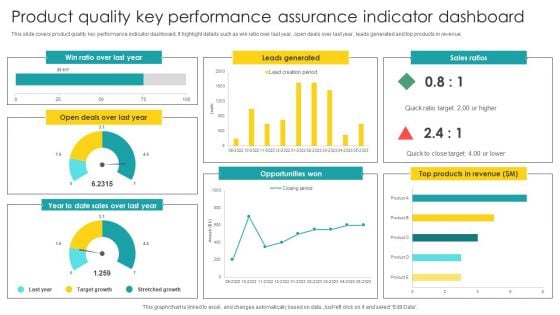
Product Quality Key Performance Assurance Indicator Dashboard Graphics PDF
Showcasing this set of slides titled Product Quality Key Performance Assurance Indicator Dashboard Graphics PDF. The topics addressed in these templates are Key Performance, Assurance Indicator, Dashboard. All the content presented in this PPT design is completely editable. Download it and make adjustments in color, background, font etc. as per your unique business setting.
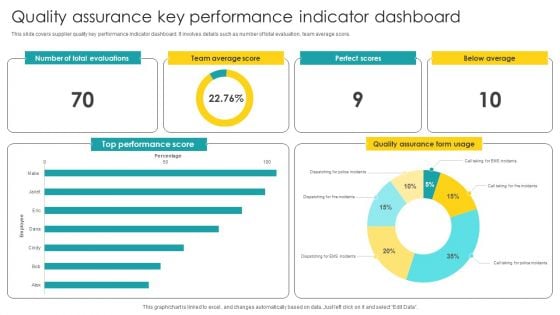
Quality Assurance Key Performance Indicator Dashboard Structure PDF
Showcasing this set of slides titled Quality Assurance Key Performance Indicator Dashboard Structure PDF. The topics addressed in these templates are Key Performance, Indicator Dashboard. All the content presented in this PPT design is completely editable. Download it and make adjustments in color, background, font etc. as per your unique business setting.
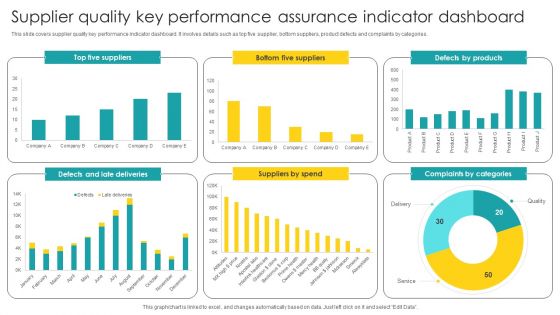
Supplier Quality Key Performance Assurance Indicator Dashboard Diagrams PDF
Showcasing this set of slides titled Supplier Quality Key Performance Assurance Indicator Dashboard Diagrams PDF. The topics addressed in these templates are Supplier Quality, Key Performance, Assurance Indicator. All the content presented in this PPT design is completely editable. Download it and make adjustments in color, background, font etc. as per your unique business setting.
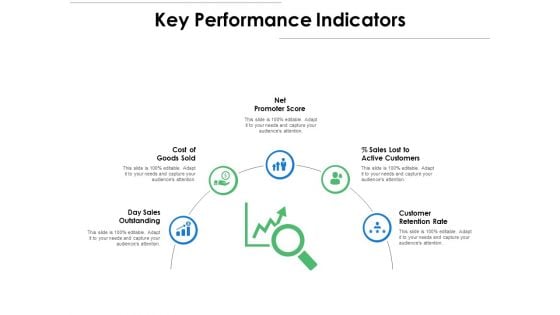
Key Performance Indicators Ppt PowerPoint Presentation Show Graphics Design
Presenting this set of slides with name key performance indicators ppt powerpoint presentation show graphics design. This is a five stage process. The stages in this process are business, management, planning, strategy, marketing. This is a completely editable PowerPoint presentation and is available for immediate download. Download now and impress your audience.
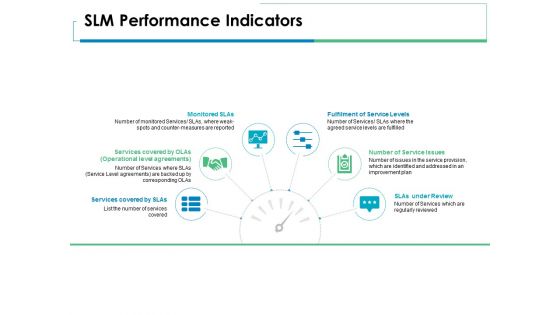
SLM Performance Indicators Ppt PowerPoint Presentation Portfolio Tips
Presenting this set of slides with name slm performance indicators ppt powerpoint presentation portfolio tips. This is a six stage process. The stages in this process are business, management, planning, strategy, marketing. This is a completely editable PowerPoint presentation and is available for immediate download. Download now and impress your audience.
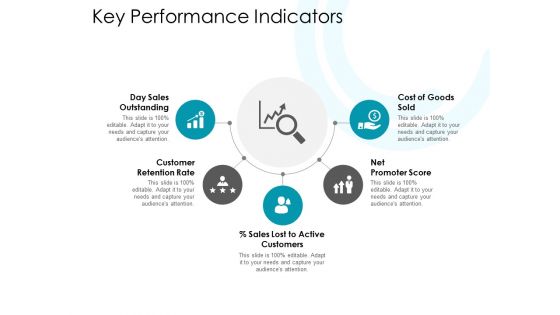
Key Performance Indicators Ppt PowerPoint Presentation Outline Samples
Presenting this set of slides with name key performance indicators ppt powerpoint presentation outline samples. This is a five stage process. The stages in this process are business, management, planning, strategy, marketing. This is a completely editable PowerPoint presentation and is available for immediate download. Download now and impress your audience.
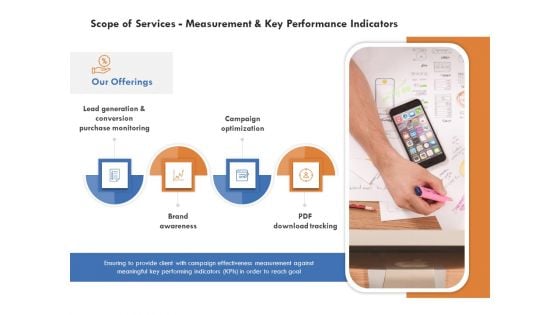
Scope Of Services Measurement And Key Performance Indicators Information PDF
Presenting this set of slides with name scope of services measurement and key performance indicators information pdf. This is a four stage process. The stages in this process are lead generation and conversion purchase monitoring, brand awareness, campaign optimization, pdf download tracking. This is a completely editable PowerPoint presentation and is available for immediate download. Download now and impress your audience.
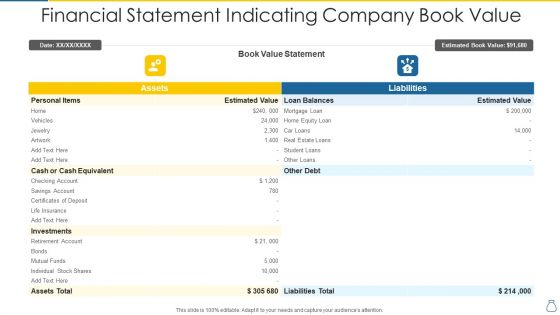
Financial Statement Indicating Company Book Value Mockup PDF
Showcasing this set of slides titled financial statement indicating company book value mockup pdf. The topics addressed in these templates are book value statement, assets, liabilities. All the content presented in this PPT design is completely editable. Download it and make adjustments in color, background, font etc. as per your unique business setting.
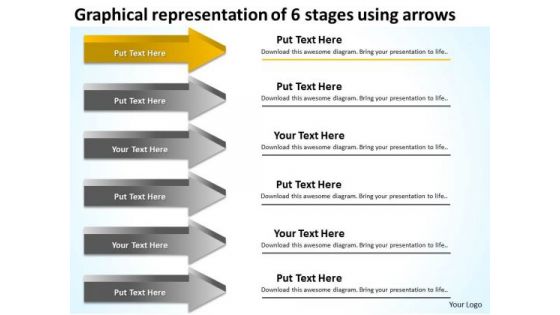
Representation Of 6 Stages Using Arrows Business Plan PowerPoint Templates
We present our representation of 6 stages using arrows business plan PowerPoint templates.Use our Process and Flows PowerPoint Templates because your findings are here to help arrive at an accurate diagnosis. Present our Arrows PowerPoint Templates because others naturally tend to follow in the path blazed by you. Download and present our Business PowerPoint Templates because you are ready to flap your wings and launch off. All poised are you to touch the sky with glory. Use our Flow Charts PowerPoint Templates because this slide is Designed to help bullet-point your views and thoughts. Download our Shapes PowerPoint Templates because it provides visual depictions of the flow of activities.Use these PowerPoint slides for presentations relating to Arrows, flow charts, success, six arrows, steps, flow steps, process arrows, arrows steps, shapes, charts, colorful, centigrade, chart, clip, clipart, cold, design, diagram, directional, drop, element, fahrenheit, flow, gauge, graph, graphic,blue, heat, hot, icon, illustration, info graphic, pointer, process, progress, segments, set. The prominent colors used in the PowerPoint template are Yellow, Gray, White. People tell us our representation of 6 stages using arrows business plan PowerPoint templates provide great value for your money. Be assured of finding the best projection to highlight your words. You can be sure our flow PowerPoint templates and PPT Slides will help them to explain complicated concepts. People tell us our representation of 6 stages using arrows business plan PowerPoint templates are Zippy. PowerPoint presentation experts tell us our six PowerPoint templates and PPT Slides are Quaint. You can be sure our representation of 6 stages using arrows business plan PowerPoint templates are Beautiful. People tell us our steps PowerPoint templates and PPT Slides are Spectacular. Do a commendable job with our Representation Of 6 Stages Using Arrows Business Plan PowerPoint Templates. Your audience will keep clapping for you.
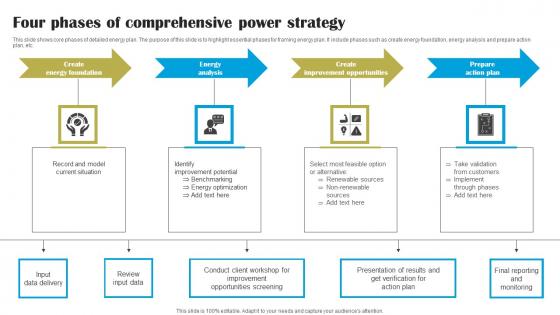
Four Phases Of Comprehensive Power Strategy Inspiration Pdf
This slide shows key performance indicators for energy plan. The purpose of this slide is to highlight main key performance indicators that should be considered for performance measurement. It include indicators such as facility wide units and process unit levels, etc.Showcasing this set of slides titled Four Phases Of Comprehensive Power Strategy Inspiration Pdf The topics addressed in these templates are Energy Analysis, Improvement Opportunities, Prepare Action Plan All the content presented in this PPT design is completely editable. Download it and make adjustments in color, background, font etc. as per your unique business setting. This slide shows key performance indicators for energy plan. The purpose of this slide is to highlight main key performance indicators that should be considered for performance measurement. It include indicators such as facility wide units and process unit levels, etc.
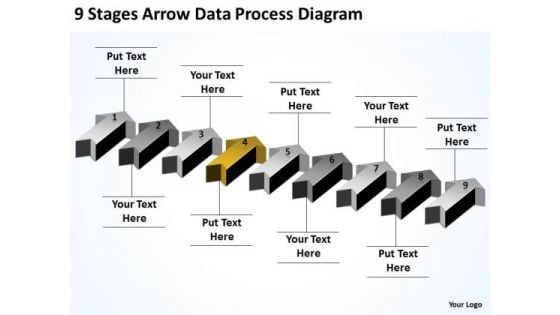
Applications Of Parallel Processing 9 Stages Arrow Data Diagram PowerPoint Templates
We present our applications of parallel processing 9 stages arrow data diagram PowerPoint templates.Present our Process and Flows PowerPoint Templates because You can Be the puppeteer with our PowerPoint Templates and Slides as your strings. Lead your team through the steps of your script. Download and present our Arrows PowerPoint Templates because Our PowerPoint Templates and Slides ensures Effective communication. They help you put across your views with precision and clarity. Download our Steps PowerPoint Templates because Our PowerPoint Templates and Slides will let you Leave a lasting impression to your audiences. They possess an inherent longstanding recall factor. Download our Success PowerPoint Templates because Our PowerPoint Templates and Slides are specially created by a professional team with vast experience. They diligently strive to come up with the right vehicle for your brilliant Ideas. Download our Business PowerPoint Templates because Our PowerPoint Templates and Slides will let you Leave a lasting impression to your audiences. They possess an inherent longstanding recall factor.Use these PowerPoint slides for presentations relating to Arrow, completed, completion, concept, confirmation,design, flow, four, graphic, illustration, indication, indicator, information, layout, measurement, modern, number, one, order, phase, pointer, process, progress, purple, reflection, scale, send, set, shape, sign, two, violet, web, web design, websites, work flow. The prominent colors used in the PowerPoint template are Yellow, Gray, Black. The feedback we get is that our applications of parallel processing 9 stages arrow data diagram PowerPoint templates are incredible easy to use. Professionals tell us our concept PowerPoint templates and PPT Slides will get their audience's attention. Use our applications of parallel processing 9 stages arrow data diagram PowerPoint templates will save the presenter time. Presenters tell us our design PowerPoint templates and PPT Slides have awesome images to get your point across. You can be sure our applications of parallel processing 9 stages arrow data diagram PowerPoint templates are visually appealing. PowerPoint presentation experts tell us our graphic PowerPoint templates and PPT Slides are effectively colour coded to prioritise your plans They automatically highlight the sequence of events you desire. Drive to success with our Applications Of Parallel Processing 9 Stages Arrow Data Diagram PowerPoint Templates. You will come out on top.
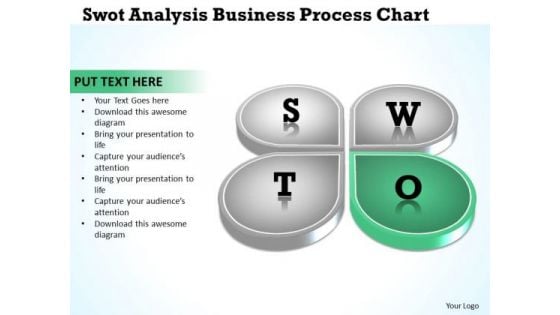
Business Logic Diagram Analysis PowerPoint Theme Process Chart Ppt Templates
We present our business logic diagram analysis powerpoint theme process chart ppt templates.Download and present our Business PowerPoint Templates because Our PowerPoint Templates and Slides are conceived by a dedicated team. Use them and give form to your wondrous ideas. Download and present our Shapes PowerPoint Templates because These PowerPoint Templates and Slides will give the updraft to your ideas. See them soar to great heights with ease. Use our Success PowerPoint Templates because You can Create a matrix with our PowerPoint Templates and Slides. Feel the strength of your ideas click into place. Download and present our Flow Charts PowerPoint Templates because You canTake a leap off the starting blocks with our PowerPoint Templates and Slides. They will put you ahead of the competition in quick time. Download and present our Process and Flows PowerPoint Templates because Our PowerPoint Templates and Slides will bullet point your ideas. See them fall into place one by one.Use these PowerPoint slides for presentations relating to Business, center, circle, circular, circulation, concept, control, cycle, development, diagram, direction, flow, graphic, green, idea, illustration, indicator, iterative, life, lifecycle, loop, management, method, mix, motion, movement, nature, pointer, process, propeller, quality, range, recycling, research, ring, rotation, round, schema, spectrum, spiral, step, strategy, success. The prominent colors used in the PowerPoint template are Green, Gray, White. People tell us our business logic diagram analysis powerpoint theme process chart ppt templates are designed by a team of presentation professionals. PowerPoint presentation experts tell us our circular PowerPoint templates and PPT Slides are designed by professionals Presenters tell us our business logic diagram analysis powerpoint theme process chart ppt templates are aesthetically designed to attract attention. We guarantee that they will grab all the eyeballs you need. Use our control PowerPoint templates and PPT Slides will impress their bosses and teams. Customers tell us our business logic diagram analysis powerpoint theme process chart ppt templates are designed by a team of presentation professionals. People tell us our circular PowerPoint templates and PPT Slides are aesthetically designed to attract attention. We guarantee that they will grab all the eyeballs you need. Dont ignore the perils of a boring presentation. Liven it up with our Business Logic Diagram Analysis PowerPoint Theme Process Chart Ppt Templates. Make sure your presentation gets the attention it deserves.
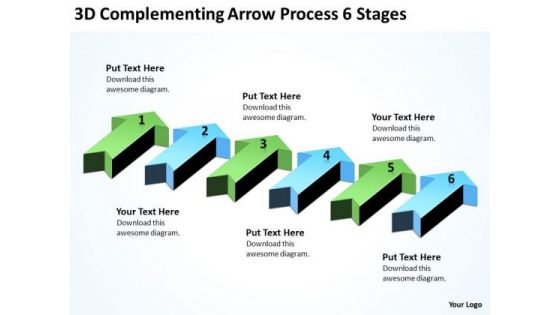
Parallel Processing Application 3d Complementing Arrow 6 Stages PowerPoint Templates
We present our parallel processing application 3d complementing arrow 6 stages PowerPoint templates.Download and present our Arrows PowerPoint Templates because Our PowerPoint Templates and Slides will embellish your thoughts. See them provide the desired motivation to your team. Download and present our Marketing PowerPoint Templates because Our PowerPoint Templates and Slides will definately Enhance the stature of your presentation. Adorn the beauty of your thoughts with their colourful backgrounds. Present our Business PowerPoint Templates because Our PowerPoint Templates and Slides will Embellish your thoughts. They will help you illustrate the brilliance of your ideas. Download and present our Signs PowerPoint Templates because Our PowerPoint Templates and Slides will let your words and thoughts hit bullseye everytime. Download and present our Shapes PowerPoint Templates because Our PowerPoint Templates and Slides will embellish your thoughts. See them provide the desired motivation to your team.Use these PowerPoint slides for presentations relating to Arrow, Banner, Bar, Collection, Completion, Concept, Confirmation, Design, Flow, Graph, Graphic, Illustration, Indication, Information, Instruction, Interface, Internet, Layout, Measurement, Modern, Number, Order, Phase, Pointer, Process, Progress, Reflection, Scale, Shape, Stage, Status, Step, Template, Two, Vector, Web, Web . The prominent colors used in the PowerPoint template are Black, Blue, Green. Customers tell us our parallel processing application 3d complementing arrow 6 stages PowerPoint templates will make you look like a winner. We assure you our Completion PowerPoint templates and PPT Slides effectively help you save your valuable time. Use our parallel processing application 3d complementing arrow 6 stages PowerPoint templates will make the presenter look like a pro even if they are not computer savvy. You can be sure our Flow PowerPoint templates and PPT Slides will make the presenter successul in his career/life. PowerPoint presentation experts tell us our parallel processing application 3d complementing arrow 6 stages PowerPoint templates provide great value for your money. Be assured of finding the best projection to highlight your words. The feedback we get is that our Design PowerPoint templates and PPT Slides will make the presenter look like a pro even if they are not computer savvy. Cheat failure with our Parallel Processing Application 3d Complementing Arrow 6 Stages PowerPoint Templates. You will come out on top.

Key Performance Indicators Of IBN Outsourcing Company PPT Presentation SS
The slide shows the key Performance Indicator KPIs which will help the company to track the success rate of implemented strategies. Some of the KPIs are Customer Attrition Rate, Product, Service Adoption Rate, Average Customer Queue Time , Customer Satisfaction Rate etc. Are you in need of a template that can accommodate all of your creative concepts This one is crafted professionally and can be altered to fit any style. Use it with Google Slides or PowerPoint. Include striking photographs, symbols, depictions, and other visuals. Fill, move around, or remove text boxes as desired. Test out color palettes and font mixtures. Edit and save your work, or work with colleagues. Download Key Performance Indicators Of IBN Outsourcing Company PPT Presentation SS and observe how to make your presentation outstanding. Give an impeccable presentation to your group and make your presentation unforgettable. The slide shows the key Performance Indicator KPIs which will help the company to track the success rate of implemented strategies. Some of the KPIs are Customer Attrition Rate, Product, Service Adoption Rate, Average Customer Queue Time , Customer Satisfaction Rate etc.
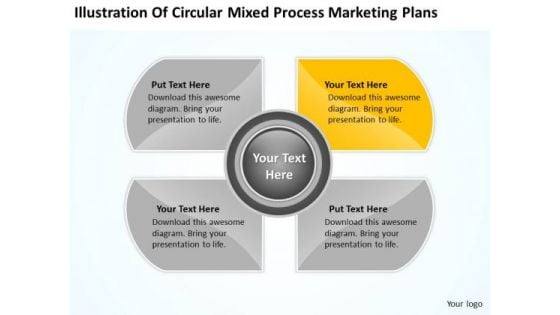
Circular Mixed Process Marketing Plans Ppt Business Software Download PowerPoint Templates
We present our circular mixed process marketing plans ppt business software download PowerPoint templates.Present our Process and Flows PowerPoint Templates because Our PowerPoint Templates and Slides ensures Effective communication. They help you put across your views with precision and clarity. Use our Flow Charts PowerPoint Templates because you can Break through with our PowerPoint Templates and Slides. Bring down the mental barriers of your audience. Download our Business PowerPoint Templates because Our PowerPoint Templates and Slides will let you meet your Deadlines. Present our Marketing PowerPoint Templates because They will bring a lot to the table. Their alluring flavours will make your audience salivate. Download our Shapes PowerPoint Templates because Our PowerPoint Templates and Slides will let you Hit the target. Go the full distance with ease and elan.Use these PowerPoint slides for presentations relating to Flow, process, step, business, concept, vector, success, diagram, circle, graphic, idea, development, management, illustration, circular, system, strategy, round, research, center, direction, method, quality, mix, indicator. The prominent colors used in the PowerPoint template are Yellow, Gray, White. Your thoughts and our Circular Mixed Process Marketing Plans Ppt Business Software Download PowerPoint Templates will display great chemistry. They will develop a lasting equation.
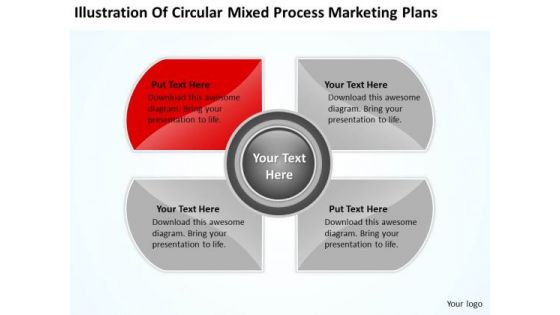
Circular Mixed Process Marketing Plans Ppt Laundromat Business PowerPoint Templates
We present our circular mixed process marketing plans ppt laundromat business PowerPoint templates.Download our Process and Flows PowerPoint Templates because our PowerPoint Templates and Slides will give your ideas the shape. Use our Flow Charts PowerPoint Templates because Our PowerPoint Templates and Slides are effectively colour coded to prioritise your plans They automatically highlight the sequence of events you desire. Download and present our Business PowerPoint Templates because It will get your audience in sync. Present our Marketing PowerPoint Templates because Our PowerPoint Templates and Slides will generate and maintain the level of interest you desire. They will create the impression you want to imprint on your audience. Use our Shapes PowerPoint Templates because you should once Tap the ingenuity of our PowerPoint Templates and Slides. They are programmed to succeed.Use these PowerPoint slides for presentations relating to Flow, process, step, business, concept, vector, success, diagram, circle, graphic, idea, development, management, illustration, circular, system, strategy, round, research, center, direction, method, quality, mix, indicator. The prominent colors used in the PowerPoint template are Red, Gray, White. Meet your audience on equal terms. Level the field with our Circular Mixed Process Marketing Plans Ppt Laundromat Business PowerPoint Templates.

Import And Export Price Indices To Calculate Strategies For Inflation A Tactical Guide Fin SS V
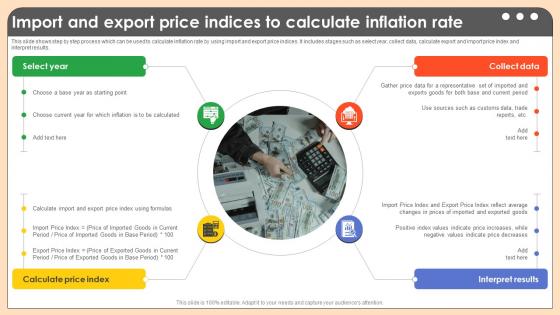
This slide shows step by step process which can be used to calculate inflation rate by using import and export price indices. It includes stages such as select year, collect data, calculate export and import price index and interpret results. This Import And Export Price Indices To Calculate Strategies For Inflation A Tactical Guide Fin SS V is perfect for any presentation, be it in front of clients or colleagues. It is a versatile and stylish solution for organizing your meetings. The Import And Export Price Indices To Calculate Strategies For Inflation A Tactical Guide Fin SS V features a modern design for your presentation meetings. The adjustable and customizable slides provide unlimited possibilities for acing up your presentation. Slidegeeks has done all the homework before launching the product for you. So, do not wait, grab the presentation templates today This slide shows step by step process which can be used to calculate inflation rate by using import and export price indices. It includes stages such as select year, collect data, calculate export and import price index and interpret results.
Import And Export Price Indices To Calculate Comprehensive Guide On Inflation Control CM SS V
This slide shows step by step process which can be used to calculate inflation rate by using import and export price indices. It includes stages such as select year, collect data, calculate export and import price index and interpret results. This Import And Export Price Indices To Calculate Comprehensive Guide On Inflation Control CM SS V is perfect for any presentation, be it in front of clients or colleagues. It is a versatile and stylish solution for organizing your meetings. The Import And Export Price Indices To Calculate Comprehensive Guide On Inflation Control CM SS V features a modern design for your presentation meetings. The adjustable and customizable slides provide unlimited possibilities for acing up your presentation. Slidegeeks has done all the homework before launching the product for you. So, do not wait, grab the presentation templates today This slide shows step by step process which can be used to calculate inflation rate by using import and export price indices. It includes stages such as select year, collect data, calculate export and import price index and interpret results.
Statistics Indicating Adoption And Growth Of Generative ChatGPT And Healthcare Innovation Enhancing AI SS V
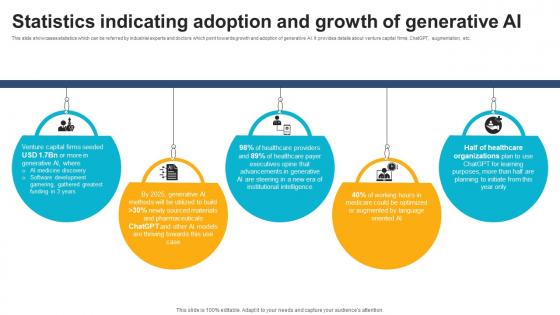
This slide showcases statistics which can be referred by industrial experts and doctors which point towards growth and adoption of generative AI. It provides details about venture capital firms, ChatGPT, augmentation, etc. Here you can discover an assortment of the finest PowerPoint and Google Slides templates. With these templates, you can create presentations for a variety of purposes while simultaneously providing your audience with an eye-catching visual experience. Download Statistics Indicating Adoption And Growth Of Generative ChatGPT And Healthcare Innovation Enhancing AI SS V to deliver an impeccable presentation. These templates will make your job of preparing presentations much quicker, yet still, maintain a high level of quality. Slidegeeks has experienced researchers who prepare these templates and write high-quality content for you. Later on, you can personalize the content by editing the Statistics Indicating Adoption And Growth Of Generative ChatGPT And Healthcare Innovation Enhancing AI SS V. This slide showcases statistics which can be referred by industrial experts and doctors which point towards growth and adoption of generative AI. It provides details about venture capital firms, ChatGPT, augmentation, etc.
Accounts Receivable Key Performance Indicators Ppt PowerPoint Presentation Visual Aids Model Cpb
Presenting this set of slides with name accounts receivable key performance indicators ppt powerpoint presentation visual aids model cpb. This is a three stage process. The stages in this process are accounts receivable key performance indicators. This is a completely editable PowerPoint presentation and is available for immediate download. Download now and impress your audience.
Key Performance Indicators Examples Marketing Ppt PowerPoint Presentation Ideas Clipart Cpb
Presenting this set of slides with name key performance indicators examples marketing ppt powerpoint presentation ideas clipart cpb. This is a four stage process. The stages in this process are key performance indicators examples marketing. This is a completely editable PowerPoint presentation and is available for immediate download. Download now and impress your audience.
Speedometer Performance Indicator Vector Icon Ppt PowerPoint Presentation Show Deck PDF
Presenting this set of slides with name speedometer performance indicator vector icon ppt powerpoint presentation show deck pdf. This is a three stage process. The stages in this process are speedometer performance indicator vector icon. This is a completely editable PowerPoint presentation and is available for immediate download. Download now and impress your audience.
Picture Indicating Yes Or No Business Options Ppt PowerPoint Presentation Styles Elements PDF
Presenting this set of slides with name picture indicating yes or no business options ppt powerpoint presentation styles elements pdf. This is a two stage process. The stages in this process are picture indicating yes or no business options. This is a completely editable PowerPoint presentation and is available for immediate download. Download now and impress your audience.
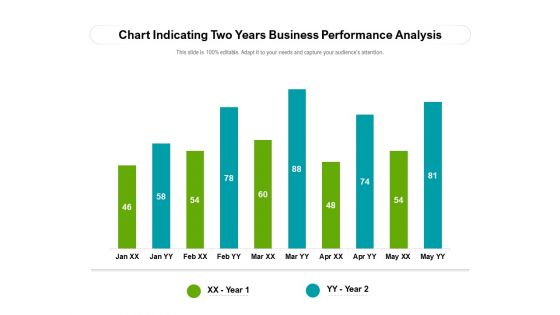
Chart Indicating Two Years Business Performance Analysis Ppt PowerPoint Presentation File Grid PDF
Showcasing this set of slides titled chart indicating two years business performance analysis ppt powerpoint presentation file grid pdf. The topics addressed in these templates are chart indicating two years business performance analysis. All the content presented in this PPT design is completely editable. Download it and make ajustments in color, background, font etc. as per your unique business setting.
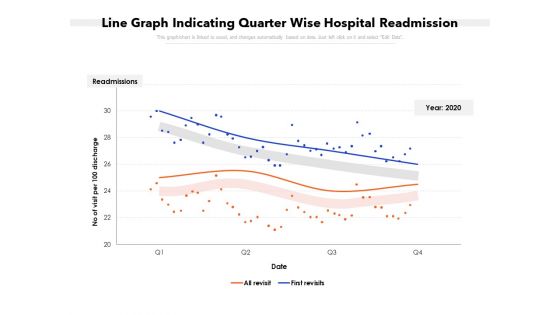
Line Graph Indicating Quarter Wise Hospital Readmission Ppt PowerPoint Presentation Gallery Layouts PDF
Showcasing this set of slides titled line graph indicating quarter wise hospital readmission ppt powerpoint presentation gallery layouts pdf. The topics addressed in these templates are line graph indicating quarter wise hospital readmission. All the content presented in this PPT design is completely editable. Download it and make ajustments in color, background, font etc. as per your unique business setting.
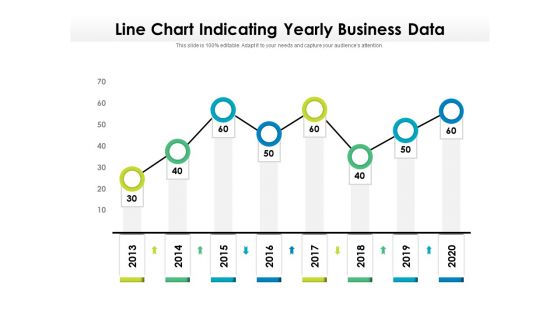
Line Chart Indicating Yearly Business Data Ppt PowerPoint Presentation Styles Deck PDF
Showcasing this set of slides titled line chart indicating yearly business data ppt powerpoint presentation styles deck pdf. The topics addressed in these templates are line chart indicating yearly business data, 2013 to 2020. All the content presented in this PPT design is completely editable. Download it and make adjustments in color, background, font etc. as per your unique business setting.
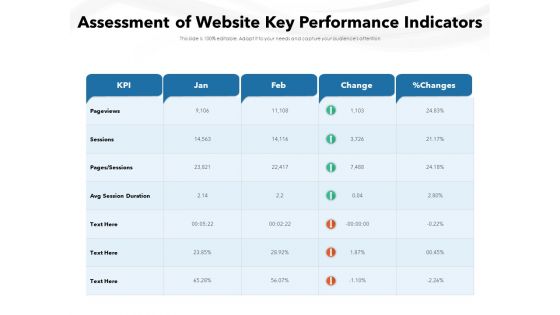
Assessment Of Website Key Performance Indicators Ppt PowerPoint Presentation Gallery Visual Aids PDF
Showcasing this set of slides titled assessment of website key performance indicators ppt powerpoint presentation gallery visual aids pdf. The topics addressed in these templates are assessment of website key performance indicators. All the content presented in this PPT design is completely editable. Download it and make adjustments in color, background, font etc. as per your unique business setting.
Bar Graph Showing Key Indicator Of Market Competitiveness Ppt PowerPoint Presentation Icon Example PDF
Showcasing this set of slides titled bar graph showing key indicator of market competitiveness ppt powerpoint presentation icon example pdf. The topics addressed in these templates are bar graph showing key indicator of market competitiveness. All the content presented in this PPT design is completely editable. Download it and make adjustments in color, background, font etc. as per your unique business setting.
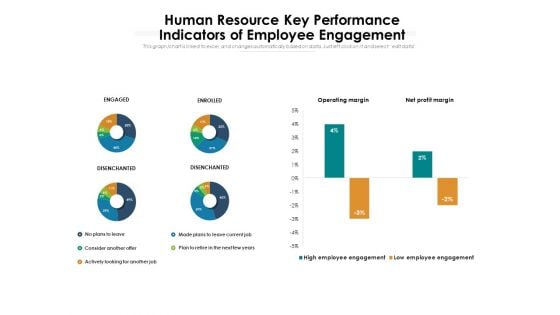
Human Resource Key Performance Indicators Of Employee Engagement Ppt PowerPoint Presentation Gallery Graphics Template PDF
Showcasing this set of slides titled human resource key performance indicators of employee engagement ppt powerpoint presentation gallery graphics template pdf. The topics addressed in these templates are human resource key performance indicators of employee engagement. All the content presented in this PPT design is completely editable. Download it and make adjustments in color, background, font etc. as per your unique business setting.
Business Sales Key Performance Indicators Report Ppt PowerPoint Presentation Icon Slideshow PDF
Showcasing this set of slides titled business sales key performance indicators report ppt powerpoint presentation icon slideshow pdf. The topics addressed in these templates are business sales key performance indicators report. All the content presented in this PPT design is completely editable. Download it and make adjustments in color, background, font etc. as per your unique business setting.
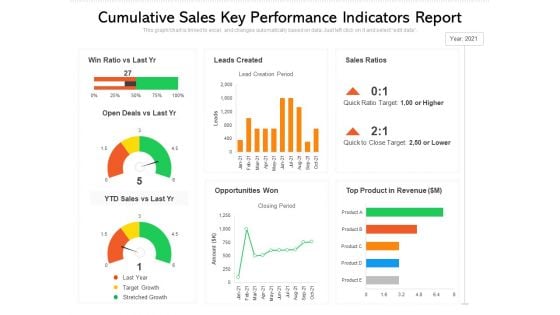
Cumulative Sales Key Performance Indicators Report Ppt PowerPoint Presentation Model Images PDF
Showcasing this set of slides titled cumulative sales key performance indicators report ppt powerpoint presentation model images pdf. The topics addressed in these templates are cumulative sales key performance indicators report. All the content presented in this PPT design is completely editable. Download it and make adjustments in color, background, font etc. as per your unique business setting.
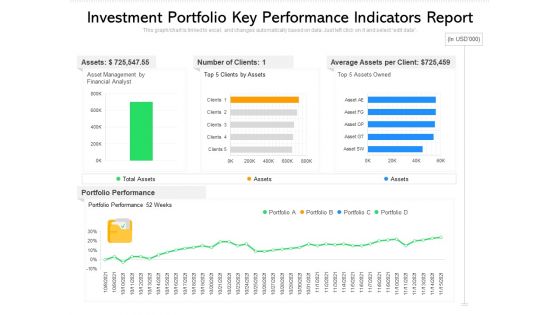
Investment Portfolio Key Performance Indicators Report Ppt PowerPoint Presentation Outline Smartart PDF
Showcasing this set of slides titled investment portfolio key performance indicators report ppt powerpoint presentation outline smartart pdf. The topics addressed in these templates are investment portfolio key performance indicators report. All the content presented in this PPT design is completely editable. Download it and make adjustments in color, background, font etc. as per your unique business setting.
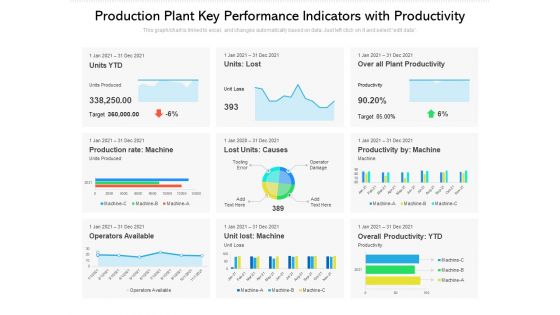
Production Plant Key Performance Indicators With Productivity Ppt PowerPoint Presentation Pictures Good PDF
Showcasing this set of slides titled production plant key performance indicators with productivity ppt powerpoint presentation pictures good pdf. The topics addressed in these templates are production plant key performance indicators with productivity. All the content presented in this PPT design is completely editable. Download it and make adjustments in color, background, font etc. as per your unique business setting.
Key Performance Indicators To Track Sales Performance Ppt PowerPoint Presentation Icon Diagrams PDF
Showcasing this set of slides titled key performance indicators to track sales performance ppt powerpoint presentation icon diagrams pdf. The topics addressed in these templates are key performance indicators to track sales performance. All the content presented in this PPT design is completely editable. Download it and make adjustments in color, background, font etc. as per your unique business setting.
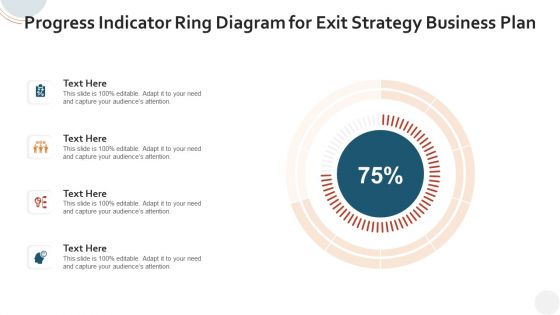
Progress Indicator Ring Diagram For Exit Strategy Business Plan Information PDF
Showcasing this set of slides titled progress indicator ring diagram for exit strategy business plan information pdf. The topics addressed in these templates are progress indicator ring diagram for exit strategy business plan. All the content presented in this PPT design is completely editable. Download it and make adjustments in color, background, font etc. as per your unique business setting.
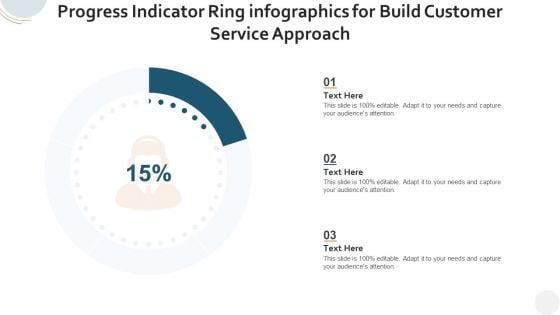
Progress Indicator Ring Infographics For Build Customer Service Approach Inspiration PDF
Showcasing this set of slides titled progress indicator ring infographics for build customer service approach inspiration pdf. The topics addressed in these templates are progress indicator ring infographics for build customer service approach. All the content presented in this PPT design is completely editable. Download it and make adjustments in color, background, font etc. as per your unique business setting.
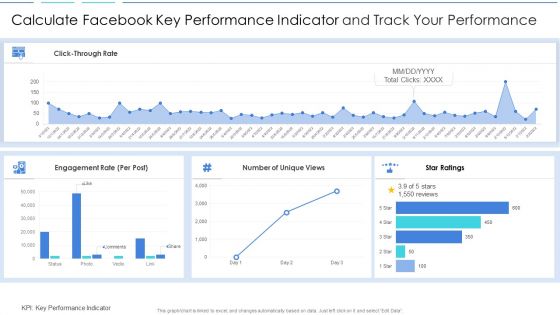
Calculate Facebook Key Performance Indicator And Track Your Performance Information PDF
Showcasing this set of slides titled calculate facebook key performance indicator and track your performance information pdf. The topics addressed in these templates are calculate facebook key performance indicator and track your performance. All the content presented in this PPT design is completely editable. Download it and make adjustments in color, background, font etc. as per your unique business setting.
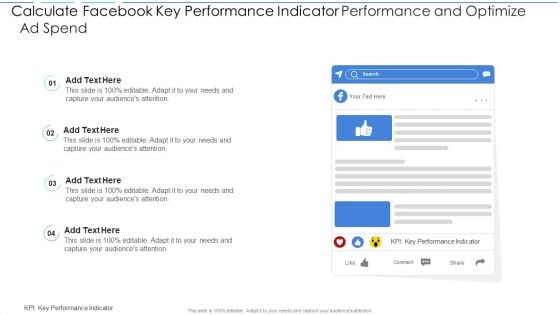
Calculate Facebook Key Performance Indicator Performance And Optimize Ad Spend Brochure PDF
Showcasing this set of slides titled calculate facebook key performance indicator performance and optimize ad spend brochure pdf. The topics addressed in these templates are calculate facebook key performance indicator performance and optimize ad spend. All the content presented in this PPT design is completely editable. Download it and make adjustments in color, background, font etc. as per your unique business setting.

Calculate Facebook Key Performance Indicator The Specific Campaign Details Introduction PDF
Showcasing this set of slides titled calculate facebook key performance indicator the specific campaign details introduction pdf. The topics addressed in these templates are calculate facebook key performance indicator the specific campaign details. All the content presented in this PPT design is completely editable. Download it and make adjustments in color, background, font etc. as per your unique business setting.


 Continue with Email

 Home
Home


