Meter Slides
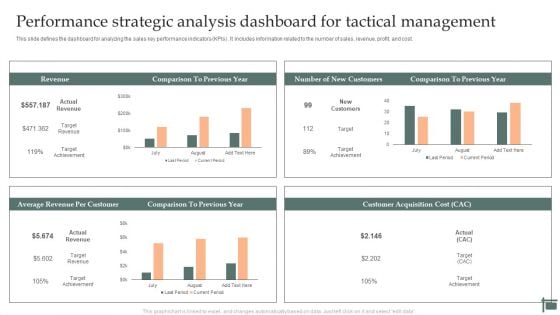
Performance Strategic Analysis Dashboard For Tactical Management Rules PDF
This slide defines the dashboard for analyzing the sales key performance indicators KPIs. It includes information related to the number of sales, revenue, profit, and cost. Showcasing this set of slides titled Performance Strategic Analysis Dashboard For Tactical Management Rules PDF. The topics addressed in these templates are Revenue, New Customers, Average Revenue, Per Customer. All the content presented in this PPT design is completely editable. Download it and make adjustments in color, background, font etc. as per your unique business setting.
Tactical Planning And Analyzing Organizational Goals Icon Infographics PDF
This slide defines the dashboard for analyzing the sales key performance indicators KPIs. It includes information related to the number of sales, revenue, profit, and cost. Showcasing this set of slides titled Tactical Planning And Analyzing Organizational Goals Icon Infographics PDF. The topics addressed in these templates are Cost Breakdown, Sales Revenue, Accumulated Revenue. All the content presented in this PPT design is completely editable. Download it and make adjustments in color, background, font etc. as per your unique business setting.
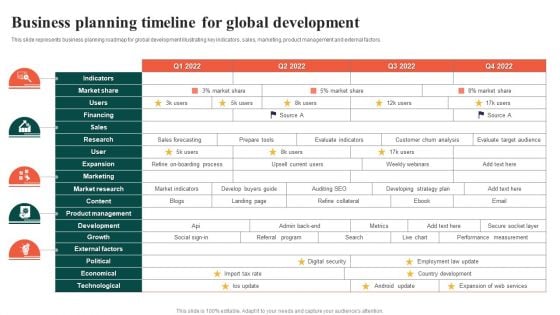
Business Planning Timeline For Global Development Ppt Layouts Introduction PDF
This slide represents business planning roadmap for global development illustrating key indicators, sales, marketing, product management and external factors. Showcasing this set of slides titled Business Planning Timeline For Global Development Ppt Layouts Introduction PDF. The topics addressed in these templates are Market Share, Research, Sales. All the content presented in this PPT design is completely editable. Download it and make adjustments in color, background, font etc. as per your unique business setting.
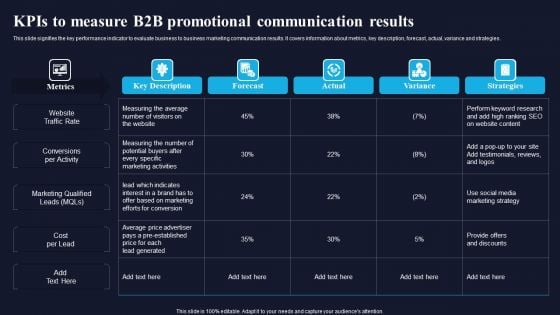
Kpis To Measure B2B Promotional Communication Results Graphics PDF
This slide signifies the key performance indicator to evaluate business to business marketing communication results. It covers information about metrics, key description, forecast, actual, variance and strategies. Showcasing this set of slides titled Kpis To Measure B2B Promotional Communication Results Graphics PDF. The topics addressed in these templates are Key Description, Forecast, Actual, Variance. All the content presented in this PPT design is completely editable. Download it and make adjustments in color, background, font etc. as per your unique business setting.

Stock Performance Metrics For Warehouse Management Ppt Tips PDF
This slide indicates the inventory KPIs for warehouse management which helps in improving logistics business activities. It includes parameters such as financial, productivity, utilization, etc. Showcasing this set of slides titled Stock Performance Metrics For Warehouse Management Ppt Tips PDF. The topics addressed in these templates are Receiving, Financial, Productivity. All the content presented in this PPT design is completely editable. Download it and make adjustments in color, background, font etc. as per your unique business setting.
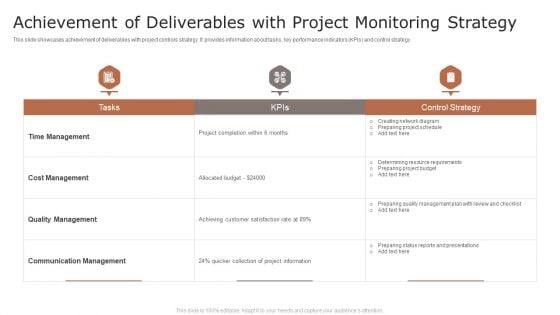
Achievement Of Deliverables With Project Monitoring Strategy Ppt Summary Outfit PDF
This slide showcases achievement of deliverables with project controls strategy. It provides information about tasks, key performance indicators KPIs and control strategy. Showcasing this set of slides titled Achievement Of Deliverables With Project Monitoring Strategy Ppt Summary Outfit PDF. The topics addressed in these templates are Time Management, Cost Management, Quality Management. All the content presented in this PPT design is completely editable. Download it and make adjustments in color, background, font etc. as per your unique business setting.

Annual Business Financial Summary Dashboard Themes PDF
This slide shows annual financial report dashboard of company to monitor yearly business performance. It includes various indicators such as revenue, net profits, costs and breakdown of cost. Showcasing this set of slides titled Annual Business Financial Summary Dashboard Themes PDF. The topics addressed in these templates are Revenue, Costs, Net Profit. All the content presented in this PPT design is completely editable. Download it and make adjustments in color, background, font etc. as per your unique business setting.
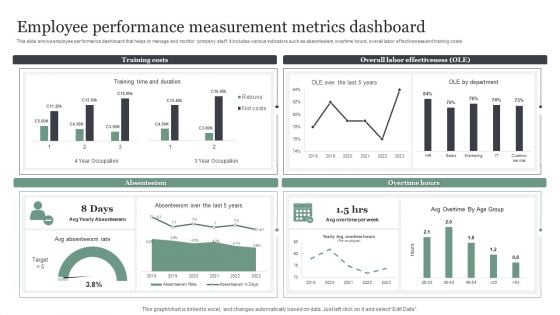
Employee Performance Measurement Metrics Dashboard Brochure PDF
This slide shows employee performance dashboard that helps to manage and monitor company staff. It includes various indicators such as absenteeism, overtime hours, overall labor effectiveness and training costs. Showcasing this set of slides titled Employee Performance Measurement Metrics Dashboard Brochure PDF. The topics addressed in these templates are Training Costs, Overall Labor Effectiveness. All the content presented in this PPT design is completely editable. Download it and make adjustments in color, background, font etc. as per your unique business setting.
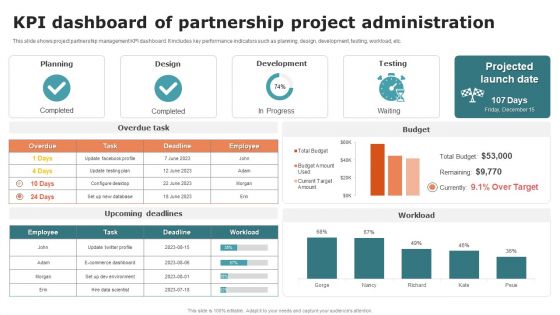
KPI Dashboard Of Partnership Project Administration Ideas PDF
This slide shows project partnership management KPI dashboard. It includes key performance indicators such as planning, design, development, testing, workload, etc. Showcasing this set of slides titled KPI Dashboard Of Partnership Project Administration Ideas PDF. The topics addressed in these templates are Planning, Design, Development. All the content presented in this PPT design is completely editable. Download it and make adjustments in color, background, font etc. as per your unique business setting.
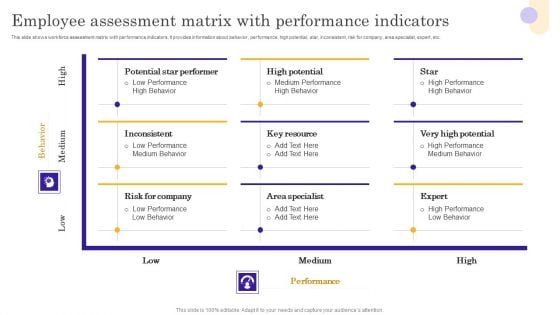
Vendor Performance Assessment Matrix With Scoring Metrics Infographics PDF
This slide shows workforce assessment matrix with performance indicators. It provides information about behavior, performance, high potential, star, inconsistent, risk for company, area specialist, expert, etc. Showcasing this set of slides titled Vendor Performance Assessment Matrix With Scoring Metrics Infographics PDF. The topics addressed in these templates are Potential Star Performer, High Potential, Inconsistent. All the content presented in this PPT design is completely editable. Download it and make adjustments in color, background, font etc. as per your unique business setting.
Corporate Audit And Review Team Raci Matrix Icons PDF
This slide indicates roles and responsibilities of corporate audit team. It includes roles like writer, editor, content designer, customer success, product marketing etc. Showcasing this set of slides titled Corporate Audit And Review Team Raci Matrix Icons PDF. The topics addressed in these templates are Management System, Data Protection, Interview Manager. All the content presented in this PPT design is completely editable. Download it and make adjustments in color, background, font etc. as per your unique business setting.
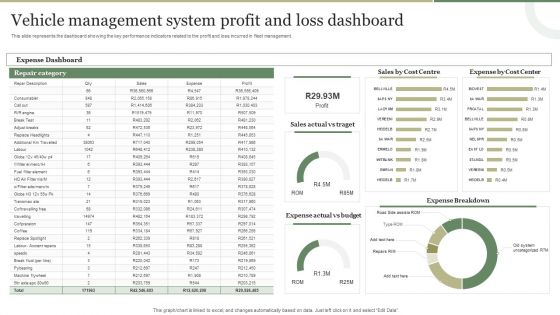
Vehicle Management System Profit And Loss Dashboard Brochure PDF
This slide represents the dashboard showing the key performance indicators related to the profit and loss incurred in fleet management. Showcasing this set of slides titled Vehicle Management System Profit And Loss Dashboard Brochure PDF. The topics addressed in these templates are Vehicle Management System, Profit And Loss Dashboard. All the content presented in this PPT design is completely editable. Download it and make adjustments in color, background, font etc. as per your unique business setting.
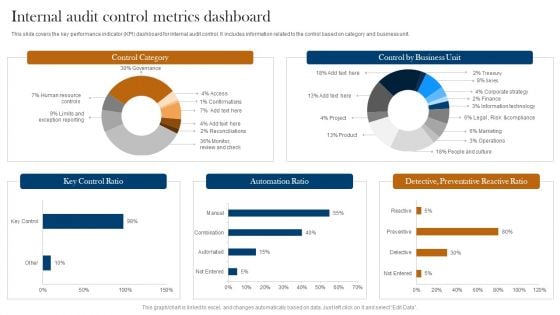
Internal Audit Control Metrics Dashboard Ppt Professional Design Templates PDF
This slide covers the key performance indicator KPI dashboard for internal audit control. It includes information related to the control based on category and business unit. Showcasing this set of slides titled Internal Audit Control Metrics Dashboard Ppt Professional Design Templates PDF. The topics addressed in these templates are Control Category, Key Control Ratio, Automation Ratio. All the content presented in this PPT design is completely editable. Download it and make adjustments in color, background, font etc. as per your unique business setting.
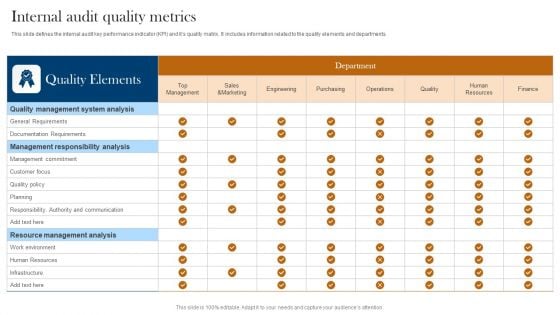
Internal Audit Quality Metrics Ppt Pictures Clipart Images PDF
This slide defines the internal audit key performance indicator KPI and its quality matrix. It includes information related to the quality elements and departments. Showcasing this set of slides titled Internal Audit Quality Metrics Ppt Pictures Clipart Images PDF. The topics addressed in these templates are Quality Elements, Department, Management Responsibility Analysis. All the content presented in this PPT design is completely editable. Download it and make adjustments in color, background, font etc. as per your unique business setting.
Client Support Satisfaction Dashboard Icons PDF
This slide shows KPI dashboard which can be used to track customer satisfaction level. It includes key performance indicators such as total requests, cases by channel, customer satisfaction by subject, etc. Showcasing this set of slides titled Client Support Satisfaction Dashboard Icons PDF. The topics addressed in these templates are Client Support, Satisfaction Dashboard. All the content presented in this PPT design is completely editable. Download it and make adjustments in color, background, font etc. as per your unique business setting.
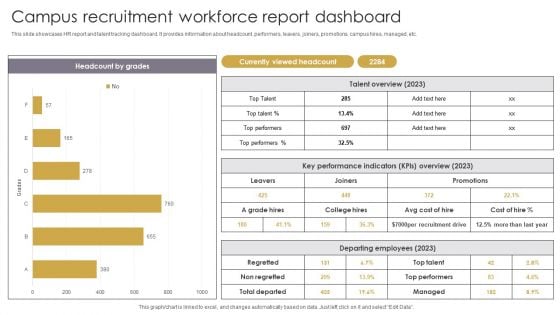
Campus Recruitment Workforce Report Dashboard Guidelines PDF
This slide showcases HR report and talent tracking dashboard. It provides information about headcount, performers, leavers, joiners, promotions, campus hires, managed, etc. Showcasing this set of slides titled Campus Recruitment Workforce Report Dashboard Guidelines PDF. The topics addressed in these templates are Recruitment, Cost, Key Performance Indicators. All the content presented in this PPT design is completely editable. Download it and make adjustments in color, background, font etc. as per your unique business setting.
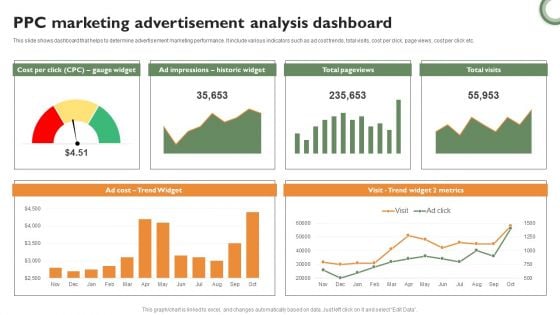
PPC Marketing Advertisement Analysis Dashboard Background PDF
This slide shows dashboard that helps to determine advertisement marketing performance. It include various indicators such as ad cost trends, total visits, cost per click, page views, cost per click etc. Showcasing this set of slides titled PPC Marketing Advertisement Analysis Dashboard Background PDF. The topics addressed in these templates are PPC Marketing, Advertisement Analysis Dashboard. All the content presented in this PPT design is completely editable. Download it and make adjustments in color, background, font etc. as per your unique business setting.
Comparative Metrics For Continuous Tracking In Devops Tools Clipart PDF
This slide illustrates comparison of key performance indicators of DevOps tools. It includes metrics such as observability and visualization, observability and application, pattern analysis, etc. Showcasing this set of slides titled Comparative Metrics For Continuous Tracking In Devops Tools Clipart PDF. The topics addressed in these templates are Appdynamics, Datadog, Dynatrace. All the content presented in this PPT design is completely editable. Download it and make adjustments in color, background, font etc. as per your unique business setting.
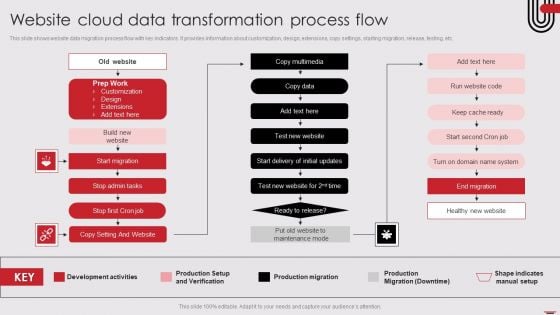
Website Cloud Data Transformation Process Flow Elements PDF
This slide shows website data migration process flow with key indicators. It provides information about customization, design, extensions, copy settings, starting migration, release, testing, etc. Showcasing this set of slides titled Website Cloud Data Transformation Process Flow Elements PDF. The topics addressed in these templates are Prep Work, Start Migration, Stop Admin Tasks. All the content presented in this PPT design is completely editable. Download it and make adjustments in color, background, font etc. as per your unique business setting.
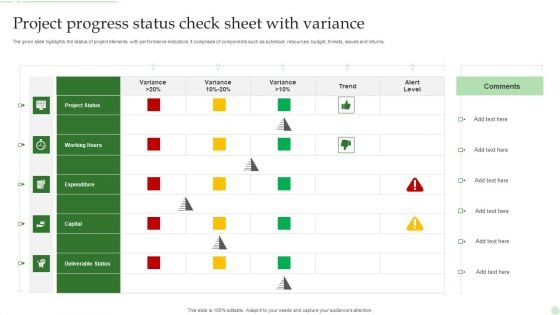
Project Progress Status Check Sheet With Variance Ppt PowerPoint Presentation File Themes PDF
The given slide highlights the status of project elements with performance indicators. It comprises of components such as schedule, resources, budget, threats, issues and returns. Showcasing this set of slides titled Project Progress Status Check Sheet With Variance Ppt PowerPoint Presentation File Themes PDF. The topics addressed in these templates are Project Status, Working Hours, Expenditure. All the content presented in this PPT design is completely editable. Download it and make adjustments in color, background, font etc. as per your unique business setting.
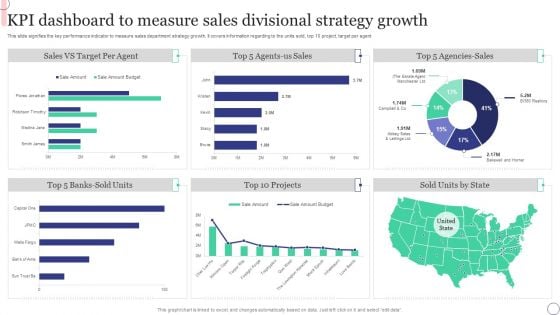
KPI Dashboard To Measure Sales Divisional Strategy Growth Formats PDF
This slide signifies the key performance indicator to measure sales department strategy growth. It covers information regarding to the units sold, top 10 project, target per agent. Showcasing this set of slides titled KPI Dashboard To Measure Sales Divisional Strategy Growth Formats PDF. The topics addressed in these templates are Sales, Target. All the content presented in this PPT design is completely editable. Download it and make adjustments in color, background, font etc. as per your unique business setting.
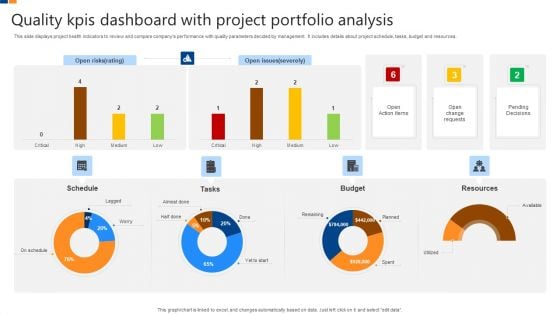
Quality Kpis Dashboard With Project Portfolio Analysis Download PDF
This slide displays project health indicators to review and compare companys performance with quality parameters decided by management. It includes details about project schedule, tasks, budget and resources. Showcasing this set of slides titled Quality Kpis Dashboard With Project Portfolio Analysis Download PDF. The topics addressed in these templates are Schedule, Tasks, Budget, Resources. All the content presented in this PPT design is completely editable. Download it and make adjustments in color, background, font etc. as per your unique business setting.
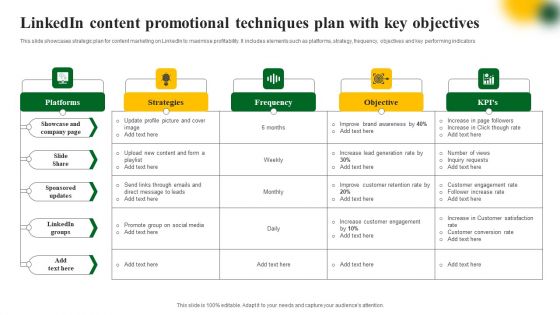
Linkedin Content Promotional Techniques Plan With Key Objectives Brochure PDF
This slide showcases strategic plan for content marketing on LinkedIn to maximise profitability. It includes elements such as platforms, strategy, frequency, objectives and key performing indicators. Showcasing this set of slides titled Linkedin Content Promotional Techniques Plan With Key Objectives Brochure PDF. The topics addressed in these templates are Lead Generation, Content, Strategies. All the content presented in this PPT design is completely editable. Download it and make adjustments in color, background, font etc. as per your unique business setting.
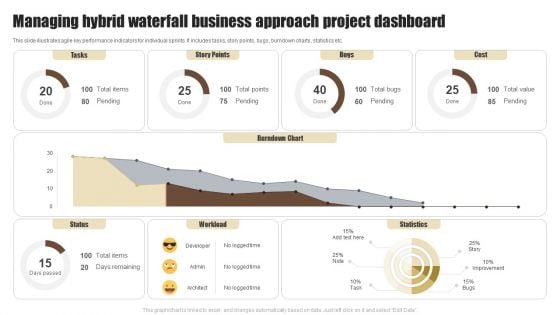
Managing Hybrid Waterfall Business Approach Project Dashboard Summary PDF
This slide illustrates agile key performance indicators for individual sprints. It includes tasks, story points, bugs, burndown charts, statistics etc. Showcasing this set of slides titled Managing Hybrid Waterfall Business Approach Project Dashboard Summary PDF. The topics addressed in these templates are Tasks, Story Points, Bugs. All the content presented in this PPT design is completely editable. Download it and make adjustments in color, background, font etc. as per your unique business setting.
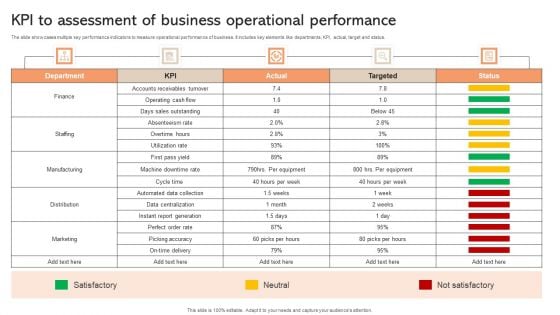
KPI To Assessment Of Business Operational Performance Brochure PDF
The slide showcases multiple key performance indicators to measure operational performance of business. It includes key elements like departments, KPI, actual, target and status. Showcasing this set of slides titled KPI To Assessment Of Business Operational Performance Brochure PDF. The topics addressed in these templates are Satisfactory, Neutral, Not Satisfactory. All the content presented in this PPT design is completely editable. Download it and make adjustments in color, background, font etc. as per your unique business setting.
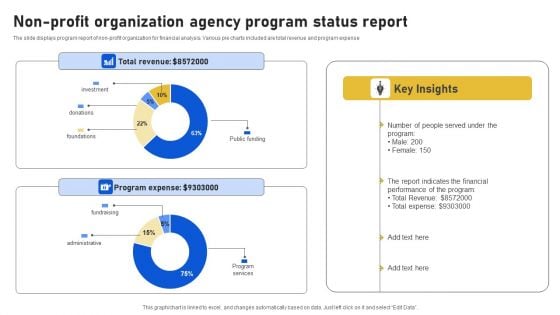
Non-Profit Organization Agency Program Status Report Diagrams PDF
The slide displays program report of non-profit organization for financial analysis. Various pie charts included are total revenue and program expense. Showcasing this set of slides titled Non-Profit Organization Agency Program Status Report Diagrams PDF. The topics addressed in these templates are Total Revenue, Program Expense, Report Indicates. All the content presented in this PPT design is completely editable. Download it and make adjustments in color, background, font etc. as per your unique business setting.
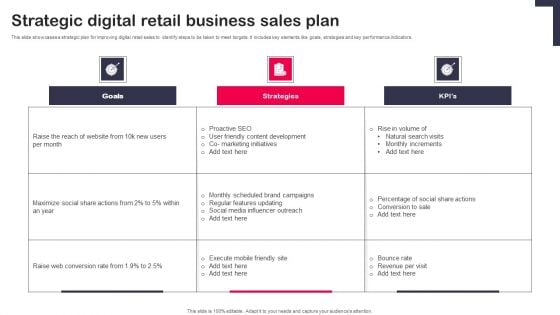
Strategic Digital Retail Business Sales Plan Introduction PDF
This slide showcases a strategic plan for improving digital retail sales to identify steps to be taken to meet targets. It includes key elements like goals, strategies and key performance indicators. Showcasing this set of slides titled Strategic Digital Retail Business Sales Plan Introduction PDF. The topics addressed in these templates are Goals, Strategies, KPIs. All the content presented in this PPT design is completely editable. Download it and make adjustments in color, background, font etc. as per your unique business setting.
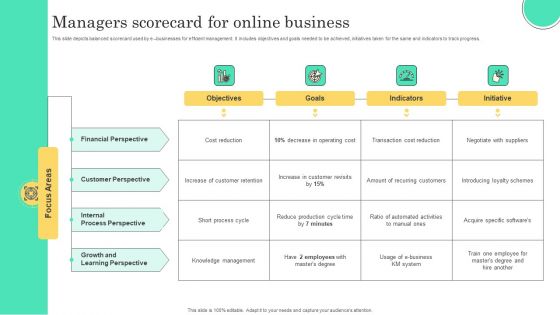
Managers Scorecard For Online Business Structure PDF
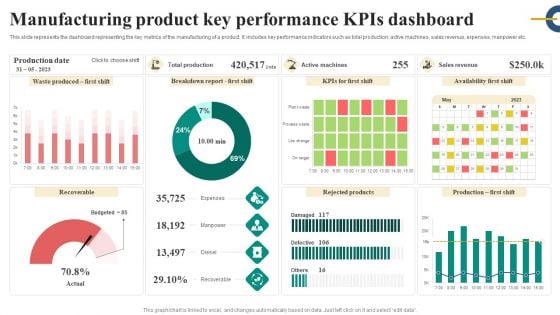
Manufacturing Product Key Performance Kpis Dashboard Inspiration PDF
This slide represents the dashboard representing the key metrics of the manufacturing of a product. It includes key performance indicators such as total production, active machines, sales revenue, expenses, manpower etc. Showcasing this set of slides titled Manufacturing Product Key Performance Kpis Dashboard Inspiration PDF. The topics addressed in these templates are Expenses, Manpower, Diesel, Recoverable. All the content presented in this PPT design is completely editable. Download it and make adjustments in color, background, font etc. as per your unique business setting.
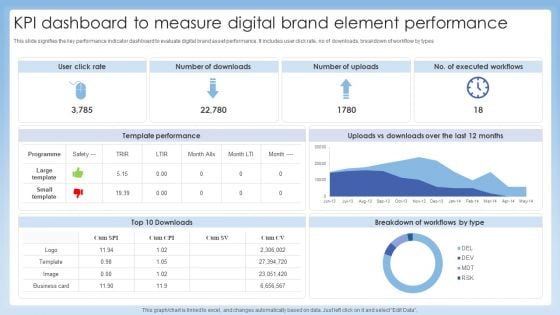
KPI Dashboard To Measure Digital Brand Element Performance Professional PDF
This slide signifies the key performance indicator dashboard to evaluate digital brand asset performance. It includes user click rate, no of downloads, breakdown of workflow by types. Showcasing this set of slides titled KPI Dashboard To Measure Digital Brand Element Performance Professional PDF. The topics addressed in these templates are Template Performance, Breakdown Workflows, Executed Workflows. All the content presented in this PPT design is completely editable. Download it and make adjustments in color, background, font etc. as per your unique business setting.
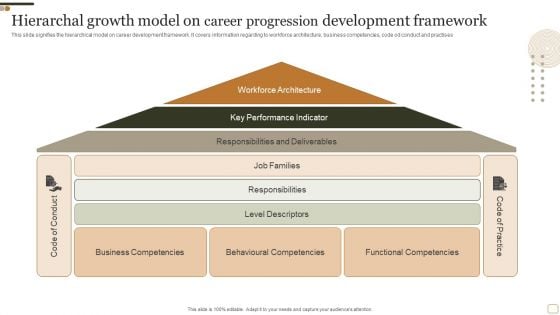
Hierarchal Growth Model On Career Progression Development Framework Microsoft PDF
This slide signifies the hierarchical model on career development framework. It covers information regarding to workforce architecture, business competencies, code od conduct and practises. Showcasing this set of slides titled Hierarchal Growth Model On Career Progression Development Framework Microsoft PDF. The topics addressed in these templates are Workforce Architecture, Key Performance Indicator, Responsibilities Deliverables. All the content presented in this PPT design is completely editable. Download it and make adjustments in color, background, font etc. as per your unique business setting.
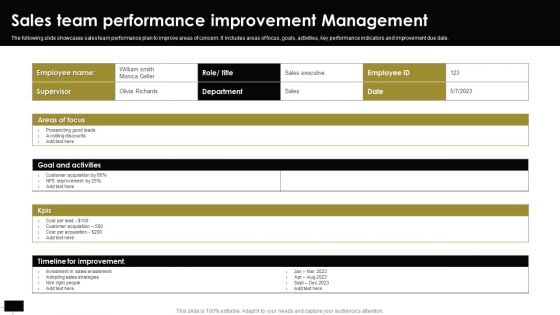
Sales Team Performance Improvement Management Brochure PDF
The following slide showcases sales team performance plan to improve areas of concern. It includes areas of focus, goals, activities, key performance indicators and improvement due date. Showcasing this set of slides titled Sales Team Performance Improvement Management Brochure PDF. The topics addressed in these templates are Customer Acquisition, Goal And Activities, Sales Strategies. All the content presented in this PPT design is completely editable. Download it and make adjustments in color, background, font etc. as per your unique business setting.
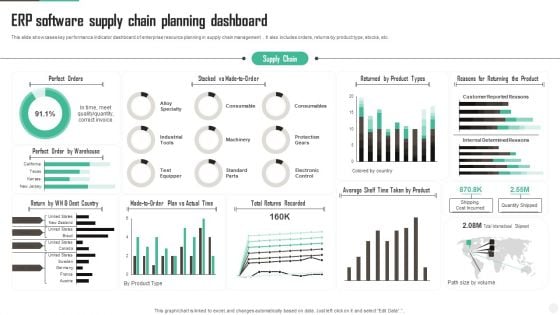
ERP Software Supply Chain Planning Dashboard Diagrams PDF
This slide showcases key performance indicator dashboard of enterprise resource planning in supply chain management . It also includes orders, returns by product type, stocks, etc. Showcasing this set of slides titled ERP Software Supply Chain Planning Dashboard Diagrams PDF Sample. The topics addressed in these templates are Perfect Orders, Dest Country, Actual Time. All the content presented in this PPT design is completely editable. Download it and make adjustments in color, background, font etc. as per your unique business setting.
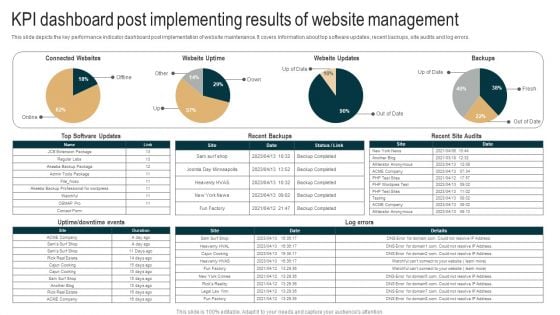
KPI Dashboard Post Implementing Results Of Website Management Themes PDF
This slide depicts the key performance indicator dashboard post implementation of website maintenance. It covers information about top software updates, recent backups, site audits and log errors. Showcasing this set of slides titled KPI Dashboard Post Implementing Results Of Website Management Themes PDF. The topics addressed in these templates are Website Updates, Website Uptime, Connected Websites. All the content presented in this PPT design is completely editable. Download it and make adjustments in color, background, font etc. as per your unique business setting.
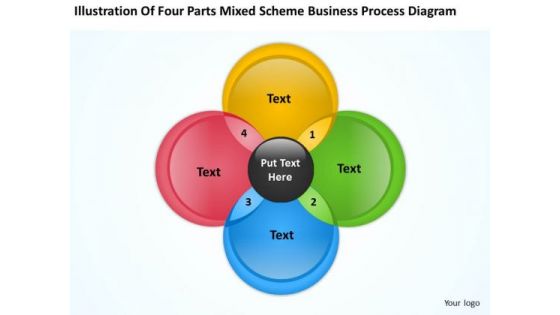
Mixed Scheme Business Process Diagram Creating Plan Step By PowerPoint Templates
We present our mixed scheme business process diagram creating plan step by PowerPoint templates.Download our Process and Flows PowerPoint Templates because Our PowerPoint Templates and Slides will give good value for money. They also have respect for the value of your time. Use our Flow Charts PowerPoint Templates because Our PowerPoint Templates and Slides will help you be quick off the draw. Just enter your specific text and see your points hit home. Download and present our Shapes PowerPoint Templates because Our PowerPoint Templates and Slides will generate and maintain the level of interest you desire. They will create the impression you want to imprint on your audience. Use our Business PowerPoint Templates because Our PowerPoint Templates and Slides will help you be quick off the draw. Just enter your specific text and see your points hit home. Use our Marketing PowerPoint Templates because These PowerPoint Templates and Slides will give the updraft to your ideas. See them soar to great heights with ease.Use these PowerPoint slides for presentations relating to Flow, process, schema, loop, turn, step, business, concept, vector, life, success, spectrum, rotation, recycling, diagram, circle, ring, graphic, propeller,pointer, idea, development, management, wheel, cycle, circulation, illustration, circular, system, strategy, round, research, range, iterative, center, direction, spiral,lifecycle, motion, method, quality, control, act, movement, blender, nature, mix, indicator. The prominent colors used in the PowerPoint template are Black, Yellow, Green. Your thoughts and our Mixed Scheme Business Process Diagram Creating Plan Step By PowerPoint Templates will get along famously. They will create an acclaimed team.
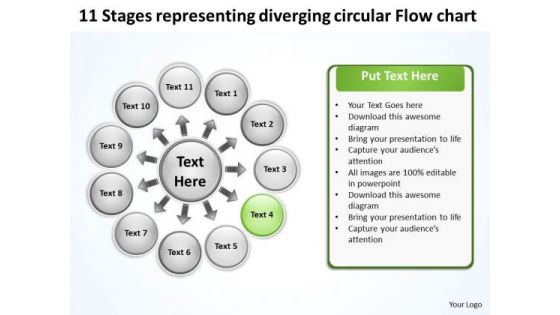
Representing Diverging Circular Flow Chart PowerPoint Templates
We present our representing diverging circular flow chart PowerPoint templates.Present our Ring charts PowerPoint Templates because this PPt slide helps you to measure key aspects of the current process and collect relevant data. Download our Circle charts PowerPoint Templates because the mind is always whirring with new ideas. Download our Process and Flows PowerPoint Templates because you have a clear vision of the cake you want. Download our Business PowerPoint Templates because you can Flutter your wings and enchant the world. Impress them with the innate attractiveness of your thoughts and words. Download our Marketing PowerPoint Templates because with the help of our Slides you can Illustrate your ideas one by one and demonstrate how each is an important cog in running the entire wheel.Use these PowerPoint slides for presentations relating to Circle, circulation, cobalt,colorful, cyan, cycle, element,emblem, grayshadow, green,icon, indicator, interface, internet, label,link, load, marker, motion, movement,navigationpanel, next, orientation, pagsite, pink, pointer, previous, process, reload, rotation, satined, sign, signpost,smooth, sticker, sticky, symbol. The prominent colors used in the PowerPoint template are Green, Black, White. Customers tell us our representing diverging circular flow chart PowerPoint templates will make the presenter successul in his career/life. We assure you our cobalt PowerPoint templates and PPT Slides are Nifty. PowerPoint presentation experts tell us our representing diverging circular flow chart PowerPoint templates are Fabulous. People tell us our grayshadow PowerPoint templates and PPT Slides will help you be quick off the draw. Just enter your specific text and see your points hit home. We assure you our representing diverging circular flow chart PowerPoint templates are Excellent. Use our cobalt PowerPoint templates and PPT Slides have awesome images to get your point across. Compile targets with our Representing Diverging Circular Flow Chart PowerPoint Templates. Download without worries with our money back guaranteee.
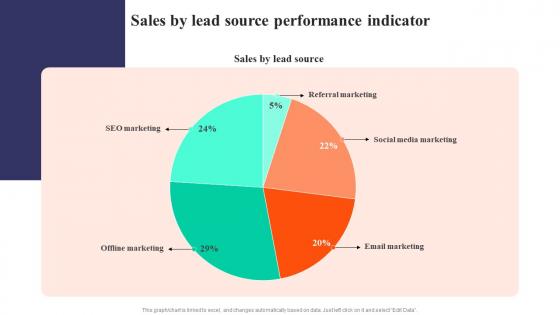
Sales By Lead Source Performance Indicator Strategies To Develop Successful Guidelines Pdf
This modern and well-arranged Sales By Lead Source Performance Indicator Strategies To Develop Successful Guidelines Pdf provides lots of creative possibilities. It is very simple to customize and edit with the Powerpoint Software. Just drag and drop your pictures into the shapes. All facets of this template can be edited with Powerpoint no extra software is necessary. Add your own material, put your images in the places assigned for them, adjust the colors, and then you can show your slides to the world, with an animated slide included. Our Sales By Lead Source Performance Indicator Strategies To Develop Successful Guidelines Pdf are topically designed to provide an attractive backdrop to any subject. Use them to look like a presentation pro.
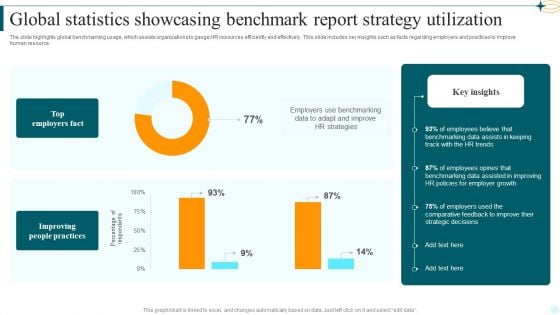
Global Statistics Showcasing Benchmark Report Strategy Utilization Mockup PDF
The slide highlights global benchmarking usage, which assists organizations to gauge HR resources efficiently and effectively. This slide includes key insights such as facts regarding employers and practices to improve human resource. Showcasing this set of slides titled Global Statistics Showcasing Benchmark Report Strategy Utilization Mockup PDF. The topics addressed in these templates are Top Employers Fact, Improving People Practices, Employers Use Benchmarking. All the content presented in this PPT design is completely editable. Download it and make adjustments in color, background, font etc. as per your unique business setting.
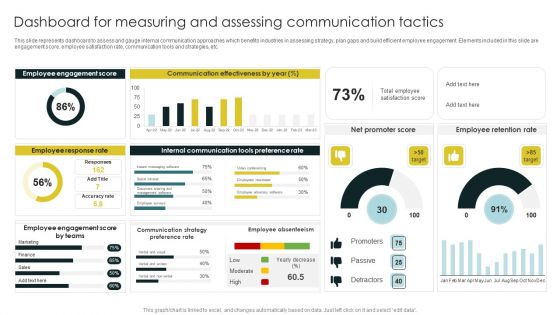
Dashboard For Measuring And Assessing Communication Tactics Information PDF
This slide represents dashboard to assess and gauge internal communication approaches which benefits industries in assessing strategy, plan gaps and build efficient employee engagement. Elements included in this slide are engagement score, employee satisfaction rate, communication tools and strategies, etc. Showcasing this set of slides titled Dashboard For Measuring And Assessing Communication Tactics Information PDF. The topics addressed in these templates are Employee Engagement, Employee Response Rate, Communication Effectiveness. All the content presented in this PPT design is completely editable. Download it and make adjustments in color, background, font etc. as per your unique business setting.
Employee Key Performance Indicators Performance Indicators Report Icon Structure PDF
Showcasing this set of slides titled Employee Key Performance Indicators Performance Indicators Report Icon Structure PDF The topics addressed in these templates are Employee Key, Performance, Indicators Performance All the content presented in this PPT design is completely editable. Download it and make adjustments in color, background, font etc. as per your unique business setting.
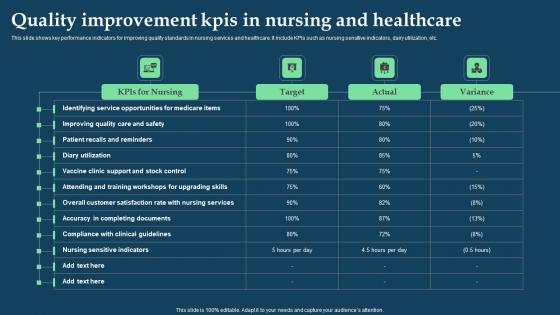
Quality Improvement KPIs In Nursing And Healthcare Portrait Pdf
This slide shows key performance indicators for improving quality standards in nursing services and healthcare. It include KPIs such as nursing sensitive indicators, dairy utilization, etc. Showcasing this set of slides titled Quality Improvement KPIs In Nursing And Healthcare Portrait Pdf. The topics addressed in these templates are Nursing, Target, Actual. All the content presented in this PPT design is completely editable. Download it and make adjustments in color, background, font etc. as per your unique business setting. This slide shows key performance indicators for improving quality standards in nursing services and healthcare. It include KPIs such as nursing sensitive indicators, dairy utilization, etc.
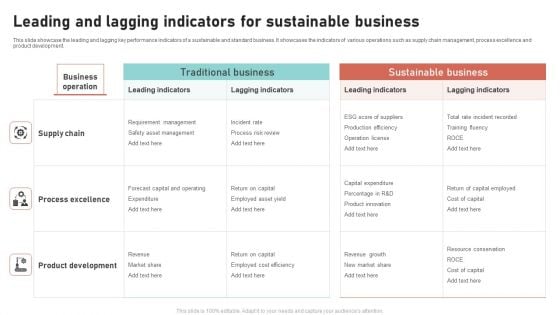
Leading And Lagging Indicators For Sustainable Business Rules PDF
This slide showcase the leading and lagging key performance indicators of a sustainable and standard business. It showcases the indicators of various operations such as supply chain management, process excellence and product development. Showcasing this set of slides titled Leading And Lagging Indicators For Sustainable Business Rules PDF. The topics addressed in these templates are Leading Indicators, Lagging Indicators, Automobile Industries. All the content presented in this PPT design is completely editable. Download it and make adjustments in color, background, font etc. as per your unique business setting.
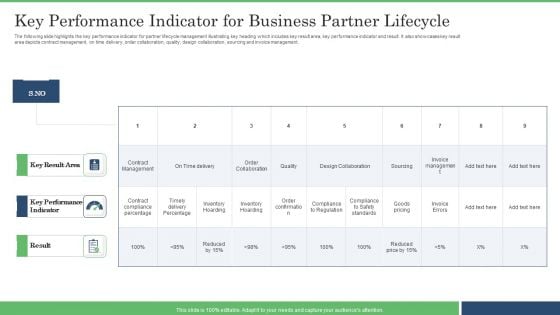
Key Performance Indicator For Business Partner Lifecycle Brochure PDF
The following slide highlights the key performance indicator for partner lifecycle management illustrating key heading which includes key result area, key performance indicator and result. It also showcases key result area depicts contract management, on time delivery, order collaboration, quality, design collaboration, sourcing and invoice management. Showcasing this set of slides titled Key Performance Indicator For Business Partner Lifecycle Brochure PDF. The topics addressed in these templates are Key Performance Indicator, Inventory Hoarding, Design Collaboration. All the content presented in this PPT design is completely editable. Download it and make adjustments in color, background, font etc. as per your unique business setting.
Sales Order Processing Performance Tracking Indicators Graphics PDF
The following slide showcases key performance indicators for sales order fulfilment to meet customer expectations, specifications, deliver goods on time, compare order fulfilment against past orders. It includes elements such as category, key performance indicators, expected rate and actual rate. Showcasing this set of slides titled Sales Order Processing Performance Tracking Indicators Graphics PDF. The topics addressed in these templates are Customer Metrics, Inbound Metrics, Financial Metrics. All the content presented in this PPT design is completely editable. Download it and make adjustments in color, background, font etc. as per your unique business setting.
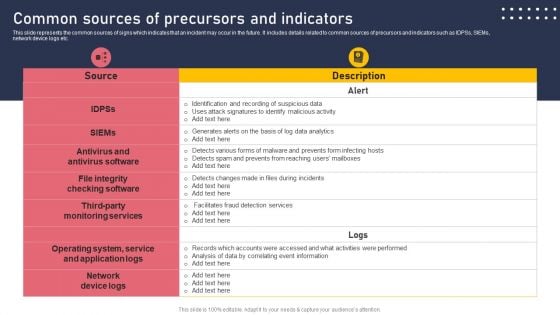
Common Sources Of Precursors And Indicators Designs PDF
This slide represents the common sources of signs which indicates that an incident may occur in the future. It includes details related to common sources of precursors and indicators such as IDPSs, SIEMs, network device logs etc. If your project calls for a presentation, then Slidegeeks is your go to partner because we have professionally designed, easy to edit templates that are perfect for any presentation. After downloading, you can easily edit Common Sources Of Precursors And Indicators Designs PDF and make the changes accordingly. You can rearrange slides or fill them with different images. Check out all the handy templates
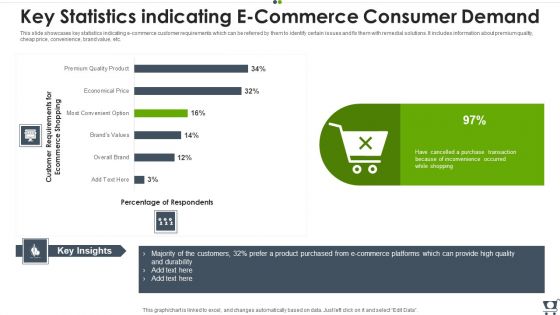
Key Statistics Indicating E Commerce Consumer Demand Professional PDF
This slide showcases key statistics indicating e commerce customer requirements which can be referred by them to identify certain issues and fix them with remedial solutions. It includes information about premium quality, cheap price, convenience, brand value, etc. Showcasing this set of slides titled Key Statistics Indicating E Commerce Consumer Demand Professional PDF. The topics addressed in these templates are E Commerce, Purchased, Product. All the content presented in this PPT design is completely editable. Download it and make adjustments in color, background, font etc. as per your unique business setting.
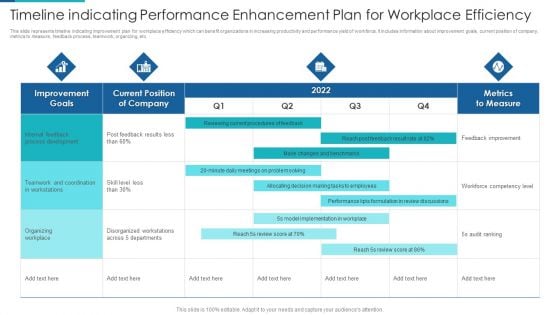
Timeline Indicating Performance Enhancement Plan For Workplace Efficiency Information PDF
This slide represents timeline indicating improvement plan for workplace efficiency which can benefit organizations in increasing productivity and performance yield of workforce. It includes information about improvement goals, current position of company, metrics to measure, feedback process, teamwork, organizing, etc. Showcasing this set of slides titled Timeline Indicating Performance Enhancement Plan For Workplace Efficiency Information PDF. The topics addressed in these templates are Teamwork, Process Development, Organizing Workplace. All the content presented in this PPT design is completely editable. Download it and make adjustments in color, background, font etc. as per your unique business setting.
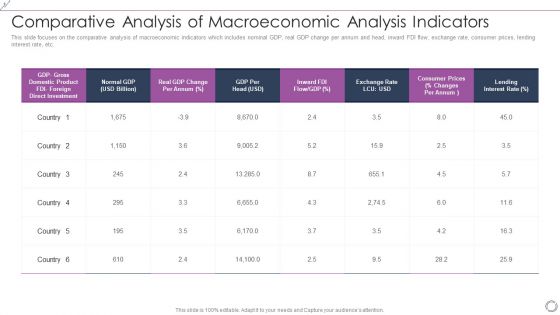
Comparative Analysis Of Macroeconomic Analysis Indicators Microsoft PDF
This slide focuses on the comparative analysis of macroeconomic indicators which includes nominal GDP, real GDP change per annum and head, inward FDI flow, exchange rate, consumer prices, lending interest rate, etc. Showcasing this set of slides titled Comparative Analysis Of Macroeconomic Analysis Indicators Microsoft PDF. The topics addressed in these templates are Normal GDP, Exchange Rate, Consumer Prices. All the content presented in this PPT design is completely editable. Download it and make adjustments in color, background, font etc. as per your unique business setting.
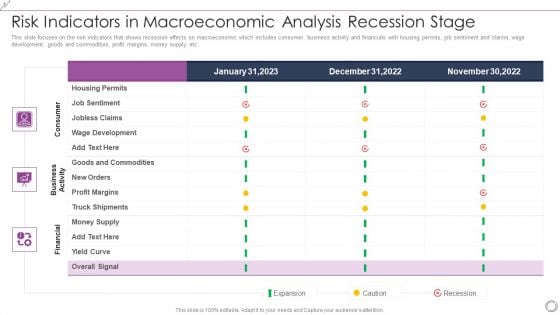
Risk Indicators In Macroeconomic Analysis Recession Stage Ideas PDF
This slide focuses on the risk indicators that shows recession effects on macroeconomic which includes consumer, business activity and financials with housing permits, job sentiment and claims, wage development, goods and commodities, profit margins, money supply, etc. Showcasing this set of slides titled Risk Indicators In Macroeconomic Analysis Recession Stage Ideas PDF. The topics addressed in these templates are Financial, Business Activity, Consumer. All the content presented in this PPT design is completely editable. Download it and make adjustments in color, background, font etc. as per your unique business setting.
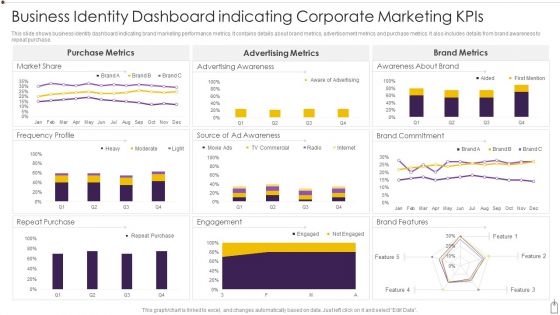
Business Identity Dashboard Indicating Corporate Marketing Kpis Diagrams PDF
This slide shows business identity dashboard indicating brand marketing performance metrics. It contains details about brand metrics, advertisement metrics and purchase metrics. It also includes details from brand awareness to repeat purchase. Showcasing this set of slides titled Business Identity Dashboard Indicating Corporate Marketing Kpis Diagrams PDF. The topics addressed in these templates are Purchase, Engagement, Market Share. All the content presented in this PPT design is completely editable. Download it and make adjustments in color, background, font etc. as per your unique business setting.
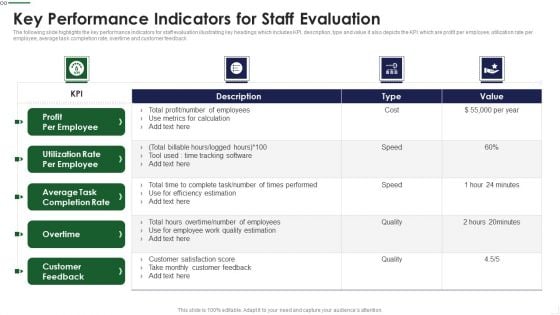
Key Performance Indicators For Staff Evaluation Infographics PDF
The following slide highlights the key performance Indicators for staff evaluation illustrating key headings which includes KPI, description, type and value it also depicts the KPI which are profit per employee, utilization rate per employee, average task completion rate, overtime and customer feedback Showcasing this set of slides titled Key Performance Indicators For Staff Evaluation Infographics PDF The topics addressed in these templates are Metrics Calculation, Times Performed, Customer Satisfaction All the content presented in this PPT design is completely editable. Download it and make adjustments in color, background, font etc. as per your unique business setting.
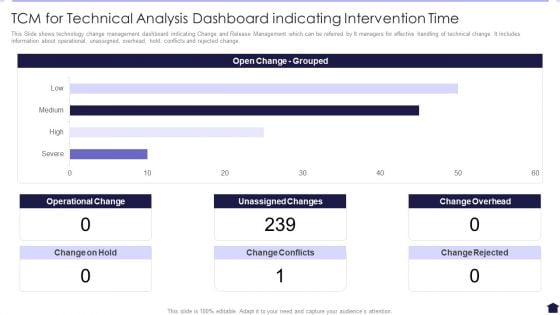
TCM For Technical Analysis Dashboard Indicating Intervention Time Background PDF
This Slide shows technology change management dashboard indicating Change and Release Management which can be referred by It managers for effective handling of technical change. It includes information about operational, unassigned, overhead, hold, conflicts and rejected change. Showcasing this set of slides titled TCM For Technical Analysis Dashboard Indicating Intervention Time Background PDF. The topics addressed in these templates are Operational Change, Unassigned Changes, Change Overhead. All the content presented in this PPT design is completely editable. Download it and make adjustments in color, background, font etc. as per your unique business setting.
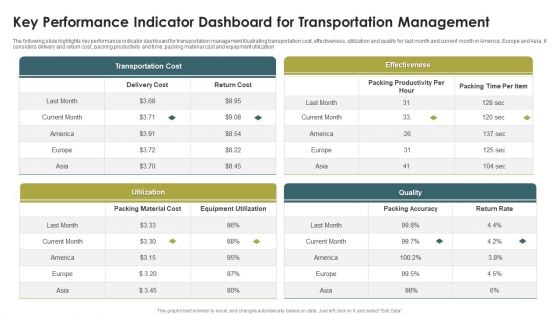
Key Performance Indicator Dashboard For Transportation Management Formats PDF
The following slide highlights key performance indicator dashboard for transportation management illustrating transportation cost, effectiveness, utilization and quality for last month and current month in America, Europe and Asia, it considers delivery and return cost, packing productivity and time, packing material cost and equipment utilization. Showcasing this set of slides titled Key Performance Indicator Dashboard For Transportation Management Formats PDF. The topics addressed in these templates are Transportation Cost, Effectiveness, Utilization, Quality. All the content presented in this PPT design is completely editable. Download it and make adjustments in color, background, font etc. as per your unique business setting.
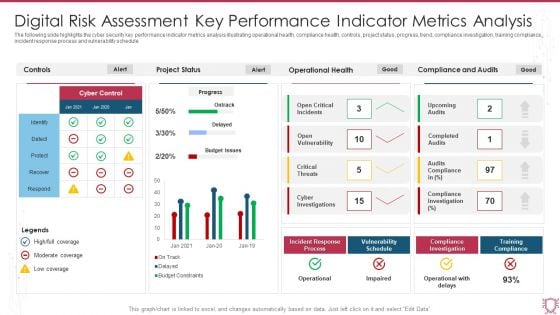
Digital Risk Assessment Key Performance Indicator Metrics Analysis Infographics PDF
The following slide highlights the cyber security key performance indicator metrics analysis illustrating operational health, compliance health, controls, project status, progress, trend, compliance investigation, training compliance, incident response process and vulnerability schedule. Showcasing this set of slides titled Digital Risk Assessment Key Performance Indicator Metrics Analysis Infographics PDF. The topics addressed in these templates are Project Status, Operational Health, Compliance And Audits. All the content presented in this PPT design is completely editable. Download it and make adjustments in color, background, font etc. as per your unique business setting.
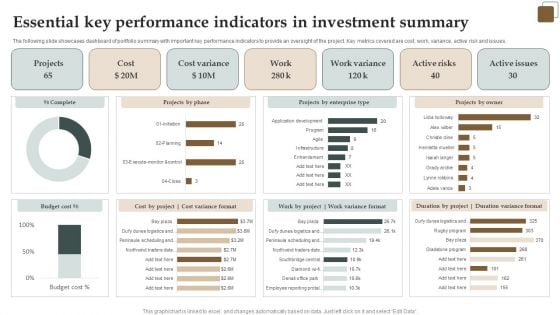
Essential Key Performance Indicators In Investment Summary Demonstration PDF
The following slide showcases dashboard of portfolio summary with important key performance indicators to provide an oversight of the project. Key metrics covered are cost, work, variance, active risk and issues. Showcasing this set of slides titled Essential Key Performance Indicators In Investment Summary Demonstration PDF. The topics addressed in these templates are Cost, Active Risks, Projects. All the content presented in this PPT design is completely editable. Download it and make adjustments in color, background, font etc. as per your unique business setting.
Financial Procedure Dashboard Indicating Yearly Revenue Analysis Icons PDF
This slide illustrates finance process dashboard indicating yearly revenue analysis which contains gross profit margin, operating profit ratio, net profit, revenue and cost of goods sold cogs operating expenses, etc. It can be referred by company owners who can compare it with previous years performance and make related decisions for future. Showcasing this set of slides titled Financial Procedure Dashboard Indicating Yearly Revenue Analysis Icons PDF. The topics addressed in these templates are Operating Profit Percentage, Net Profit Percentage, Operating Profit Ratio. All the content presented in this PPT design is completely editable. Download it and make adjustments in color, background, font etc. as per your unique business setting.
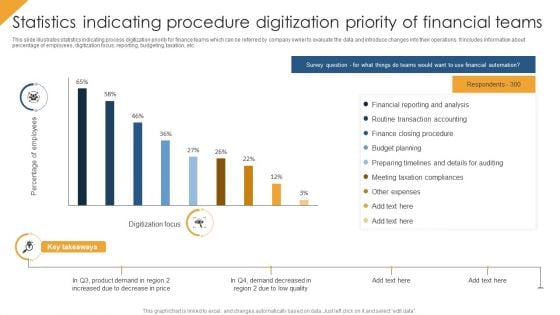
Statistics Indicating Procedure Digitization Priority Of Financial Teams Themes PDF
This slide illustrates statistics indicating process digitization priority for finance teams which can be referred by company owner to evaluate the data and introduce changes into their operations. It includes information about percentage of employees, digitization focus, reporting, budgeting, taxation, etc. Showcasing this set of slides titled Statistics Indicating Procedure Digitization Priority Of Financial Teams Themes PDF. The topics addressed in these templates are Budget Planning, Financial Reporting And Analysis, Other Expenses. All the content presented in this PPT design is completely editable. Download it and make adjustments in color, background, font etc. as per your unique business setting.
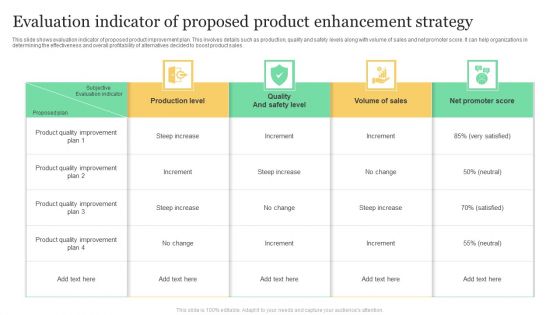
Evaluation Indicator Of Proposed Product Enhancement Strategy Guidelines PDF
This slide shows evaluation indicator of proposed product improvement plan. This involves details such as production, quality and safety levels along with volume of sales and net promoter score. It can help organizations in determining the effectiveness and overall profitability of alternatives decided to boost product sales. Showcasing this set of slides titled Evaluation Indicator Of Proposed Product Enhancement Strategy Guidelines PDF. The topics addressed in these templates are Production Level, Volume Of Sales, Net Promoter Score. All the content presented in this PPT design is completely editable. Download it and make adjustments in color, background, font etc. as per your unique business setting.
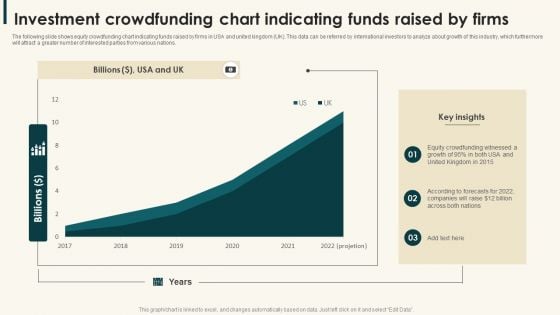
Investment Crowdfunding Chart Indicating Funds Raised By Firms Demonstration PDF
The following slide shows equity crowdfunding chart indicating funds raised by firms in USA and united kingdom UK. This data can be referred by international investors to analyze about growth of this industry, which furthermore will attract a greater number of interested parties from various nations.Showcasing this set of slides titled Investment Crowdfunding Chart Indicating Funds Raised By Firms Demonstration PDF. The topics addressed in these templates are Crowdfunding Witnessed, United Kingdom, Companies Raise. All the content presented in this PPT design is completely editable. Download it and make adjustments in color, background, font etc. as per your unique business setting.
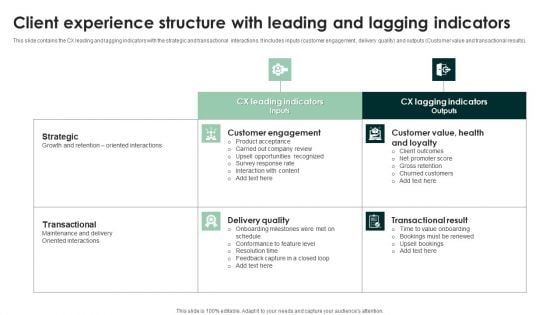
Client Experience Structure With Leading And Lagging Indicators Guidelines PDF
This slide contains the CX leading and lagging indicators with the strategic and transactional interactions. It includes inputs customer engagement , delivery quality and outputs Customer value and transactional results. Showcasing this set of slides titled Client Experience Structure With Leading And Lagging Indicators Guidelines PDF. The topics addressed in these templates are Customer Engagement, Delivery Quality, Transactional. All the content presented in this PPT design is completely editable. Download it and make adjustments in color, background, font etc. as per your unique business setting.


 Continue with Email

 Home
Home


