Metrics Dashboard
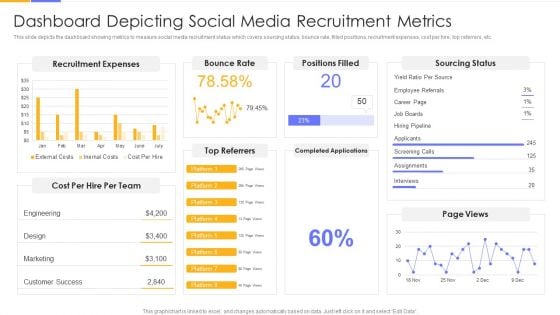
Establishing Social Media Hiring Plan Dashboard Depicting Social Media Recruitment Metrics Template PDF
This slide depicts the dashboard showing metrics to measure social media recruitment status which covers sourcing status, bounce rate, filled positions, recruitment expenses, cost per hire, top referrers, etc.Deliver an awe inspiring pitch with this creative Establishing Social Media Hiring Plan Dashboard Depicting Social Media Recruitment Metrics Template PDF bundle. Topics like Recruitment Expenses, Positions Filled, Sourcing Status can be discussed with this completely editable template. It is available for immediate download depending on the needs and requirements of the user.
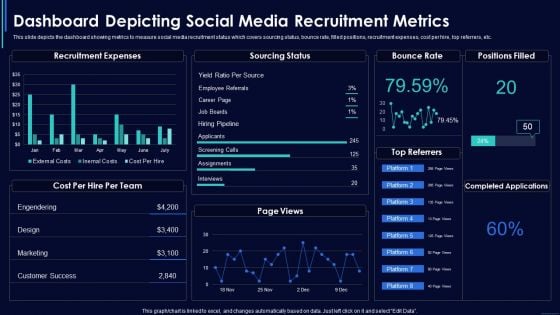
Social Media Hiring Strategic Procedure Dashboard Depicting Social Media Recruitment Metrics Rules PDF
This slide depicts the dashboard showing metrics to measure social media recruitment status which covers sourcing status, bounce rate, filled positions, recruitment expenses, cost per hire, top referrers, etc. Deliver an awe inspiring pitch with this creative Social Media Hiring Strategic Procedure Dashboard Depicting Social Media Recruitment Metrics Rules PDF bundle. Topics like Recruitment Expenses, Sourcing Status, Bounce Rate can be discussed with this completely editable template. It is available for immediate download depending on the needs and requirements of the user.
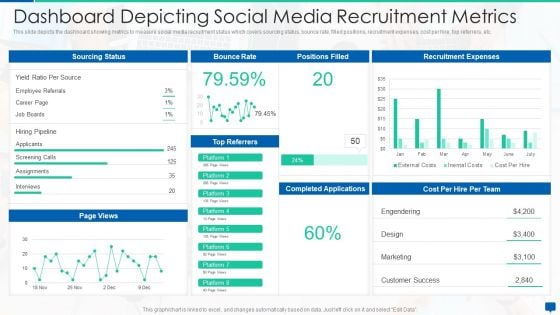
Social Media Hiring Process Optimization Dashboard Depicting Social Media Recruitment Metrics Elements PDF
This slide depicts the dashboard showing metrics to measure social media recruitment status which covers sourcing status, bounce rate, filled positions, recruitment expenses, cost per hire, top referrers, etc.Deliver an awe inspiring pitch with this creative social media hiring process optimization dashboard depicting social media recruitment metrics elements pdf bundle. Topics like accelerating the hiring process, recruitment marketing efforts, build talent community can be discussed with this completely editable template. It is available for immediate download depending on the needs and requirements of the user.
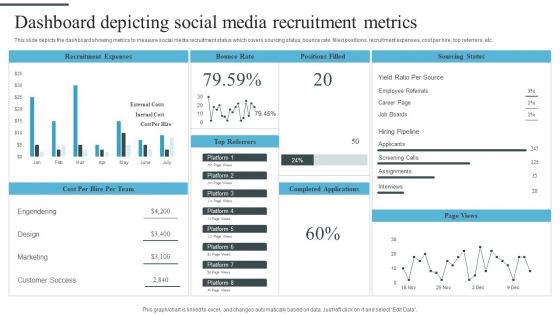
Tactical Process For Social Dashboard Depicting Social Media Recruitment Metrics Themes PDF
This slide depicts the dashboard showing metrics to measure social media recruitment status which covers sourcing status, bounce rate, filled positions, recruitment expenses, cost per hire, top referrers, etc. Deliver and pitch your topic in the best possible manner with this Tactical Process For Social Dashboard Depicting Social Media Recruitment Metrics Themes PDF. Use them to share invaluable insights on Recruitment Expenses, Bounce Rate, Positions Filled and impress your audience. This template can be altered and modified as per your expectations. So, grab it now.
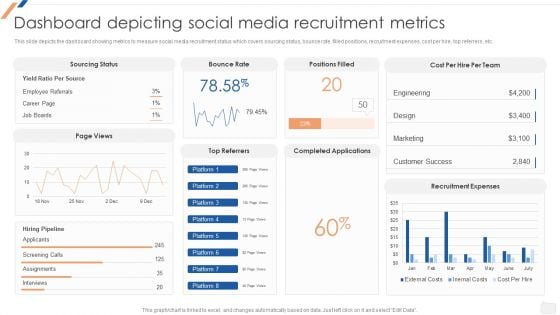
Dashboard Depicting Social Media Recruitment Metrics Enhancing Social Media Recruitment Process Slides PDF
This slide depicts the dashboard showing metrics to measure social media recruitment status which covers sourcing status, bounce rate, filled positions, recruitment expenses, cost per hire, top referrers, etc.The best PPT templates are a great way to save time, energy, and resources. Slidegeeks have 100 Precent editable powerpoint slides making them incredibly versatile. With these quality presentation templates, you can create a captivating and memorable presentation by combining visually appealing slides and effectively communicating your message. Download Dashboard Depicting Social Media Recruitment Metrics Enhancing Social Media Recruitment Process Slides PDF from Slidegeeks and deliver a wonderful presentation.
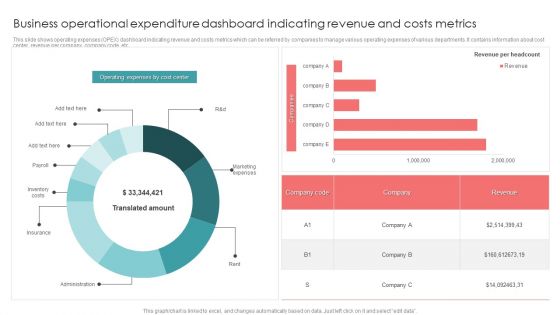
Business Operational Expenditure Dashboard Indicating Revenue And Costs Metrics Pictures PDF
This slide shows operating expenses OPEX dashboard indicating revenue and costs metrics which can be referred by companies to manage various operating expenses of various departments. It contains information about cost center, revenue per company, company code, etc. Pitch your topic with ease and precision using this Business Operational Expenditure Dashboard Indicating Revenue And Costs Metrics Pictures PDF. This layout presents information on Business Operational, Costs Metrics, Revenue. It is also available for immediate download and adjustment. So, changes can be made in the color, design, graphics or any other component to create a unique layout.
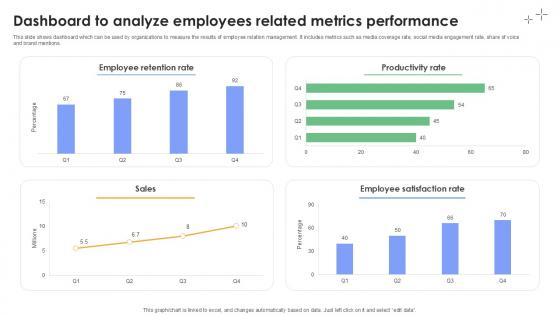
Dashboard To Analyze Employees Related Metrics Plan To Develop Ppt Slides
This slide shows dashboard which can be used by organizations to measure the results of employee relation management. It includes metrics such as media coverage rate, social media engagement rate, share of voice and brand mentions. Present like a pro with Dashboard To Analyze Employees Related Metrics Plan To Develop Ppt Slides. Create beautiful presentations together with your team, using our easy-to-use presentation slides. Share your ideas in real-time and make changes on the fly by downloading our templates. So whether you are in the office, on the go, or in a remote location, you can stay in sync with your team and present your ideas with confidence. With Slidegeeks presentation got a whole lot easier. Grab these presentations today. This slide shows dashboard which can be used by organizations to measure the results of employee relation management. It includes metrics such as media coverage rate, social media engagement rate, share of voice and brand mentions.
Tactical Approach To Vendor Relationship Dashboard To Track Supplier Performance Metrics Icons PDF
This slide focuses on dashboard to track supplier performance metrics which covers defect rate, on-time supplies, availability of supplier, lead time, types of defect and delivery status of suppliers.Deliver and pitch your topic in the best possible manner with this Tactical Approach To Vendor Relationship Dashboard To Track Supplier Performance Metrics Icons PDF Use them to share invaluable insights on Supplier Defect Rate, Supplier Availability, Supplier Defect and impress your audience. This template can be altered and modified as per your expectations. So, grab it now.
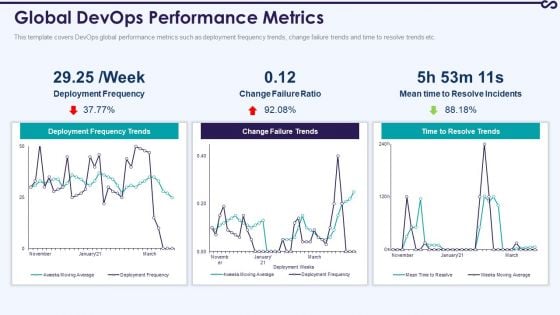
Development And Operations KPI Dashboard IT Global Devops Performance Metrics Themes PDF
This template covers DevOps global performance metrics such as deployment frequency trends, change failure trends and time to resolve trends etc. Deliver an awe inspiring pitch with this creative development and operations kpi dashboard it global devops performance metrics themes pdf bundle. Topics like global devops performance metrics can be discussed with this completely editable template. It is available for immediate download depending on the needs and requirements of the user.
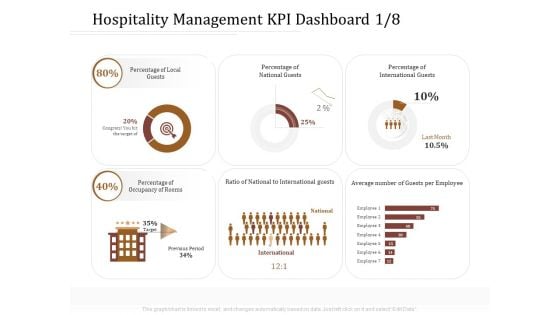
Key Metrics Hotel Administration Management Hospitality Management KPI Dashboard Average Graphics PDF
Presenting this set of slides with name key metrics hotel administration management hospitality management kpi dashboard average graphics pdf. The topics discussed in these slides are local guests, national guests, international guests, occupancy of rooms. This is a completely editable PowerPoint presentation and is available for immediate download. Download now and impress your audience.
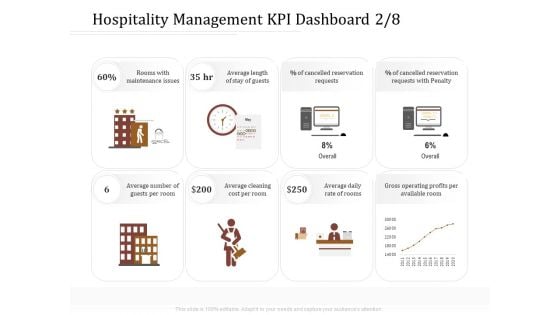
Key Metrics Hotel Administration Management Hospitality Management KPI Dashboard Cost Slides PDF
Presenting this set of slides with name key metrics hotel administration management hospitality management kpi dashboard cost slides pdf. The topics discussed in these slides are maintenance, average, reservation, penalty, cost. This is a completely editable PowerPoint presentation and is available for immediate download. Download now and impress your audience.
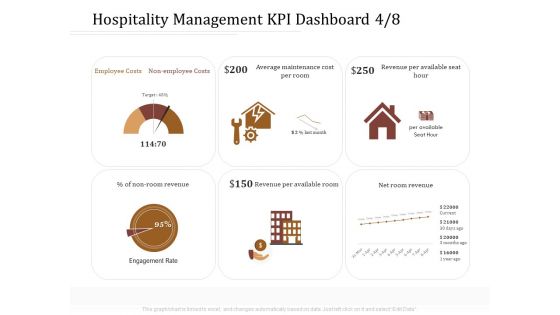
Key Metrics Hotel Administration Management Hospitality Management KPI Dashboard Employee Information PDF
Presenting this set of slides with name key metrics hotel administration management hospitality management kpi dashboard employee information pdf. The topics discussed in these slides are costs, maintenance, revenue, average. This is a completely editable PowerPoint presentation and is available for immediate download. Download now and impress your audience.
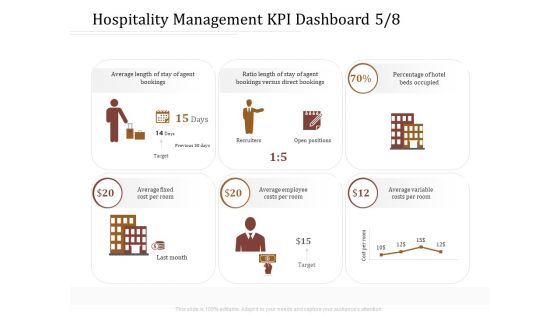
Key Metrics Hotel Administration Management Hospitality Management KPI Dashboard Fixed Pictures PDF
Presenting this set of slides with name key metrics hotel administration management hospitality management kpi dashboard fixed pictures pdf. The topics discussed in these slides are agent, recruiters, cost, average, employee. This is a completely editable PowerPoint presentation and is available for immediate download. Download now and impress your audience.
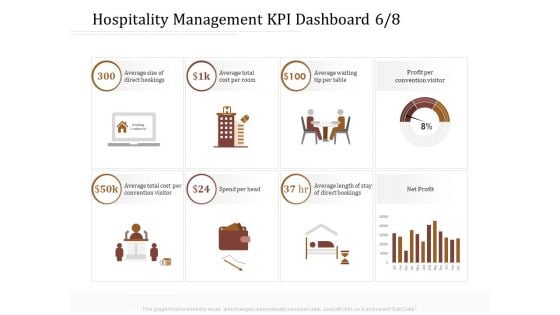
Key Metrics Hotel Administration Management Hospitality Management KPI Dashboard Head Information PDF
Presenting this set of slides with name key metrics hotel administration management hospitality management kpi dashboard head information pdf. The topics discussed in these slides are average, cost, convention visitor, net profit. This is a completely editable PowerPoint presentation and is available for immediate download. Download now and impress your audience.
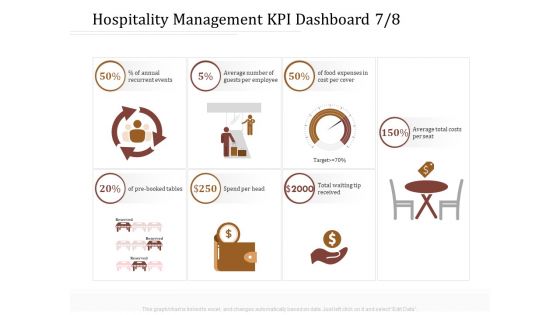
Key Metrics Hotel Administration Management Hospitality Management KPI Dashboard Number Structure PDF
Presenting this set of slides with name key metrics hotel administration management hospitality management kpi dashboard number structure pdf. The topics discussed in these slides are recurrent events, average, cost, target. This is a completely editable PowerPoint presentation and is available for immediate download. Download now and impress your audience.
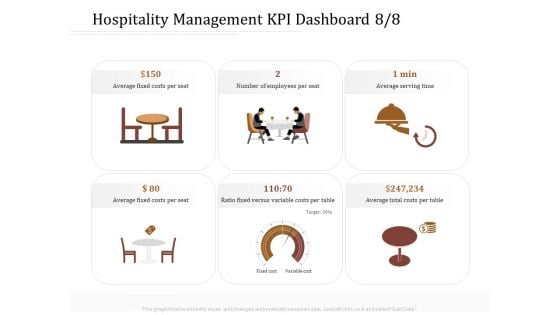
Key Metrics Hotel Administration Management Hospitality Management KPI Dashboard Per Download PDF
Presenting this set of slides with name key metrics hotel administration management hospitality management kpi dashboard per download pdf. The topics discussed in these slides are costs, average, target. This is a completely editable PowerPoint presentation and is available for immediate download. Download now and impress your audience.
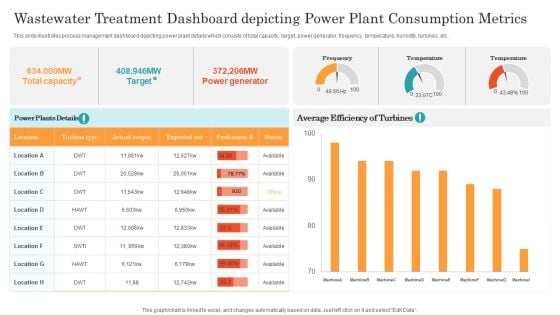
Wastewater Treatment Dashboard Depicting Power Plant Consumption Metrics Ppt Slides Tips PDF
This slide illustrates process management dashboard depicting power plant details which consists of total capacity, target, power generator, frequency, temperature, humidity, turbines, etc. Pitch your topic with ease and precision using this Wastewater Treatment Dashboard Depicting Power Plant Consumption Metrics Ppt Slides Tips PDF. This layout presents information on Power Generator, Target, Actual Output. It is also available for immediate download and adjustment. So, changes can be made in the color, design, graphics or any other component to create a unique layout.
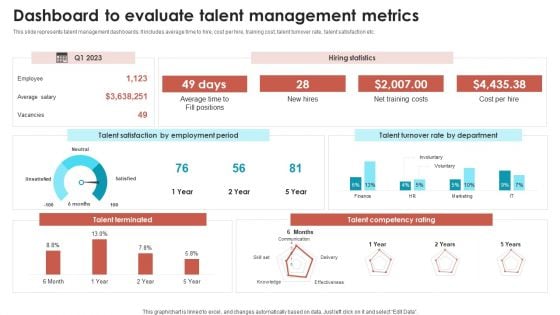
Talent Management Optimization With Workforce Staffing Dashboard To Evaluate Talent Management Metrics Summary PDF
This slide represents talent management dashboards. It includes average time to hire, cost per hire, training cost, talent turnover rate, talent satisfaction etc. There are so many reasons you need a Talent Management Optimization With Workforce Staffing Dashboard To Evaluate Talent Management Metrics Summary PDF. The first reason is you can not spend time making everything from scratch, Thus, Slidegeeks has made presentation templates for you too. You can easily download these templates from our website easily.
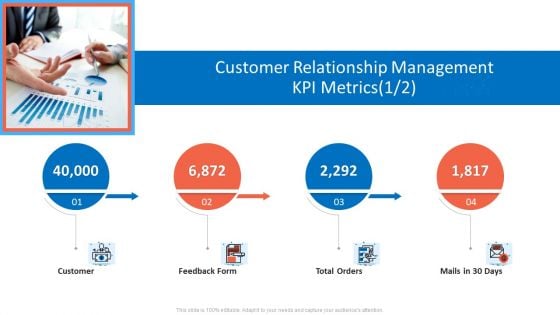
Customer Relationship Management Dashboard Customer Relationship Management KPI Metrics Form Elements PDF
Presenting customer relationship management dashboard customer relationship management kpi metrics form elements pdf to provide visual cues and insights. Share and navigate important information on four stages that need your due attention. This template can be used to pitch topics like customer, feedback form, total orders, mails in 30 days. In addtion, this PPT design contains high resolution images, graphics, etc, that are easily editable and available for immediate download.
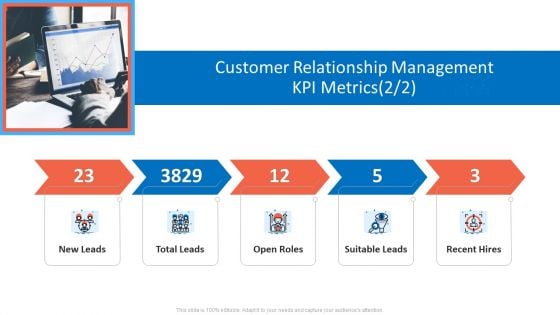
Customer Relationship Management Dashboard Customer Relationship Management KPI Metrics Open Ideas PDF
This is a customer relationship management dashboard customer relationship management kpi metrics open ideas pdf template with various stages. Focus and dispense information on five stages using this creative set, that comes with editable features. It contains large content boxes to add your information on topics like new leads, total leads, open roles, suitable leads, recent hires. You can also showcase facts, figures, and other relevant content using this PPT layout. Grab it now.

Employee Relations In Human Resource Dashboard To Analyze Employees Related Metrics Performance
This slide shows dashboard which can be used by organizations to measure the results of employee relation management. It includes metrics such as media coverage rate, social media engagement rate, share of voice and brand mentions. Present like a pro with Employee Relations In Human Resource Dashboard To Analyze Employees Related Metrics Performance. Create beautiful presentations together with your team, using our easy-to-use presentation slides. Share your ideas in real-time and make changes on the fly by downloading our templates. So whether you are in the office, on the go, or in a remote location, you can stay in sync with your team and present your ideas with confidence. With Slidegeeks presentation got a whole lot easier. Grab these presentations today. This slide shows dashboard which can be used by organizations to measure the results of employee relation management. It includes metrics such as media coverage rate, social media engagement rate, share of voice and brand mentions.
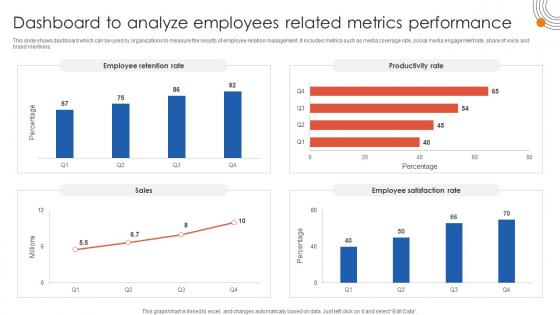
Human Resource Industrial Relationship Dashboard To Analyze Employees Related Metrics Performance
This slide shows dashboard which can be used by organizations to measure the results of employee relation management. It includes metrics such as media coverage rate, social media engagement rate, share of voice and brand mentions. Slidegeeks is here to make your presentations a breeze with Human Resource Industrial Relationship Dashboard To Analyze Employees Related Metrics Performance With our easy-to-use and customizable templates, you can focus on delivering your ideas rather than worrying about formatting. With a variety of designs to choose from, you are sure to find one that suits your needs. And with animations and unique photos, illustrations, and fonts, you can make your presentation pop. So whether you are giving a sales pitch or presenting to the board, make sure to check out Slidegeeks first This slide shows dashboard which can be used by organizations to measure the results of employee relation management. It includes metrics such as media coverage rate, social media engagement rate, share of voice and brand mentions.
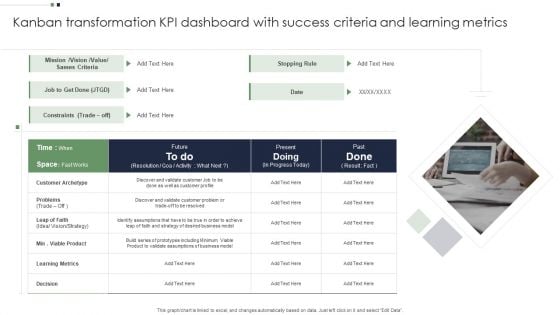
Kanban Transformation KPI Dashboard With Success Criteria And Learning Metrics Microsoft PDF
Persuade your audience using this Kanban Transformation KPI Dashboard With Success Criteria And Learning Metrics Microsoft PDF. This PPT design covers one stages, thus making it a great tool to use. It also caters to a variety of topics including Kanban Transformation KPI Dashboard, Success Criteria Learning Metrics. Download this PPT design now to present a convincing pitch that not only emphasizes the topic but also showcases your presentation skills.
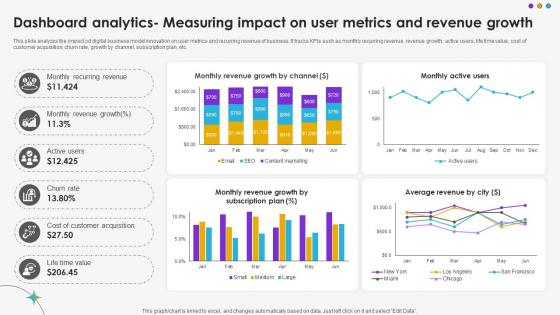
Dashboard Analytics Measuring Impact On User Metrics And Revenue Growth DT SS V
This slide analyzes the impact od digital business model innovation on user metrics and recurring revenue of business. It tracks KPIs such as monthly recurring revenue, revenue growth, active users, life time value, cost of customer acquisition, churn rate, growth by channel, subscription plan, etc.Are you searching for a Dashboard Analytics Measuring Impact On User Metrics And Revenue Growth DT SS V that is uncluttered, straightforward, and original Its easy to edit, and you can change the colors to suit your personal or business branding. For a presentation that expresses how much effort you have put in, this template is ideal With all of its features, including tables, diagrams, statistics, and lists, its perfect for a business plan presentation. Make your ideas more appealing with these professional slides. Download Dashboard Analytics Measuring Impact On User Metrics And Revenue Growth DT SS V from Slidegeeks today. This slide analyzes the impact od digital business model innovation on user metrics and recurring revenue of business. It tracks KPIs such as monthly recurring revenue, revenue growth, active users, life time value, cost of customer acquisition, churn rate, growth by channel, subscription plan, etc.
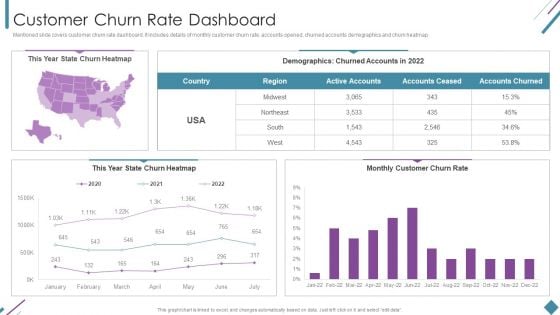
Metrics To Measure Business Performance Customer Churn Rate Dashboard Background PDF
Mentioned slide covers customer churn rate dashboard. It includes details of monthly customer churn rate, accounts opened, churned accounts demographics and churn heatmap. Deliver an awe inspiring pitch with this creative Metrics To Measure Business Performance Customer Churn Rate Dashboard Background PDF bundle. Topics likeCustomer Churn Rate, Churn Heatmap, Churned Accounts can be discussed with this completely editable template. It is available for immediate download depending on the needs and requirements of the user.
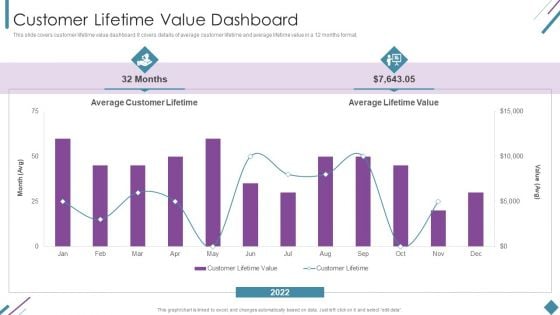
Metrics To Measure Business Performance Customer Lifetime Value Dashboard Slides PDF
This slide covers customer lifetime value dashboard. It covers details of average customer lifetime and average lifetime value in a 12 months format. Deliver and pitch your topic in the best possible manner with this Metrics To Measure Business Performance Customer Lifetime Value Dashboard Slides PDF. Use them to share invaluable insights on Average Customer Lifetime, Average Lifetime Value, 2022 and impress your audience. This template can be altered and modified as per your expectations. So, grab it now.
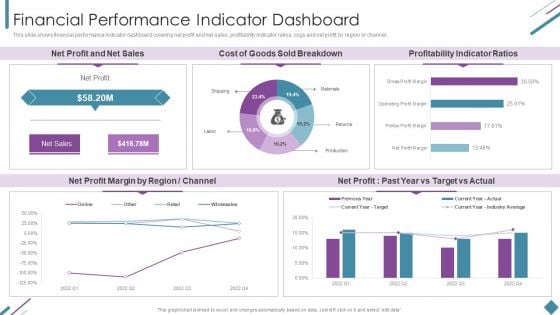
Metrics To Measure Business Performance Financial Performance Indicator Dashboard Pictures PDF
This slide shows financial performance indicator dashboard covering net profit and net sales, profitability indicator ratios, cogs and net profit by region or channel. Deliver an awe inspiring pitch with this creative Metrics To Measure Business Performance Financial Performance Indicator Dashboard Pictures PDF bundle. Topics like Net Profit, Net Sales, Cost Goods, Sold Breakdown can be discussed with this completely editable template. It is available for immediate download depending on the needs and requirements of the user.
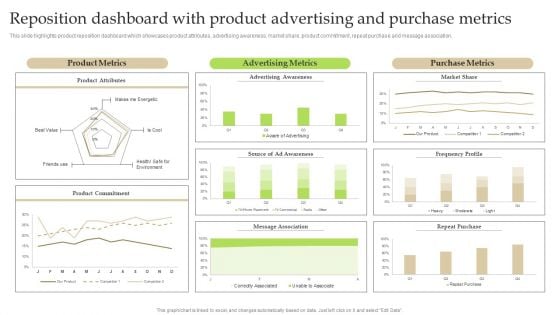
Reposition Dashboard With Product Advertising And Purchase Metrics Ppt PowerPoint Presentation File Show PDF
This slide highlights product reposition dashboard which showcases product attributes, advertising awareness, market share, product commitment, repeat purchase and message association. Formulating a presentation can take up a lot of effort and time, so the content and message should always be the primary focus. The visuals of the PowerPoint can enhance the presenters message, so our Reposition Dashboard With Product Advertising And Purchase Metrics Ppt PowerPoint Presentation File Show PDF was created to help save time. Instead of worrying about the design, the presenter can concentrate on the message while our designers work on creating the ideal templates for whatever situation is needed. Slidegeeks has experts for everything from amazing designs to valuable content, we have put everything into Reposition Dashboard With Product Advertising And Purchase Metrics Ppt PowerPoint Presentation File Show PDF
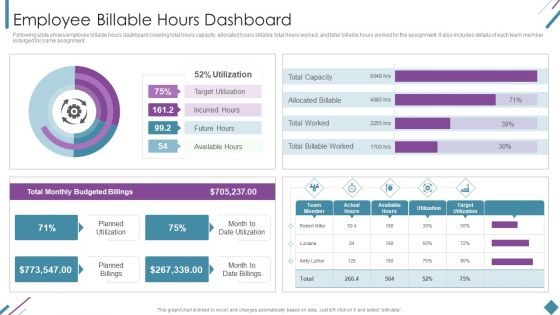
Metrics To Measure Business Performance Employee Billable Hours Dashboard Diagrams PDF
Following slide shows employee billable hours dashboard covering total hours capacity, allocated hours billable, total hours worked, and total billable hours worked for the assignment. It also includes details of each team member indulged for same assignment. Deliver an awe inspiring pitch with this creative Metrics To Measure Business Performance Employee Billable Hours Dashboard Diagrams PDF bundle. Topics like Total Monthly, Budgeted Billings, Planned Utilization can be discussed with this completely editable template. It is available for immediate download depending on the needs and requirements of the user.
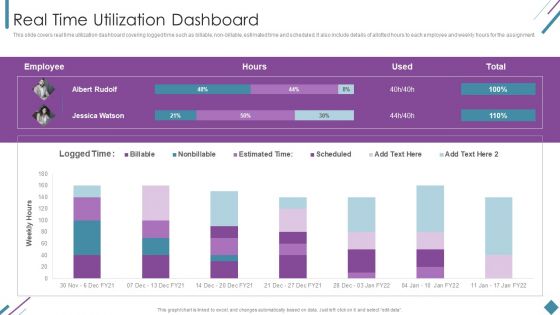
Metrics To Measure Business Performance Real Time Utilization Dashboard Topics PDF
This slide covers real time utilization dashboard covering logged time such as billable, non-billable, estimated time and scheduled. It also include details of allotted hours to each employee and weekly hours for the assignment. Deliver an awe inspiring pitch with this creative Metrics To Measure Business Performance Real Time Utilization Dashboard Topics PDF bundle. Topics like Weekly Hours, Employee, Estimated Time can be discussed with this completely editable template. It is available for immediate download depending on the needs and requirements of the user.
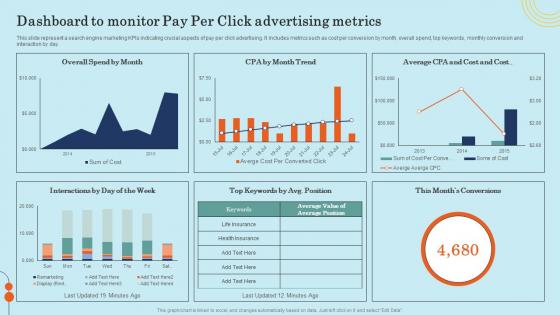
Dashboard To Monitor Pay Per Click Advertising Metrics Effective General Insurance Marketing Themes Pdf
This slide represent a search engine marketing KPIs indicating crucial aspects of pay per click advertising. It includes metrics such as cost per conversion by month, overall spend, top keywords, monthly conversion and interaction by day. Do you have to make sure that everyone on your team knows about any specific topic I yes, then you should give Dashboard To Monitor Pay Per Click Advertising Metrics Effective General Insurance Marketing Themes Pdf a try. Our experts have put a lot of knowledge and effort into creating this impeccable Dashboard To Monitor Pay Per Click Advertising Metrics Effective General Insurance Marketing Themes Pdf. You can use this template for your upcoming presentations, as the slides are perfect to represent even the tiniest detail. You can download these templates from the Slidegeeks website and these are easy to edit. So grab these today. This slide represent a search engine marketing KPIs indicating crucial aspects of pay per click advertising. It includes metrics such as cost per conversion by month, overall spend, top keywords, monthly conversion and interaction by day.
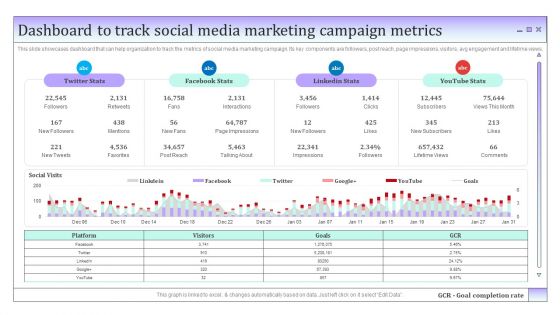
Business To Business Social Dashboard To Track Social Media Marketing Campaign Metrics Microsoft PDF
This slide showcases dashboard that can help organization to track the metrics of social media marketing campaign. Its key components are followers, post reach, page impressions, visitors, avg engagement and lifetime views. Here you can discover an assortment of the finest PowerPoint and Google Slides templates. With these templates, you can create presentations for a variety of purposes while simultaneously providing your audience with an eye-catching visual experience. Download Business To Business Social Dashboard To Track Social Media Marketing Campaign Metrics Microsoft PDF to deliver an impeccable presentation. These templates will make your job of preparing presentations much quicker, yet still, maintain a high level of quality. Slidegeeks has experienced researchers who prepare these templates and write high-quality content for you. Later on, you can personalize the content by editing the Business To Business Social Dashboard To Track Social Media Marketing Campaign Metrics Microsoft PDF.
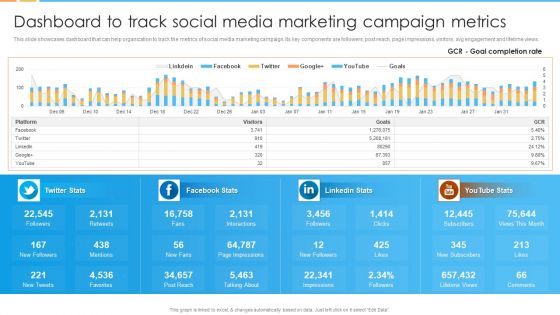
Digital Marketing Guide For B2B Firms Dashboard To Track Social Media Marketing Campaign Metrics Demonstration PDF
This slide showcases dashboard that can help organization to track the metrics of social media marketing campaign. Its key components are followers, post reach, page impressions, visitors, avg engagement and lifetime views.Deliver an awe inspiring pitch with this creative Digital Marketing Guide For B2B Firms Dashboard To Track Social Media Marketing Campaign Metrics Demonstration PDF bundle. Topics like Page Impressions, New Followers, Talking About can be discussed with this completely editable template. It is available for immediate download depending on the needs and requirements of the user.
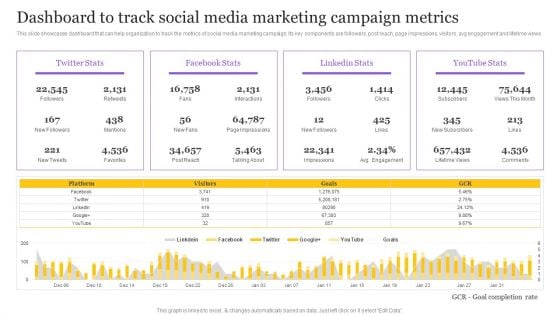
Digital Marketing Strategy Dashboard To Track Social Media Marketing Campaign Metrics Diagrams PDF
This slide showcases dashboard that can help organization to track the metrics of social media marketing campaign. Its key components are followers, post reach, page impressions, visitors, avg engagement and lifetime views. Retrieve professionally designed Digital Marketing Strategy Dashboard To Track Social Media Marketing Campaign Metrics Diagrams PDF to effectively convey your message and captivate your listeners. Save time by selecting pre-made slideshows that are appropriate for various topics, from business to educational purposes. These themes come in many different styles, from creative to corporate, and all of them are easily adjustable and can be edited quickly. Access them as PowerPoint templates or as Google Slides themes. You dont have to go on a hunt for the perfect presentation because Slidegeeks got you covered from everywhere.
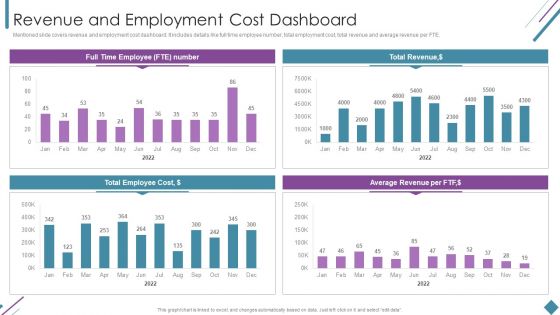
Metrics To Measure Business Performance Revenue And Employment Cost Dashboard Clipart PDF
Mentioned slide covers revenue and employment cost dashboard. It includes details like full time employee number, total employment cost, total revenue and average revenue per FTE. Deliver and pitch your topic in the best possible manner with this Metrics To Measure Business Performance Revenue And Employment Cost Dashboard Clipart PDF. Use them to share invaluable insights on Total Revenue, Average Revenue Per, Total Employee Cost and impress your audience. This template can be altered and modified as per your expectations. So, grab it now.
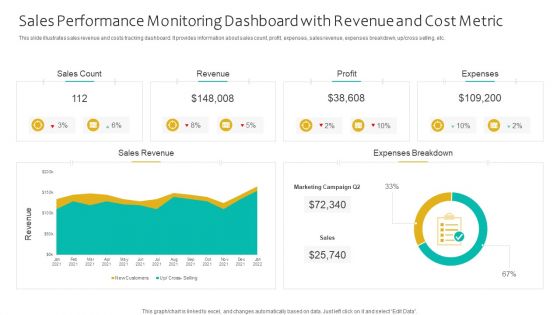
Sales Performance Monitoring Dashboard With Revenue And Cost Metric Ppt Portfolio Good PDF
This slide illustrates sales revenue and costs tracking dashboard. It provides information about sales count, profit, expenses, sales revenue, expenses breakdown, up or cross selling, etc. Showcasing this set of slides titled Sales Performance Monitoring Dashboard With Revenue And Cost Metric Ppt Portfolio Good PDF. The topics addressed in these templates are Sales Count, Revenue, Profit, Expenses. All the content presented in this PPT design is completely editable. Download it and make adjustments in color, background, font etc. as per your unique business setting.
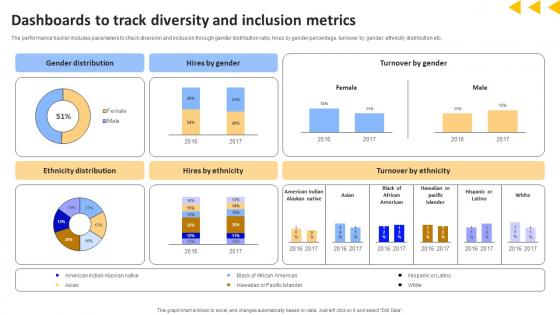
Workforce Productivity Improvement Dashboards To Track Diversity And Inclusion Metrics Structure Pdf
The performance tracker includes parameters to check diversion and inclusion through gender distribution ratio, hires by gender percentage, turnover by gender, ethnicity distribution etc. Coming up with a presentation necessitates that the majority of the effort goes into the content and the message you intend to convey. The visuals of a PowerPoint presentation can only be effective if it supplements and supports the story that is being told. Keeping this in mind our experts created Workforce Productivity Improvement Dashboards To Track Diversity And Inclusion Metrics Structure Pdf to reduce the time that goes into designing the presentation. This way, you can concentrate on the message while our designers take care of providing you with the right template for the situation. The performance tracker includes parameters to check diversion and inclusion through gender distribution ratio, hires by gender percentage, turnover by gender, ethnicity distribution etc.
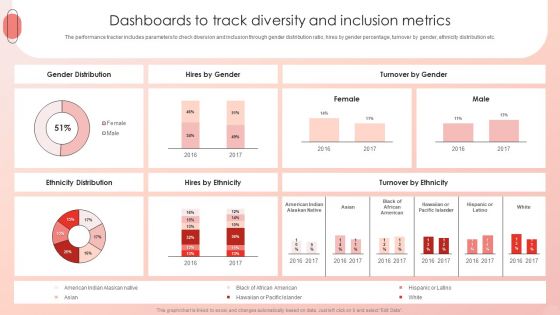
Improving HRM Process Dashboards To Track Diversity And Inclusion Metrics Background PDF
The performance tracker includes parameters to check diversion and inclusion through gender distribution ratio, hires by gender percentage, turnover by gender, ethnicity distribution etc. Are you in need of a template that can accommodate all of your creative concepts This one is crafted professionally and can be altered to fit any style. Use it with Google Slides or PowerPoint. Include striking photographs, symbols, depictions, and other visuals. Fill, move around, or remove text boxes as desired. Test out color palettes and font mixtures. Edit and save your work, or work with colleagues. Download Improving HRM Process Dashboards To Track Diversity And Inclusion Metrics Background PDF and observe how to make your presentation outstanding. Give an impeccable presentation to your group and make your presentation unforgettable.
Dashboard For Risk Communication Strategies Planning And Key Metrics Tracking Brochure PDF Ideas PDF
This slide shows dashboard for planning risk communication and tracking key metrics which includes heat map of risk, classification, objectives, effectiveness, critical risks, etc. Showcasing this set of slides titled Dashboard For Risk Communication Strategies Planning And Key Metrics Tracking Brochure PDF Ideas PDF. The topics addressed in these templates are Risk Heat Map, Tactical Objectives, Controls Effectiveness. All the content presented in this PPT design is completely editable. Download it and make adjustments in color, background, font etc. as per your unique business setting.
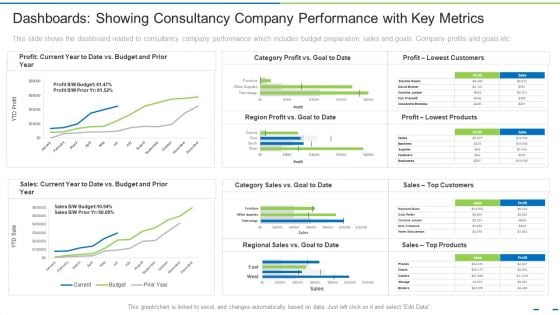
Dashboards Showing Consultancy Company Performance With Key Metrics Ppt Ideas Smartart PDF
This slide shows the dashboard related to consultancy company performance which includes budget preparation, sales and goals. Company profits and goals etc. Deliver an awe-inspiring pitch with this creative dashboards showing consultancy company performance with key metrics ppt ideas smartart pdf bundle. Topics like budget, products, customers can be discussed with this completely editable template. It is available for immediate download depending on the needs and requirements of the user.
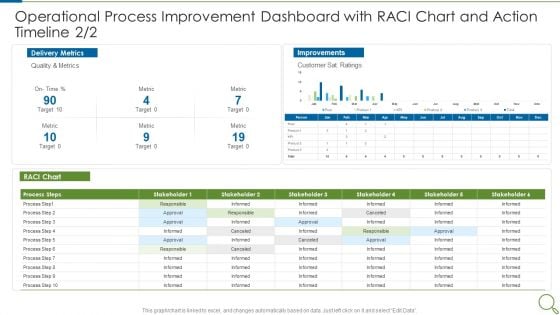
Operational Process Improvement Dashboard With RACI Chart And Action Timeline Metric Designs PDF
Deliver an awe inspiring pitch with this creative operational process improvement dashboard with raci chart and action timeline metric designs pdf bundle. Topics like metric, target, quality, customer can be discussed with this completely editable template. It is available for immediate download depending on the needs and requirements of the user.
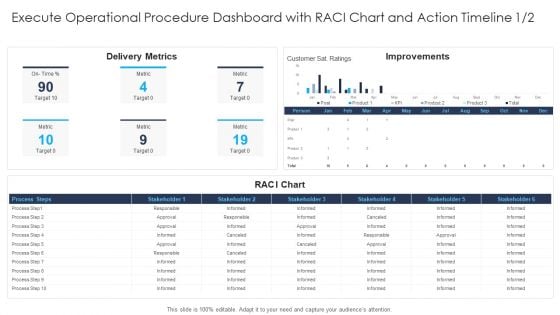
Execute Operational Procedure Dashboard With Raci Chart And Action Timeline Metric Designs PDF
Deliver and pitch your topic in the best possible manner with this execute operational procedure dashboard with raci chart and action timeline metric designs pdf. Use them to share invaluable insights on execute operational procedure dashboard with raci chart and action timeline and impress your audience. This template can be altered and modified as per your expectations. So, grab it now.
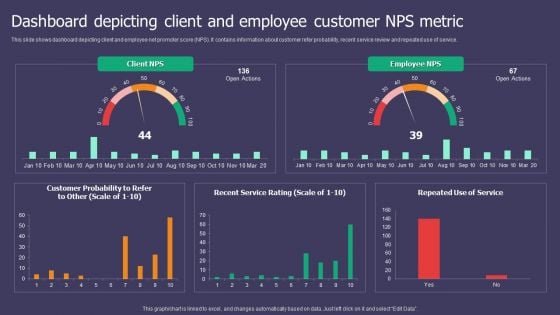
Dashboard Depicting Client And Employee Customer NPS Metric Ppt Gallery Deck PDF
This slide shows dashboard depicting client and employee net promoter score NPS. It contains information about customer refer probability, recent service review and repeated use of service. Showcasing this set of slides titled Dashboard Depicting Client And Employee Customer NPS Metric Ppt Gallery Deck PDF. The topics addressed in these templates are Client NPS, Employee NPS, Customer Probability. All the content presented in this PPT design is completely editable. Download it and make adjustments in color, background, font etc. as per your unique business setting.

Consumption Metrics Sharing Metrics Ppt Example
This is a consumption metrics sharing metrics ppt example. This is a four stage process. The stages in this process are circle charts, business, marketing.
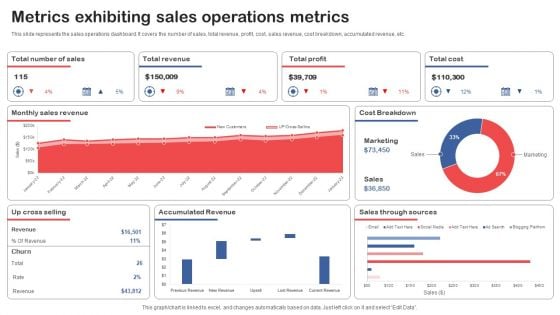
Metrics Exhibiting Sales Operations Metrics Topics PDF
This slide represents the sales operations dashboard. It covers the number of sales, total revenue, profit, cost, sales revenue, cost breakdown, accumulated revenue, etc. Showcasing this set of slides titled Metrics Exhibiting Sales Operations Metrics Topics PDF. The topics addressed in these templates are Total Revenue, Total Profit, Total Cost. All the content presented in this PPT design is completely editable. Download it and make adjustments in color, background, font etc. as per your unique business setting.
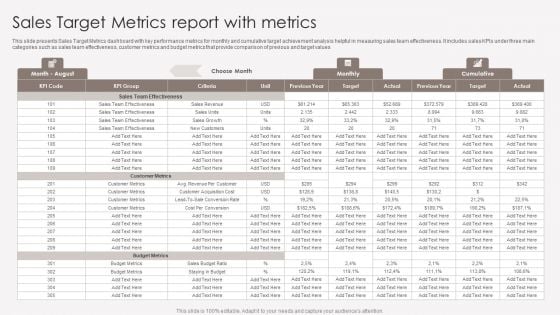
Sales Target Metrics Report With Metrics Introduction PDF
This slide presents Sales Target Metrics dashboard with key performance metrics for monthly and cumulative target achievement analysis helpful in measuring sales team effectiveness. It includes sales KPIs under three main categories such as sales team effectiveness, customer metrics and budget metrics that provide comparison of previous and target values. Pitch your topic with ease and precision using this Sales Target Metrics Report With Metrics Introduction PDF. This layout presents information on Sales Team Effectiveness, Customer Metrics, Budget Metrics. It is also available for immediate download and adjustment. So, changes can be made in the color, design, graphics or any other component to create a unique layout.
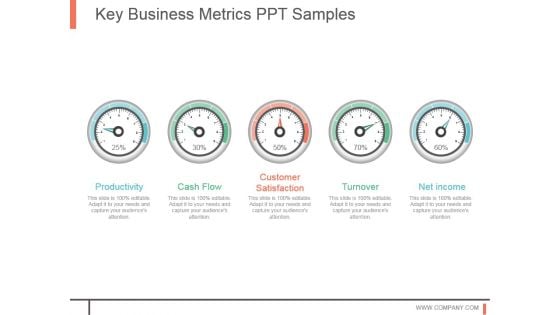
Key Business Metrics Ppt Samples
This is a key business metrics ppt samples. This is a five stage process. The stages in this process are productivity, cash flow, customer satisfaction, turnover, net income.
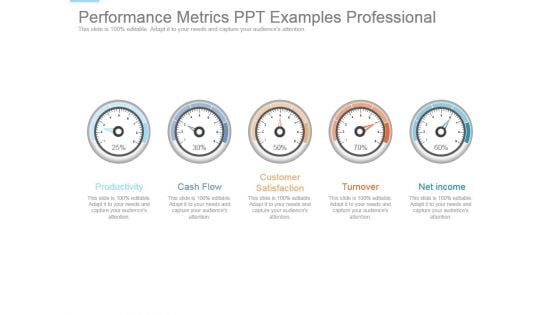
Performance Metrics Ppt Examples Professional
This is a performance metrics ppt examples professional. This is a five stage process. The stages in this process are productivity, cash flow, customer satisfaction, turnover, net income.

Key Evaluation Metrics Ppt Slides
This is a key evaluation metrics ppt slides. This is a five stage process. The stages in this process are business, finance, marketing, symbol.
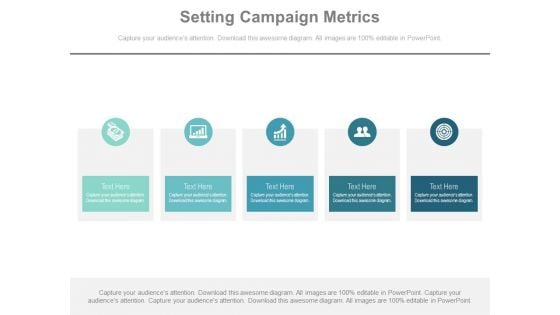
Setting Campaign Metrics Ppt Slides
This is a setting campaign metrics ppt slides. This is a five stage process. The stages in this process are business, marketing, success.
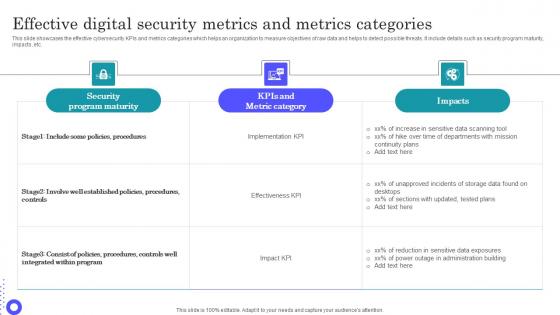
Effective Digital Security Metrics And Metrics Categories Microsoft Pdf
Pitch your topic with ease and precision using this Effective Digital Security Metrics And Metrics Categories Microsoft Pdf This layout presents information on Security Program Maturity, Metric Category, Sensitive Data Scanning It is also available for immediate download and adjustment. So, changes can be made in the color, design, graphics or any other component to create a unique layout. This slide showcases the effective cybersecurity KPIs and metrics categories which helps an organization to measure objectives of raw data and helps to detect possible threats. It include details such as security program maturity, impacts, etc.
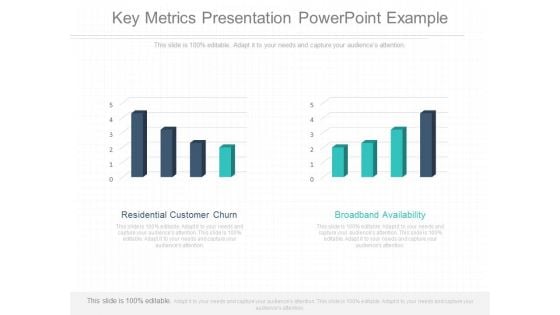
Key Metrics Presentation Powerpoint Example
This is a key metrics presentation powerpoint example. This is a two stage process. The stages in this process are residential customer churn, broadband availability.
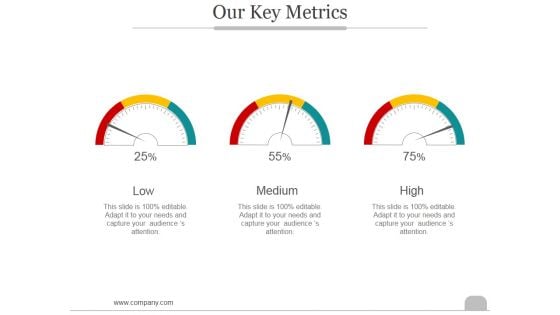
Our Key Metrics Ppt PowerPoint Presentation Gallery
This is a our key metrics ppt powerpoint presentation gallery. This is a three stage process. The stages in this process are low, medium, high.
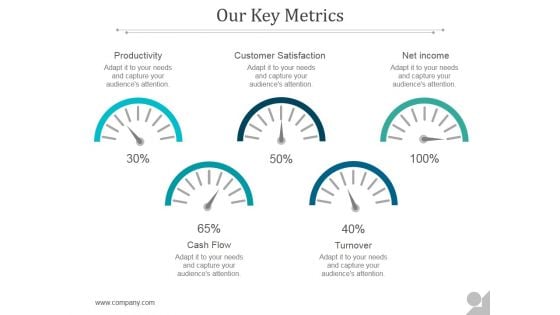
Our Key Metrics Ppt PowerPoint Presentation Examples
This is a our key metrics ppt powerpoint presentation examples. This is a five stage process. The stages in this process are productivity, customer satisfaction, net income, cash flow, turnover.
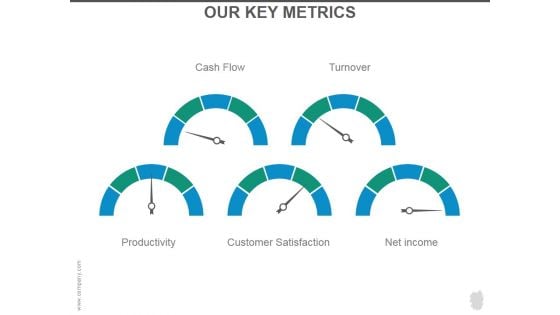
Our Key Metrics Ppt PowerPoint Presentation Portfolio
This is a our key metrics ppt powerpoint presentation portfolio. This is a five stage process. The stages in this process are cash flow, turnover, productivity, customer satisfaction, net income.
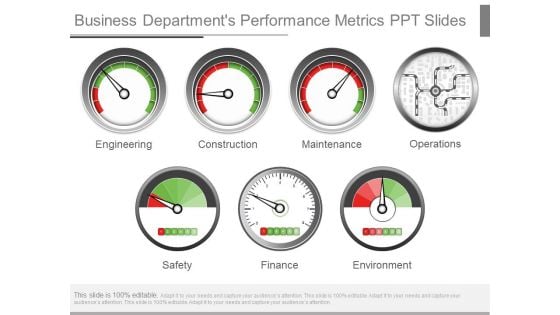
Business Departments Performance Metrics Ppt Slides
This is a business departments performance metrics ppt slides. This is a seven stage process. The stages in this process are engineering, construction, maintenance, operations, safety, finance, environment.
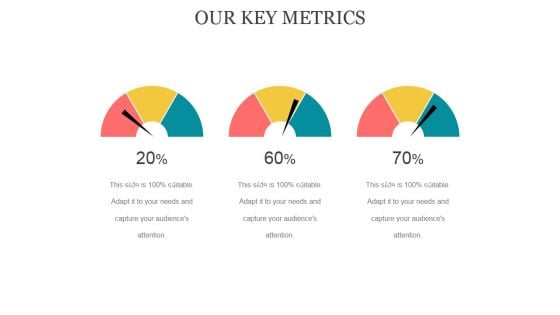
Our Key Metrics Ppt PowerPoint Presentation Styles
This is a our key metrics ppt powerpoint presentation styles. This is a three stage process. The stages in this process are business, marketing, dashboard, planning, analysis.
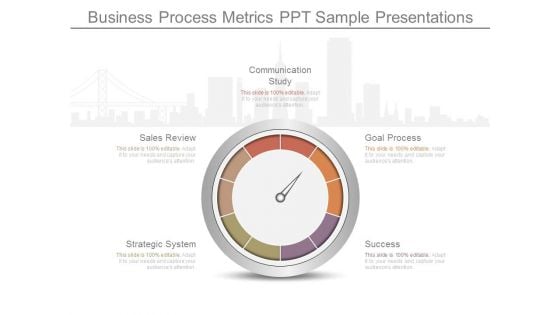
Business Process Metrics Ppt Sample Presentations
This is a business process metrics ppt sample presentations. This is a five stage process. The stages in this process are communication study, goal process, success, strategic system, sales review.
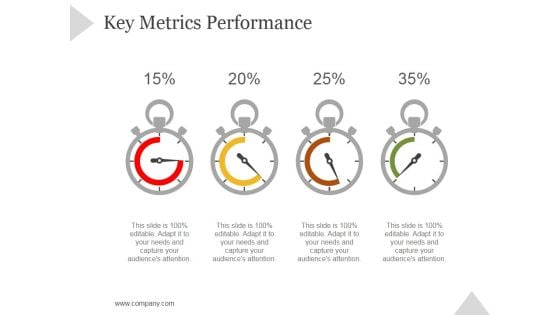
Key Metrics Performance Ppt PowerPoint Presentation Tips
This is a key metrics performance ppt powerpoint presentation tips. This is a four stage process. The stages in this process are business, strategy, marketing, success, dashboard, measuring.
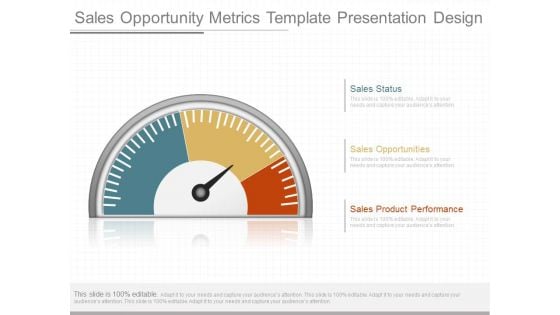
Sales Opportunity Metrics Template Presentation Design
This is a sales opportunity metrics template presentation design. This is a three stage process. The stages in this process are sales status, sales opportunities, sales product performance.


 Continue with Email

 Home
Home


