Metrics Dashboard
Satisfaction Rate Icon For Customer Service Metrics Summary PDF
Persuade your audience using this Satisfaction Rate Icon For Customer Service Metrics Summary PDF. This PPT design covers four stages, thus making it a great tool to use. It also caters to a variety of topics including Satisfaction Rate Icon, Customer Service Metrics. Download this PPT design now to present a convincing pitch that not only emphasizes the topic but also showcases your presentation skills.
Our Key Metrics Ppt PowerPoint Presentation Icon Slide
This is a our key metrics ppt powerpoint presentation icon slide. This is a five stage process. The stages in this process are cash flow, turnover, productivity, net income, customer satisfaction .
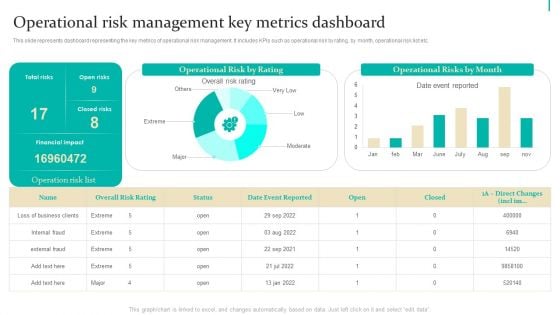
Enterprise Risk Management Operational Risk Management Key Metrics Inspiration PDF
This slide represents dashboard representing the key metrics of operational risk management. It includes KPIs such as operational risk by rating, by month, operational risk list etc. Boost your pitch with our creative Enterprise Risk Management Operational Risk Management Key Metrics Inspiration PDF. Deliver an awe-inspiring pitch that will mesmerize everyone. Using these presentation templates you will surely catch everyones attention. You can browse the ppts collection on our website. We have researchers who are experts at creating the right content for the templates. So you dont have to invest time in any additional work. Just grab the template now and use them.
Education Metrics Tracker For Students Performance Evaluation Professional PDF
This slide covers student performance analysis dashboard. It include metrics student count, student attendance, average subject score, branch examination results, student count by grade, etc. Showcasing this set of slides titled Education Metrics Tracker For Students Performance Evaluation Professional PDF. The topics addressed in these templates are Students Count, Grade And Gender, Students Details, Examination Results Branch. All the content presented in this PPT design is completely editable. Download it and make adjustments in color, background, font etc. as per your unique business setting.
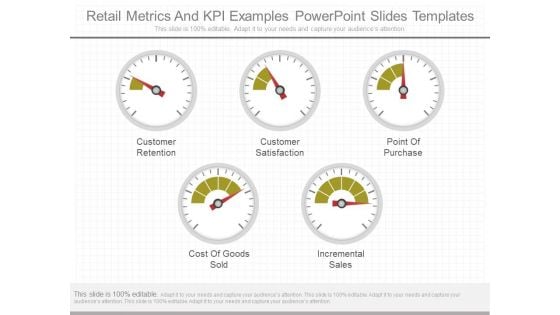
Retail Metrics And Kpi Examples Powerpoint Slides Templates
This is a retail metrics and kpi examples powerpoint slides templates. This is a five stage process. The stages in this process are customer retention, customer satisfaction, point of purchase, cost of goods sold, incremental sales.
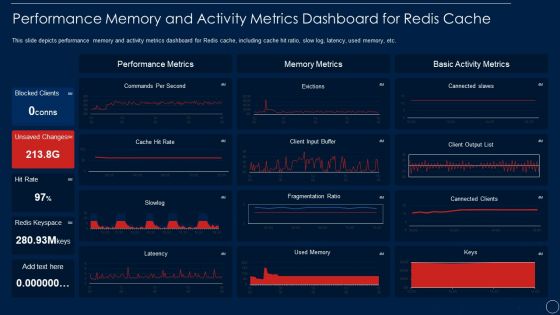
Redis Cache Data Structure IT Performance Memory And Activity Metrics Introduction PDF
This slide depicts performance memory and activity metrics dashboard for Redis cache, including cache hit ratio, slow log, latency, used memory, etc. This is a redis cache data structure it performance memory and activity metrics introduction pdf template with various stages. Focus and dispense information on one stages using this creative set, that comes with editable features. It contains large content boxes to add your information on topics like performance memory and activity metrics dashboard for redis cache. You can also showcase facts, figures, and other relevant content using this PPT layout. Grab it now.
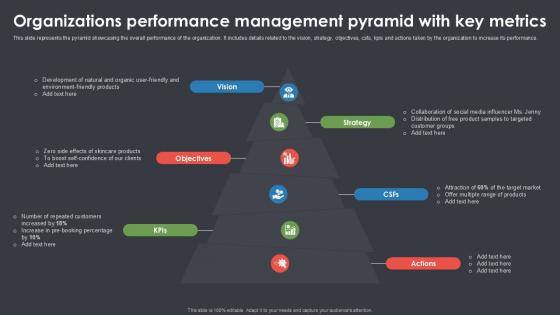
Organizations Performance Management Pyramid With Key Metrics Ppt Example SS
The following slide showcases business sustainability dashboard highlighting multiple sources of technology. It provides information about renewable energy, plant age, solar, wind, biomass, regionality, etc. Here you can discover an assortment of the finest PowerPoint and Google Slides templates. With these templates, you can create presentations for a variety of purposes while simultaneously providing your audience with an eye-catching visual experience. Download Organizations Performance Management Pyramid With Key Metrics Ppt Example SS to deliver an impeccable presentation. These templates will make your job of preparing presentations much quicker, yet still, maintain a high level of quality. Slidegeeks has experienced researchers who prepare these templates and write high-quality content for you. Later on, you can personalize the content by editing the Organizations Performance Management Pyramid With Key Metrics Ppt Example SS The following slide showcases business sustainability dashboard highlighting multiple sources of technology. It provides information about renewable energy, plant age, solar, wind, biomass, regionality, etc.
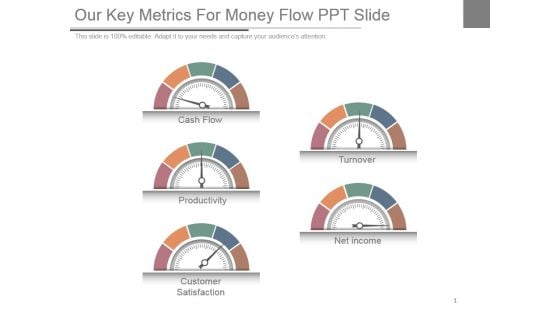
Our Key Metrics For Money Flow Ppt Slide
This is a our key metrics for money flow ppt slide. This is a five stage process. The stages in this process are cash flow, productivity, customer satisfaction, turnover, net income.
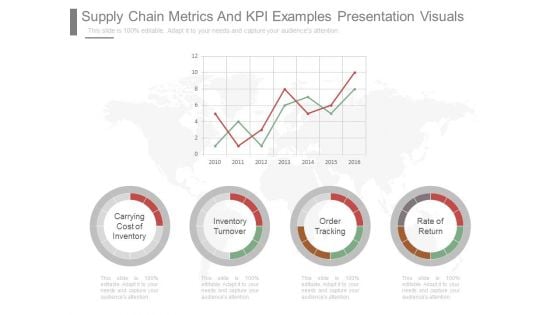
Supply Chain Metrics And Kpi Examples Presentation Visuals
This is a supply chain metrics and kpi examples presentation visuals. This is a four stage process. The stages in this process are carrying cost of inventory, inventory turnover, order tracking, rate of return.
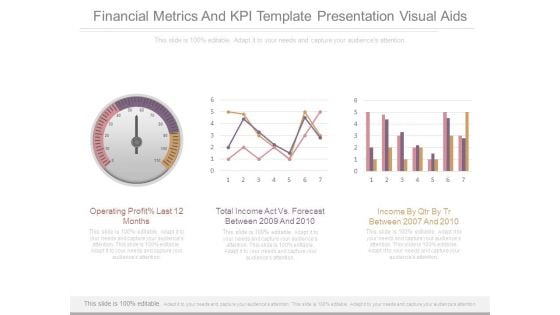
Financial Metrics And Kpi Template Presentation Visual Aids
This is a financial metrics and kpi template presentation visual aids. This is a three stage process. The stages in this process are operating profit last 12 months, total income act vs forecast between 2009 and 2010, income by qtr by tr between 2007 and 2010.
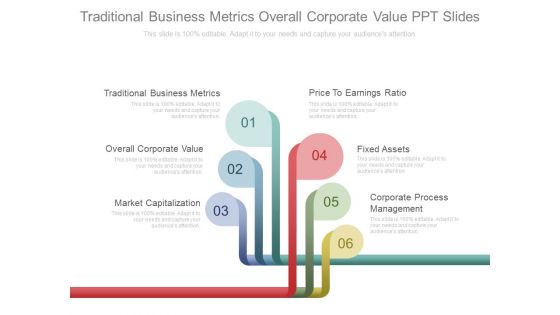
Traditional Business Metrics Overall Corporate Value Ppt Slides
This is a traditional business metrics overall corporate value ppt slides. This is a six stage process. The stages in this process are success, business, marketing.
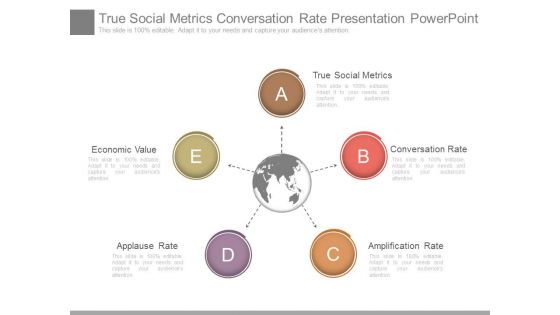
True Social Metrics Conversation Rate Presentation PowerPoint Slides
This is a true social metrics conversation rate presentation powerpoint slide. This is a five stage process. The stages in this process are technology, globe, marketing, business.
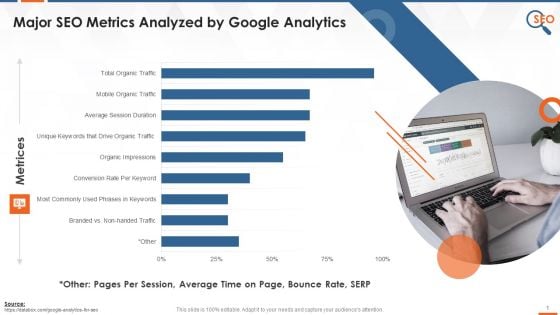
SEO Metrics That Google Analytics Analyses Training Ppt
This slide graphically presents the major SEO metrics analyzed by Google Analytics tools such as total organic traffic, average session duration, conversion rate per keyword, branded vs. non-branded traffic, etc.
Business Diagram Metrics For Performance Measurement Presentation Template
This diagram slide has been designed with graphic of matrix. You may use this matrix for performance management. Download this diagram to make interactive presentations.
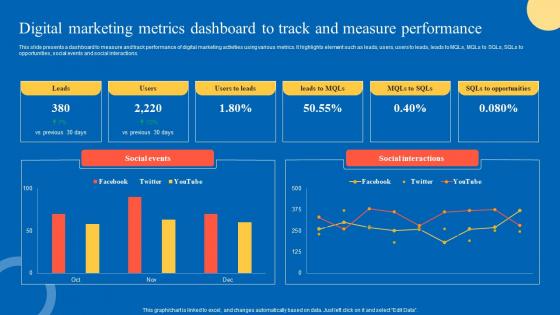
Digital Marketing Metrics Strategic Guide For Marketing Program Pictures Pdf
This slide presents a dashboard to measure and track performance of digital marketing activities using various metrics. It highlights element such as leads, users, users to leads, leads to MQLs, MQLs to SQLs, SQLs to opportunities, social events and social interactions. Whether you have daily or monthly meetings, a brilliant presentation is necessary. Digital Marketing Metrics Strategic Guide For Marketing Program Pictures Pdf can be your best option for delivering a presentation. Represent everything in detail using Digital Marketing Metrics Strategic Guide For Marketing Program Pictures Pdf and make yourself stand out in meetings. The template is versatile and follows a structure that will cater to your requirements. All the templates prepared by Slidegeeks are easy to download and edit. Our research experts have taken care of the corporate themes as well. So, give it a try and see the results. This slide presents a dashboard to measure and track performance of digital marketing activities using various metrics. It highlights element such as leads, users, users to leads, leads to MQLs, MQLs to SQLs, SQLs to opportunities, social events and social interactions.
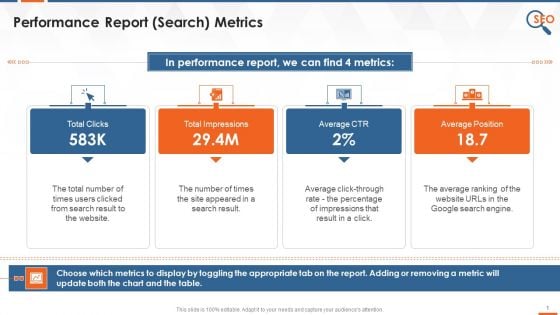
Google Search Console Performance Report Metrics Training Ppt
This slide Covers a description of webmaster performance report metrics. It depicts The total number of times users clicked on a website, the number of times the site appeared in the search result, the average click-through rate, and an average ranking of the website URLs in the Google search engine.
Change Requests Tracking Metrics For Company Microsoft PDF
This slide displays dashboard to monitor change requests count assigned and completed for the organization. It includes key components such as models, owners, over time progress, etc Showcasing this set of slides titled Change Requests Tracking Metrics For Company Microsoft PDF The topics addressed in these templates are Departments, Model Owners, Requests. All the content presented in this PPT design is completely editable. Download it and make adjustments in color, background, font etc. as per your unique business setting.
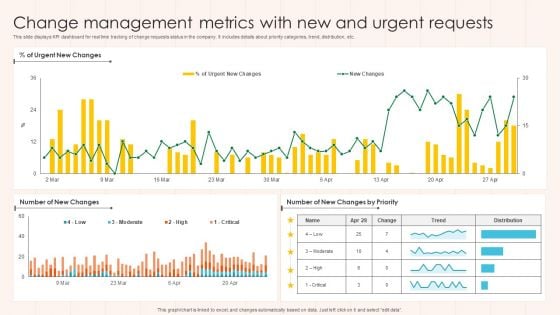
Change Management Metrics With New And Urgent Requests Summary PDF
This slide displays KPI dashboard for real time tracking of change requests status in the company. It includes details about priority categories, trend, distribution, etc. Showcasing this set of slides titled Change Management Metrics With New And Urgent Requests Summary PDF The topics addressed in these templates are Urgent Requests, Priority, Changes. All the content presented in this PPT design is completely editable. Download it and make adjustments in color, background, font etc. as per your unique business setting.
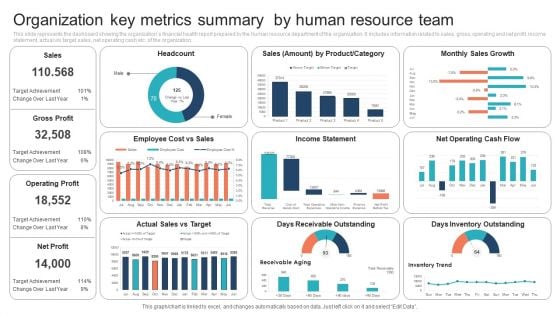
Organization Key Metrics Summary By Human Resource Team Information PDF
This slide represents the dashboard showing the organizations financial health report prepared by the human resource department of the organization. It includes information related to sales, gross, operating and net profit, income statement, actual vs target sales, net operating cash etc. of the organization.Showcasing this set of slides titled Organization Key Metrics Summary By Human Resource Team Information PDF. The topics addressed in these templates are Organization Key Metrics Summary, Human Resource Team. All the content presented in this PPT design is completely editable. Download it and make adjustments in color, background, font etc. as per your unique business setting.
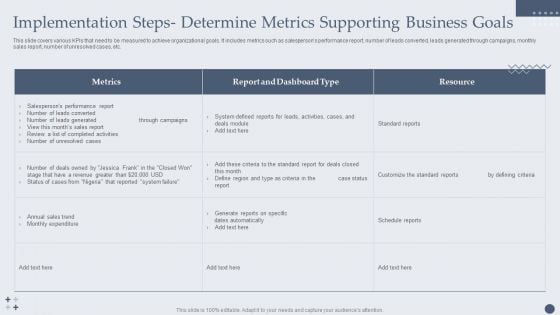
Implementation Steps Determine Metrics Supporting Business Goals Graphics PDF
This slide covers various KPIs that need to be measured to achieve organizational goals. It includes metrics such as salespersons performance report, number of leads converted, leads generated through campaigns, monthly sales report, number of unresolved cases, etc. Deliver an awe inspiring pitch with this creative Implementation Steps Determine Metrics Supporting Business Goals Graphics PDF bundle. Topics like Generate Reports, Salespersons Performance, Report Dashboard can be discussed with this completely editable template. It is available for immediate download depending on the needs and requirements of the user.
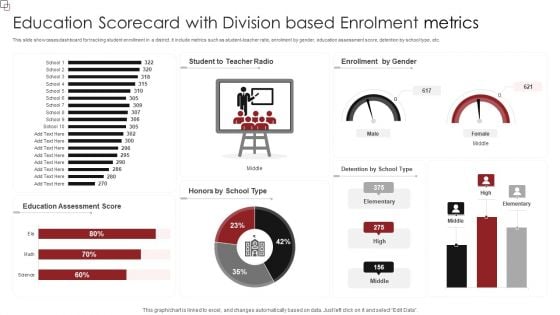
Education Scorecard With Division Based Enrolment Metrics Professional PDF
This slide showcases dashboard for tracking student enrollment in a district. It include metrics such as student-teacher ratio, enrolment by gender, education assessment score, detention by school type, etc. Pitch your topic with ease and precision using this Education Scorecard With Division Based Enrolment Metrics Professional PDF. This layout presents information on Education Assessment Score, Enrollment Gender. It is also available for immediate download and adjustment. So, changes can be made in the color, design, graphics or any other component to create a unique layout.
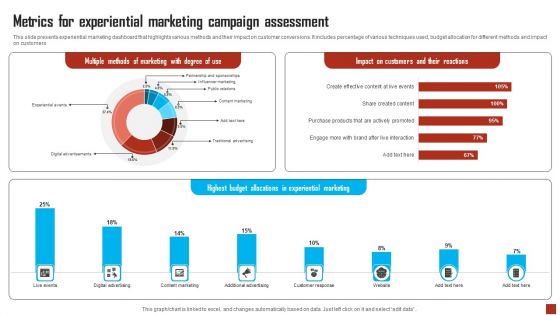
Metrics For Experiential Marketing Campaign Assessment Designs PDF
This slide presents experiential marketing dashboard that highlights various methods and their impact on customer conversions. It includes percentage of various techniques used, budget allocation for different methods and impact on customers. Showcasing this set of slides titled Metrics For Experiential Marketing Campaign Assessment Designs PDF. The topics addressed in these templates are Metrics, Experiential Marketing Campaign Assessment. All the content presented in this PPT design is completely editable. Download it and make adjustments in color, background, font etc. as per your unique business setting.
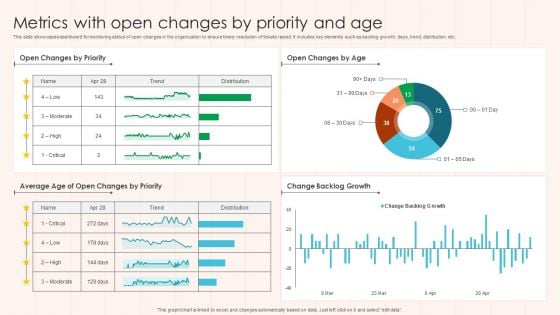
Metrics With Open Changes By Priority And Age Guidelines PDF
This slide showcases dashboard for monitoring status of open changes in the organization to ensure timely resolution of tickets raised. It includes key elements such as backlog growth, days, trend, distribution, etc. Pitch your topic with ease and precision using this Metrics With Open Changes By Priority And Age Guidelines PDF This layout presents information on Change Backlog Growth, Priority, Age. It is also available for immediate download and adjustment. So, changes can be made in the color, design, graphics or any other component to create a unique layout.
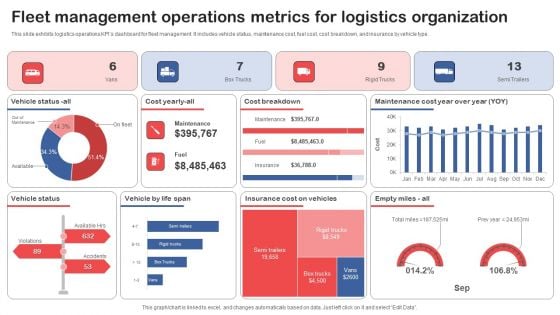
Fleet Management Operations Metrics For Logistics Organization Graphics PDF
This slide exhibits logistics operations KPIs dashboard for fleet management. It includes vehicle status, maintenance cost, fuel cost, cost breakdown, and insurance by vehicle type. Pitch your topic with ease and precision using this Fleet Management Operations Metrics For Logistics Organization Graphics PDF. This layout presents information on Cost Breakdown, Vehicle Status, Vehicle By Life Span. It is also available for immediate download and adjustment. So, changes can be made in the color, design, graphics or any other component to create a unique layout.
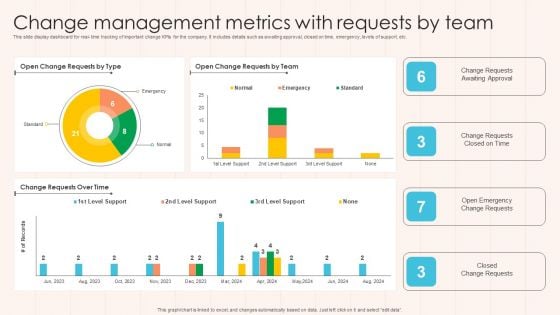
Change Management Metrics With Requests By Team Designs PDF
This slide display dashboard for real- time tracking of important change KPIs for the company. It includes details such as awaiting approval, closed on time, emergency, levels of support, etc. Pitch your topic with ease and precision using this Change Management Metrics With Requests By Team Designs PDF This layout presents information on Change Requests, Approval, Team. It is also available for immediate download and adjustment. So, changes can be made in the color, design, graphics or any other component to create a unique layout.
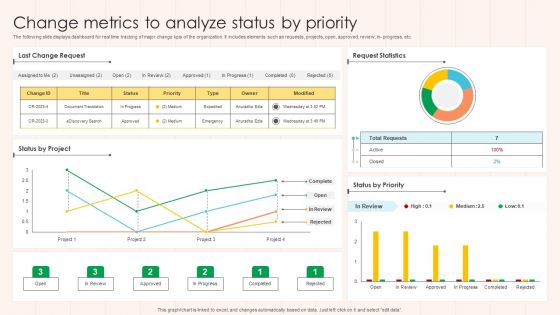
Change Metrics To Analyze Status By Priority Formats PDF
The following slide displays dashboard for real time tracking of major change kpis of the organization. It includes elements such as requests, projects, open, approved, review, in- progress, etc. Pitch your topic with ease and precision using this Change Metrics To Analyze Status By Priority Formats PDF This layout presents information on Project, Request Statistics, Priority. It is also available for immediate download and adjustment. So, changes can be made in the color, design, graphics or any other component to create a unique layout.
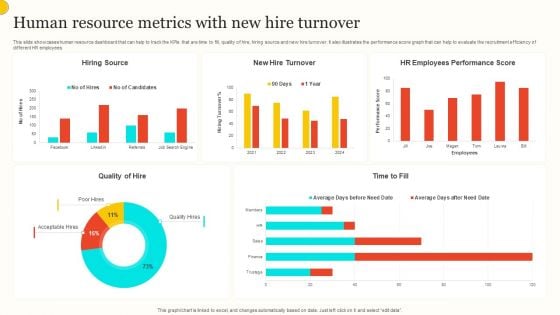
Human Resource Metrics With New Hire Turnover Professional PDF
This slide showcases human resource dashboard that can help to track the KPIs that are time to fill, quality of hire, hiring source and new hire turnover. It also illustrates the performance score graph that can help to evaluate the recruitment efficiency of different HR employees. Pitch your topic with ease and precision using this Human Resource Metrics With New Hire Turnover Professional PDF. This layout presents information on Hiring Source, New Hire Turnover, Hr Employees Performance Score. It is also available for immediate download and adjustment. So, changes can be made in the color, design, graphics or any other component to create a unique layout.
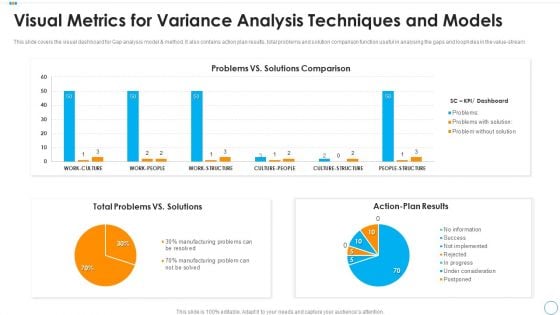
Visual Metrics For Variance Analysis Techniques And Models Mockup PDF
This slide covers the visual dashboard for Gap analysis model and method. It also contains action plan results, total problems and solution comparison function useful in analysing the gaps and loopholes in the value stream. Showcasing this set of slides titled visual metrics for variance analysis techniques and models mockup pdf. The topics addressed in these templates are total problems vs solutions, action plan results, problems vs solutions comparison. All the content presented in this PPT design is completely editable. Download it and make adjustments in color, background, font etc. as per your unique business setting.
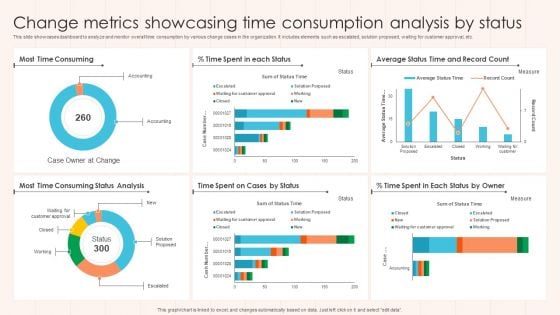
Change Metrics Showcasing Time Consumption Analysis By Status Clipart PDF
This slide showcases dashboard to analyze and monitor overall time consumption by various change cases in the organization. It includes elements such as escalated, solution proposed, waiting for customer approval, etc. Showcasing this set of slides titled Change Metrics Showcasing Time Consumption Analysis By Status Clipart PDF The topics addressed in these templates are Consuming, Status Analysis, Record Count. All the content presented in this PPT design is completely editable. Download it and make adjustments in color, background, font etc. as per your unique business setting.

Metrics For Project Success Evaluation Ppt PowerPoint Presentation Model Example File
This is a metrics for project success evaluation ppt powerpoint presentation model example file. This is a two stage process. The stages in this process are project dashboard, project kpis, project metrics.
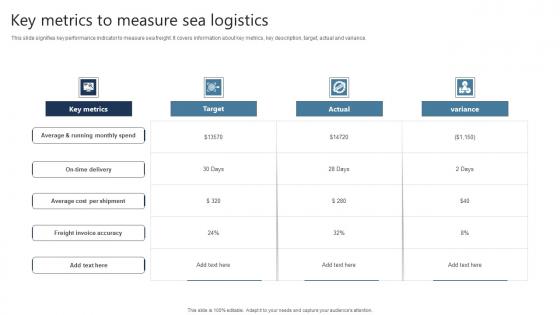
Key Metrics To Measure Sea Logistics Graphics Pdf
This slide signifies key performance indicator to measure sea freight. It covers information about key metrics, key description, target, actual and variance. Pitch your topic with ease and precision using this Key Metrics To Measure Sea Logistics Graphics Pdf This layout presents information on Freight Invoice Accuracy, Key Metrics, Target It is also available for immediate download and adjustment. So, changes can be made in the color, design, graphics or any other component to create a unique layout. This slide signifies key performance indicator to measure sea freight. It covers information about key metrics, key description, target, actual and variance.
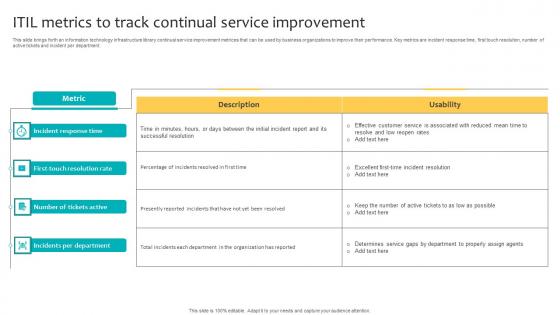
ITIL Metrics To Track Continual Service Improvement Infographics Pdf
This slide brings forth an information technology infrastructure library continual service improvement metrices that can be used by business organizations to improve their performance. Key metrics are incident response time, first touch resolution, number of active tickets and incident per department. Pitch your topic with ease and precision using this ITIL Metrics To Track Continual Service Improvement Infographics Pdf. This layout presents information on Incident Response Time, Number Of Tickets Active, Incidents Per Department. It is also available for immediate download and adjustment. So, changes can be made in the color, design, graphics or any other component to create a unique layout. This slide brings forth an information technology infrastructure library continual service improvement metrices that can be used by business organizations to improve their performance. Key metrics are incident response time, first touch resolution, number of active tickets and incident per department.

Analytics Based Metrics For Measurable Marketing Guidelines Pdf
This slide shows data driven metrics that can be used to measure productivity and results of implemented marketing strategy. It include metrics such as website traffic, return on investment and customer churn rate etc.Pitch your topic with ease and precision using this Analytics Based Metrics For Measurable Marketing Guidelines Pdf This layout presents information on Website Traffic, Return Investment, Customer Churn Rate It is also available for immediate download and adjustment. So, changes can be made in the color, design, graphics or any other component to create a unique layout. This slide shows data driven metrics that can be used to measure productivity and results of implemented marketing strategy. It include metrics such as website traffic, return on investment and customer churn rate etc.
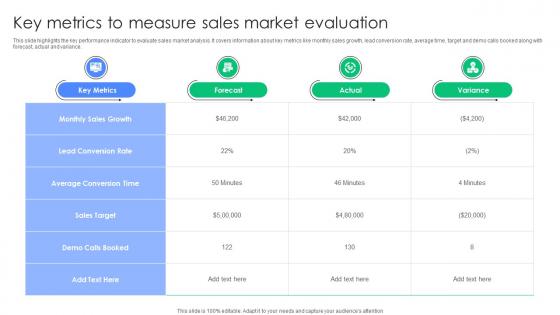
Key Metrics To Measure Sales Market Evaluation Portrait Pdf
This slide highlights the key performance indicator to evaluate sales market analysis. It covers information about key metrics like monthly sales growth, lead conversion rate, average time, target and demo calls booked along with forecast, actual and variance. Showcasing this set of slides titled Key Metrics To Measure Sales Market Evaluation Portrait Pdf. The topics addressed in these templates are Monthly Sales Growth, Lead Conversion Rate, Sales Target. All the content presented in this PPT design is completely editable. Download it and make adjustments in color, background, font etc. as per your unique business setting. This slide highlights the key performance indicator to evaluate sales market analysis. It covers information about key metrics like monthly sales growth, lead conversion rate, average time, target and demo calls booked along with forecast, actual and variance.
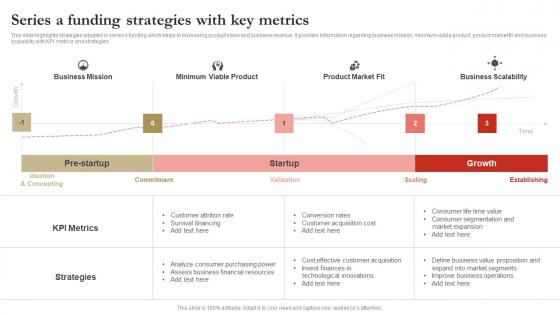
Series A Funding Strategies With Key Metrics Graphics Pdf
This slide highlights strategies adopted in series A funding which helps in increasing product sales and business revenue. It provides information regarding business mission, minimum viable product, product market fit and business scalability with KPI metrics and strategies. Pitch your topic with ease and precision using this Series A Funding Strategies With Key Metrics Graphics Pdf. This layout presents information on Kpi Metrics, Strategies, Financial Resources. It is also available for immediate download and adjustment. So, changes can be made in the color, design, graphics or any other component to create a unique layout. This slide highlights strategies adopted in series A funding which helps in increasing product sales and business revenue. It provides information regarding business mission, minimum viable product, product market fit and business scalability with KPI metrics and strategies.
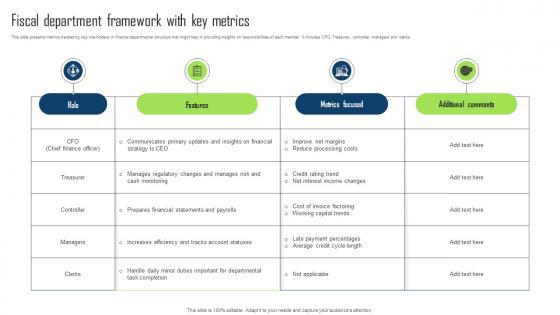
Fiscal Department Framework With Key Metrics Rules Pdf
This slide presents metrics tracked by key role holders in finance departmental structure that might help in providing insights on responsibilities of each member. It includes CFO, Treasurer, controller, managers and clerks. Showcasing this set of slides titled Fiscal Department Framework With Key Metrics Rules Pdf. The topics addressed in these templates are Fiscal Department, Framework With Key Metrics, Insights On Responsibilities. All the content presented in this PPT design is completely editable. Download it and make adjustments in color, background, font etc. as per your unique business setting. This slide presents metrics tracked by key role holders in finance departmental structure that might help in providing insights on responsibilities of each member. It includes CFO, Treasurer, controller, managers and clerks.
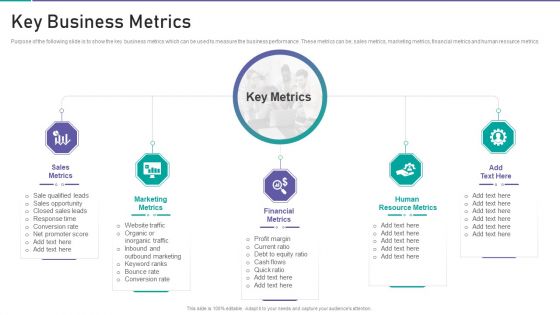
Corporate Organization Playbook Key Business Metrics Ppt Inspiration Elements PDF
Purpose of the following slide is to show the key business metrics which can be used to measure the business performance. These metrics can be sales metrics, marketing metrics, financial metrics and human resource metrics. Presenting corporate organization playbook key business metrics ppt inspiration elements pdf to provide visual cues and insights. Share and navigate important information on five stages that need your due attention. This template can be used to pitch topics like sales metrics, marketing metrics, financial metrics, human resource metrics. In addtion, this PPT design contains high resolution images, graphics, etc, that are easily editable and available for immediate download.
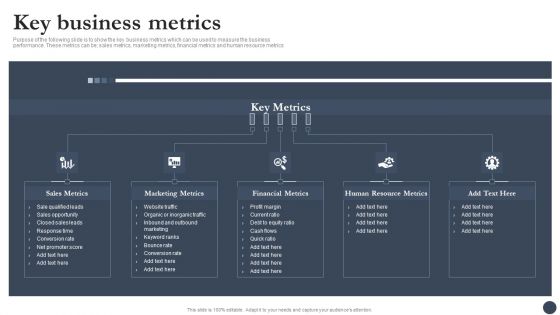
Strategic Playbook For Enterprise Administration Key Business Metrics Diagrams PDF
Purpose of the following slide is to show the key business metrics which can be used to measure the business performance. These metrics can be sales metrics, marketing metrics, financial metrics and human resource metrics. This is a Strategic Playbook For Enterprise Administration Key Business Metrics Diagrams PDF template with various stages. Focus and dispense information on five stages using this creative set, that comes with editable features. It contains large content boxes to add your information on topics like Marketing Metrics, Financial Metrics, Human Resource Metrics. You can also showcase facts, figures, and other relevant content using this PPT layout. Grab it now.
EV Performance Metrics Icon In Automotive Industry Infographics Pdf

Performance Metrics E Scooter Business Market Entry Strategy
The following slide outlines various KPIs to track and measure cleantech startups operational performance. The metrics are scooter utilization rate, rider satisfaction score, revenue per scooter, etc.Crafting an eye-catching presentation has never been more straightforward. Let your presentation shine with this tasteful yet straightforward Performance Metrics E Scooter Business Market Entry Strategy template. It offers a minimalistic and classy look that is great for making a statement. The colors have been employed intelligently to add a bit of playfulness while still remaining professional. Construct the ideal Performance Metrics E Scooter Business Market Entry Strategy that effortlessly grabs the attention of your audience Begin now and be certain to wow your customers The following slide outlines various KPIs to track and measure cleantech startups operational performance. The metrics are scooter utilization rate, rider satisfaction score, revenue per scooter, etc.
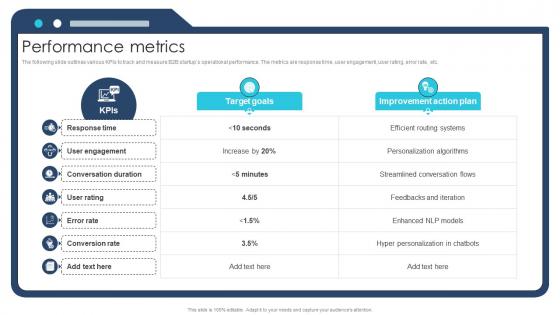
Performance Metrics Ai Chatbot Service Market Entry Strategy
The following slide outlines various KPIs to track and measure B2B startups operational performance. The metrics are response time, user engagement, user rating, error rate, etc.Crafting an eye-catching presentation has never been more straightforward. Let your presentation shine with this tasteful yet straightforward Performance Metrics Ai Chatbot Service Market Entry Strategy template. It offers a minimalistic and classy look that is great for making a statement. The colors have been employed intelligently to add a bit of playfulness while still remaining professional. Construct the ideal Performance Metrics Ai Chatbot Service Market Entry Strategy that effortlessly grabs the attention of your audience Begin now and be certain to wow your customers The following slide outlines various KPIs to track and measure B2B startups operational performance. The metrics are response time, user engagement, user rating, error rate, etc.

Performance Metrics Blind Shipping GTM Strategy GTM SS V
The following slide outlines various KPIs to track and measure drop shipping startups operational performance. The metrics are conversion rate, subscriptions, CAC, CLV, etc.Crafting an eye-catching presentation has never been more straightforward. Let your presentation shine with this tasteful yet straightforward Performance Metrics Blind Shipping GTM Strategy GTM SS V template. It offers a minimalistic and classy look that is great for making a statement. The colors have been employed intelligently to add a bit of playfulness while still remaining professional. Construct the ideal Performance Metrics Blind Shipping GTM Strategy GTM SS V that effortlessly grabs the attention of your audience Begin now and be certain to wow your customers The following slide outlines various KPIs to track and measure drop shipping startups operational performance. The metrics are conversion rate, subscriptions, CAC, CLV, etc.

Performance Metrics Pastry Shop Market Entry Plan GTM SS V
The following slide outlines various KPIs to track and measure business operational performance The metrics are revenue, sales growth, retention rate, gross profit, inventory turnover, customer feedback, operation efficiency metrics and ROI. Crafting an eye-catching presentation has never been more straightforward. Let your presentation shine with this tasteful yet straightforward Performance Metrics Pastry Shop Market Entry Plan GTM SS V template. It offers a minimalistic and classy look that is great for making a statement. The colors have been employed intelligently to add a bit of playfulness while still remaining professional. Construct the ideal Performance Metrics Pastry Shop Market Entry Plan GTM SS V that effortlessly grabs the attention of your audience Begin now and be certain to wow your customers The following slide outlines various KPIs to track and measure business operational performance The metrics are revenue, sales growth, retention rate, gross profit, inventory turnover, customer feedback, operation efficiency metrics and ROI.
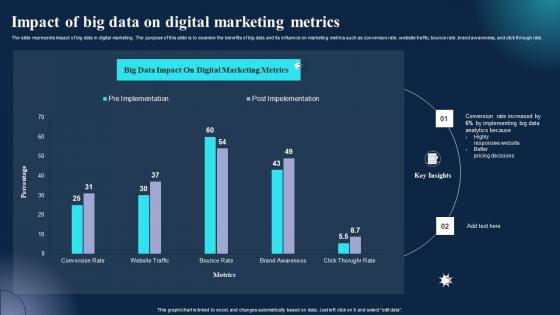
Impact Of Big Data On Digital Marketing Metrics Information Pdf
The slide represents impact of big data in digital marketing. The purpose of this slide is to examine the benefits of big data and its influence on marketing metrics such as conversion rate, website traffic, bounce rate, brand awareness, and click through rate. Pitch your topic with ease and precision using this Impact Of Big Data On Digital Marketing Metrics Information Pdf. This layout presents information on Marketing Metrics, Pricing Decisions, Impact. It is also available for immediate download and adjustment. So, changes can be made in the color, design, graphics or any other component to create a unique layout. The slide represents impact of big data in digital marketing. The purpose of this slide is to examine the benefits of big data and its influence on marketing metrics such as conversion rate, website traffic, bounce rate, brand awareness, and click through rate.
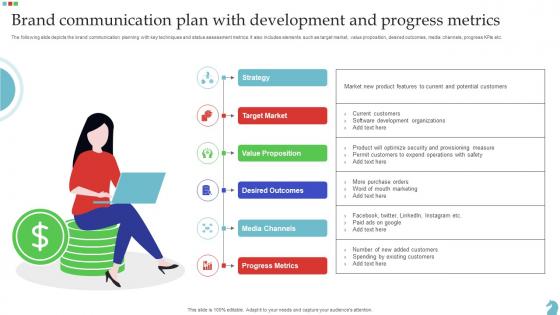
Brand Communication Plan With Development And Progress Metrics Template Pdf
The following slide depicts the brand communication planning with key techniques and status assessment metrics. It also includes elements such as target market, value proposition, desired outcomes, media channels, progress KPIs etc. Showcasing this set of slides titled Brand Communication Plan With Development And Progress Metrics Template Pdf. The topics addressed in these templates are Value Proposition, Desired Outcomes, Media Channels, Target Market. All the content presented in this PPT design is completely editable. Download it and make adjustments in color, background, font etc. as per your unique business setting. The following slide depicts the brand communication planning with key techniques and status assessment metrics. It also includes elements such as target market, value proposition, desired outcomes, media channels, progress KPIs etc.
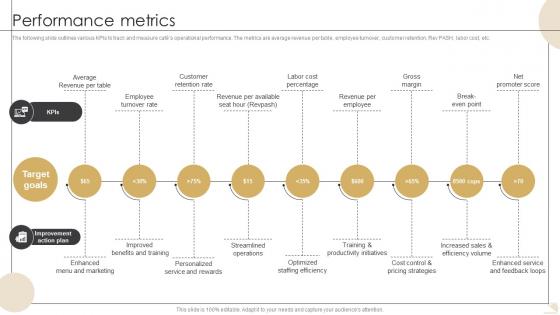
Performance Metrics Bistro Startup GTM Strategy GTM SS V
The following slide outlines various KPIs to track and measure cafes operational performance. The metrics are average revenue per table, employee turnover, customer retention, RevPASH, labor cost, etc.Formulating a presentation can take up a lot of effort and time, so the content and message should always be the primary focus. The visuals of the PowerPoint can enhance the presenters message, so our Performance Metrics Bistro Startup GTM Strategy GTM SS V was created to help save time. Instead of worrying about the design, the presenter can concentrate on the message while our designers work on creating the ideal templates for whatever situation is needed. Slidegeeks has experts for everything from amazing designs to valuable content, we have put everything into Performance Metrics Bistro Startup GTM Strategy GTM SS V. The following slide outlines various KPIs to track and measure cafes operational performance. The metrics are average revenue per table, employee turnover, customer retention, RevPASH, labor cost, etc.

Performance Metrics Domotics Go To Market Strategy GTM SS V
The following slide outlines various KPIs to track and measure smart home automation startup operational performance. The metrics are CAC, CLTV, churn rate MRR, ARPU, etc.This modern and well-arranged Performance Metrics Domotics Go To Market Strategy GTM SS V provides lots of creative possibilities. It is very simple to customize and edit with the Powerpoint Software. Just drag and drop your pictures into the shapes. All facets of this template can be edited with Powerpoint, no extra software is necessary. Add your own material, put your images in the places assigned for them, adjust the colors, and then you can show your slides to the world, with an animated slide included. The following slide outlines various KPIs to track and measure smart home automation startup operational performance. The metrics are CAC, CLTV, churn rate MRR, ARPU, etc.

Performance Metrics Smart Home Startup GTM Strategy GTM SS V
The following slide outlines various KPIs to track and measure smart home automation startup operational performance. The metrics are CAC, CLTV, churn rate MRR, ARPU, etc.Welcome to our selection of the Performance Metrics Smart Home Startup GTM Strategy GTM SS V. These are designed to help you showcase your creativity and bring your sphere to life. Planning and Innovation are essential for any business that is just starting out. This collection contains the designs that you need for your everyday presentations. All of our PowerPoints are 100 percent editable, so you can customize them to suit your needs. This multi-purpose template can be used in various situations. Grab these presentation templates today. The following slide outlines various KPIs to track and measure smart home automation startup operational performance. The metrics are CAC, CLTV, churn rate MRR, ARPU, etc.
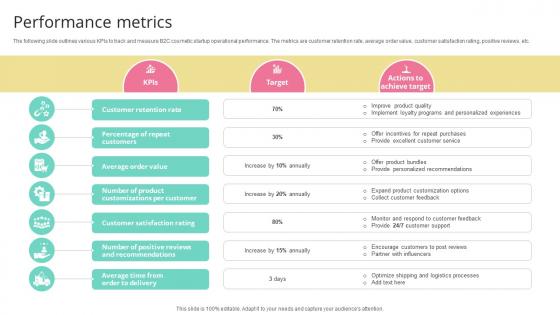
Performance Metrics Skincare Startup GTM Strategy GTM SS V
The following slide outlines various KPIs to track and measure B2C cosmetic startup operational performance. The metrics are customer retention rate, average order value, customer satisfaction rating, positive reviews, etc.Make sure to capture your audiences attention in your business displays with our gratis customizable Performance Metrics Skincare Startup GTM Strategy GTM SS V. These are great for business strategies, office conferences, capital raising or task suggestions. If you desire to acquire more customers for your tech business and ensure they stay satisfied, create your own sales presentation with these plain slides. The following slide outlines various KPIs to track and measure B2C cosmetic startup operational performance. The metrics are customer retention rate, average order value, customer satisfaction rating, positive reviews, etc.
Key Performance Metrics Examples Ppt Powerpoint Presentation Slide Cpb
This is a key performance metrics examples ppt powerpoint presentation slide cpb. This is a six stage process. The stages in this process are key performance metrics examples.
Automotive Industry Metrics Icon For Production Evaluation Microsoft Pdf
This slide includes the KPIs for operation executives in automotive industry for performance evaluation. This includes various KPIs such as average downtime, utilization rate, inventory turns, etc. Showcasing this set of slides titled Automotive Industry Metrics Icon For Production Evaluation Microsoft Pdf. The topics addressed in these templates are Automotive Industry Metrics Icon, Production Evaluation. All the content presented in this PPT design is completely editable. Download it and make adjustments in color, background, font etc. as per your unique business setting. Our Automotive Industry Metrics Icon For Production Evaluation Microsoft Pdf are topically designed to provide an attractive backdrop to any subject. Use them to look like a presentation pro.

Financial Performance Metrics Ppt PowerPoint Presentation Infographic Template Influencers Cpb
This is a financial performance metrics ppt powerpoint presentation infographic template influencers cpb. This is a three stage process. The stages in this process are financial performance metrics.
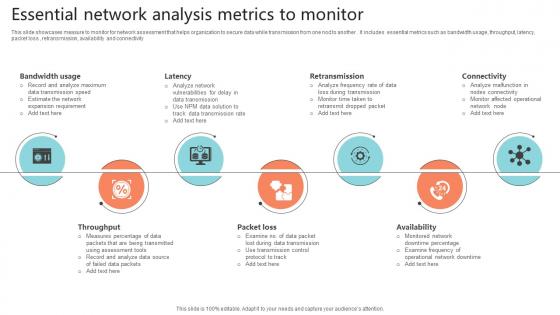
Essential Network Analysis Metrics To Monitor Portrait Pdf
This slide showcases measure to monitor for network assessment that helps organization to secure data while transmission from one nod to another . It includes essential metrics such as bandwidth usage, throughput, latency, packet loss , retransmission, availability and connectivity.Pitch your topic with ease and precision using this Essential Network Analysis Metrics To Monitor Portrait Pdf This layout presents information on Bandwidth Usage, Retransmission, Throughput It is also available for immediate download and adjustment. So, changes can be made in the color, design, graphics or any other component to create a unique layout. This slide showcases measure to monitor for network assessment that helps organization to secure data while transmission from one nod to another . It includes essential metrics such as bandwidth usage, throughput, latency, packet loss , retransmission, availability and connectivity
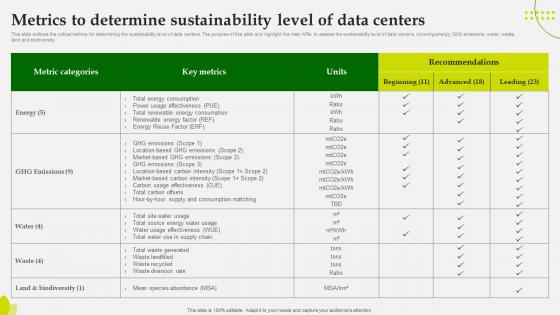
Green Computing Metrics To Determine Sustainability Level Of Data Centers
This slide outlines the critical metrics for determining the sustainability level of data centers. The purpose of this slide is to highlight the main KPIs to assess the sustainability level of datacenters, covering energy, GHS emissions, water, waste, land and biodiversity.Here you can discover an assortment of the finest PowerPoint and Google Slides templates. With these templates, you can create presentations for a variety of purposes while simultaneously providing your audience with an eye-catching visual experience. Download Green Computing Metrics To Determine Sustainability Level Of Data Centers to deliver an impeccable presentation. These templates will make your job of preparing presentations much quicker, yet still, maintain a high level of quality. Slidegeeks has experienced researchers who prepare these templates and write high-quality content for you. Later on, you can personalize the content by editing the Green Computing Metrics To Determine Sustainability Level Of Data Centers This slide outlines the critical metrics for determining the sustainability level of data centers. The purpose of this slide is to highlight the main KPIs to assess the sustainability level of datacenters, covering energy, GHS emissions, water, waste, land and biodiversity.
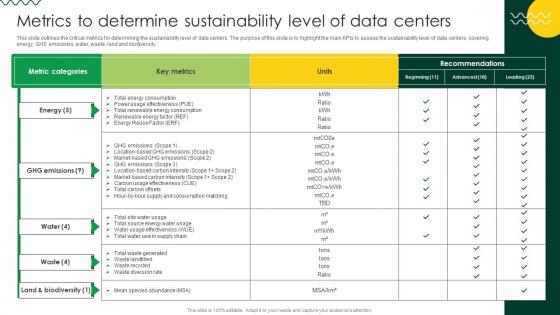
Sustainable Metrics To Determine Sustainability Level Of Data Centers
This slide outlines the critical metrics for determining the sustainability level of data centers. The purpose of this slide is to highlight the main KPIs to assess the sustainability level of data centers, covering energy, GHS emissions, water, waste, land and biodiversity. Get a simple yet stunning designed Sustainable Metrics To Determine Sustainability Level Of Data Centers. It is the best one to establish the tone in your meetings. It is an excellent way to make your presentations highly effective. So, download this PPT today from Slidegeeks and see the positive impacts. Our easy-to-edit Sustainable Metrics To Determine Sustainability Level Of Data Centers can be your go-to option for all upcoming conferences and meetings. So, what are you waiting for Grab this template today. This slide outlines the critical metrics for determining the sustainability level of data centers. The purpose of this slide is to highlight the main KPIs to assess the sustainability level of data centers, covering energy, GHS emissions, water, waste, land and biodiversity.

HR Analytics Metrics For Data Driven Decision Summary Pdf
This slide illustrates human resource key performance indicators that help organization to analyze actionable insights for taking effective and date driven decision. It includes KPIs such as recruitment, employee engagement, retention and diversity and inclusion.Pitch your topic with ease and precision using this HR Analytics Metrics For Data Driven Decision Summary Pdf This layout presents information on Estimate Accumulated, Involved Recruitment, Provide Actionable Insight It is also available for immediate download and adjustment. So, changes can be made in the color, design, graphics or any other component to create a unique layout. This slide illustrates human resource key performance indicators that help organization to analyze actionable insights for taking effective and date driven decision. It includes KPIs such as recruitment, employee engagement, retention and diversity and inclusion.

Blueprint To Enhance Organizational Operations Key Business Metrics Ideas PDF
Purpose of the following slide is to show the key business metrics which can be used to measure the business performance. These metrics can be sales metrics, marketing metrics, financial metrics and human resource metrics. Want to ace your presentation in front of a live audience Our Blueprint To Enhance Organizational Operations Key Business Metrics Ideas PDF can help you do that by engaging all the users towards you. Slidegeeks experts have put their efforts and expertise into creating these impeccable powerpoint presentations so that you can communicate your ideas clearly. Moreover, all the templates are customizable, and easy to edit and downloadable. Use these for both personal and commercial use.
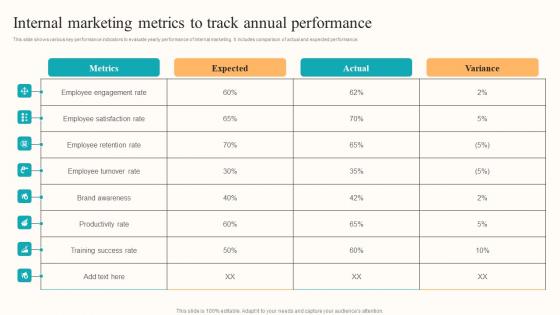
Internal Marketing Metrics Developing Employee Centric Marketing Program Introduction Pdf
This slide shows various key performance indicators to evaluate yearly performance of internal marketing. It includes comparison of actual and expected performance. If you are looking for a format to display your unique thoughts, then the professionally designed Internal Marketing Metrics Developing Employee Centric Marketing Program Introduction Pdf is the one for you. You can use it as a Google Slides template or a PowerPoint template. Incorporate impressive visuals, symbols, images, and other charts. Modify or reorganize the text boxes as you desire. Experiment with shade schemes and font pairings. Alter, share or cooperate with other people on your work. Download Internal Marketing Metrics Developing Employee Centric Marketing Program Introduction Pdf and find out how to give a successful presentation. Present a perfect display to your team and make your presentation unforgettable. This slide shows various key performance indicators to evaluate yearly performance of internal marketing. It includes comparison of actual and expected performance.
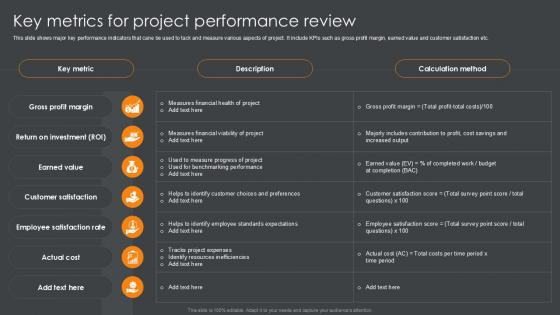
Key Metrics For Project Performance Review PPT Template SS
This slide shows major key performance indicators that cane be used to tack and measure various aspects of project. It include KPIs such as gross profit margin, earned value and customer satisfaction etc. There are so many reasons you need a Key Metrics For Project Performance Review PPT Template SS. The first reason is you can not spend time making everything from scratch, Thus, Slidegeeks has made presentation templates for you too. You can easily download these templates from our website easily. This slide shows major key performance indicators that cane be used to tack and measure various aspects of project. It include KPIs such as gross profit margin, earned value and customer satisfaction etc.
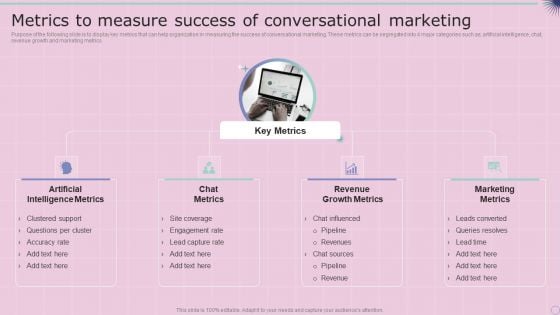
Metrics To Measure Success Of Conversational Marketing Elements PDF
Purpose of the following slide is to display key metrics that can help organization in measuring the success of conversational marketing. These metrics can be segregated into 4 major categories such as artificial intelligence, chat, revenue growth and marketing metrics. Presenting Metrics To Measure Success Of Conversational Marketing Elements PDF to provide visual cues and insights. Share and navigate important information on four stages that need your due attention. This template can be used to pitch topics like Artificial Intelligence Metrics, Chat Metrics, Revenue Growth Metrics. In addtion, this PPT design contains high resolution images, graphics, etc, that are easily editable and available for immediate download.


 Continue with Email

 Home
Home


