Process Icon
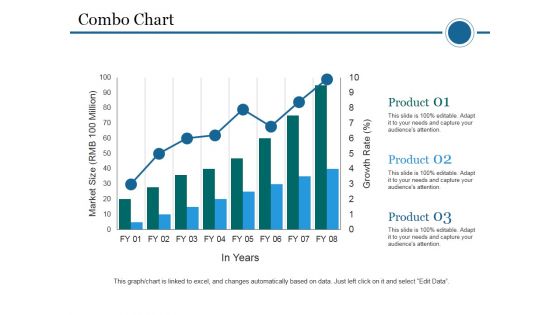
Combo Chart Ppt PowerPoint Presentation Infographics Summary
This is a combo chart ppt powerpoint presentation infographics summary. This is a three stage process. The stages in this process are market size, product, combo chart, years, business.
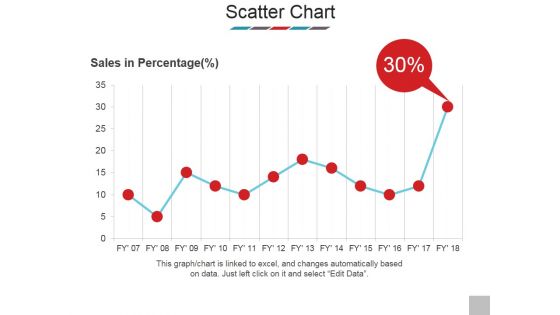
Scatter Chart Ppt PowerPoint Presentation Model Show
This is a scatter chart ppt powerpoint presentation model show. This is a one stage process. The stages in this process are sales in percentage, scatter chart, business, bar graph, marketing.
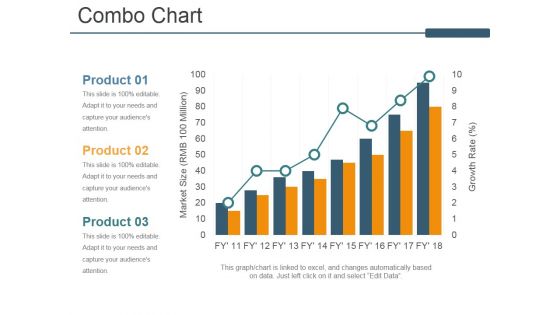
Combo Chart Ppt PowerPoint Presentation Layouts Portfolio
This is a combo chart ppt powerpoint presentation layouts portfolio. This is a three stage process. The stages in this process are combo chart, product, market size, growth rate.
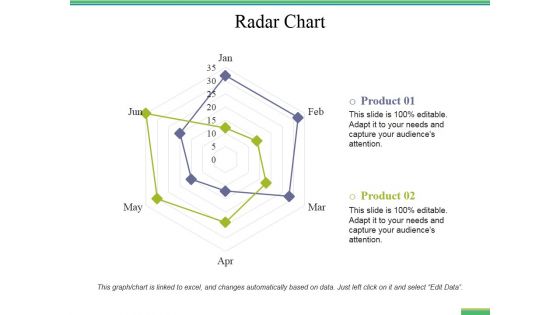
Radar Chart Ppt PowerPoint Presentation Ideas Slides
This is a radar chart ppt powerpoint presentation ideas slides. This is a two stage process. The stages in this process are radar chart, management, finance, marketing, strategy, business.
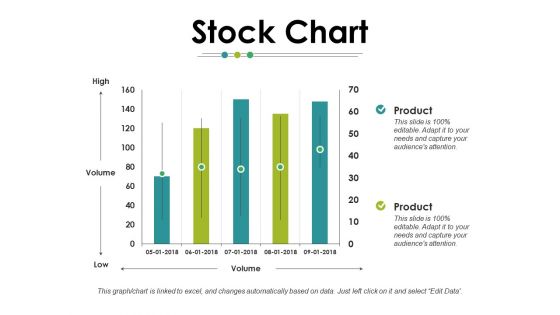
Stock Chart Ppt PowerPoint Presentation Infographics Smartart
This is a stock chart ppt powerpoint presentation infographics smartart. This is a two stages process. The stages in this process are stock chart, finance, business, planning, marketing, management.
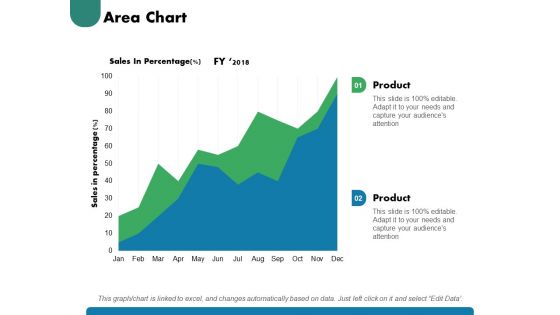
Area Chart Ppt PowerPoint Presentation Pictures Show
This is a area chart ppt powerpoint presentation pictures show. This is a two stage process. The stages in this process are area chart, finance, marketing, management, investment, analysis.
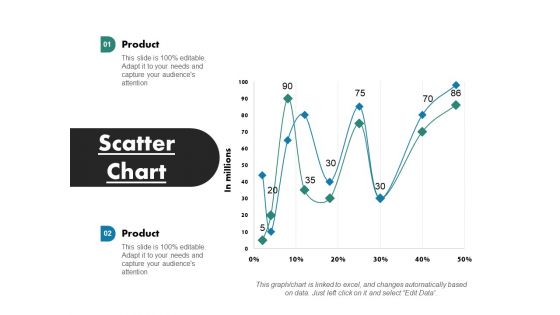
Scatter Chart Ppt PowerPoint Presentation Infographics Designs
This is a scatter chart ppt powerpoint presentation infographics designs. This is a two stage process. The stages in this process are scatter chart, finance, marketing, management, investment, analysis.
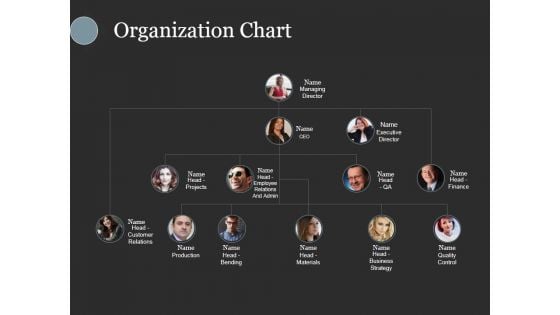
Organization Chart Ppt PowerPoint Presentation Styles Inspiration
This is a organization chart ppt powerpoint presentation styles inspiration. This is a four stage process. The stages in this process are managing director, executive director, head projects, production, head materials.
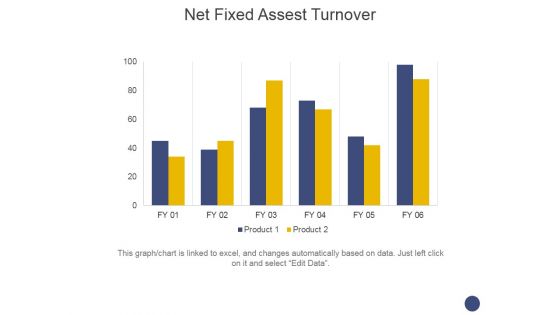
Net Fixed Assest Turnover Ppt PowerPoint Presentation Infographics Themes
This is a net fixed assest turnover ppt powerpoint presentation infographics themes. This is a two stage process. The stages in this process are turnover, business, marketing, management, finance.
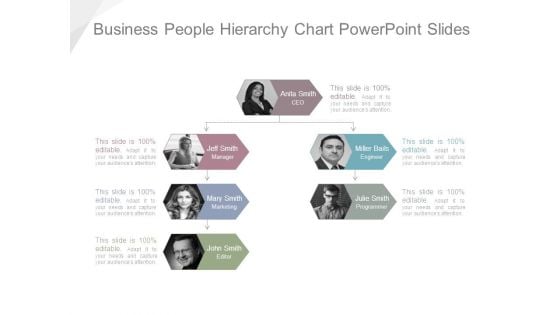
Business People Hierarchy Chart Powerpoint Slides
This is a business people hierarchy chart powerpoint slides. This is a four stage process. The stages in this process are anita smith ceo, jeff smith manager, miller bails engineer, mary smith marketing, julie smith programmer, john smith editor.
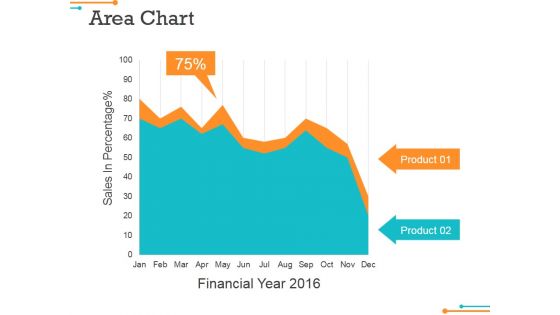
Area Chart Ppt Powerpoint Presentation File Show
This is a area chart ppt powerpoint presentation file show. This is a two stage process. The stages in this process are sales in percentage, financial year, product, financial, business.
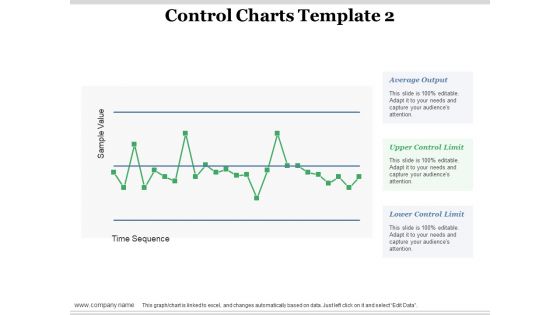
Control Charts Time Sequence Ppt PowerPoint Presentation Layouts Microsoft
This is a control charts time sequence ppt powerpoint presentation layouts microsoft. This is a one stage process. The stages in this process are average output, upper control limit, lower control limit, finance, business.
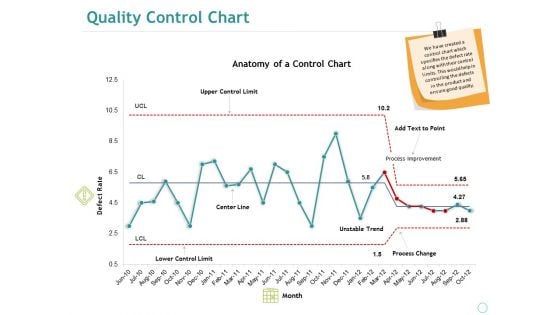
Quality Control Chart Ppt PowerPoint Presentation Summary Sample
This is a quality control chart ppt powerpoint presentation summary sample. This is a one stage process. The stages in this process are anatomy of a control chart, defect rate, upper control limit, center line, lower control limit.
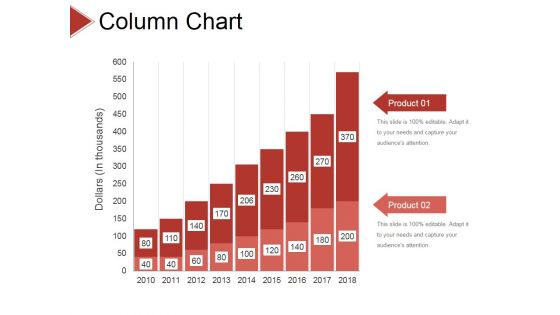
Column Chart Ppt PowerPoint Presentation Gallery Layouts
This is a column chart ppt powerpoint presentation gallery layouts. This is a two stage process. The stages in this process are business, strategy, analysis, pretention, chart and graph, growth.
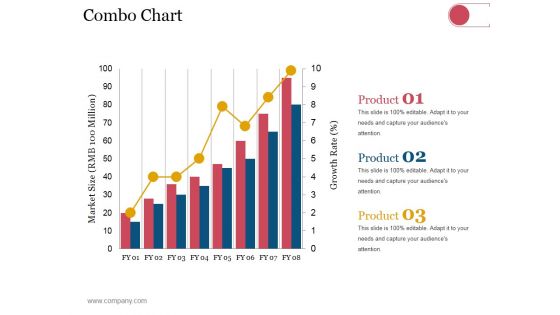
Combo Chart Ppt PowerPoint Presentation Inspiration Information
This is a combo chart ppt powerpoint presentation inspiration information. This is a eight stage process. The stages in this process are business, strategy, analysis, planning, combo chart, market size, growth rate.
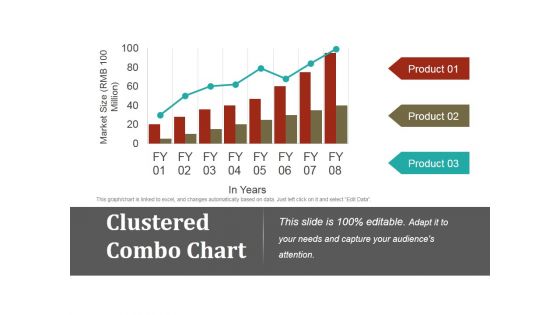
Clustered Combo Chart Ppt PowerPoint Presentation Show
This is a clustered combo chart ppt powerpoint presentation show. This is a eigth stage process. The stages in this process are clustered combo chart, finance, marketing, strategy, investment, business.
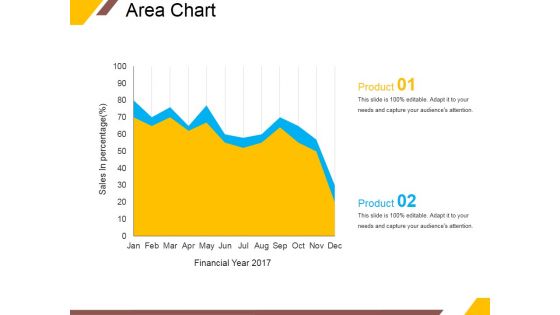
Area Chart Ppt PowerPoint Presentation Layouts Vector
This is a area chart ppt powerpoint presentation layouts vector. This is a two stage process. The stages in this process are area chart, product, sales in percentage, financial year.
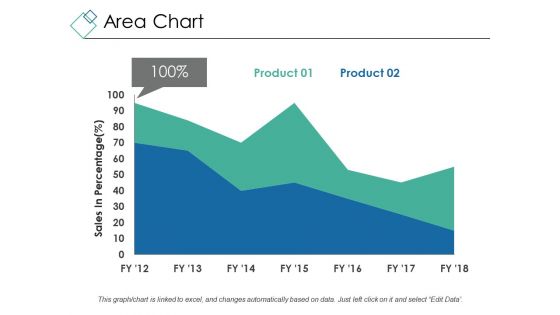
Area Chart Ppt PowerPoint Presentation Inspiration Demonstration
This is a area chart ppt powerpoint presentation inspiration demonstration. This is a two stage process. The stages in this process are sales in percentage, chart, percentage, business, marketing.
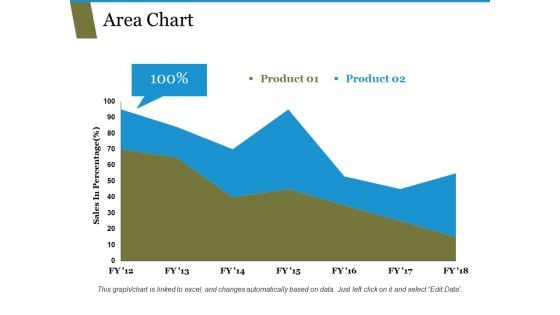
Area Chart Ppt PowerPoint Presentation Portfolio Templates
This is a area chart ppt powerpoint presentation portfolio templates. This is a two stage process. The stages in this process are sales in percentage, chart, business, marketing, finance.
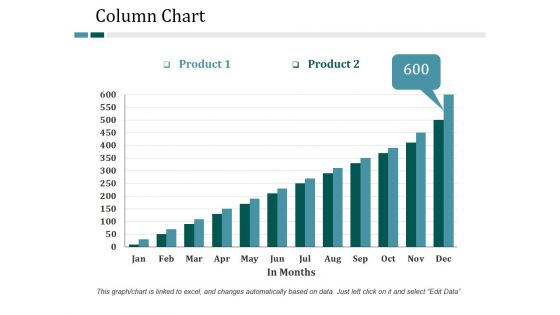
Column Chart Ppt PowerPoint Presentation File Show
This is a column chart ppt powerpoint presentation file show. This is a two stage process. The stages in this process are column chart, finance, marketing, growth, strategy, business.
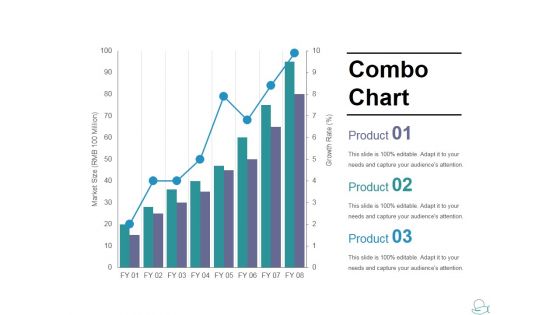
Combo Chart Ppt PowerPoint Presentation Slides Show
This is a combo chart ppt powerpoint presentation slides show. This is a three stage process. The stages in this process are combo chart, market size, product, bar graph, growth.
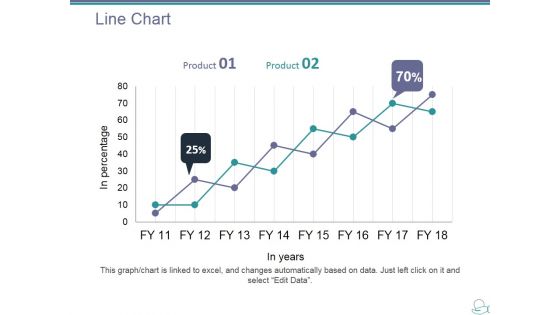
Line Chart Ppt PowerPoint Presentation Layouts Show
This is a line chart ppt powerpoint presentation layouts show. This is a two stage process. The stages in this process are product, in years, in percentage, line chart, growth.
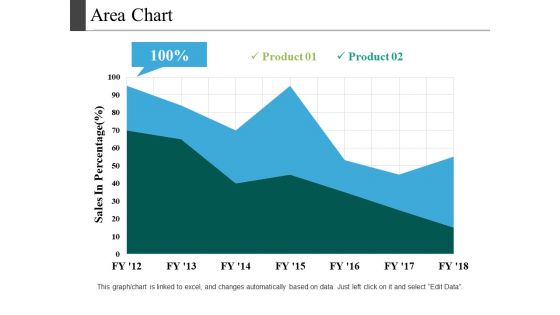
Area Chart Ppt PowerPoint Presentation Pictures Template
This is a area chart ppt powerpoint presentation pictures template. This is a two stage process. The stages in this process are sales in percentage, chart, business, marketing, strategy.
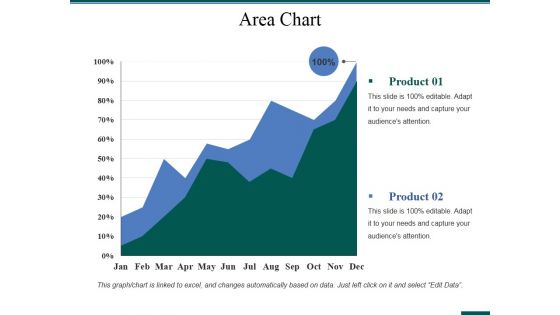
Area Chart Ppt PowerPoint Presentation Pictures Slideshow
This is a area chart ppt powerpoint presentation pictures slideshow. This is a two stage process. The stages in this process are area chart, finance, analysis, marketing, strategy, business.
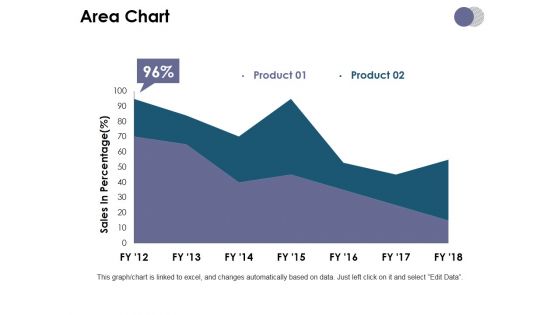
Area Chart Ppt PowerPoint Presentation Summary Format
This is a area chart ppt powerpoint presentation summary format. This is a two stage process. The stages in this process are area chart, planning, marketing, strategy, finance, business.
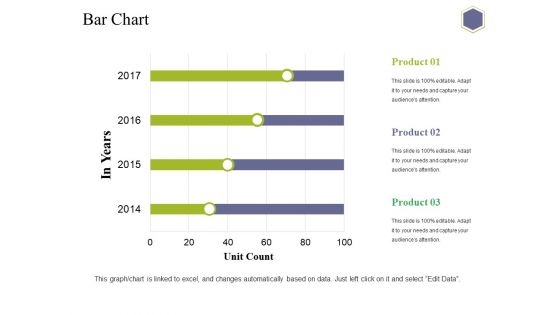
Bar Chart Ppt PowerPoint Presentation Slide Download
This is a bar chart ppt powerpoint presentation slide download. This is a three stage process. The stages in this process are chart, in years, unit count, business, marketing.
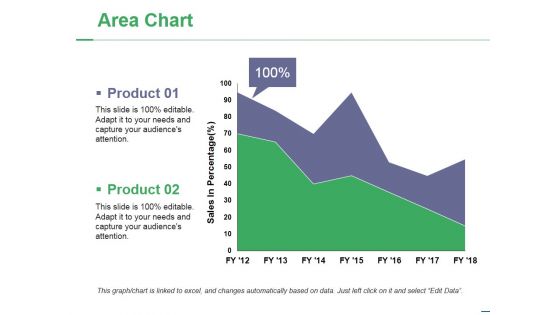
Area Chart Ppt PowerPoint Presentation Layouts Images
This is a area chart ppt powerpoint presentation layouts images. This is a two stage process. The stages in this process are product, sales in percentage, area chart, percentage, finance.
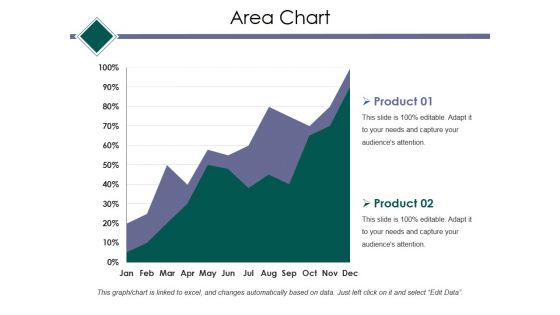
Area Chart Ppt PowerPoint Presentation Model Layout
This is a area chart ppt powerpoint presentation model layout. This is a two stage process. The stages in this process are area chart, finance, marketing, strategy, analysis, business.
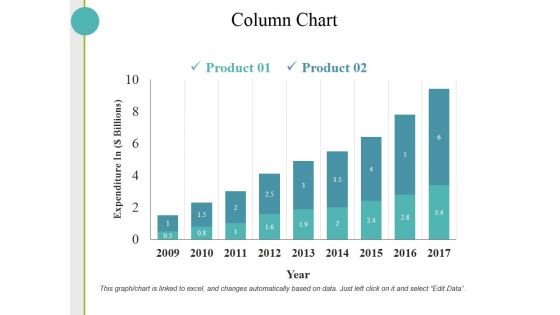
Column Chart Ppt PowerPoint Presentation Pictures Outfit
This is a column chart ppt powerpoint presentation pictures outfit. This is a two stage process. The stages in this process are column chart, finance, marketing, strategy, analysis, business.
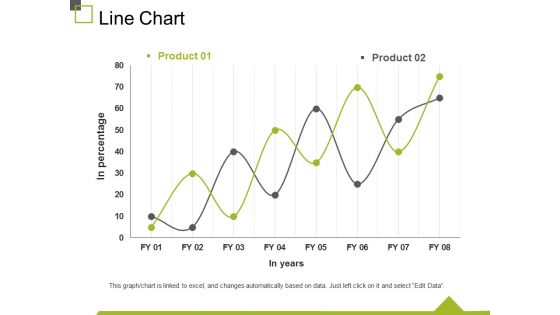
Line Chart Ppt PowerPoint Presentation Infographics Display
This is a line chart ppt powerpoint presentation infographics display. This is a two stage process. The stages in this process are in percentage, in years, chart, business, marketing.
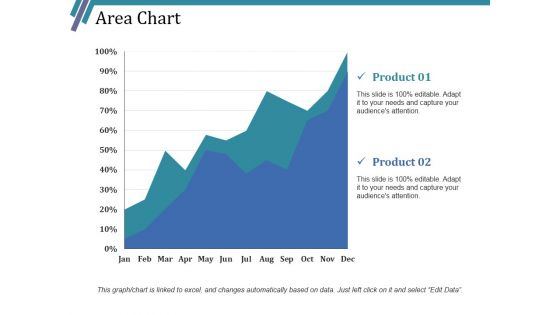
Area Chart Ppt PowerPoint Presentation Styles Templates
This is a area chart ppt powerpoint presentation styles templates. This is a two stage process. The stages in this process are area chart, growth, finance, marketing, strategy, analysis.
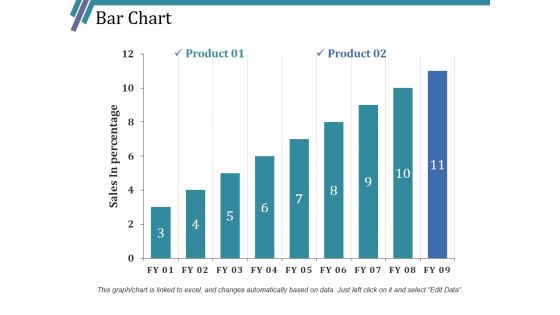
Bar Chart Ppt PowerPoint Presentation Styles Smartart
This is a bar chart ppt powerpoint presentation styles smartart. This is a two stage process. The stages in this process are bar chart, growth, finance, marketing, strategy, analysis.
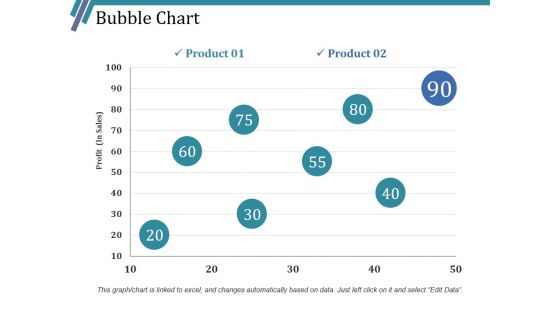
Bubble Chart Ppt PowerPoint Presentation Inspiration Picture
This is a bubble chart ppt powerpoint presentation inspiration picture. This is a two stage process. The stages in this process are bubble chart, growth, finance, marketing, strategy, analysis.
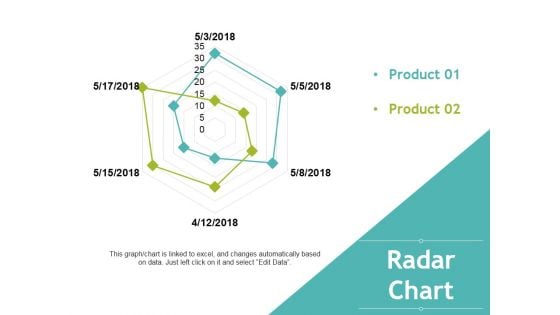
Radar Chart Ppt PowerPoint Presentation Professional Brochure
This is a radar chart ppt powerpoint presentation professional brochure. This is a two stage process. The stages in this process are radar chart, finance, marketing, strategy, analysis, business.
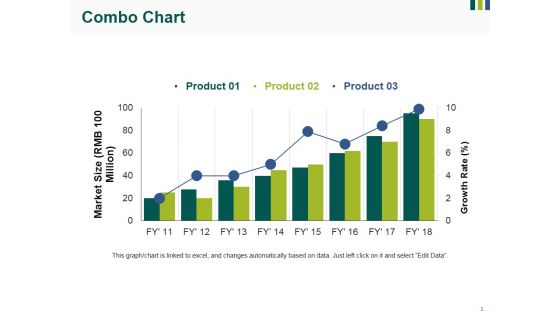
Combo Chart Ppt PowerPoint Presentation Inspiration Vector
This is a combo chart ppt powerpoint presentation inspiration vector. This is a three stage process. The stages in this process are combo chart, finance, marketing, strategy, analysis, business.
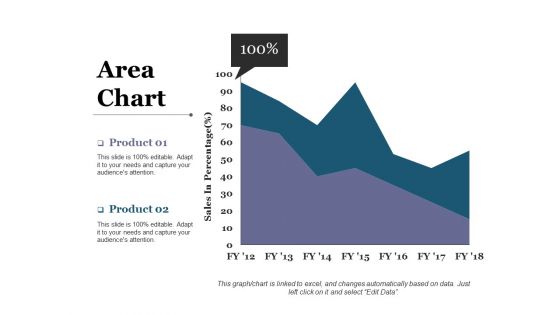
Area Chart Ppt PowerPoint Presentation Model Introduction
This is a area chart ppt powerpoint presentation model introduction. This is a two stage process. The stages in this process are sales in percentage, area chart, percentage, business, marketing.
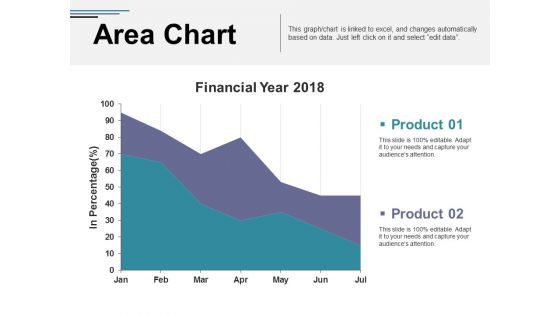
Area Chart Ppt PowerPoint Presentation Inspiration Professional
This is a area chart ppt powerpoint presentation inspiration professional. This is a two stage process. The stages in this process are financial year, in percentage, area chart, finance, business, marketing.
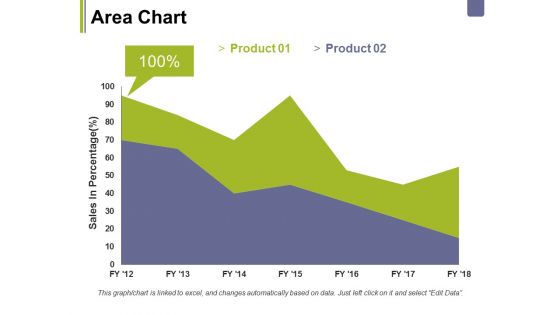
Area Chart Ppt PowerPoint Presentation Styles Show
This is a area chart ppt powerpoint presentation styles show. This is a two stage process. The stages in this process are business, marketing, area chart, sales in percentage, percentage.
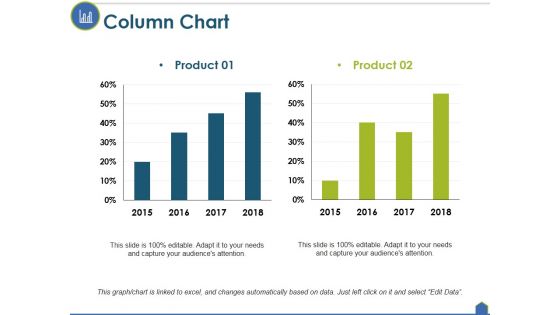
Column Chart Ppt PowerPoint Presentation Inspiration Good
This is a column chart ppt powerpoint presentation inspiration good. This is a two stage process. The stages in this process are column chart, finance, marketing, strategy, analysis, business.
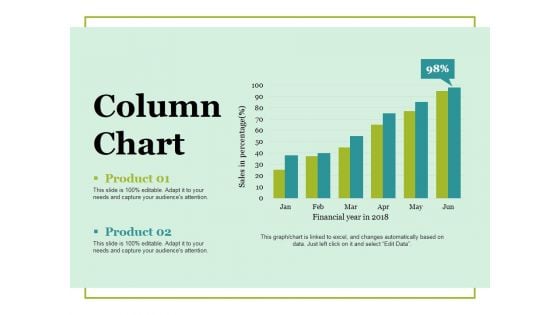
Column Chart Ppt PowerPoint Presentation Ideas Vector
This is a column chart ppt powerpoint presentation ideas vector. This is a two stage process. The stages in this process are column chart, product, financial years, sales in percentage, growth.
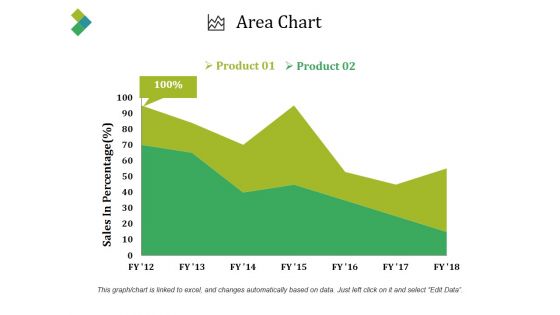
Area Chart Ppt PowerPoint Presentation Infographics Good
This is a area chart ppt powerpoint presentation infographics good. This is a two stage process. The stages in this process are sales in percentage, product, area chart, business, percentage.
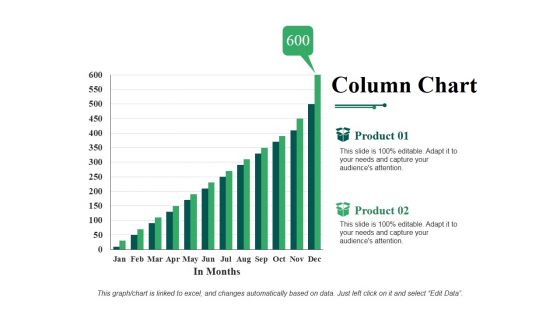
Column Chart Ppt PowerPoint Presentation Gallery Portfolio
This is a column chart ppt powerpoint presentation gallery portfolio. This is a two stage process. The stages in this process are in months, product, column chart, growth, success.
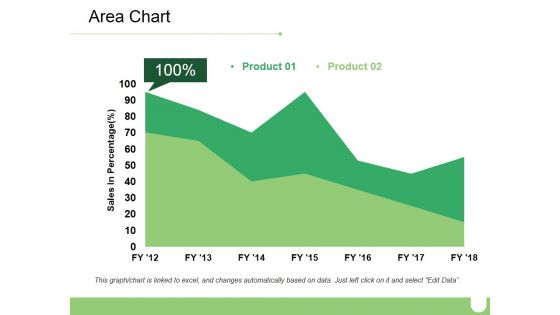
Area Chart Ppt PowerPoint Presentation Model Slides
This is a area chart ppt powerpoint presentation model slides. This is a two stage process. The stages in this process are business, marketing, sales in percentage, chart, percentage, finance.
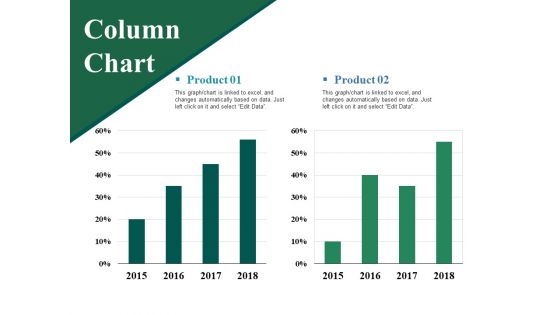
Column Chart Ppt PowerPoint Presentation Layouts Vector
This is a column chart ppt powerpoint presentation layouts vector. This is a two stage process. The stages in this process are product, column chart, bar graph, percentage, finance.
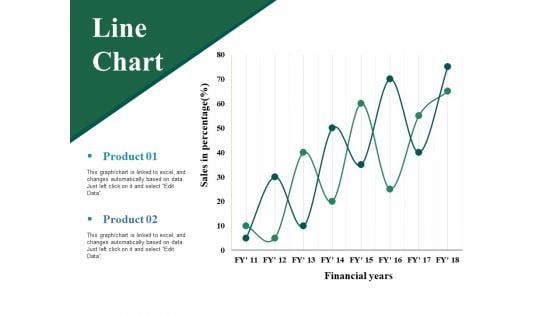
Line Chart Ppt PowerPoint Presentation Professional Grid
This is a line chart ppt powerpoint presentation professional grid. This is a two stage process. The stages in this process are sales in percentage, financial years, product, line chart.
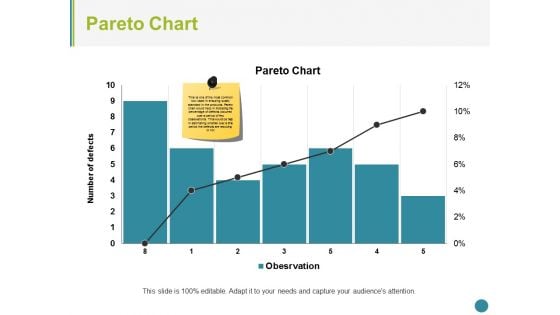
Pareto Chart Ppt PowerPoint Presentation Summary Structure
This is a pareto chart ppt powerpoint presentation summary structure. This is a seven stage process. The stages in this process are pareto chart, finance, marketing, strategy, analysis, business.
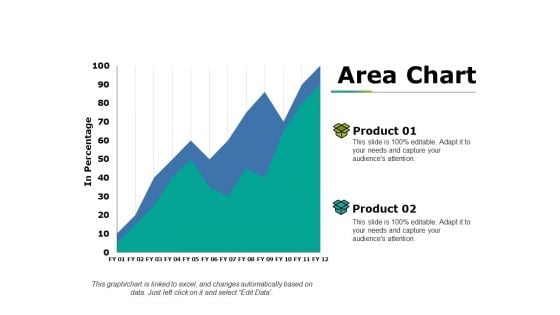
Area Chart Ppt PowerPoint Presentation Show Professional
This is a area chart ppt powerpoint presentation show professional. This is a two stage process. The stages in this process are product, in percentage, area chart, growth, success.
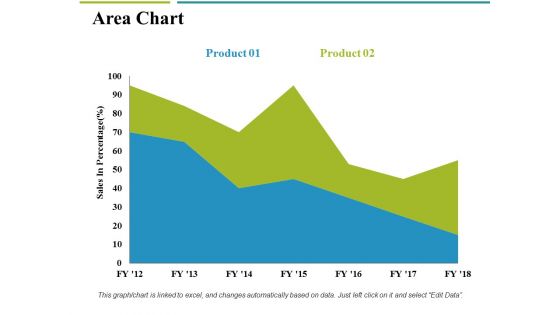
Area Chart Ppt PowerPoint Presentation Ideas Professional
This is a area chart ppt powerpoint presentation ideas professional. This is a two stage process. The stages in this process are business, sales in percentage, area chart, marketing, finance.
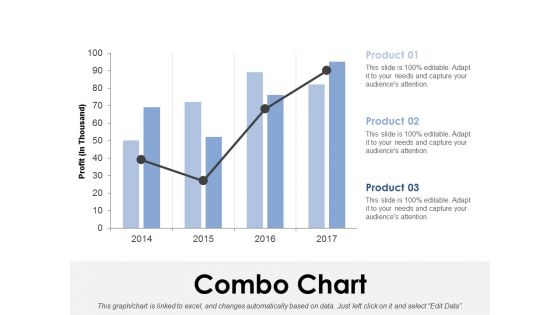
Combo Chart Ppt PowerPoint Presentation Infographics Sample
This is a combo chart ppt powerpoint presentation infographics sample. This is a three stage process. The stages in this process are combo chart, finance, analysis, marketing, strategy, business.
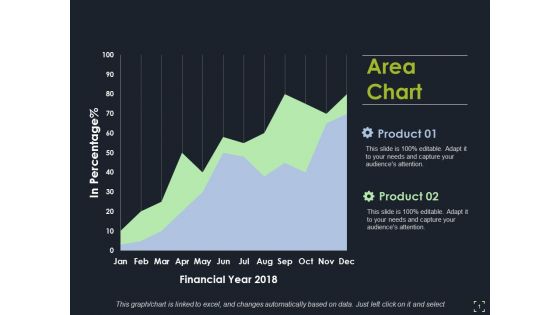
Area Chart Ppt PowerPoint Presentation Infographics Images
This is a area chart ppt powerpoint presentation infographics images. This is a two stage process. The stages in this process are area chart, finance, marketing, analysis, strategy, business.
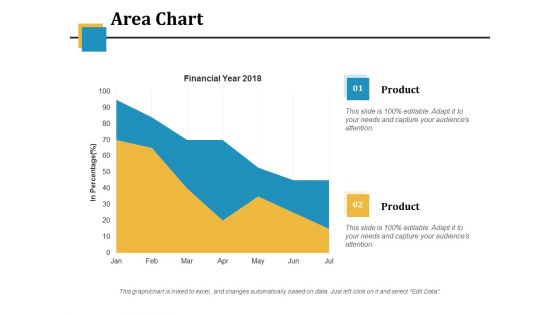
Area Chart Ppt PowerPoint Presentation Model Inspiration
This is a area chart ppt powerpoint presentation model inspiration. This is a two stage process. The stages in this process are financial year, in percentage, area chart, business, marketing.
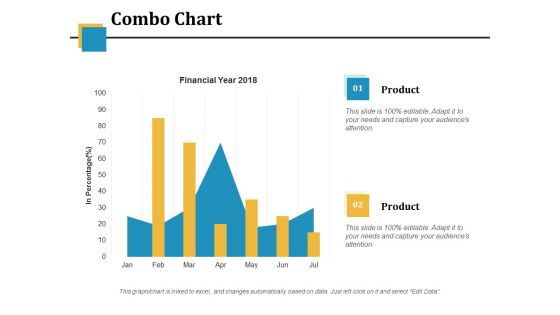
Combo Chart Ppt PowerPoint Presentation Model Vector
This is a combo chart ppt powerpoint presentation model vector. This is a two stage process. The stages in this process are financial year, in percentage, business, marketing, combo chart.
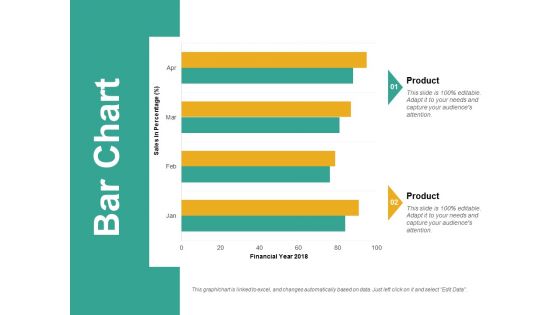
Bar Chart Ppt PowerPoint Presentation Slides Model
This is a bar chart ppt powerpoint presentation slides model. This is a two stage process. The stages in this process are bar chart, analysis, business, marketing, strategy, finance.
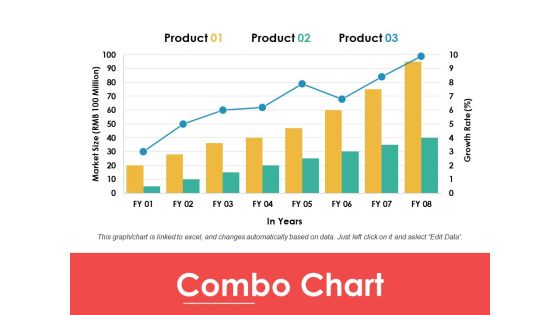
Combo Chart Ppt PowerPoint Presentation Pictures Objects
This is a combo chart ppt powerpoint presentation pictures objects. This is a three stage process. The stages in this process are product, combo chart, in years, market size.
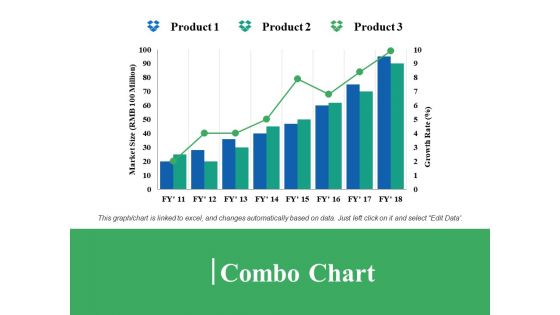
Combo Chart Ppt PowerPoint Presentation Model Microsoft
This is a combo chart ppt powerpoint presentation model microsoft. This is a three stage process. The stages in this process are combo chart, product, market size, growth rate.
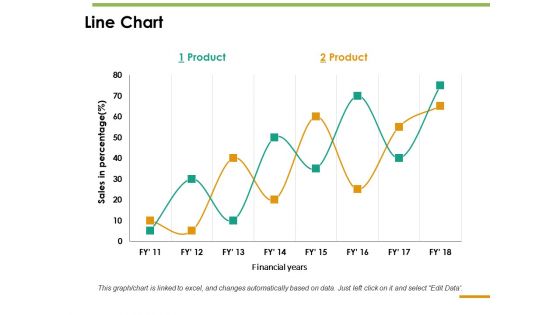
Line Chart Ppt PowerPoint Presentation Inspiration Guide
This is a line chart ppt powerpoint presentation inspiration guide. This is a two stage process. The stages in this process are line chart, sales in percentage, product, financial years.
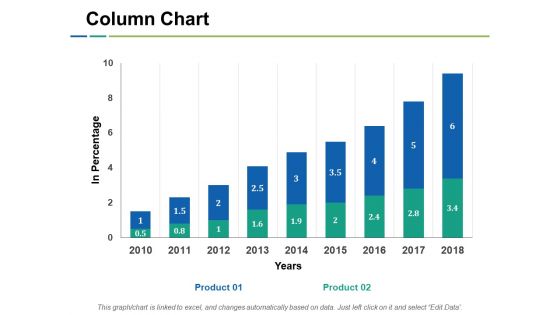
Column Chart Ppt PowerPoint Presentation Background Images
This is a column chart ppt powerpoint presentation background images. This is a two stage process. The stages in this process are column chart, financial, business, marketing, planning, strategy.
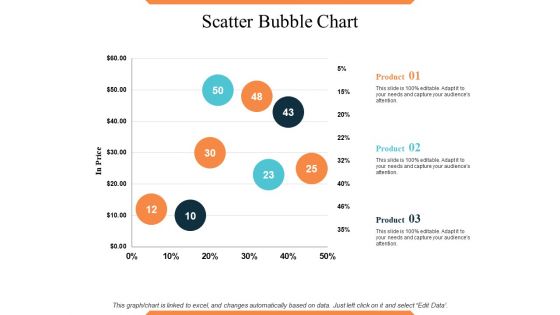
Scatter Bubble Chart Ppt PowerPoint Presentation Professional
This is a scatter bubble chart ppt powerpoint presentation professional. This is a three stage process. The stages in this process are scatter bubble chart, product, in price, percentage, business.
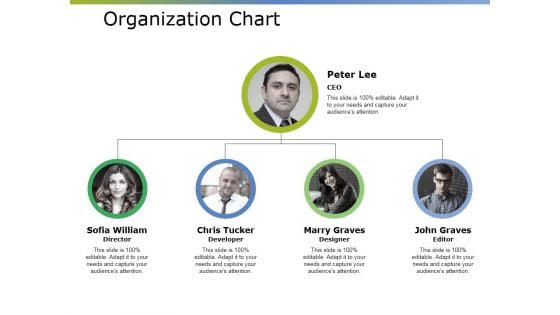
Organization Chart Ppt PowerPoint Presentation Inspiration Microsoft
This is a organization chart ppt powerpoint presentation inspiration microsoft. This is a four stage process. The stages in this process are peter lee, sofia william, chris tucker, marry graves, john graves.
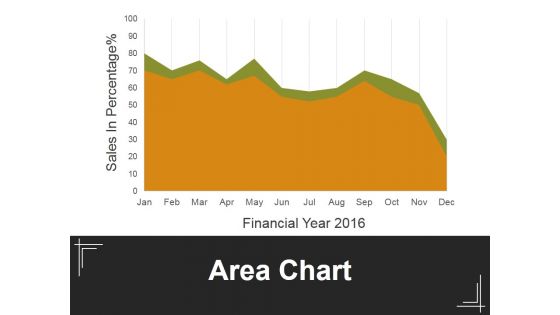
Area Chart Ppt PowerPoint Presentation Slides Deck
This is a area chart ppt powerpoint presentation slides deck. This is a two stage process. The stages in this process are financial, sales in percentage, business, marketing, management.
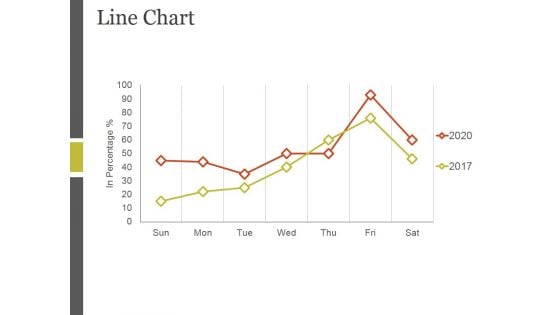
Line Chart Ppt PowerPoint Presentation Ideas Example
This is a line chart ppt powerpoint presentation ideas example. This is a two stage process. The stages in this process are sales in percentage, bar graph, business, marketing, growth.
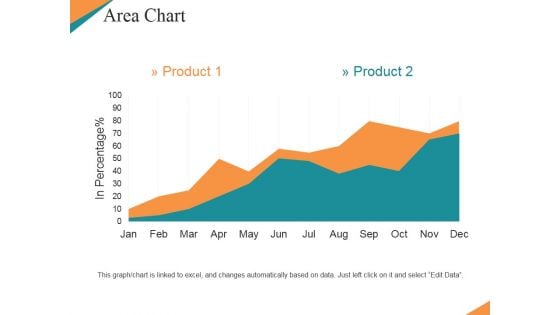
Area Chart Ppt PowerPoint Presentation Summary Templates
This is a area chart ppt powerpoint presentation summary templates. This is a two stage process. The stages in this process are product, in percentage, bar graph, growth, business.
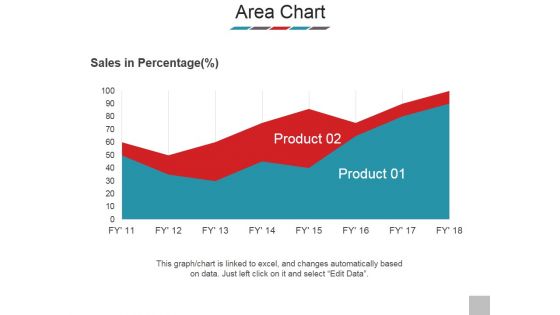
Area Chart Ppt PowerPoint Presentation Styles Images
This is a area chart ppt powerpoint presentation styles images. This is a two stage process. The stages in this process are sales in percentage, product, graph, business, marketing.
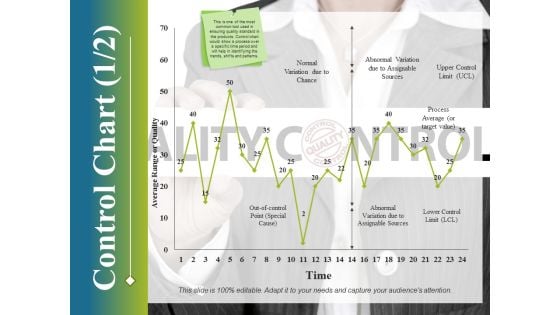
Control Chart Template 1 Ppt PowerPoint Presentation Infographic Template Deck
This is a control chart template 1 ppt powerpoint presentation infographic template deck. This is a one stage process. The stages in this process are control chart, growth, finance, marketing, strategy, business.
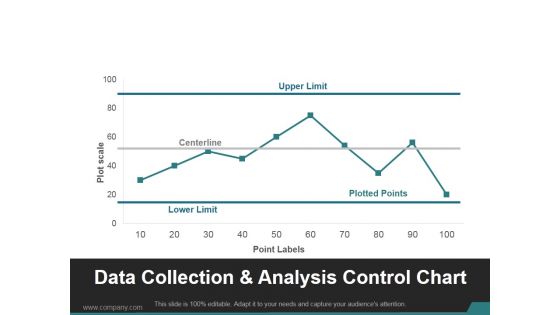
Data Collection And Analysis Control Chart Ppt PowerPoint Presentation Visuals
This is a data collection and analysis control chart ppt powerpoint presentation visuals. This is a ten stage process. The stages in this process are upper limit, centerline, lower limit, plotted points.
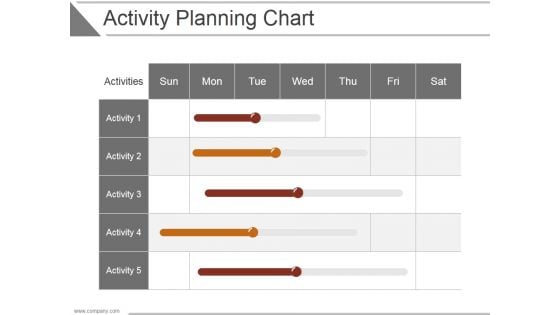
Activity Planning Chart Ppt PowerPoint Presentation Backgrounds
This is a activity planning chart ppt powerpoint presentation backgrounds. This is a five stage process. The stages in this process are business, strategy, analysis, marketing, chart and graph, compare.
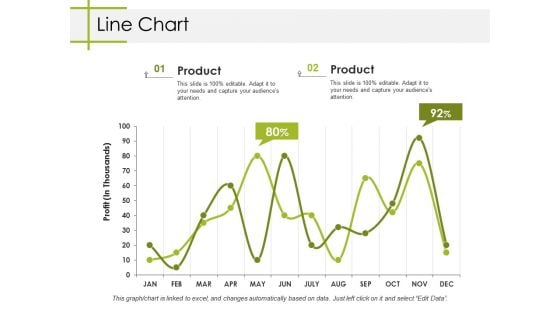
Line Chart Ppt PowerPoint Presentation Ideas Templates
This is a line chart ppt powerpoint presentation ideas templates. This is a two stage process. The stages in this process are line chart, growth, finance, marketing, analysis, business.
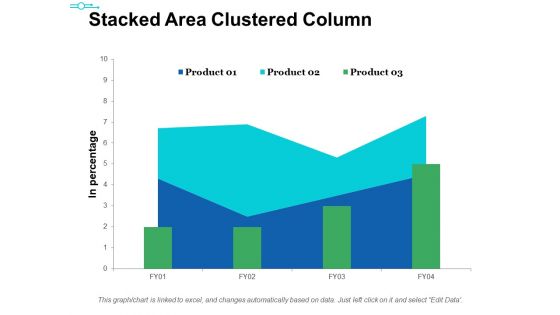
Stacked Area Clustered Column Ppt PowerPoint Presentation Ideas Themes
This is a stacked area clustered column ppt powerpoint presentation ideas themes. This is a three stage process. The stages in this process are product, in percentage, bar graph, area chart, growth.
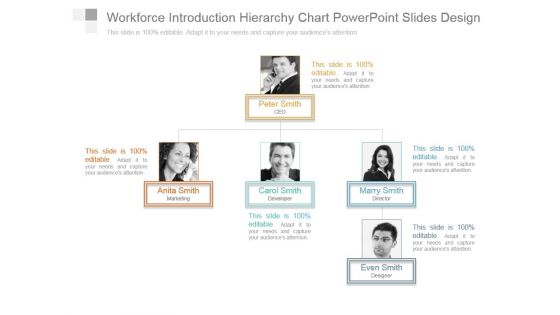
Workforce Introduction Hierarchy Chart Powerpoint Slides Design
This is a workforce introduction hierarchy chart powerpoint slides design. This is a three stage process. The stages in this process are peter smith ceo, anita smith marketing, carol smith developer, marry smith director, even smith designer.
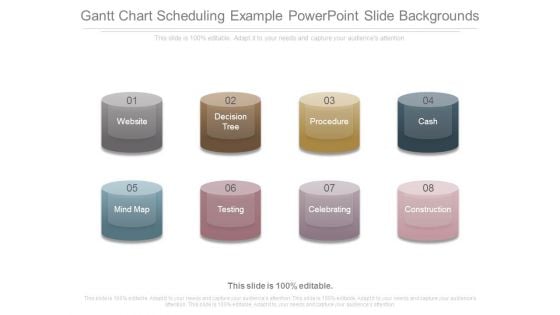
Gantt Chart Scheduling Example Powerpoint Slide Backgrounds
This is a gantt chart scheduling example powerpoint slide backgrounds. This is a eight stage process. The stages in this process are website, decision tree, procedure, cash, mind map, testing, celebrating, construction.
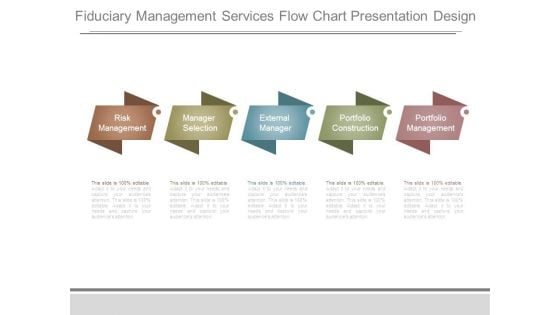
Fiduciary Management Services Flow Chart Presentation Design
This is a fiduciary management services flow chart presentation design. This is a five stage process. The stages in this process are risk management, manager selection, external manager, portfolio construction, portfolio management.
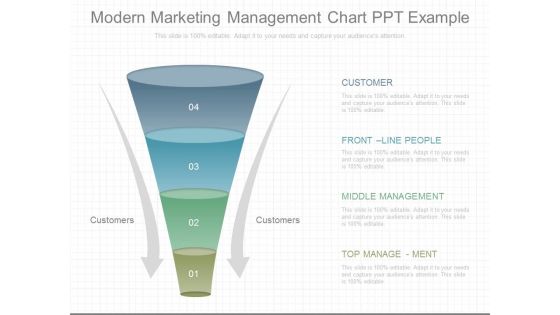
Modern Marketing Management Chart Ppt Example
This is a modern marketing management chart ppt example. This is a four stage process. The stages in this process are customer, customers, front line people, middle management, top management.
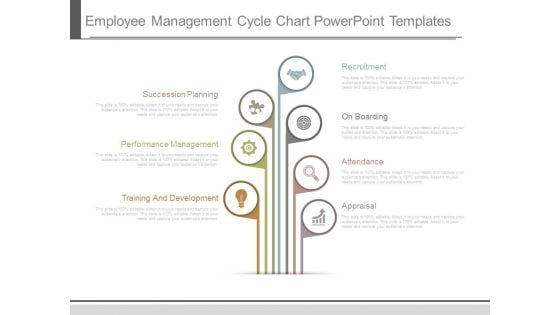
Employee Management Cycle Chart Powerpoint Templates
This is a employee management cycle chart powerpoint templates. This is a seven stage process. The stages in this process are succession planning, performance management, training and development, recruitment, on boarding, attendance, appraisal.
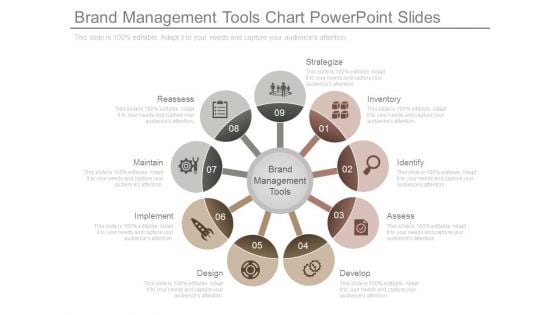
Brand Management Tools Chart Powerpoint Slides
This is a brand management tools chart powerpoint slides. This is a nine stage process. The stages in this process are inventory, identify, assess, develop, design, implement, maintain, reassess, strategize.
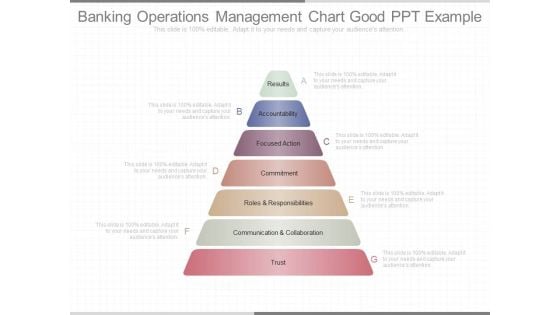
Banking Operations Management Chart Good Ppt Example
This is a banking operations management chart good ppt example. This is a seven stage process. The stages in this process are results, accountability, focused action, commitment, roles and responsibilities, communication and collaboration, trust.
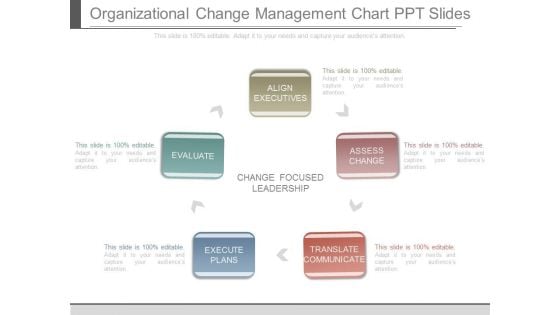
Organizational Change Management Chart Ppt Slides
This is a organizational change management chart ppt slides. This is a five stage process. The stages in this process are align executives, assess change, translate communicate, execute plans, evaluate.
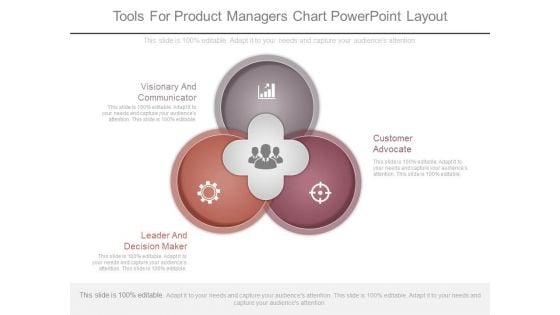
Tools For Product Managers Chart Powerpoint Layout
This is a tools for product managers chart powerpoint layout. This is a three stage process. The stages in this process are visionary and communicator, leader and decision maker, customer advocate.
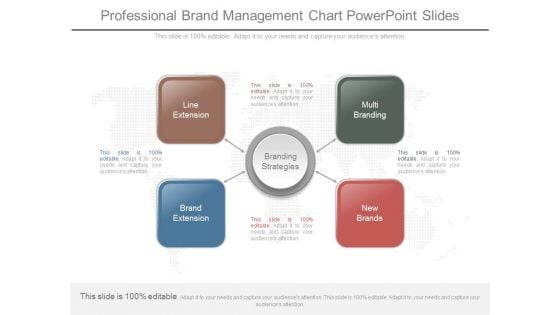
Professional Brand Management Chart Powerpoint Slides
This is a professional brand management chart powerpoint slides. This is a four stage process. The stages in this process are branding strategies, line extension, brand extension, new brands, multi branding.
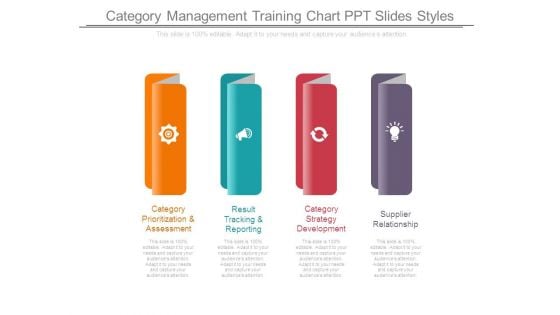
Category Management Training Chart Ppt Slides Styles
This is a category management training chart ppt slides styles. This is a four stage process. The stages in this process are category prioritization and assessment, result tracking and reporting, category strategy development, supplier relationship.
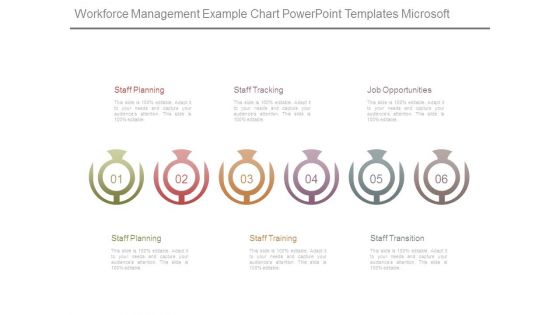
Workforce Management Example Chart Powerpoint Templates Microsoft
This is a workforce management example chart powerpoint templates microsoft. This is a six stage process. The stages in this process are staff planning, staff tracking, job opportunities, staff training, staff transition.
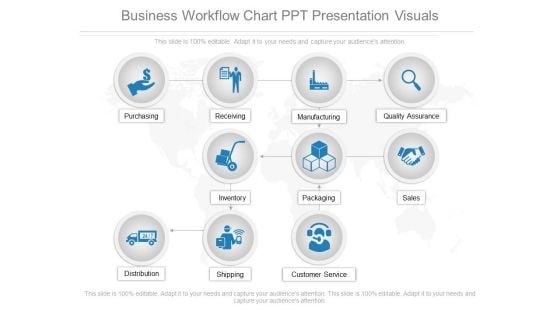
Business Workflow Chart Ppt Presentation Visuals
This is a business workflow chart ppt presentation visuals. This is a one stage process. The stages in this process are purchasing, receiving, manufacturing, quality assurance, inventory, packaging, sales, distribution, shipping, customer service.
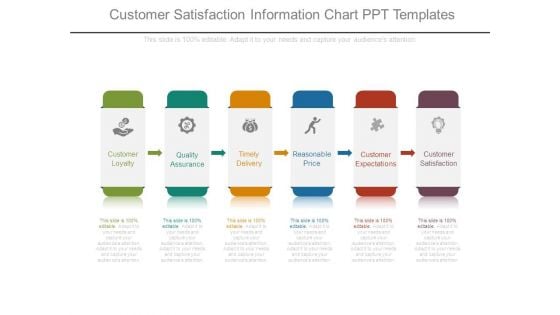
Customer Satisfaction Information Chart Ppt Templates
This is a customer satisfaction information chart ppt templates. This is a six stage process. The stages in this process are customer loyalty, quality assurance, timely delivery, reasonable price, customer expectations, customer satisfaction.

Business Development Organizational Chart Example Of Ppt
This is a business development organizational chart example of ppt. This is a five stage process. The stages in this process are reward system, structure, business and lateral link, human resource management, strategy.
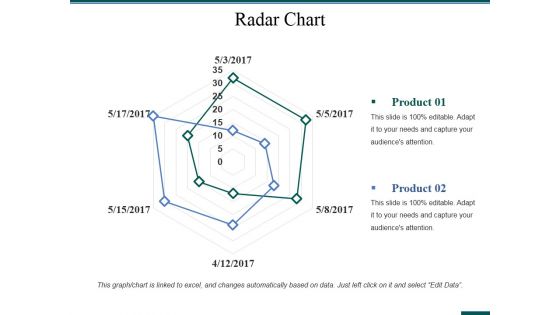
Radar Chart Ppt PowerPoint Presentation Layouts Gallery
This is a radar chart ppt powerpoint presentation layouts gallery. This is a two stage process. The stages in this process are business, analysis, strategy, marketing, radar chart, finance.
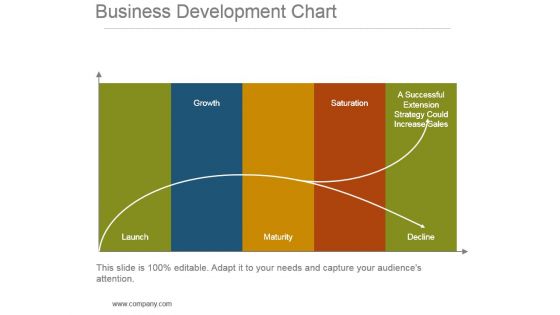
Business Development Chart Powerpoint Slide Ideas
This is a business development chart powerpoint slide ideas. This is a five stage process. The stages in this process are launch, growth, maturity, saturation, a successful extension strategy could increase sales, decline.
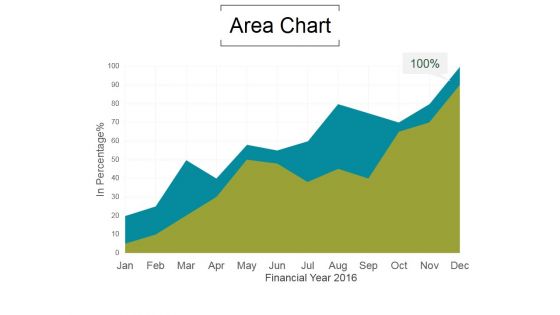
Area Chart Ppt PowerPoint Presentation Topics
This is a area chart ppt powerpoint presentation topics. This is a two stage process. The stages in this process are product, in percentage, jan, feb, mar, apr, may.
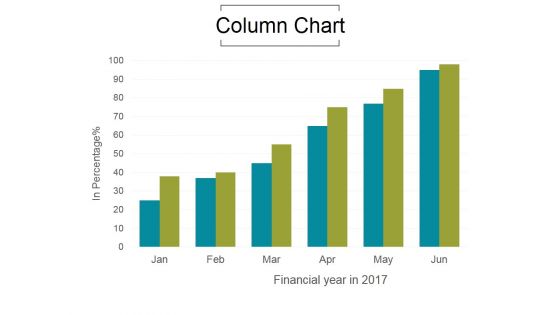
Column Chart Ppt PowerPoint Presentation Show
This is a column chart ppt powerpoint presentation show. This is a six stage process. The stages in this process are product, in percentage, jan, feb, mar, apr, may.
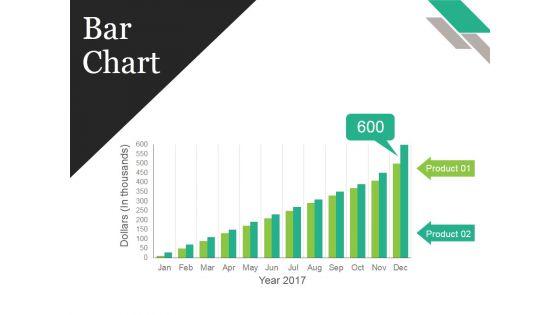
Bar Chart Ppt PowerPoint Presentation File Model
This is a bar chart ppt powerpoint presentation file model. This is a two stage process. The stages in this process are business, strategy, marketing, analysis, finance, bar graph.
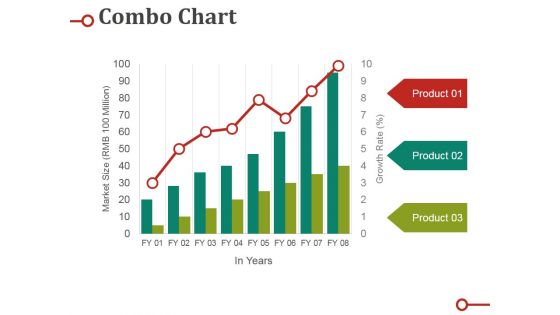
Combo Chart Ppt PowerPoint Presentation Gallery Sample
This is a combo chart ppt powerpoint presentation gallery sample. This is a three stage process. The stages in this process are market size, product, growth rate, bar, graph.
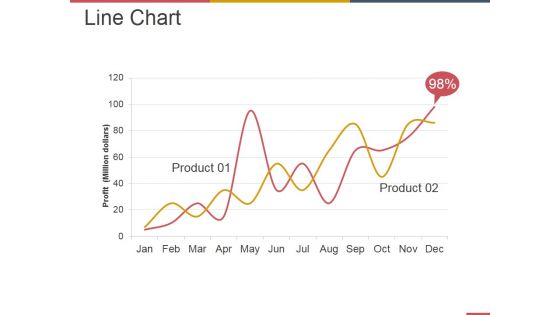
Line Chart Ppt PowerPoint Presentation Summary Information
This is a line chart ppt powerpoint presentation summary information. This is a two stage process. The stages in this process are business, strategy, marketing, analysis, profit million dollars.
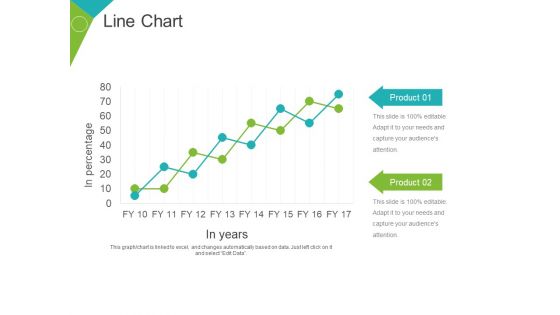
Line Chart Ppt PowerPoint Presentation Gallery Objects
This is a line chart ppt powerpoint presentation gallery objects. This is a two stage process. The stages in this process are product, business, marketing, growth, in years, in percentage.
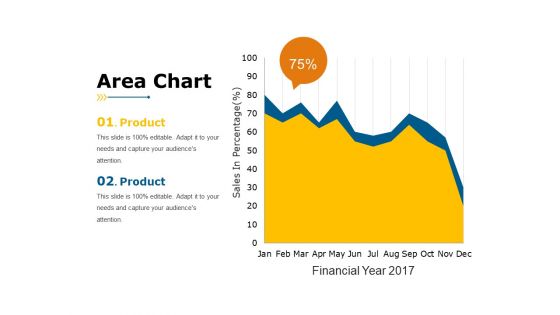
Area Chart Ppt PowerPoint Presentation Slides Rules
This is a area chart ppt powerpoint presentation slides rules. This is a two stage process. The stages in this process are sales in percentage, business, marketing, product, finance.
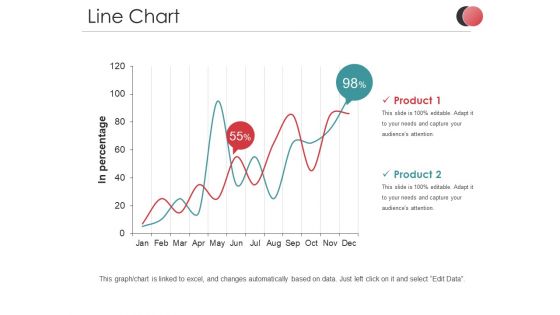
Line Chart Ppt PowerPoint Presentation Professional Ideas
This is a line chart ppt powerpoint presentation professional ideas. This is a two stage process. The stages in this process are in percentage, product, business, marketing, finance, percentage.
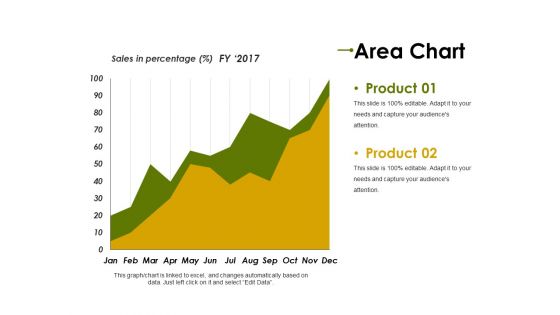
Area Chart Ppt PowerPoint Presentation Summary Objects
This is a area chart ppt powerpoint presentation summary objects. This is a two stage process. The stages in this process are product, sales in percentage, finance, business, marketing.

Column Chart Ppt PowerPoint Presentation Layouts Ideas
This is a column chart ppt powerpoint presentation layouts ideas. This is a two stage process. The stages in this process are dollars in thousands, strategy, business, graph, product.
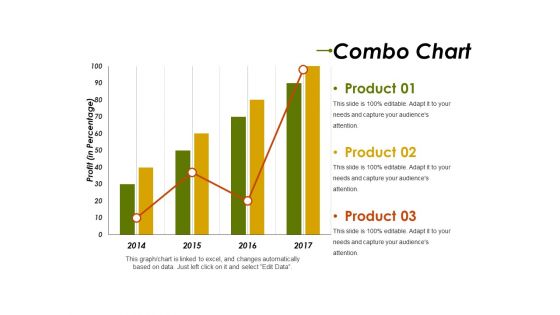
Combo Chart Ppt PowerPoint Presentation Infographics Introduction
This is a combo chart ppt powerpoint presentation infographics introduction. This is a three stage process. The stages in this process are profit in percentage, business, graph, strategy, product.
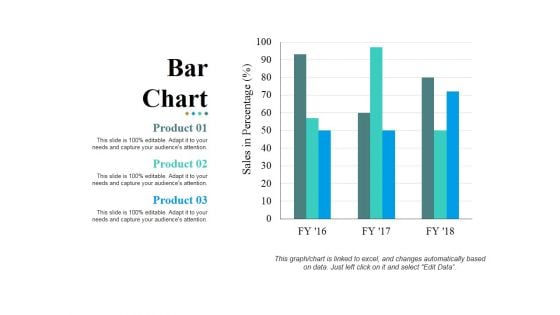
Bar Chart Ppt PowerPoint Presentation Layouts Pictures
This is a bar chart ppt powerpoint presentation layouts pictures. This is a three stage process. The stages in this process are bar graph, product, sales in percentage, business, marketing.
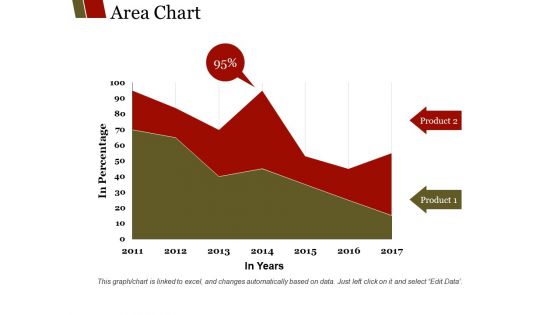
Area Chart Ppt PowerPoint Presentation Show Templates
This is a area chart ppt powerpoint presentation show templates. This is a two stage process. The stages in this process are product, in percentage, in years, finance, graph.
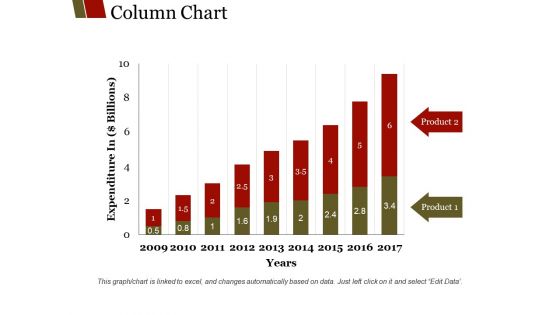
Column Chart Ppt PowerPoint Presentation Summary Graphics
This is a column chart ppt powerpoint presentation summary graphics. This is a nine stage process. The stages in this process are product, years, expenditure in billions, graph, business.
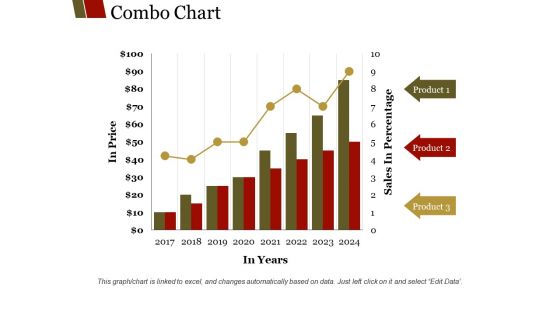
Combo Chart Ppt PowerPoint Presentation Summary Layouts
This is a combo chart ppt powerpoint presentation summary layouts. This is a eight stage process. The stages in this process are product, sales in percentage, in years, in price, graph.
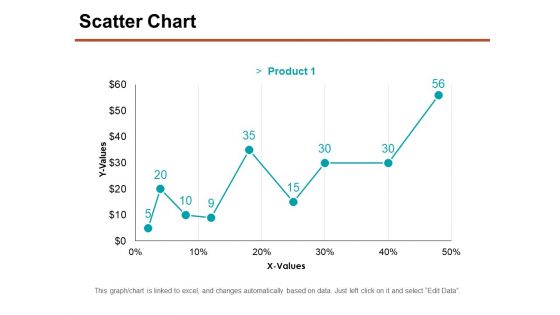
Scatter Chart Ppt PowerPoint Presentation Ideas Templates
This is a scatter chart ppt powerpoint presentation ideas templates. This is a nine stage process. The stages in this process are y values, x values, product, graph, business.
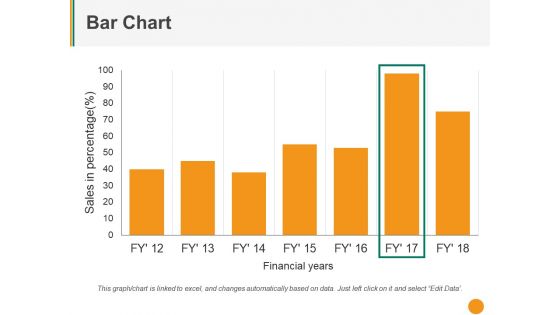
Bar Chart Ppt PowerPoint Presentation Styles Outfit
This is a bar chart ppt powerpoint presentation styles outfit. This is a Seven stage process. The stages in this process are sales in percentage, financial years, graph, business.
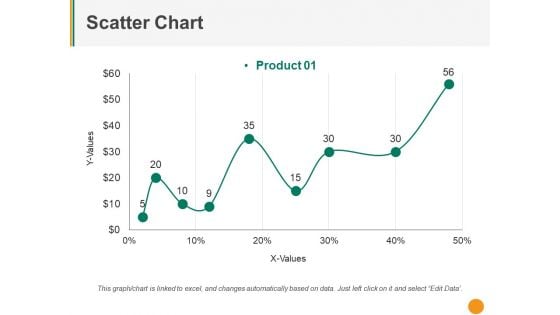
Scatter Chart Ppt PowerPoint Presentation Summary Smartart
This is a scatter chart ppt powerpoint presentation summary smartart. This is a nine stage process. The stages in this process are y values, x values, product, business, graph.
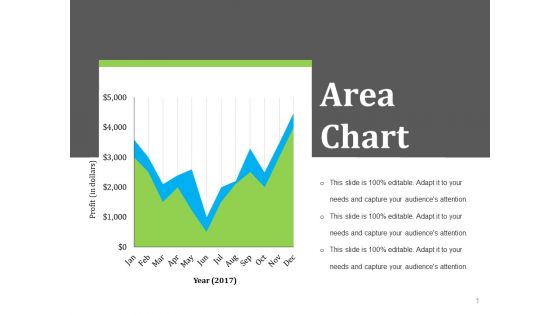
Area Chart Ppt PowerPoint Presentation Model Examples
This is a area chart ppt powerpoint presentation model examples. This is a two stage process. The stages in this process are year profit in dollars, business, strategy, growth.
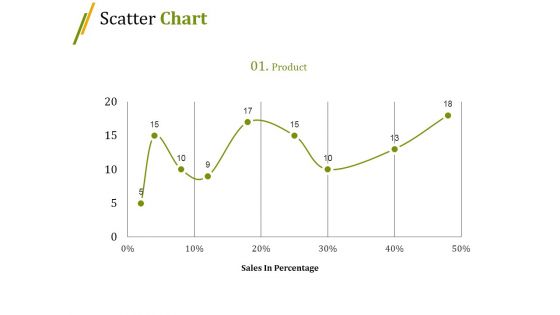
Scatter Chart Ppt PowerPoint Presentation Slides Summary
This is a scatter chart ppt powerpoint presentation slides summary. This is a nine stage process. The stages in this process are sales in percentage, growth, graph, business, marketing.
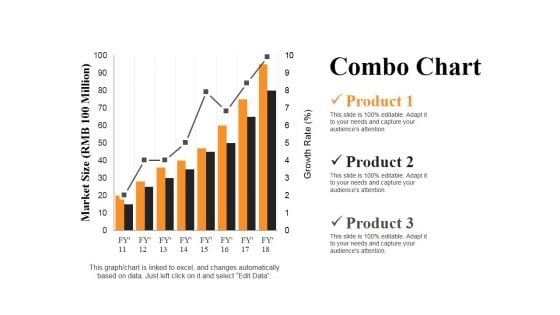
Combo Chart Ppt PowerPoint Presentation Summary Slides
This is a combo chart ppt powerpoint presentation summary slides. This is a three stage process. The stages in this process are market size, product, growth rate, bar graph, success.
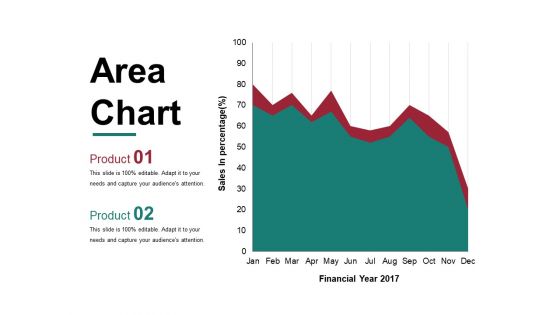
Area Chart Ppt PowerPoint Presentation Layouts Maker
This is a area chart ppt powerpoint presentation layouts maker. This is a two stage process. The stages in this process are financial year, sales in percentage, graph, business, marketing.
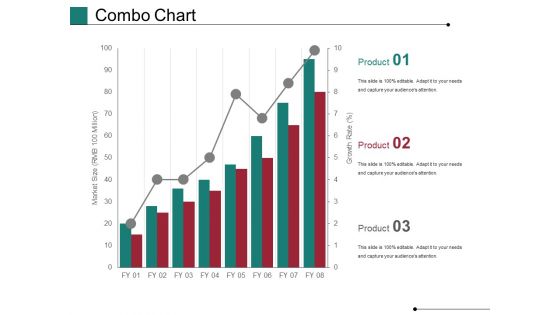
Combo Chart Ppt PowerPoint Presentation Styles Objects
This is a combo chart ppt powerpoint presentation styles objects. This is a three stage process. The stages in this process are market size growth rate, growth, business, marketing, graph.
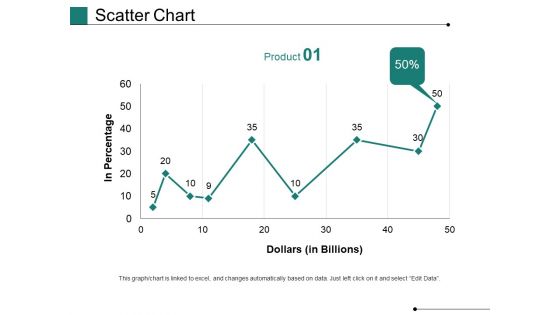
Scatter Chart Ppt PowerPoint Presentation Gallery Show
This is a scatter chart ppt powerpoint presentation gallery show. This is a one stage process. The stages in this process are in percentage, dollars, business, marketing, growth, graph.
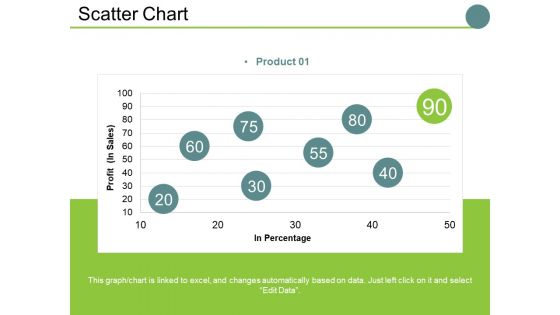
Scatter Chart Ppt PowerPoint Presentation Slides Examples
This is a scatter chart ppt powerpoint presentation slides examples. This is a one stage process. The stages in this process are profit , in percentage, business, marketing, finance, graph.
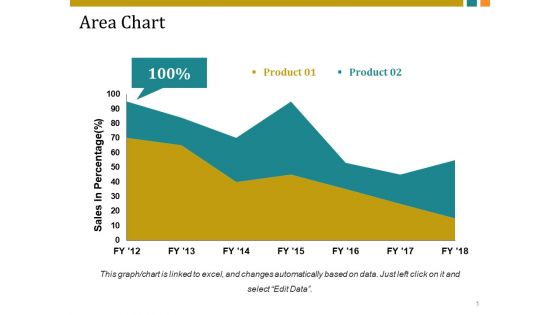
Area Chart Ppt PowerPoint Presentation Professional Brochure
This is a area chart ppt powerpoint presentation professional brochure. This is a two stage process. The stages in this process are sales in percentage, business, marketing, finance, graph.
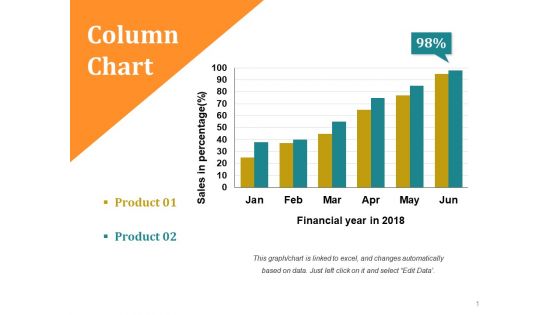
Column Chart Ppt PowerPoint Presentation Slides Smartart
This is a column chart ppt powerpoint presentation slides smartart. This is a two stage process. The stages in this process are sales in percentage, financial year in, business, growth, strategy.
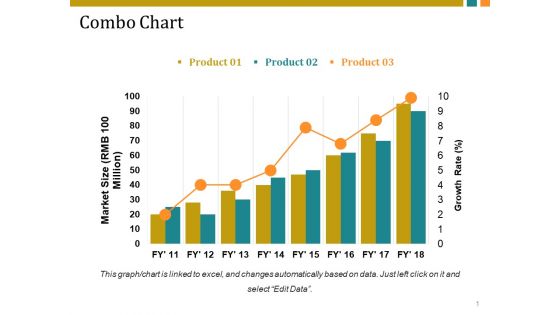
Combo Chart Ppt PowerPoint Presentation Guide
This is a combo chart ppt powerpoint presentation guide. This is a three stage process. The stages in this process are market size, growth rate, business, growth, graph, strategy.
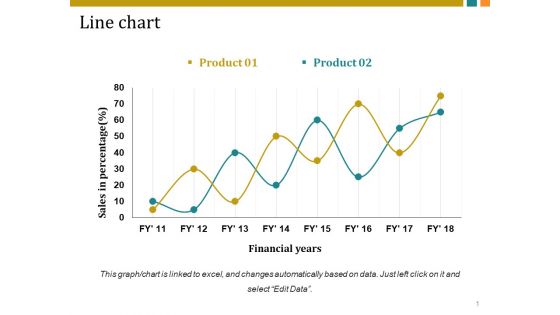
Line Chart Ppt PowerPoint Presentation Inspiration Vector
This is a line chart ppt powerpoint presentation inspiration vector. This is a two stage process. The stages in this process are sales in percentage, financial years, business, marketing, growth.
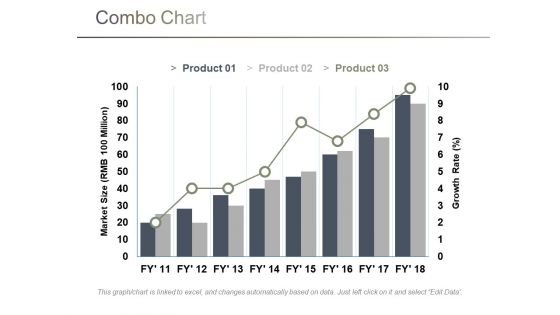
Combo Chart Ppt PowerPoint Presentation Pictures Shapes
This is a combo chart ppt powerpoint presentation pictures shapes. This is a three stage process. The stages in this process are market size, growth rate, business, marketing, graph.
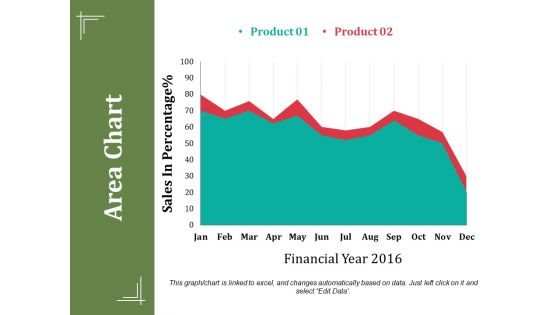
Area Chart Ppt PowerPoint Presentation Summary Show
This is a area chart ppt powerpoint presentation summary show. This is a two stage process. The stages in this process are sales in percentage, financial year, business, marketing, finance.
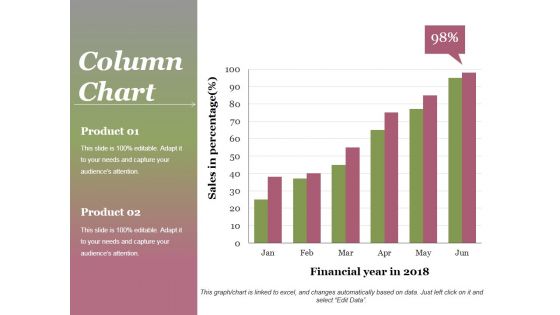
Column Chart Ppt PowerPoint Presentation Gallery Background
This is a column chart ppt powerpoint presentation gallery background. This is a two stage process. The stages in this process are product, sales in percentage, financial year, graph, success.
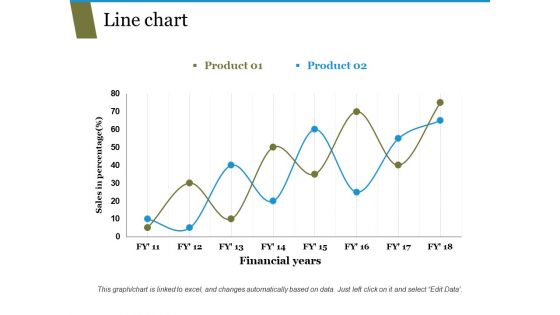
Line Chart Ppt PowerPoint Presentation Pictures Templates
This is a line chart ppt powerpoint presentation pictures templates. This is a two stage process. The stages in this process are sales in percentage, financial years, business, marketing, growth.
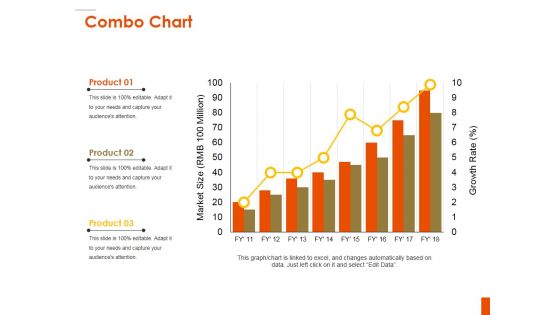
Combo Chart Ppt PowerPoint Presentation Inspiration Background
This is a combo chart ppt powerpoint presentation inspiration background. This is a three stage process. The stages in this process are product, bar graph, market size, growth, growth rate.
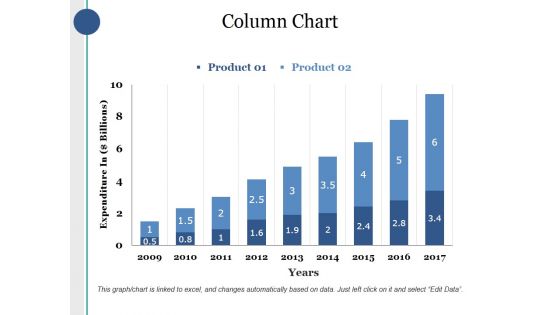
Column Chart Ppt PowerPoint Presentation Infographics Deck
This is a column chart ppt powerpoint presentation infographics deck. This is a two stage process. The stages in this process are product, expenditure in, years, bar graph, growth.
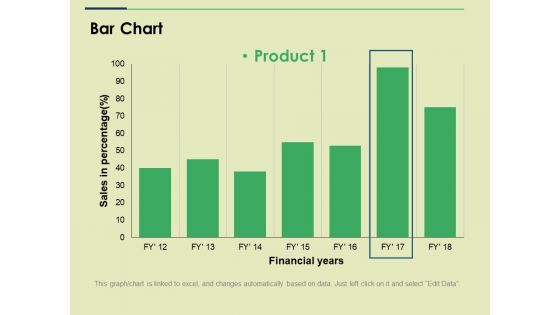
Bar Chart Ppt PowerPoint Presentation File Slide
This is a bar chart ppt powerpoint presentation file slide. This is a one stage process. The stages in this process are sales in percentage financial years, business, marketing, strategy, graph.
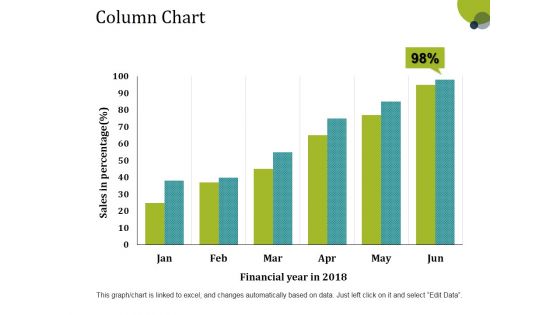
Column Chart Ppt PowerPoint Presentation Layouts Tips
This is a column chart ppt powerpoint presentation layouts tips. This is a six stage process. The stages in this process are sales in percentage, financial year, bar graph, growth, success.
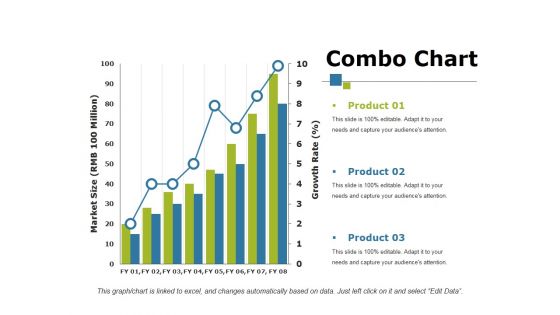
Combo Chart Ppt PowerPoint Presentation Show Influencers
This is a combo chart ppt powerpoint presentation show influencers. This is a three stage process. The stages in this process are product, bar graph, growth, growth rate, market size.
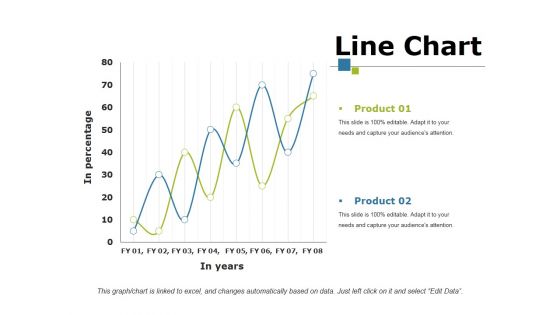
Line Chart Ppt PowerPoint Presentation Portfolio Mockup
This is a line chart ppt powerpoint presentation portfolio mockup. This is a two stage process. The stages in this process are product, in percentage, in year, growth, success.
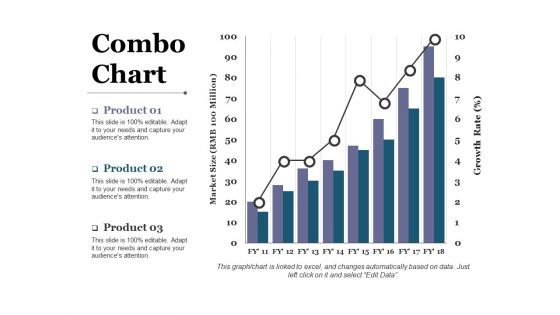
Combo Chart Ppt PowerPoint Presentation Gallery Layout
This is a combo chart ppt powerpoint presentation gallery layout. This is a three stage process. The stages in this process are business, marketing, graph, market size, growth rate.
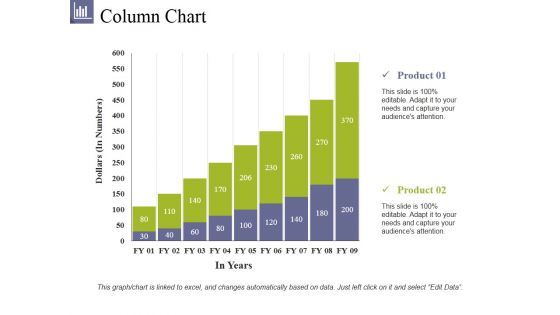
Column Chart Ppt PowerPoint Presentation File Summary
This is a column chart ppt powerpoint presentation file summary. This is a two stage process. The stages in this process are product, dollars, in years, bar graph, growth.
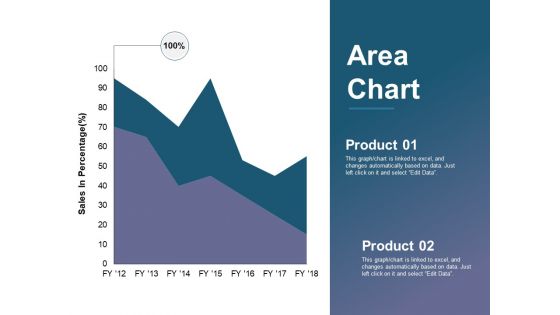
Area Chart Ppt PowerPoint Presentation Summary Information
This is a area chart ppt powerpoint presentation summary information. This is a two stage process. The stages in this process are business, sales in percentage, percentage, marketing, graph.
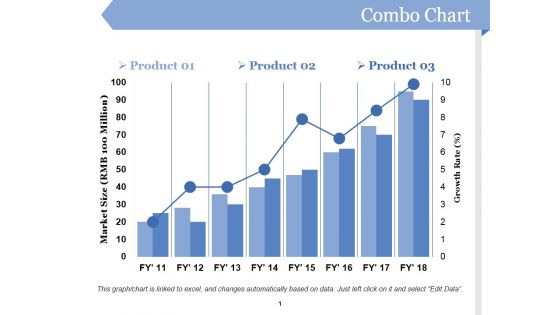
Combo Chart Ppt PowerPoint Presentation Ideas Professional
This is a combo chart ppt powerpoint presentation ideas professional. This is a three stage process. The stages in this process are business, marketing, market size, growth rate, graph.
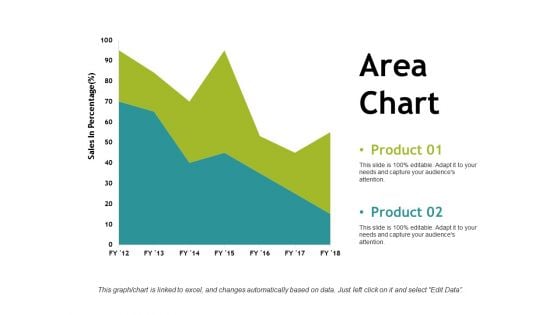
Area Chart Ppt PowerPoint Presentation File Visuals
This is a area chart ppt powerpoint presentation file visuals. This is a two stage process. The stages in this process are business, sales in percentage, marketing, graph, strategy, finance.
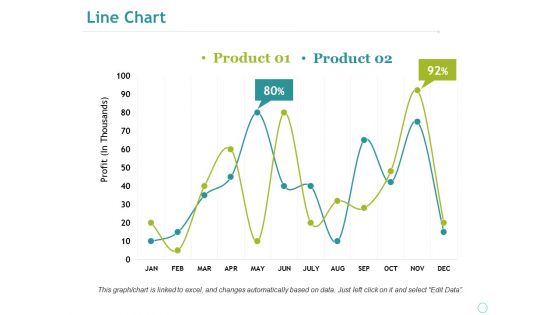
Line Chart Ppt PowerPoint Presentation Professional Portfolio
This is a line chart ppt powerpoint presentation professional portfolio. This is a two stage process. The stages in this process are business, marketing, profit, percentage, graph, strategy, finance.
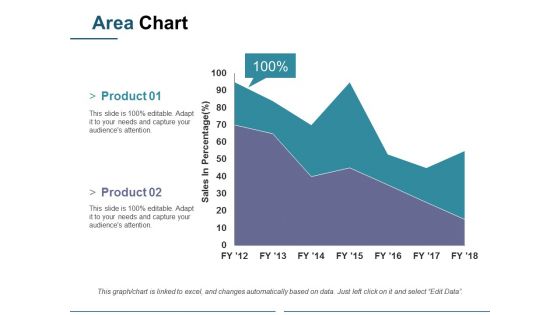
Area Chart Ppt PowerPoint Presentation Pictures Vector
This is a area chart ppt powerpoint presentation pictures vector. This is a two stage process. The stages in this process are sales in percentage, business, marketing, graph, percentage.
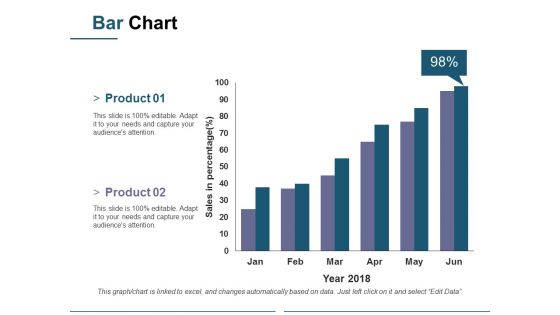
Bar Chart Ppt PowerPoint Presentation Model Sample
This is a bar chart ppt powerpoint presentation model sample. This is a two stage process. The stages in this process are sales in percentage, business, marketing, graph, percentage, year.
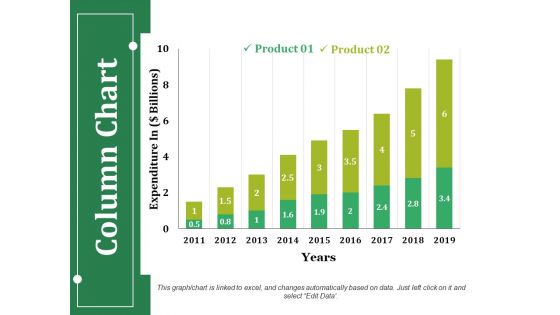
Column Chart Ppt PowerPoint Presentation Infographics Guidelines
This is a column chart ppt powerpoint presentation infographics guidelines. This is a two stage process. The stages in this process are product, expenditure in, years, business, bar graph.
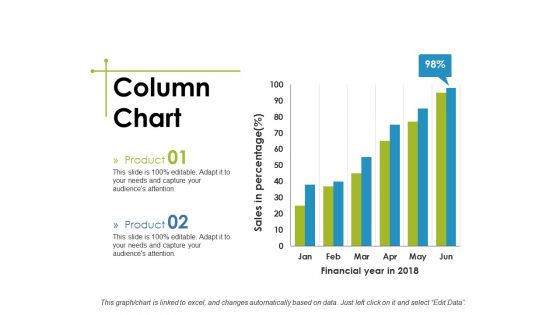
Column Chart Ppt PowerPoint Presentation Show Structure
This is a column chart ppt powerpoint presentation show structure. This is a two stage process. The stages in this process are business, financial year in, sales in percentage, marketing, graph.
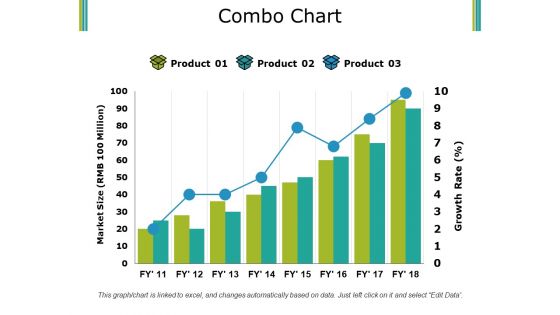
Combo Chart Ppt PowerPoint Presentation Pictures Summary
This is a combo chart ppt powerpoint presentation pictures summary. This is a three stage process. The stages in this process are product, market size, growth rate, bar graph, success.
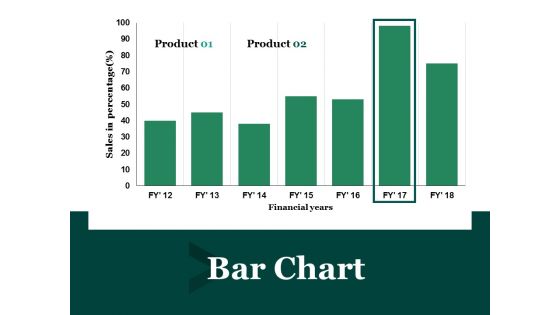
Bar Chart Ppt PowerPoint Presentation Layouts Template
This is a bar chart ppt powerpoint presentation layouts template. This is a two stage process. The stages in this process are financial year, sales in percentage, business, marketing, finance.
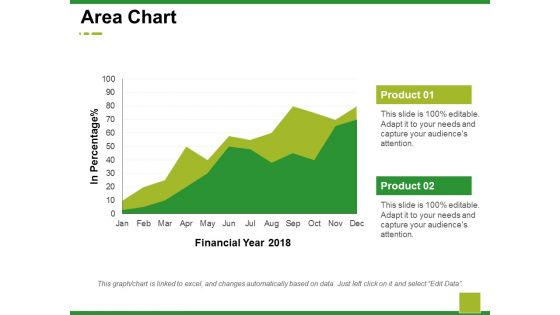
Area Chart Ppt PowerPoint Presentation Model Demonstration
This is a area chart ppt powerpoint presentation model demonstration. This is a two stage process. The stages in this process are business, marketing, financial year, in percentage, graph.
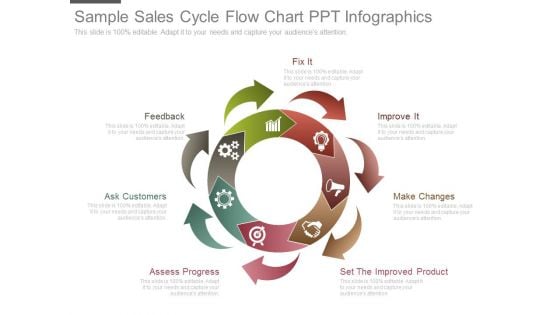
Sample Sales Cycle Flow Chart Ppt Infographics
This is a sample sales cycle flow chart ppt infographics. This is a seven stage process. The stages in this process are fix it, feedback, ask customers, assess progress, set the improved product, make changes, improve it.
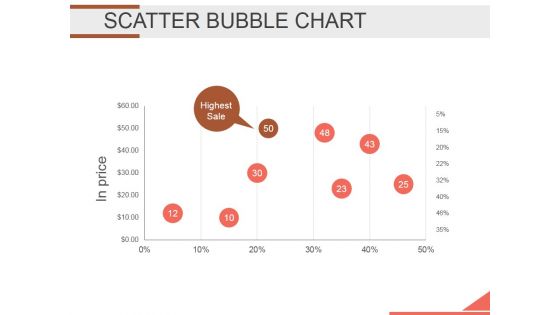
Scatter Bubble Chart Ppt PowerPoint Presentation Backgrounds
This is a scatter bubble chart ppt powerpoint presentation backgrounds. This is a one stage process. The stages in this process are bubble chart, finance, marketing, analysis, strategy, business.
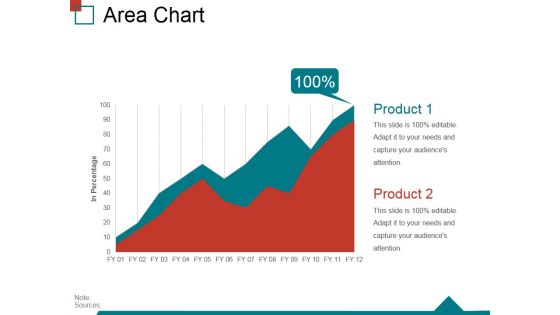
Area Chart Ppt PowerPoint Presentation Inspiration Display
This is a area chart ppt powerpoint presentation inspiration display. This is a two stage process. The stages in this process are area chart, finance, growth, success, strategy, business.
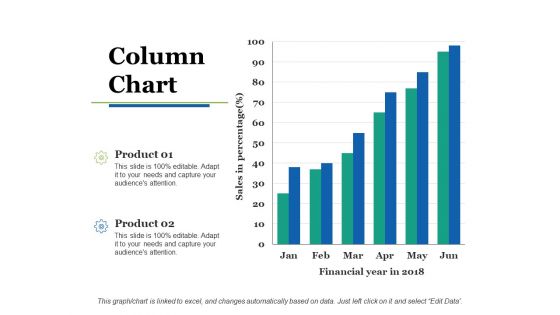
Column Chart Ppt PowerPoint Presentation Slides Show
This is a column chart ppt powerpoint presentation slides show. This is a two stage process. The stages in this process are column chart, product, sales in percentage, financial year, growth.
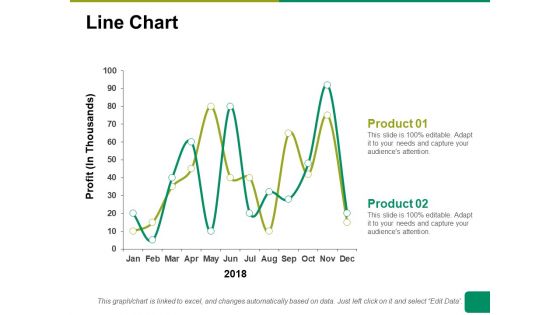
Line Chart Ppt PowerPoint Presentation Summary Ideas
This is a line chart ppt powerpoint presentation summary ideas. This is a two stage process. The stages in this process are line chart, profit, product, financial years, business.
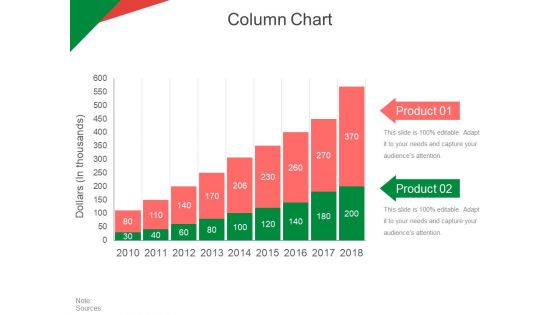
Column Chart Ppt PowerPoint Presentation Gallery Topics
This is a column chart ppt powerpoint presentation gallery topics. This is a two stage process. The stages in this process are dollars in thousands, product, business, marketing, strategy.
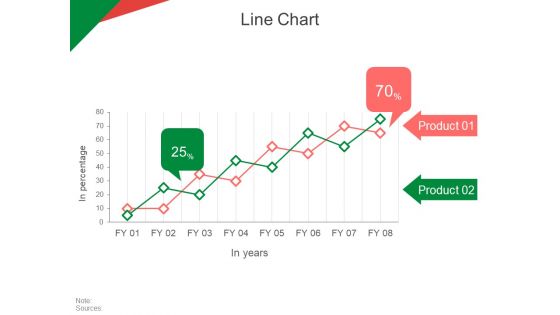
Line Chart Ppt PowerPoint Presentation Professional Smartart
This is a line chart ppt powerpoint presentation professional smartart. This is a two stage process. The stages in this process are in percentage, in years, product, finance, business.
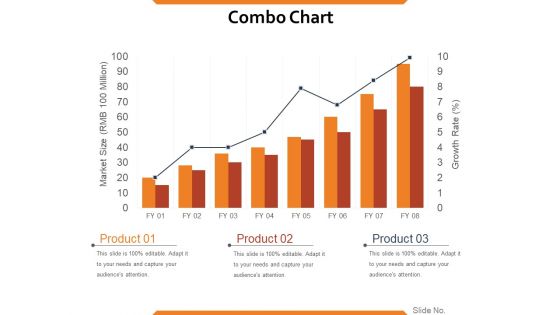
Combo Chart Ppt PowerPoint Presentation Styles Good
This is a combo chart ppt powerpoint presentation styles good. This is a eight stage process. The stages in this process are market size, growth rate, product, growth, strategy, graph, finance.
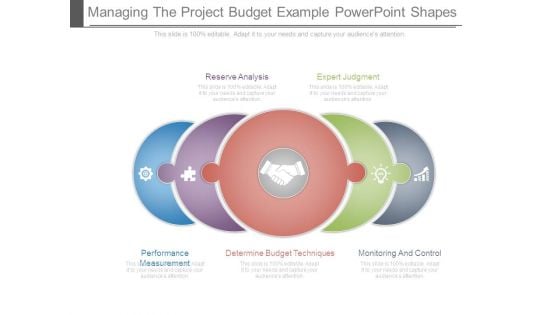
Managing The Project Budget Example Powerpoint Shapes
This is a managing the project budget example powerpoint shapes. This is a five stage process. The stages in this process are reserve analysis, expert judgment, performance measurement, determine budget techniques, monitoring and control.
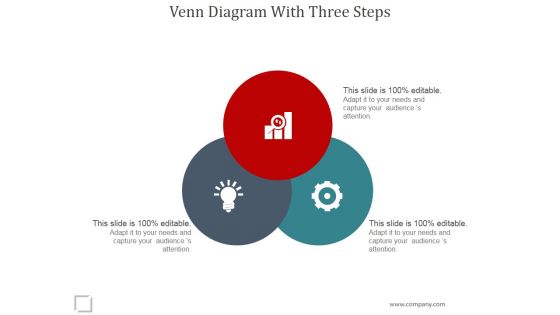
Venn Diagram With Three Steps Ppt PowerPoint Presentation Layout
This is a venn diagram with three steps ppt powerpoint presentation layout. This is a three stage process. The stages in this process are business, marketing, success, venn, management.
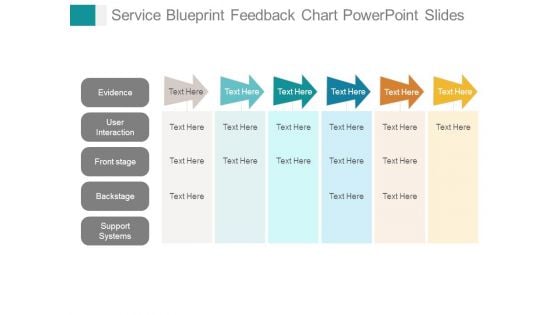
Service Blueprint Feedback Chart Powerpoint Slides
This is a service blueprint feedback chart powerpoint slides. This is a six stage process. The stages in this process are evidence, user interaction, front stage, backstage, support systems.
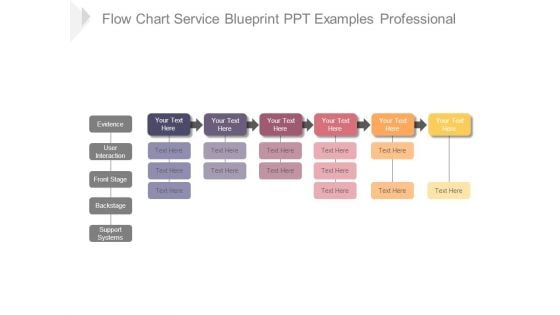
Flow Chart Service Blueprint Ppt Examples Professional
This is a flow chart service blueprint ppt examples professional. This is a six stage process. The stages in this process are evidence, user interaction, front stage, backstage, support systems.
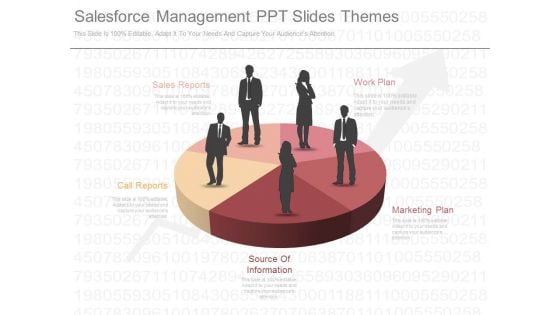
Salesforce Management Ppt Slides Themes
This is a salesforce management ppt slides themes. This is a five stage process. The stages in this process are sales reports, work plan, marketing plan, source of information, call reports.
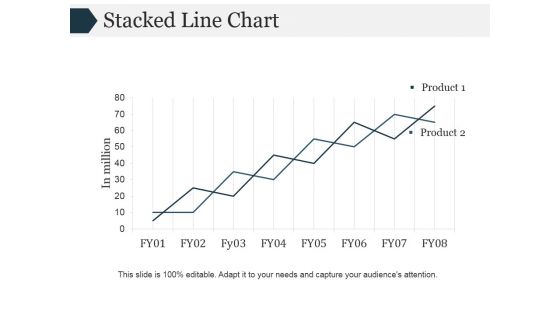
Stacked Line Chart Ppt PowerPoint Presentation Inspiration
This is a stacked line chart ppt powerpoint presentation inspiration. This is a two stage process. The stages in this process are stacked line chart, growth, analysis, management, business.
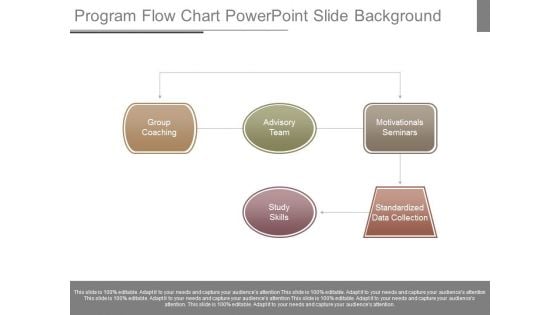
Program Flow Chart Powerpoint Slide Background
This is a program flow chart powerpoint slide background. This is a five stage process. The stages in this process are group coaching, advisory team, study skills, motivationals seminars, standardized data collection.
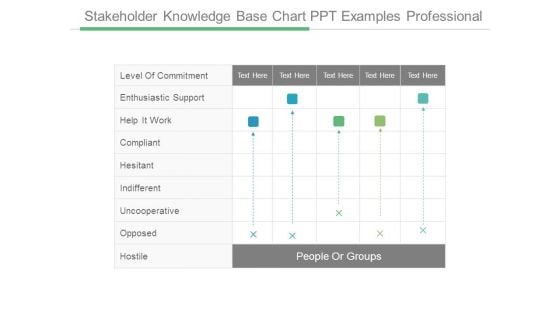
Stakeholder Knowledge Base Chart Ppt Examples Professional
This is a stakeholder knowledge base chart ppt examples professional. This is a five stage process. The stages in this process are people or groups, level of commitment, enthusiastic support, help it work, compliant, hesitant, indifferent, uncooperative, opposed, hostile.
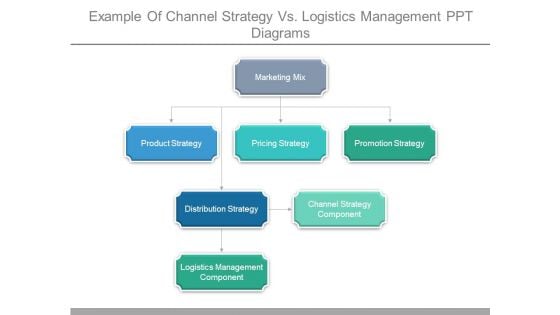
Example Of Channel Strategy Vs Logistics Management Ppt Diagrams
This is a example of channel strategy vs logistics management ppt diagrams. This is a four stage process. The stages in this process are marketing mix, product strategy, pricing strategy, promotion strategy, distribution strategy, channel strategy component, logistics management component.
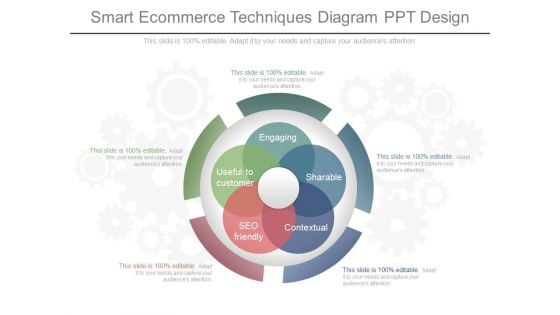
Smart Ecommerce Techniques Diagram Ppt Design
This is a smart ecommerce techniques diagram ppt design. This is a six stage process. The stages in this process are engaging, useful to customer, sharable, contextual, seo friendly.\n\n\n\n
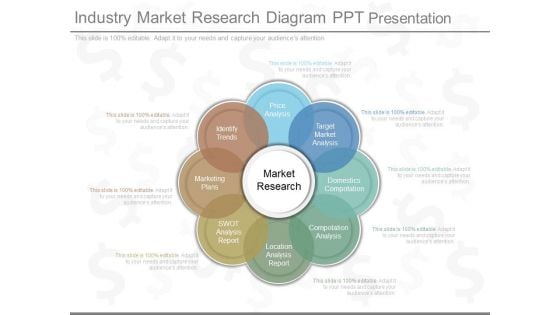
Industry Market Research Diagram Ppt Presentation
This is a industry market research diagram ppt presentation. This is a eight stage process. The stages in this process are market research, price analysis, identify trends, marketing plans, swot analysis report, location analysis report, compotation analysis, target market analysis.\n\n\n\n\n\n\n\n
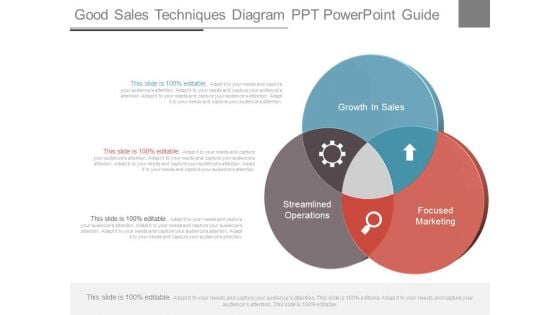
Good Sales Techniques Diagram Ppt Powerpoint Guide
This is a good sales techniques diagram ppt powerpoint guide. This is a three stage process. The stages in this process are growth in sales, streamlined operations, focused marketing.\n\n
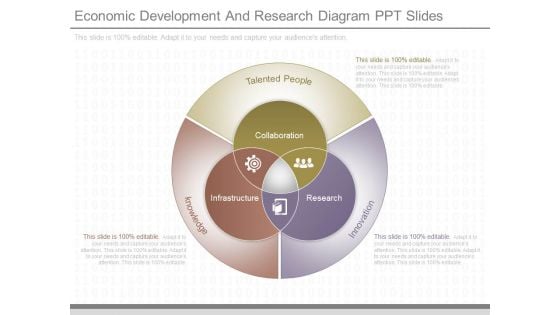
Economic Development And Research Diagram Ppt Slides
This is a economic development and research diagram ppt slides. This is a three stage process. The stages in this process are talented people, knowledge, innovation, collaboration, infrastructure, research.
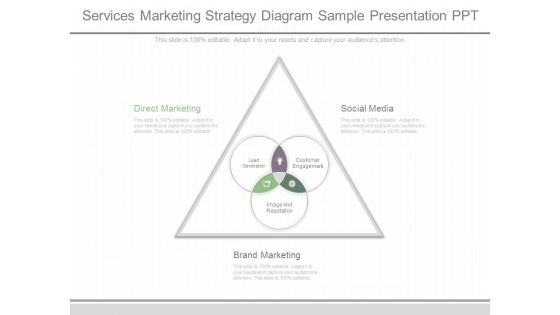
Services Marketing Strategy Diagram Sample Presentation Ppt
This is a services marketing strategy diagram sample presentation ppt. This is a three stage process. The stages in this process are direct marketing, social media, brand marketing, lead generation, customer engagement, image and reputation.
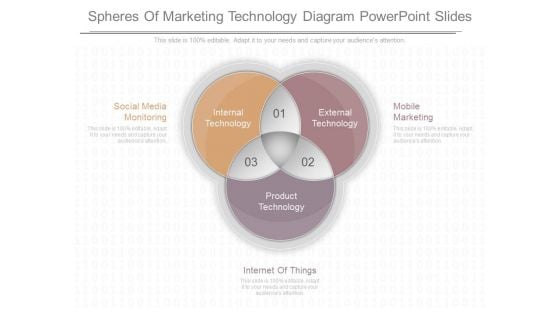
Spheres Of Marketing Technology Diagram Powerpoint Slides
This is a spheres of marketing technology diagram powerpoint slides. This is a three stage process. The stages in this process are social media monitoring, internal technology, external technology, mobile marketing, product technology, internet of things.
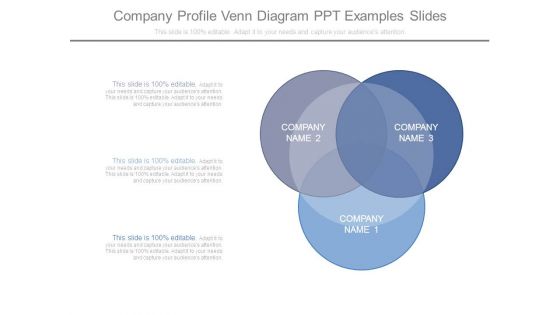
Company Profile Venn Diagram Ppt Examples Slides
This is a company profile venn diagram ppt examples slides. This is a three stage process. The stages in this process are company name 2, company name 3, company name 1.
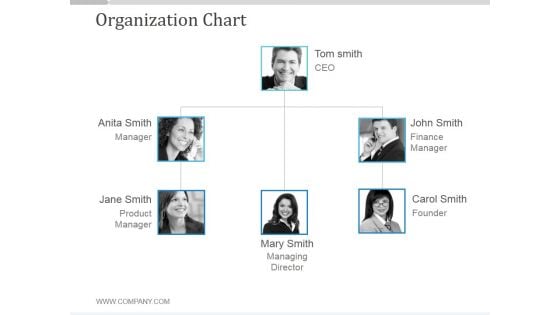
Organization Chart Ppt PowerPoint Presentation Backgrounds
This is a organization chart ppt powerpoint presentation backgrounds. This is a three stage process. The stages in this process are tom smith ceo, john smith finance manager, john smith finance manager, john smit finance manager.
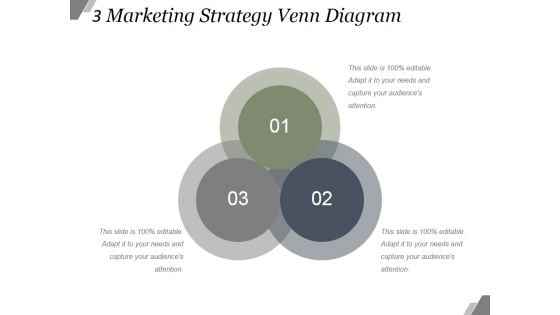
3 Marketing Strategy Venn Diagram Ppt PowerPoint Presentation Sample
This is a 3 marketing strategy venn diagram ppt powerpoint presentation sample. This is a three stage process. The stages in this process are business, venn diagram, marketing, strategy, success.
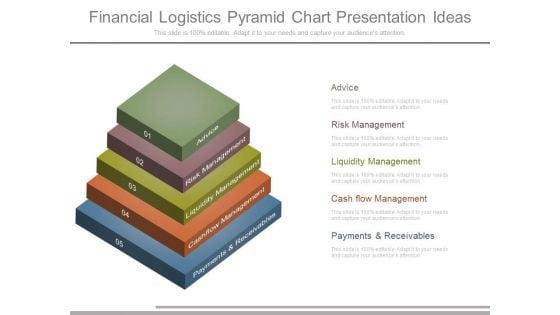
Financial Logistics Pyramid Chart Presentation Ideas
This is a financial logistics pyramid chart presentation ideas. This is a five stage process. The stages in this process are advice, risk management, liquidity management, cash flow management, payments and receivables.
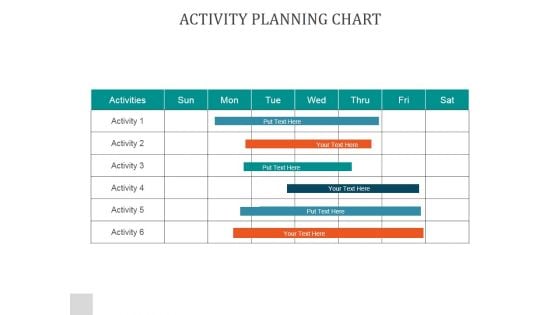
Activity Planning Chart Ppt PowerPoint Presentation Designs
This is a activity planning chart ppt powerpoint presentation designs. This is a seven stage process. The stages in this process are sun, mon, tue, wed, thru, fri, sat.
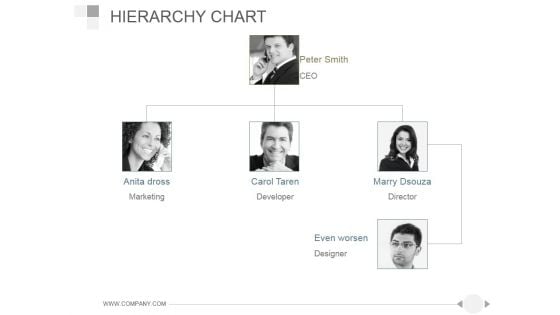
Hierarchy Chart Ppt PowerPoint Presentation Ideas
This is a hierarchy chart ppt powerpoint presentation ideas. This is a three stage process. The stages in this process are peter smith, anita dross, carol taren, marry dsouza, even worsen.
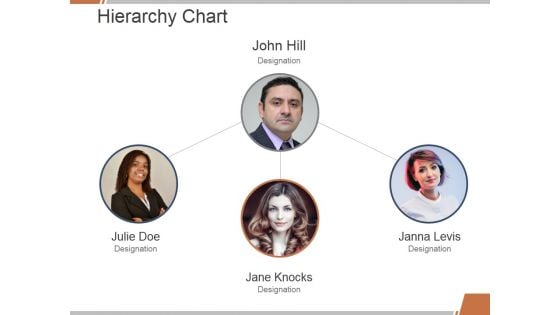
Hierarchy Chart Ppt PowerPoint Presentation Summary Deck
This is a hierarchy chart ppt powerpoint presentation summary deck. This is a three stage process. The stages in this process are john hill, julie doe, jane knocks, janna levis.
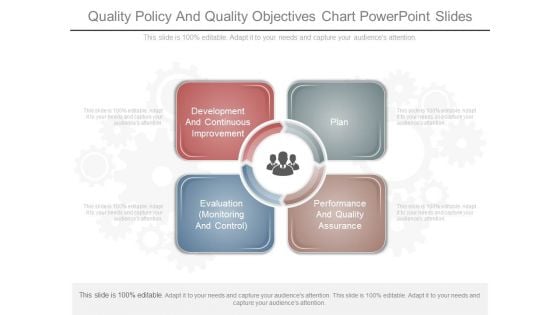
Quality Policy And Quality Objectives Chart Powerpoint Slides
This is a quality policy and quality objectives chart powerpoint slides. This is a four stage process. The stages in this process are development and continuous improvement, plan, evaluation monitoring and control, performance and quality assurance.
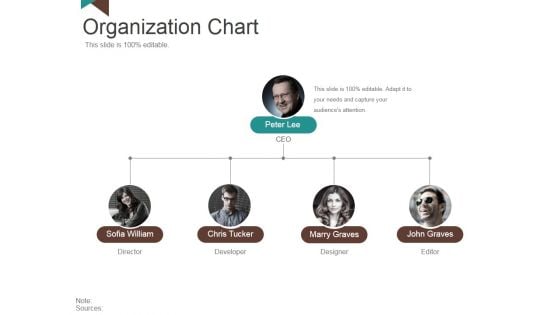
Organization Chart Ppt PowerPoint Presentation Styles Outfit
This is a organization chart ppt powerpoint presentation styles outfit. This is a four stage process. The stages in this process are peter lee, sofia william, chris tucker, marry graves, john graves.
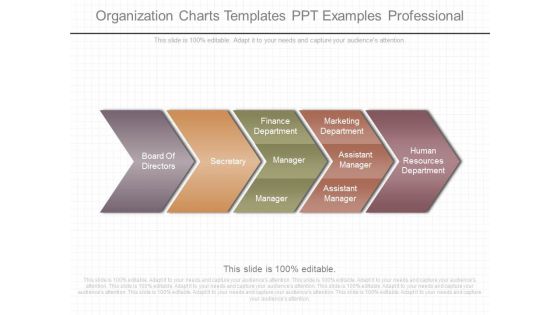
Organization Charts Templates Ppt Examples Professional
This is a organization charts templates ppt examples professional. This is a five stage process. The stages in this process are board of directors, secretary, finance department, manager, marketing department, assistant manager, human resources department.
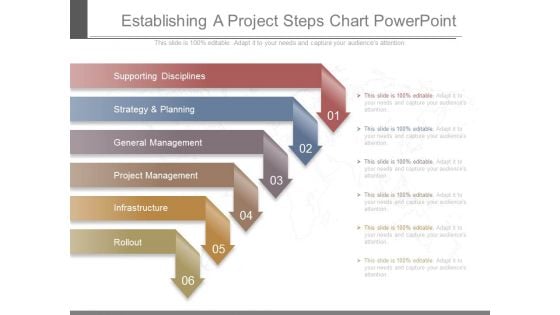
Establishing A Project Steps Chart Powerpoint
This is a establishing a project steps chart powerpoint. This is a six stage process. The stages in this process are supporting disciplines, strategy and planning, general management, project management, infrastructure, rollout.
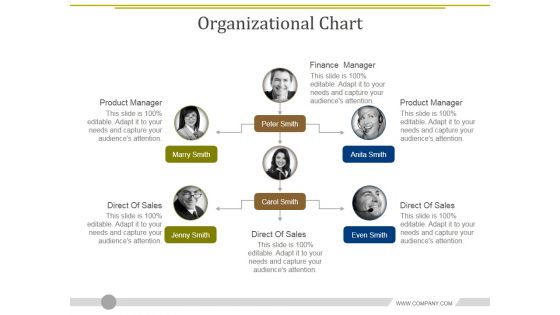
Organizational Chart Ppt PowerPoint Presentation Layouts Demonstration
This is a organizational chart ppt powerpoint presentation layouts demonstration. This is a six stage process. The stages in this process are finance manager, product manager, direct of sales, direct of sales, direct of sales.
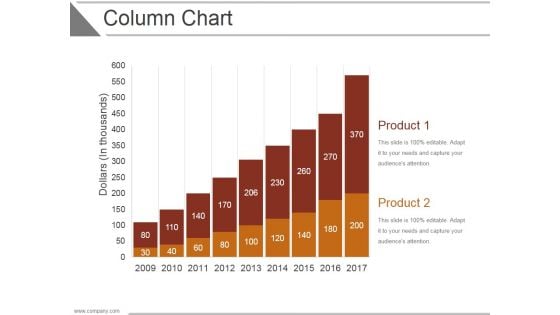
Column Chart Ppt PowerPoint Presentation Designs
This is a column chart ppt powerpoint presentation designs. This is a two stage process. The stages in this process are business, strategy, analysis, marketing, chart and graph, growth.
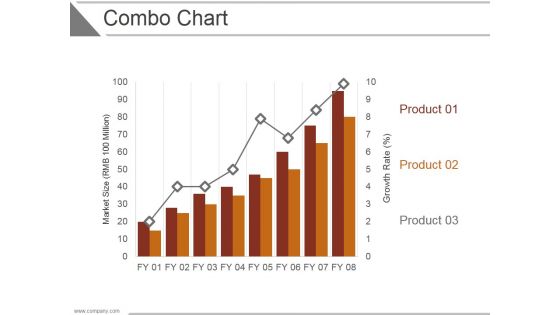
Combo Chart Ppt PowerPoint Presentation Examples
This is a combo chart ppt powerpoint presentation examples. This is a three stage process. The stages in this process are business, strategy, analysis, marketing, chart and graph, growth.
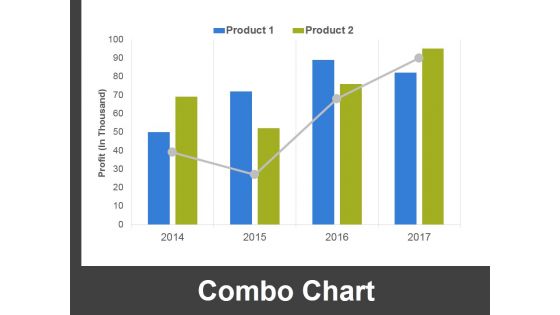
Combo Chart Ppt PowerPoint Presentation Ideas Outfit
This is a combo chart ppt powerpoint presentation ideas outfit. This is a four stage process. The stages in this process are combo chart, finance, analysis, marketing, strategy, business.
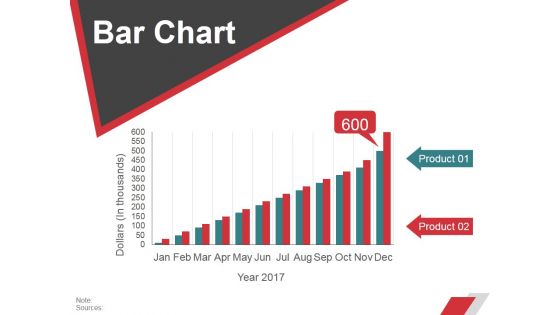
Bar Chart Ppt PowerPoint Presentation Layouts Visuals
This is a bar chart ppt powerpoint presentation layouts visuals. This is a two stage process. The stages in this process are business, strategy, marketing, planning, chart and graph.
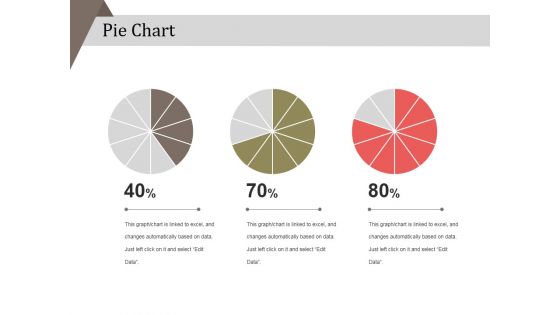
Pie Chart Ppt PowerPoint Presentation Layouts Example
This is a pie chart ppt powerpoint presentation layouts example. This is a three stage process. The stages in this process are business, strategy, analysis, pie chart, finance, marketing.
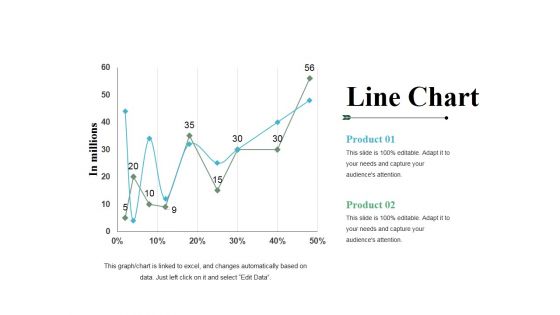
Line Chart Ppt PowerPoint Presentation File Templates
This is a line chart ppt powerpoint presentation file templates. This is a two stage process. The stages in this process are product, line chart, growth, percentage, in millions.
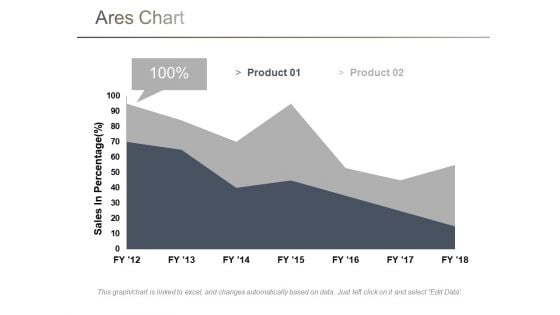
Area Chart Ppt PowerPoint Presentation Model Influencers
This is a area chart ppt powerpoint presentation model influencers. This is a two stage process. The stages in this process are sales in percentage, chart, business, marketing, finance.
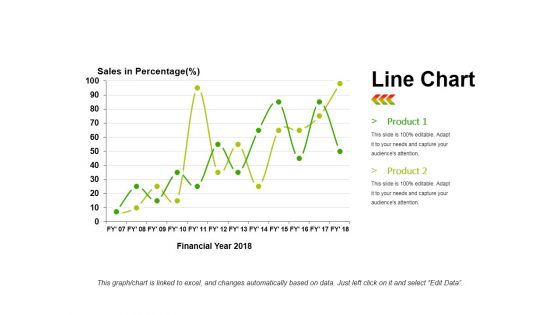
Line Chart Ppt PowerPoint Presentation Infographics Infographics
This is a line chart ppt powerpoint presentation infographics infographics. This is a two stage process. The stages in this process are product, sales in percentage, financial year, line chart, finance.

 Home
Home