Process Icon
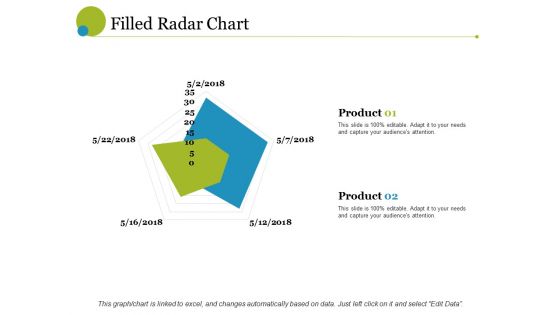
filled radar chart ppt powerpoint presentation ideas brochure
This is a filled radar chart ppt powerpoint presentation ideas brochure. This is a two stage process. The stages in this process are radar chart, finance, analysis, business, marketing, strategy.
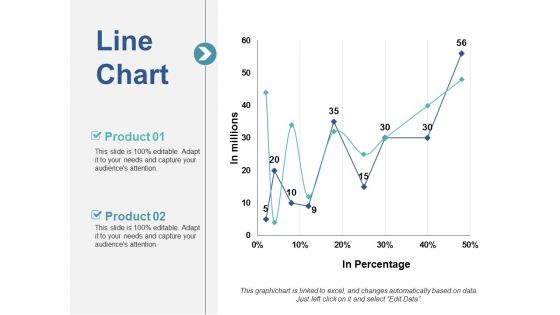
Line Chart Ppt PowerPoint Presentation Slides Clipart Images
This is a line chart ppt powerpoint presentation slides clipart images. This is a two stage process. The stages in this process are line chart, marketing, strategy, planning, finance.
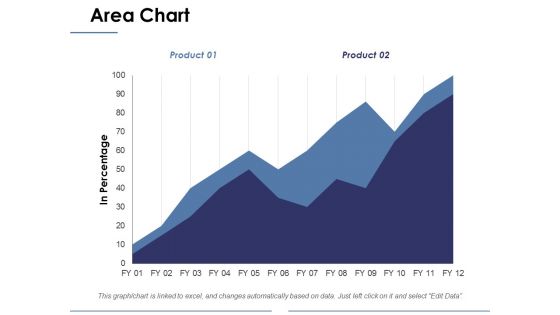
Area Chart Ppt PowerPoint Presentation Layouts Background Designs
This is a area chart ppt powerpoint presentation layouts background designs. This is a two stage process. The stages in this process are business, marketing, in percentage, area chart, finance.
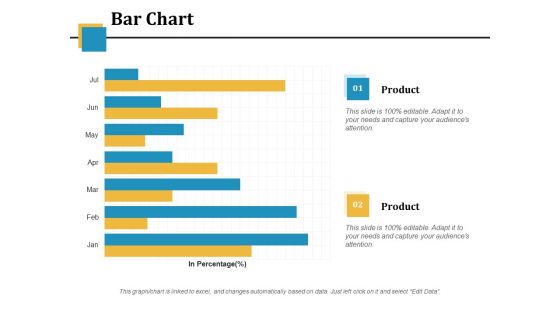
Bar Chart Ppt PowerPoint Presentation Infographic Template Picture
This is a bar chart ppt powerpoint presentation infographic template picture. This is a two stage process. The stages in this process are financial, in percentage, business, marketing, bar chart.
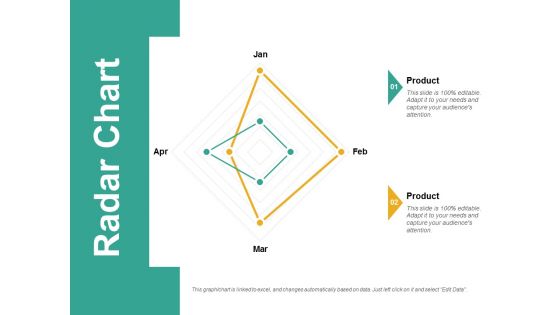
Radar Chart Ppt PowerPoint Presentation Visual Aids Professional
This is a radar chart ppt powerpoint presentation visual aids professional. This is a two stage process. The stages in this process are radar chart, finance, marketing, strategy, business.

Area Chart Ppt PowerPoint Presentation Styles Design Templates
This is a area chart ppt powerpoint presentation styles design templates. This is a two stage process. The stages in this process are area chart, analysis, business, marketing, strategy.

Combo Chart Ppt PowerPoint Presentation Inspiration Slide Download
This is a combo chart ppt powerpoint presentation inspiration slide download. This is a two stage process. The stages in this process are Combo chart, finance, marketing, strategy, analysis.
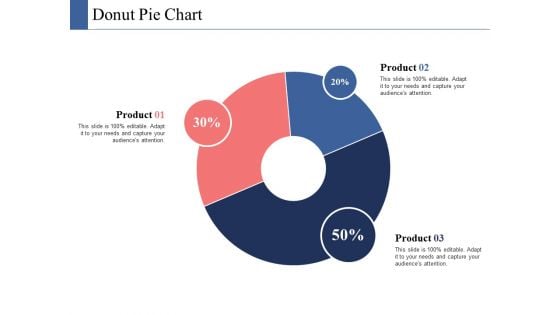
Donut Pie Chart Ppt PowerPoint Presentation Infographics Ideas
This is a donut pie chart ppt powerpoint presentation infographics ideas. This is a three stage process. The stages in this process are donut pie chart, finance, marketing, strategy, analysis.
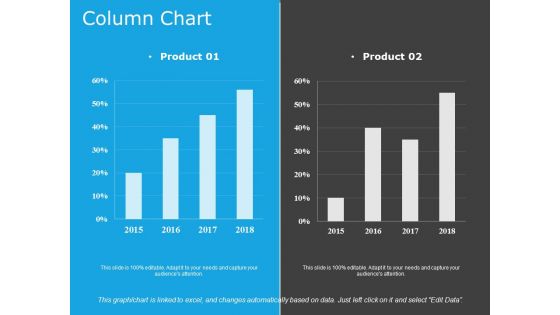
Column Chart Template 1 Ppt PowerPoint Presentation Portfolio Format
This is a column chart template 1 ppt powerpoint presentation portfolio format. This is a two stage process. The stages in this process are column chart, finance, marketing, strategy, business.
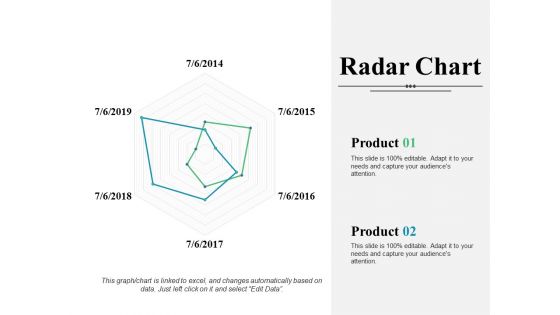
Radar Chart Ppt PowerPoint Presentation Infographic Template Introduction
This is a radar chart ppt powerpoint presentation infographic template introduction. This is a two stage process. The stages in this process are radar chart, finance, marketing, strategy, analysis, business.
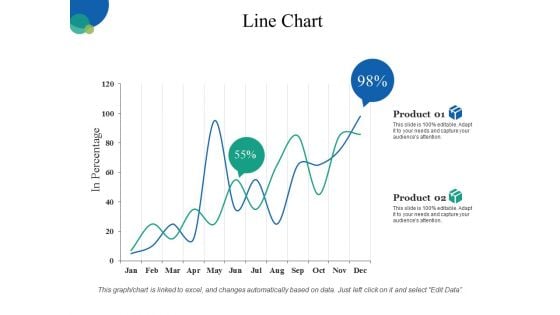
Line Chart Ppt PowerPoint Presentation Gallery Clipart Images
This is a line chart ppt powerpoint presentation gallery clipart images. This is a two stage process. The stages in this process are business, line chart, finance, marketing, strategy.

Area Chart Ppt PowerPoint Presentation Infographic Template Designs
This is a area chart ppt powerpoint presentation infographic template designs. This is a two stage process. The stages in this process are area chart, finance, marketing, strategy, business.
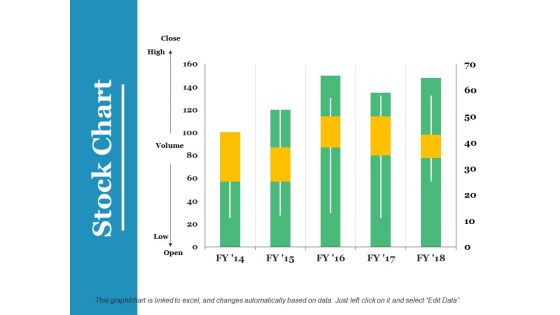
Stock Chart Ppt PowerPoint Presentation Infographics Graphics Example
This is a stock chart ppt powerpoint presentation infographics graphics example. This is a five stage process. The stages in this process are stock chart, finance, business, planning, marketing.

Area Chart Finance Ppt PowerPoint Presentation Infographics Layouts
This is a area chart finance ppt powerpoint presentation infographics layouts. This is a one stages process. The stages in this process are area chart, financial, marketing, planning, business.
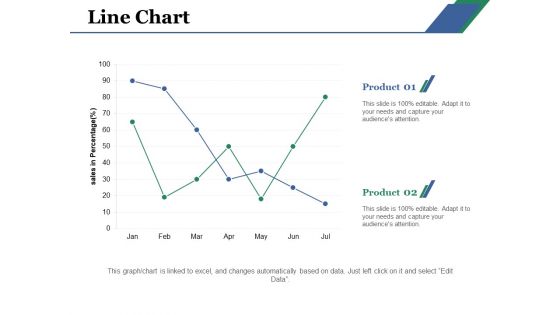
Line Chart Ppt PowerPoint Presentation Layouts Example File
This is a line chart ppt powerpoint presentation layouts example file. This is a two stage process. The stages in this process are line chart, product, business, sales, analysis.
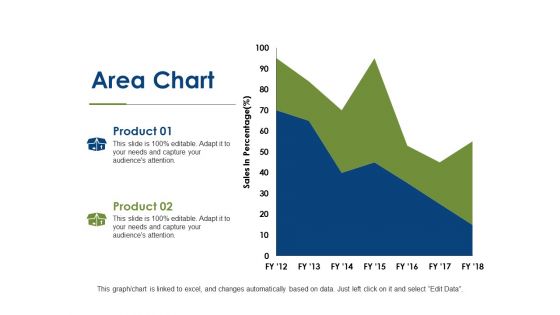
Area Chart Finance Ppt PowerPoint Presentation Show Visual Aids
This is a area chart finance ppt powerpoint presentation show visual aids. This is a two stage process. The stages in this process are area chart, business, finance, investment, strategy.
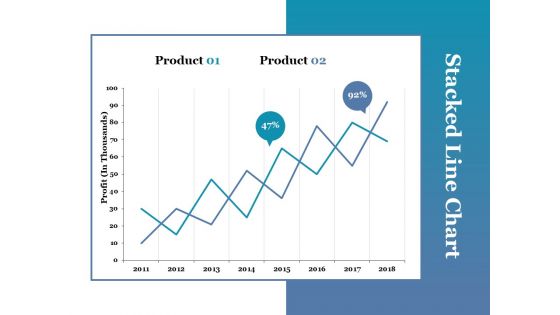
Stacked Line Chart Ppt PowerPoint Presentation Portfolio Picture
This is a stacked line chart ppt powerpoint presentation portfolio picture. This is a two stage process. The stages in this process are stacked line chart, product, profit, growth.
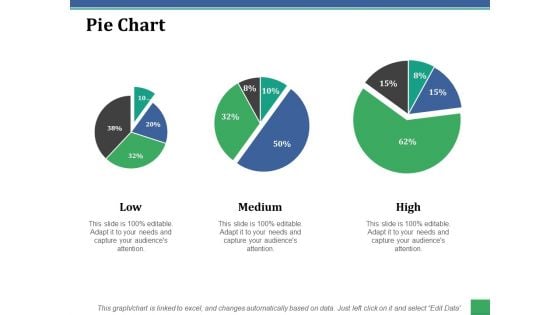
Pie Chart Ppt PowerPoint Presentation File Graphics Download
This is a pie chart ppt powerpoint presentation file graphics download. This is a three stage process. The stages in this process are low, medium, high, pie chart, finance.
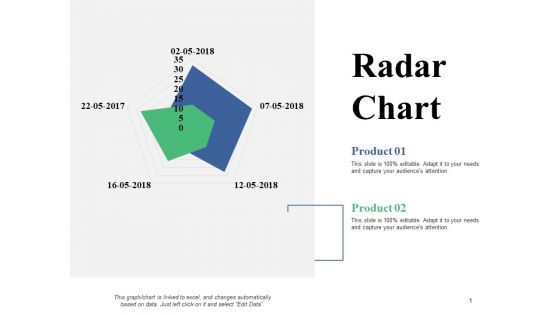
Radar Chart Ppt PowerPoint Presentation Slides Graphics Tutorials
This is a radar chart ppt powerpoint presentation slides graphics tutorials. This is a two stage process. The stages in this process are radar chart, finance, marketing, planning, business.
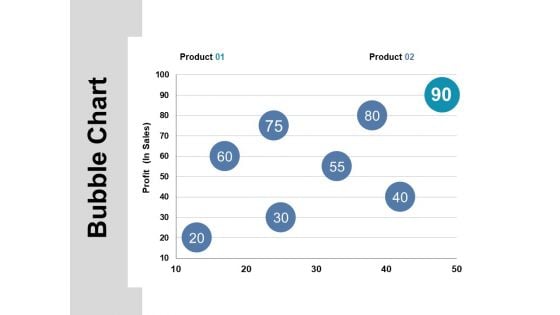
Bubble Chart Ppt PowerPoint Presentation Inspiration Master Slide
This is a bubble chart ppt powerpoint presentation inspiration master slide. This is a two stage process. The stages in this process are bubble chart, finance, planning, marketing, strategy.
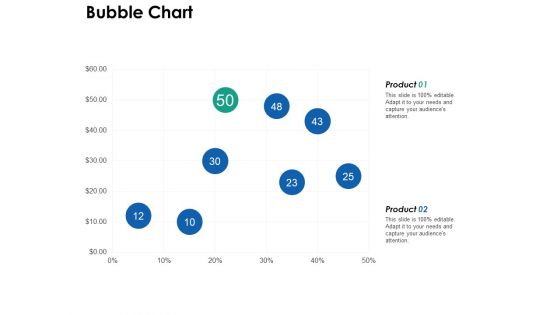
Bubble Chart Finance Ppt PowerPoint Presentation File Maker
This is a bubble chart finance ppt powerpoint presentation file maker. This is a two stage process. The stages in this process are bubble chart, finance, business, planning, marketing.
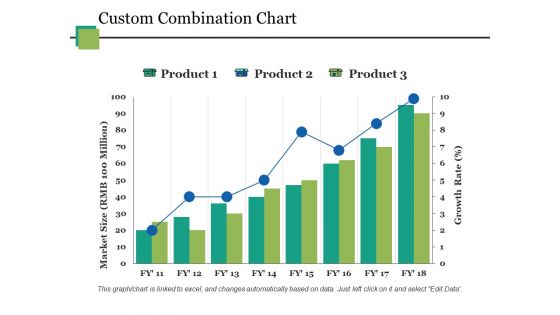
Custom Combination Chart Ppt PowerPoint Presentation Styles Good
This is a custom combination chart ppt powerpoint presentation styles good. This is a three stage process. The stages in this process are custom combination chart, finance, business, planning, marketing.
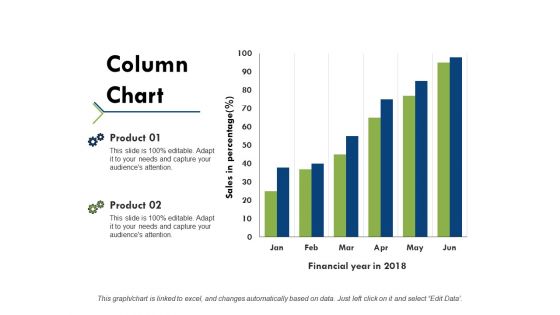
Column Chart Ppt PowerPoint Presentation Portfolio Example Topics
This is a column chart ppt powerpoint presentation portfolio example topics. This is a two stage process. The stages in this process are product, financial year, sales in percentage, column chart.
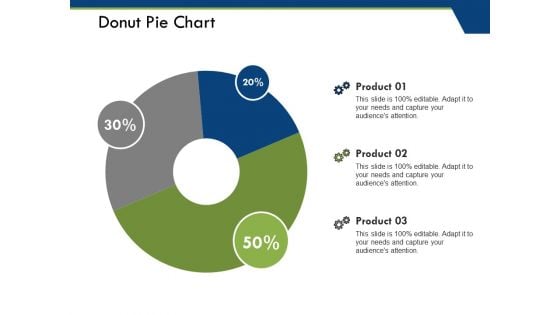
Donut Pie Chart Ppt PowerPoint Presentation Pictures File Formats
This is a donut pie chart ppt powerpoint presentation pictures file formats. This is a three stage process. The stages in this process are product, donut pie chart, percentage, business, marketing.
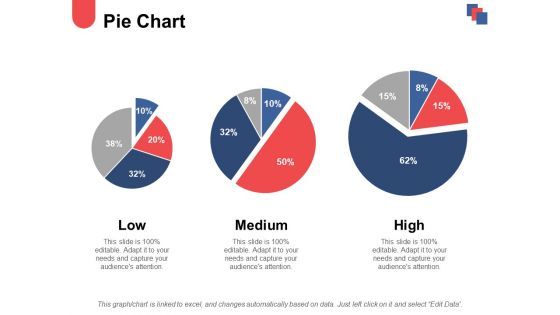
Pie Chart And Finance Ppt PowerPoint Presentation Ideas Demonstration
This is a pie chart and finance ppt powerpoint presentation ideas demonstration. This is a three stage process. The stages in this process are low, medium, high, pie chart, finance.
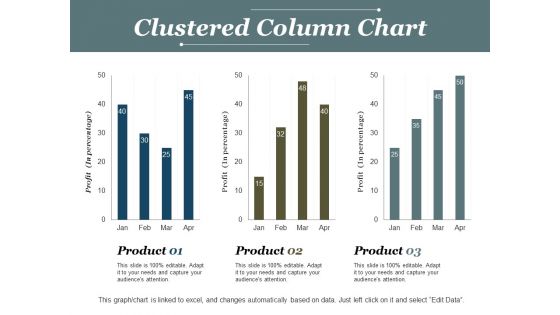
Clustered Column Chart Ppt PowerPoint Presentation Model Deck
This is a clustered column chart ppt powerpoint presentation model deck. This is a three stage process. The stages in this process are clustered column chart, product, finance, profit, business.
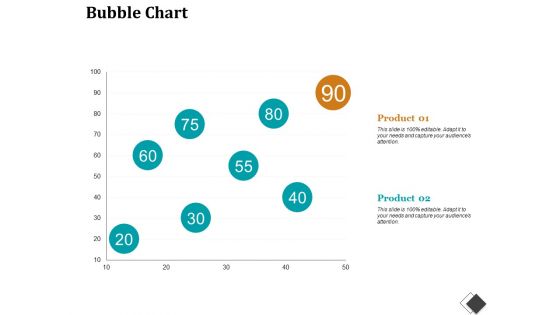
Bubble Chart Enterprise Model Canvas Ppt PowerPoint Presentation File Structure
This is a bubble chart enterprise model canvas ppt powerpoint presentation file structure. This is a two stage process. The stages in this process are bubble chart, finance, marketing, strategy, analysis, investment.
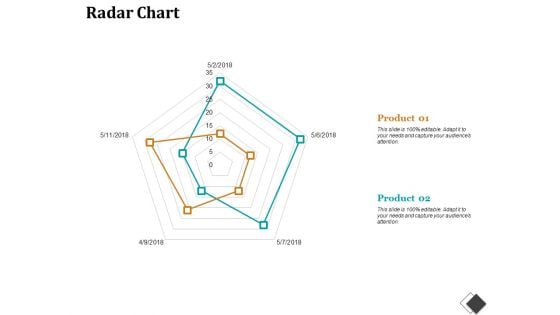
Radar Chart Enterprise Model Canvas Ppt PowerPoint Presentation File Slides
This is a radar chart enterprise model canvas ppt powerpoint presentation file slides. This is a two stage process. The stages in this process are radar chart, finance, marketing, strategy, business.
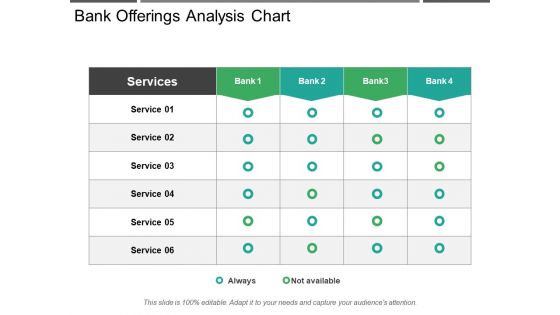
Bank Offerings Analysis Chart Ppt PowerPoint Presentation Slides Show
This is a bank offerings analysis chart ppt powerpoint presentation slides show. This is a five stage process. The stages in this process are comparison chart, comparison table, comparison matrix.
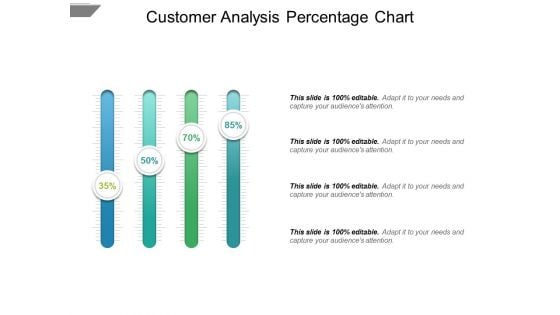
Customer Analysis Percentage Chart Ppt PowerPoint Presentation Infographics Master Slide
This is a customer analysis percentage chart ppt powerpoint presentation infographics master slide. This is a four stage process. The stages in this process are comparison chart, comparison table, comparison matrix.
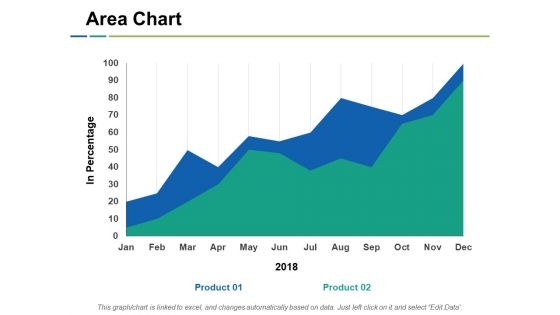
Area Chart Ppt PowerPoint Presentation Model Slide Portrait
This is a area chart ppt powerpoint presentation model slide portrait. This is a two stage process. The stages in this process are area chart, financial, business, marketing, planning, strategy.
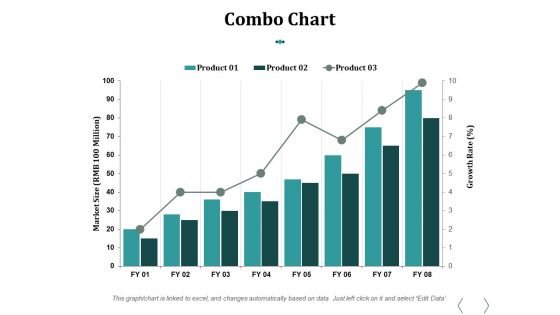
Combo Chart Ppt PowerPoint Presentation Summary Graphic Images
This is a combo chart ppt powerpoint presentation summary graphic images. This is a three stage process. The stages in this process are combo chart, product, growth, marketing, business.
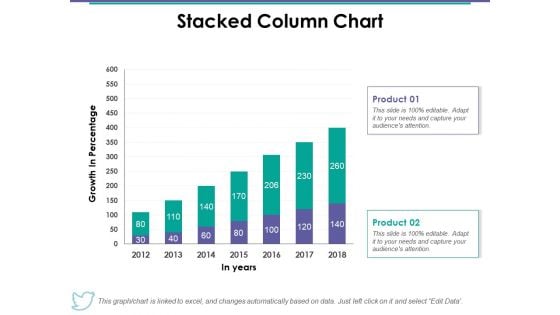
Stacked Column Chart Ppt PowerPoint Presentation Summary Gallery
This is a stacked column chart ppt powerpoint presentation summary gallery. This is a two stage process. The stages in this process are stacked column chart, product, in years, growth, percentage.
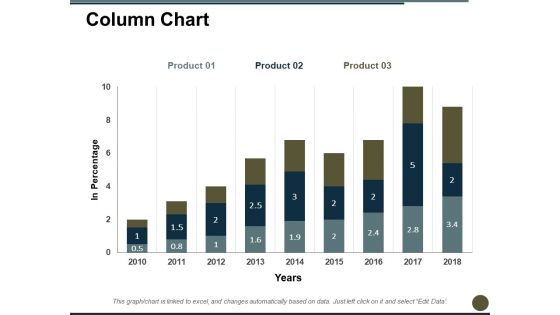
Column Chart Ppt PowerPoint Presentation Layouts File Formats
This is a column chart ppt powerpoint presentation layouts file formats. This is a three stage process. The stages in this process are column chart, product, in percentage, year, finance.
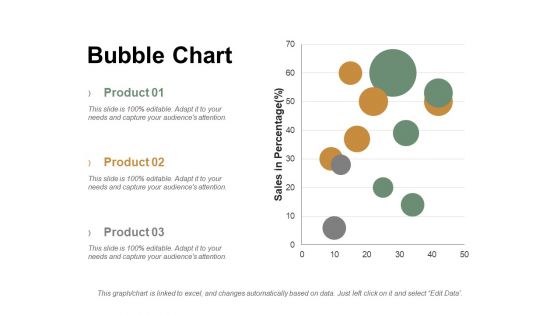
Bubble Chart Ppt PowerPoint Presentation Summary Graphics Tutorials
This is a bubble chart ppt powerpoint presentation summary graphics tutorials. This is a three stage process. The stages in this process are product, sales in percentage, bubble chart.
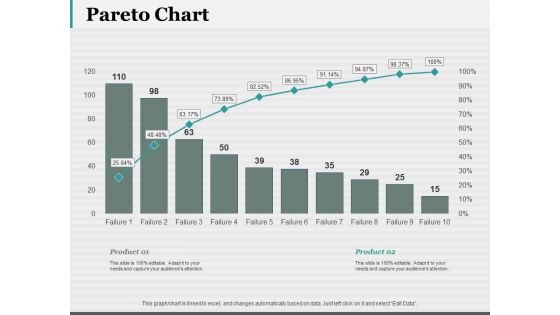
Pareto Chart Ppt PowerPoint Presentation Visual Aids Pictures
This is a pareto chart ppt powerpoint presentation visual aids pictures. This is a two stage process. The stages in this process are pareto chart, finance, marketing, strategy, business.

Bubble Chart Analysis Ppt PowerPoint Presentation Gallery Introduction
This is a bubble chart analysis ppt powerpoint presentation gallery introduction. This is a two stage process. The stages in this process are bubble chart, finance, marketing, strategy, business.
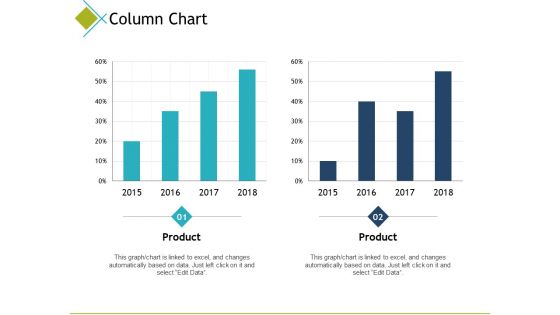
Column Chart Finance Ppt PowerPoint Presentation Model Examples
This is a column chart finance ppt powerpoint presentation model examples. This is a two stage process. The stages in this process are column chart, finance, marketing, analysis, investment.
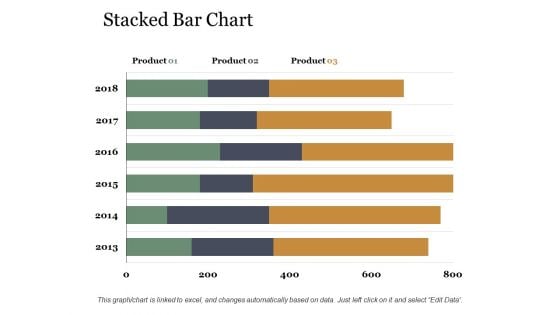
Stacked Bar Chart Ppt PowerPoint Presentation Portfolio Templates
This is a stacked bar chart ppt powerpoint presentation portfolio templates. This is a three stage process. The stages in this process are stacked bar chart, product, year, business, finance.
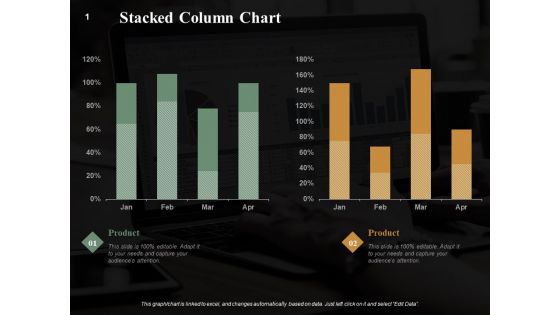
Stacked Column Chart Finance Ppt PowerPoint Presentation Summary Graphics Example
This is a stacked column chart finance ppt powerpoint presentation summary graphics example. This is a two stage process. The stages in this process are stacked column chart, marketing, analysis, business, investment.
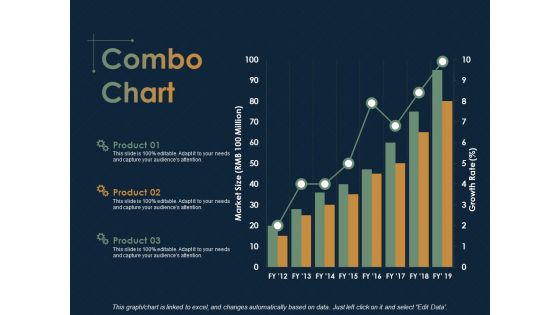
Combo Chart Finance Ppt PowerPoint Presentation Ideas Microsoft
This is a combo chart finance ppt powerpoint presentation ideas microsoft. This is a three stage process. The stages in this process are combo chart, Finance, Analysis, Business, Investment.

Area Chart Investment Ppt PowerPoint Presentation Styles Topics
This is a area chart investment ppt powerpoint presentation styles topics. This is a three stage process. The stages in this process are area chart, finance, marketing, analysis, investment.

Clustered Bar Financial Chart Ppt PowerPoint Presentation File Design Ideas
This is a clustered bar financial chart ppt powerpoint presentation file design ideas. This is a three stage process. The stages in this process are column chart, financial, business, marketing, planning, strategy.
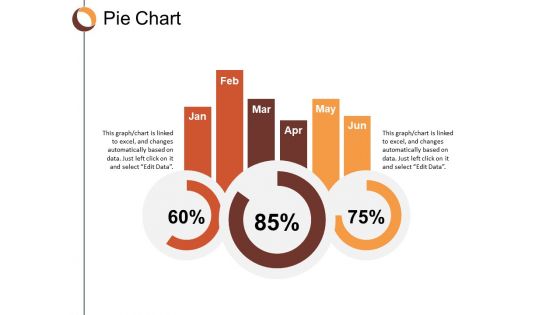
Pie Chart Finance Ppt Powerpoint Presentation Infographic Template Clipart
This is a pie chart finance ppt powerpoint presentation infographic template clipart. This is a three stage process. The stages in this process are pie chart, finance, marketing, business, analysis.
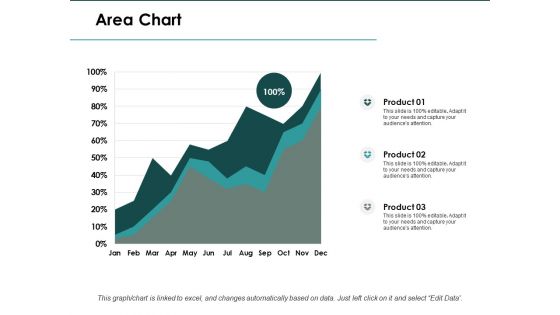
Area Chart Finance Ppt PowerPoint Presentation Infographics Slide
This is a area chart finance ppt powerpoint presentation infographics slide. This is a three stage process. The stages in this process are area chart, finance, marketing, analysis, investment.
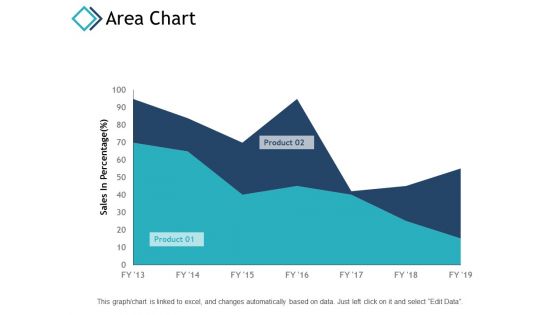
Area Chart Marketing Planning Ppt PowerPoint Presentation Ideas Maker
This is a area chart marketing planning ppt powerpoint presentation ideas maker. This is a two stage process. The stages in this process are area chart, finance, marketing, analysis, investment.
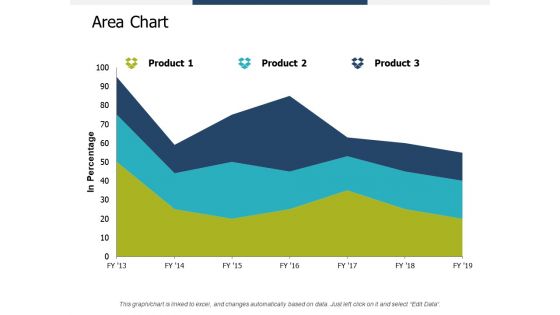
Area Chart Finance Marketing Ppt PowerPoint Presentation Gallery Styles
This is a area chart finance marketing ppt powerpoint presentation gallery styles. This is a three stage process. The stages in this process are area chart, finance, marketing, analysis, investment.
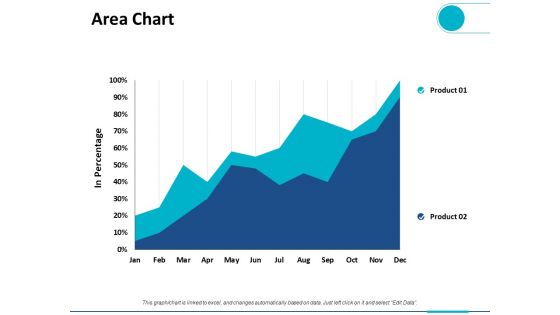
Area Chart Finance Ppt PowerPoint Presentation Pictures Clipart
This is a area chart finance ppt powerpoint presentation pictures clipart. This is a two stage process. The stages in this process are area chart, finance, marketing, analysis, investment.
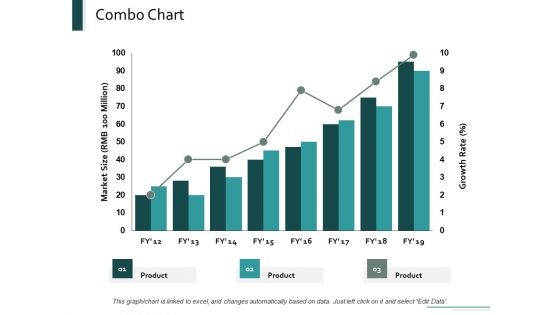
Combo Chart Marketing Ppt Powerpoint Presentation Layouts Designs Download
This is a combo chart marketing ppt powerpoint presentation layouts designs download. This is a three stage process. The stages in this process are combo chart, marketing, growth, product, finance.
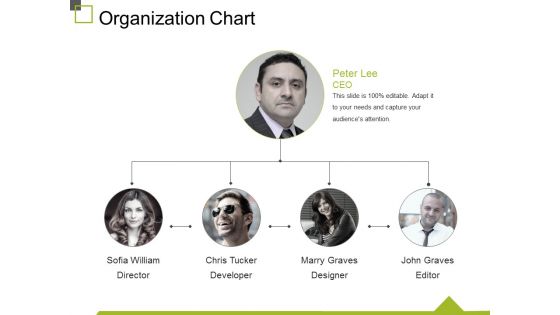
Organization Chart Ppt PowerPoint Presentation File Slide Download
This is a organization chart ppt powerpoint presentation file slide download. This is a four stage process. The stages in this process are sofia william, chris tucker, marry graves, john graves, business.
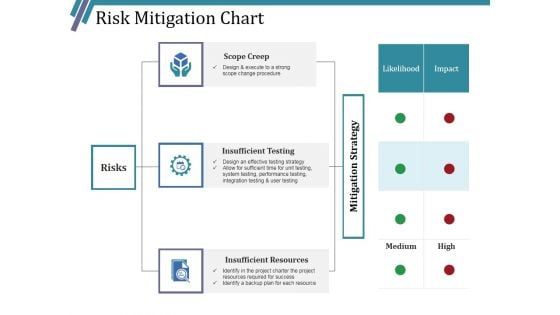
Risk Mitigation Chart Ppt PowerPoint Presentation Infographic Template Layouts
This is a risk mitigation chart ppt powerpoint presentation infographic template layouts. This is a three stage process. The stages in this process are scope creep, insufficient testing, insufficient resources, risks.
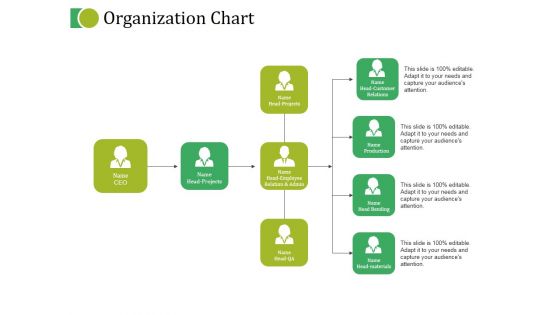
Organization Chart Ppt PowerPoint Presentation Gallery Graphics Pictures
This is a organization chart ppt powerpoint presentation gallery graphics pictures. This is a four stage process. The stages in this process are head customer relations name, production name, head bending name, head employee relation and admin, name head projects.

Business Diagram Education Info Graphics With A Brain Image Presentation Template
This business power point template has been crafted with graphic of octagon. This octagon contains the eight steps for displaying process flow. Use this diagram template in your presentations and display the linear process flow.
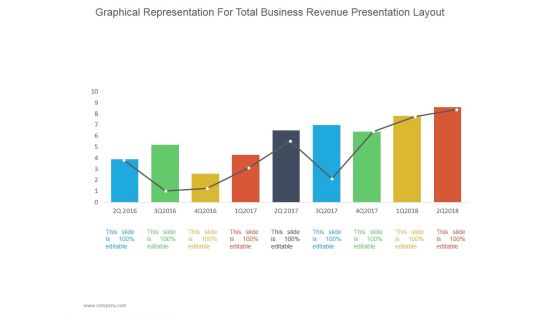
Graphical Representation For Total Business Revenue Ppt PowerPoint Presentation Diagrams
This is a graphical representation for total business revenue ppt powerpoint presentation diagrams. This is a nine stage process. The stages in this process are business, strategy, line chart, bar graph, marketing, management.
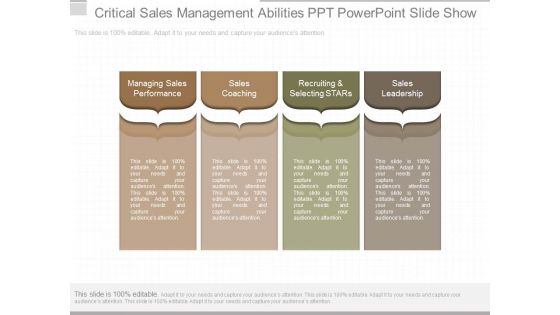
Critical Sales Management Abilities Ppt Powerpoint Slide Show
This is a critical sales management abilities ppt powerpoint slide show. This is a four stage process. The stages in this process are managing sales performance, sales coaching, recruiting and selecting stars, sales leadership.\n\n\n\n\n\n\n\n\n\n\n\n\n\n\n\n
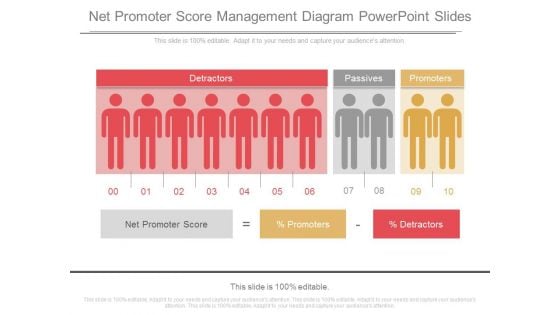
Net Promoter Score Management Diagram Powerpoint Slides
This is a net promoter score management diagram powerpoint slides. This is a ten stage process. The stages in this process are detractors, passives, promoters, net promoter score, promoters, detractors.\n\n
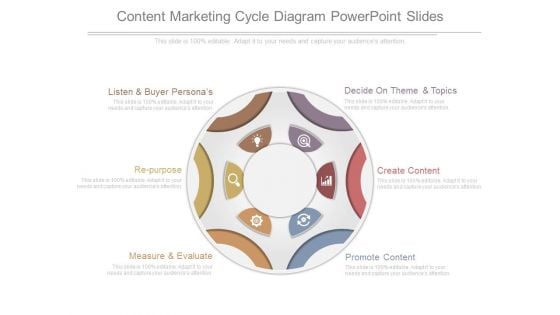
Content Marketing Cycle Diagram Powerpoint Slides
This is a content marketing cycle diagram powerpoint slides. This is a six stage process. The stages in this process are decide on theme and topics, create content, promote content, measure and evaluate, re purpose, listen and buyer personas.
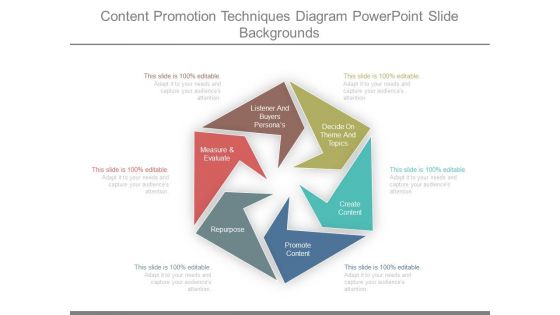
Content Promotion Techniques Diagram Powerpoint Slide Backgrounds
This is a content promotion techniques diagram powerpoint slide backgrounds. This is a six stage process. The stages in this process are listener and buyers personas, decide on theme and topics, create content, promote content, repurpose, measure and evaluate.
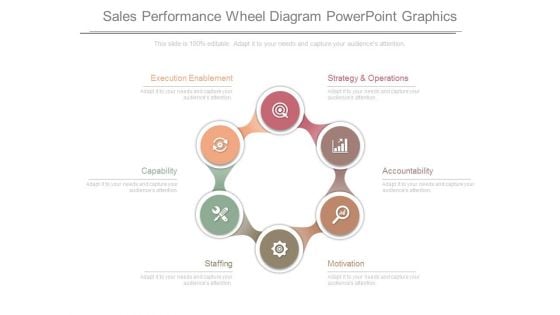
Sales Performance Wheel Diagram Powerpoint Graphics
This is a sales performance wheel diagram powerpoint graphics. This is a six stage process. The stages in this process are strategy and operations, accountability, motivation, staffing, capability, execution enablement.
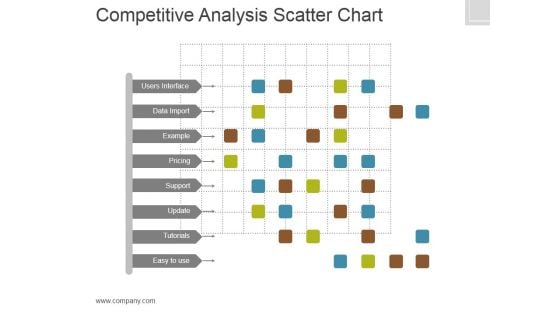
Competitive Analysis Template 6 Scatter Chart Ppt PowerPoint Presentation Slides
This is a competitive analysis template 6 scatter chart ppt powerpoint presentation slides. This is a eight stage process. The stages in this process are users interface, data import, example, pricing, support, update, tutorials, easy to use, table.
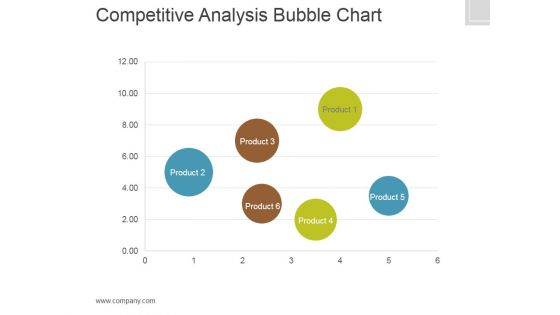
Competitive Analysis Template 7 Bubble Chart Ppt PowerPoint Presentation Deck
This is a competitive analysis template 7 bubble chart ppt powerpoint presentation deck. This is a six stage process. The stages in this process are users interface, data import, example, pricing, support, update, tutorials, easy to use, table.
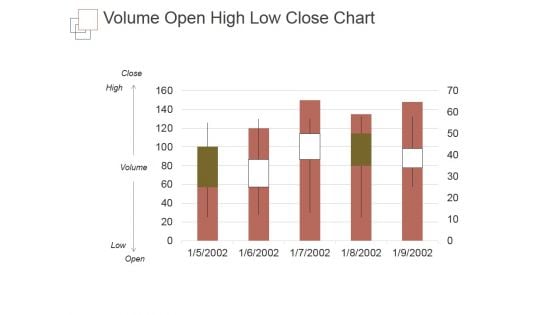
Volume Open High Low Close Chart Ppt PowerPoint Presentation Sample
This is a volume open high low close chart ppt powerpoint presentation sample. This is a five stage process. The stages in this process are close, volume, high, low, open.
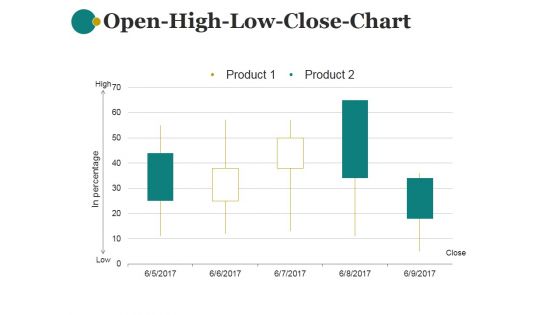
Open High Low Close Chart Ppt PowerPoint Presentation Information
This is a open high low close chart ppt powerpoint presentation information. This is a five stage process. The stages in this process are product, in percentage, close, low, high.
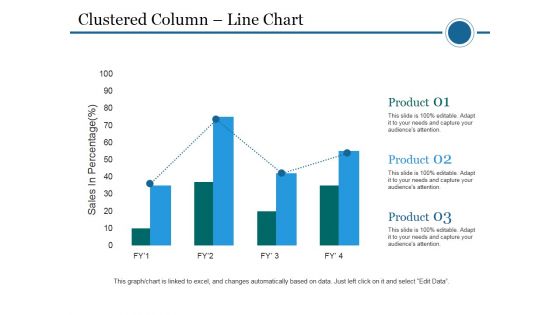
Clustered Column Line Chart Ppt PowerPoint Presentation File Pictures
This is a clustered column line chart ppt powerpoint presentation file pictures. This is a four stage process. The stages in this process are clustered bar, product, planning, business, sales in percentage.
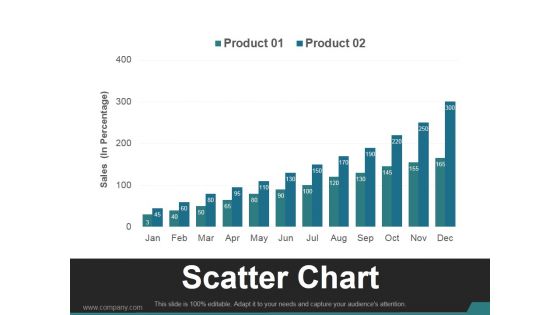
Scatter Chart Template 1 Ppt PowerPoint Presentation Visual Aids
This is a scatter chart template 1 ppt powerpoint presentation visual aids. This is a twelve stage process. The stages in this process are business, marketing, growth, finance, management.
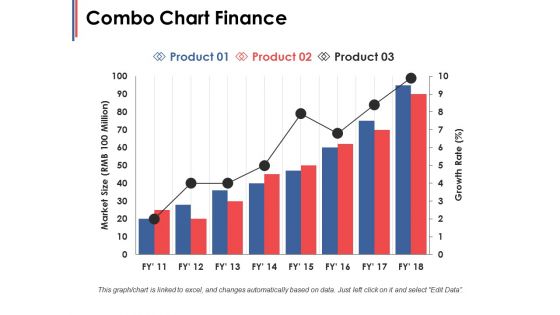
Combo Chart Finance Ppt PowerPoint Presentation Infographic Template Microsoft
This is a combo chart finance ppt powerpoint presentation infographic template microsoft. This is a three stage process. The stages in this process are finance, marketing, management, investment, analysis.
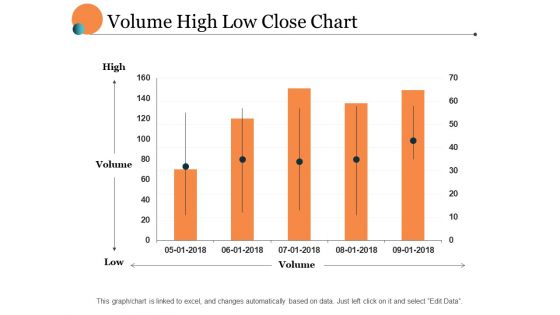
Volume High Low Close Chart Ppt PowerPoint Presentation Portfolio Layout
This is a volume high low close chart ppt powerpoint presentation portfolio layout. This is a five stage process. The stages in this process are finance, marketing, management, investment, analysis.
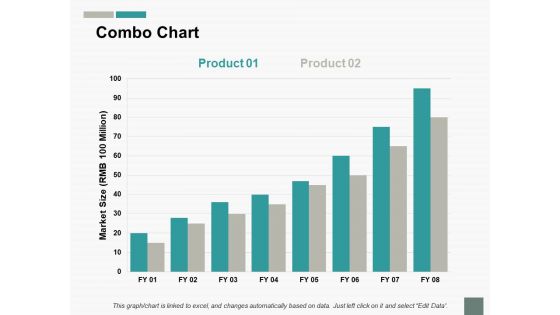
Combo Chart Finance Ppt PowerPoint Presentation Infographic Template Graphics
This is a combo chart finance ppt powerpoint presentation infographic template graphics. This is a two stage process. The stages in this process are growth, finance, marketing, management, investment.
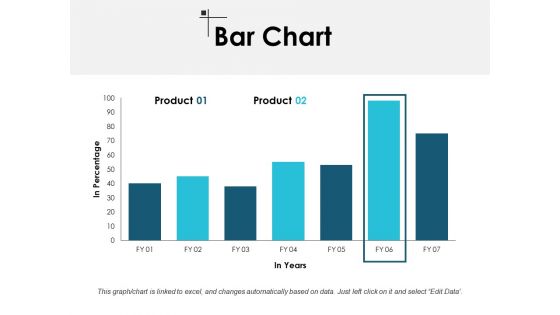
Bar Chart Finance Ppt PowerPoint Presentation Model Master Slide
This is a bar chart finance ppt powerpoint presentation model master slide. This is a two stage process. The stages in this process are finance, marketing, management, investment, analysis.
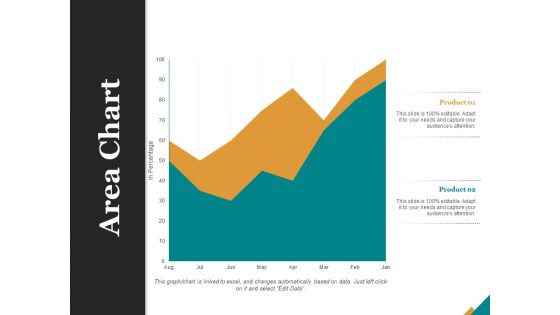
Area Chart Finance Ppt PowerPoint Presentation Summary Design Templates
This is a area chart finance ppt powerpoint presentation summary design templates. This is a two stage process. The stages in this process are finance, marketing, management, investment, analysis.
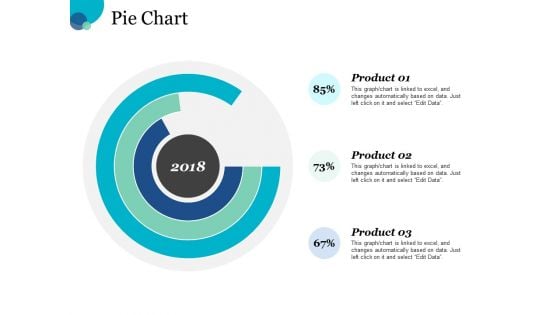
Pie Chart Finance Ppt PowerPoint Presentation Slides Graphic Images
This is a pie chart finance ppt powerpoint presentation slides graphic images. This is a three stage process. The stages in this process are finance, marketing, management, investment, analysis.
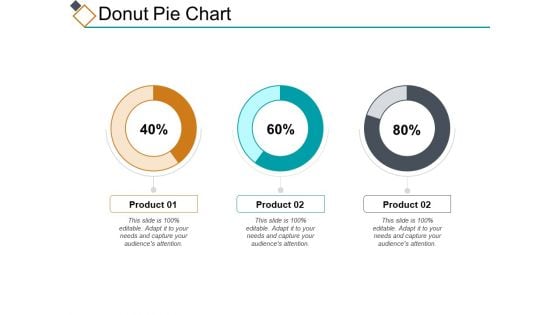
Donut Pie Chart Ppt PowerPoint Presentation Infographic Template Slides
This is a donut pie chart ppt powerpoint presentation infographic template slides. This is a three stage process. The stages in this process are percentage, product, business, management, marketing.
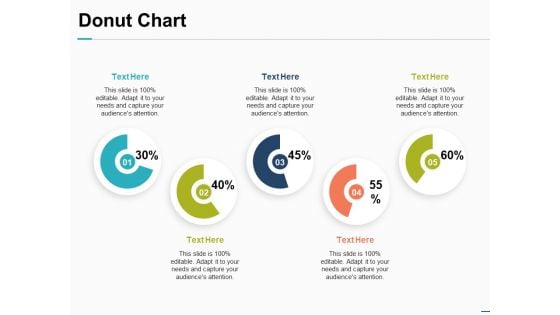
Donut Chart Financial Investment Ppt PowerPoint Presentation Inspiration Introduction
This is a donut chart financial investment ppt powerpoint presentation inspiration introduction. This is a five stage process. The stages in this process are finance, marketing, management, investment, analysis.
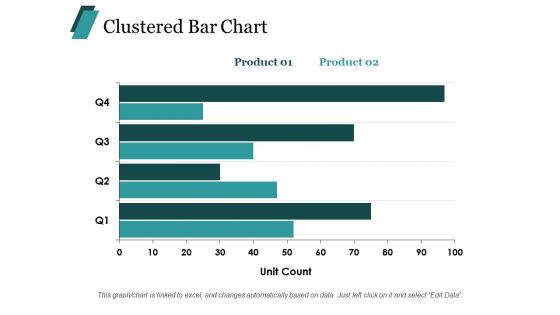
Clustered Bar Chart Finance Ppt PowerPoint Presentation Summary Layouts
This is a clustered bar chart finance ppt powerpoint presentation summary layouts. This is a two stage process. The stages in this process are finance, marketing, management, investment, analysis.
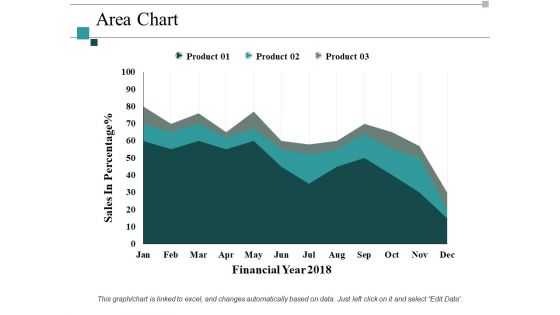
Area Chart Investment Ppt PowerPoint Presentation Summary Design Inspiration
This is a area chart investment ppt powerpoint presentation summary design inspiration. This is a three stage process. The stages in this process are finance, marketing, management, investment, analysis.

Donut Chart Marketing Product Ppt PowerPoint Presentation Slides Background Designs
This is a donut chart marketing product ppt powerpoint presentation slides background designs. This is a three stage process. The stages in this process are business, management, marketing, percentage, product.
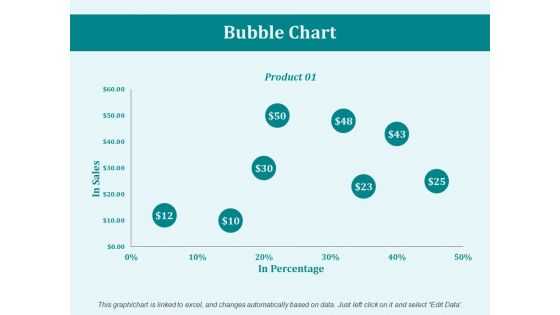
Bubble Chart Product Ppt PowerPoint Presentation Inspiration Design Ideas
This is a bubble chart product ppt powerpoint presentation inspiration design ideas. This is a one stage process. The stages in this process are business, management, marketing, product, percentage.
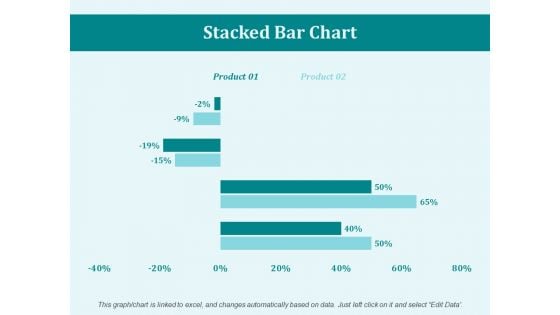
Stacked Bar Chart Percentage Ppt PowerPoint Presentation Portfolio Mockup
This is a stacked bar chart percentage ppt powerpoint presentation portfolio mockup. This is a two stage process. The stages in this process are business, marketing, management, percentage, product.
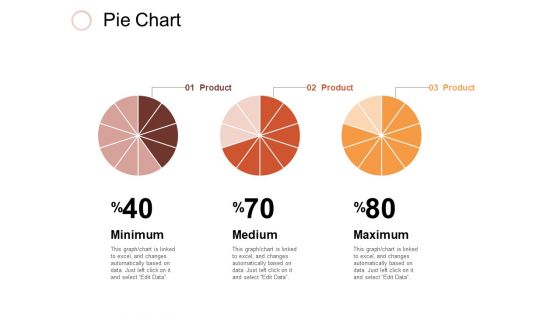
Pie Chart Investment Ppt PowerPoint Presentation Inspiration Design Inspiration
This is a pie chart investment ppt powerpoint presentation inspiration design inspiration. This is a three stage process. The stages in this process are business, management, marketing, percentage, product.
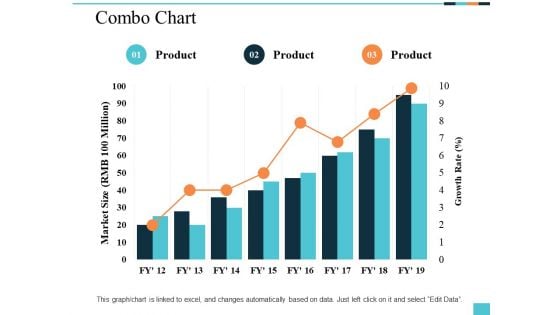
Combo Chart Product Ppt PowerPoint Presentation Professional Graphics Template
This is a combo chart product ppt powerpoint presentation professional graphics template. This is a three stage process. The stages in this process are finance, marketing, management, investment, product.

Bubble Chart Percentage Ppt PowerPoint Presentation File Layouts
This is a bubble chart percentage ppt powerpoint presentation file layouts. This is a two stage process. The stages in this process are finance, marketing, management, investment, product, percentage.
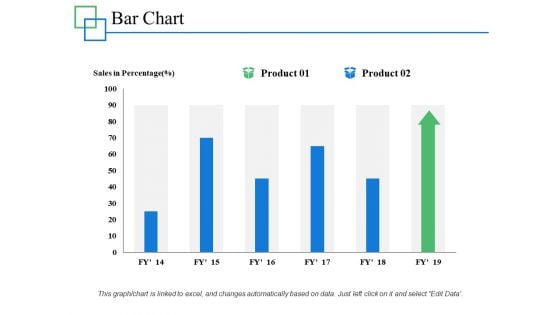
Bar Chart Percentage Product Ppt PowerPoint Presentation Layouts Designs Download
This is a bar chart percentage product ppt powerpoint presentation layouts designs download. This is a two stage process. The stages in this process are percentage, product, business, management.
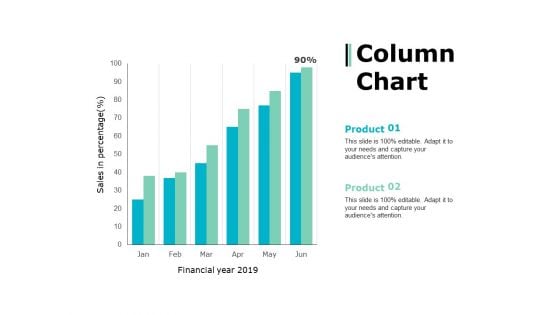
Column Chart Marketing Strategy Ppt PowerPoint Presentation Layouts Slide Portrait
This is a column chart marketing strategy ppt powerpoint presentation layouts slide portrait. This is a two stage process. The stages in this process are percentage, product, business, management, marketing.

Bar Chart Finance Marketing Ppt PowerPoint Presentation File Good
This is a bar chart finance marketing ppt powerpoint presentation file good. This is a three stage process. The stages in this process are finance, marketing, management, investment, analysis.
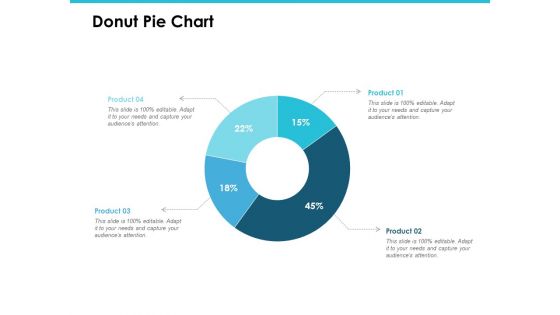
Donut Pie Chart Investment Analysis Ppt PowerPoint Presentation Gallery Introduction
This is a donut pie chart investment analysis ppt powerpoint presentation gallery introduction. This is a four stage process. The stages in this process are finance, marketing, management, investment, analysis.
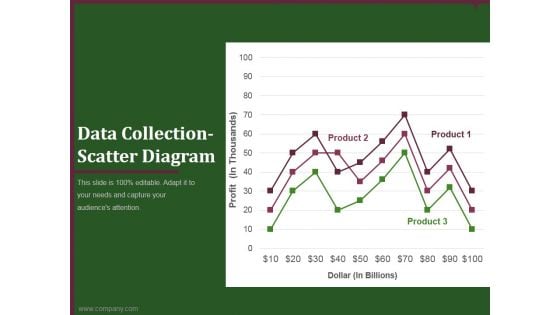
data collection scatter diagram ppt powerpoint presentation inspiration
This is a data collection scatter diagram ppt powerpoint presentation inspiration. This is a three stage process. The stages in this process are business, planning, marketing, scatter diagram, finance.
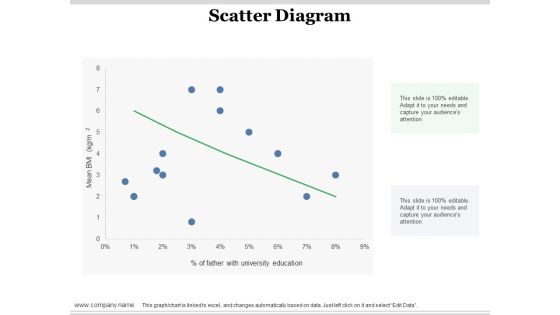
Scatter Diagram Ppt PowerPoint Presentation Infographic Template Design Ideas
This is a scatter diagram ppt powerpoint presentation infographic template design ideas. This is a one stage process. The stages in this process are scatter diagram, finance, in percentage, business, bar graph.
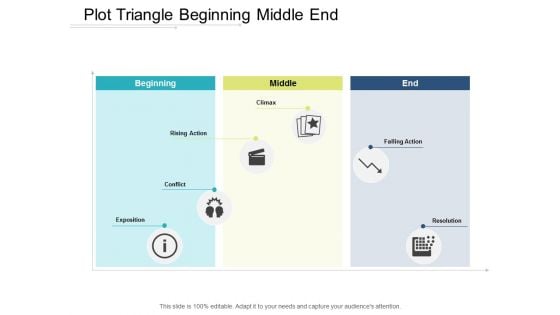
Plot Triangle Beginning Middle End Ppt Powerpoint Presentation Model Diagrams
This is a plot triangle beginning middle end ppt powerpoint presentation model diagrams. This is a three stage process. The stages in this process are scatter plot, probability plots, plot diagram.
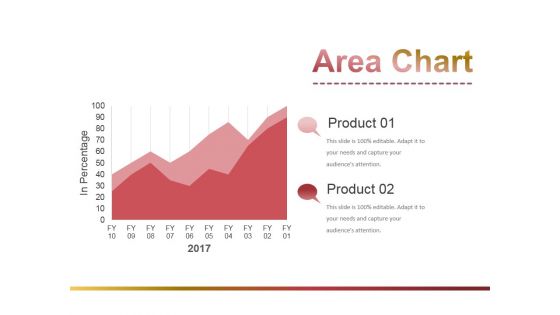
Area Chart Ppt PowerPoint Presentation Show Slide Portrait
This is a area chart ppt powerpoint presentation show slide portrait. This is a two stage process. The stages in this process are business, strategy, marketing, analysis, area chart.

Area Chart Ppt PowerPoint Presentation Visual Aids Show
This is a area chart ppt powerpoint presentation visual aids show. This is a two stage process. The stages in this process are area chart, growth, strategy, finance, business.
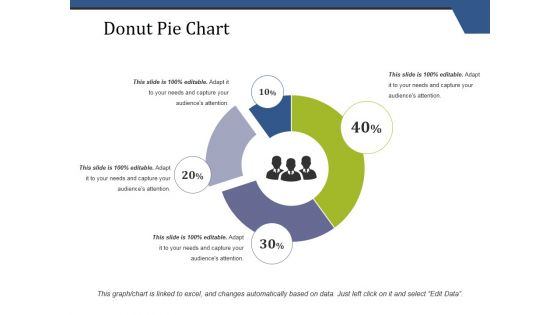
Donut Pie Chart Ppt PowerPoint Presentation Portfolio Clipart Images
This is a donut pie chart ppt powerpoint presentation portfolio clipart images. This is a four stage process. The stages in this process are donut pie chart, finance, marketing, strategy, business.

Donut Pie Chart Ppt PowerPoint Presentation Professional Files
This is a donut pie chart ppt powerpoint presentation professional files. This is a five stage process. The stages in this process are donut pie chart, finance, marketing, investment, analysis, business.
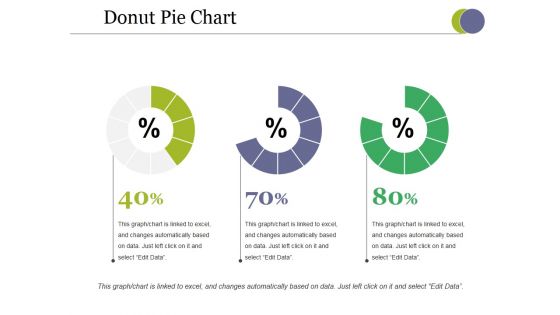
Donut Pie Chart Ppt PowerPoint Presentation Professional Format Ideas
This is a donut pie chart ppt powerpoint presentation professional format ideas. This is a three stage process. The stages in this process are donut pie chart, marketing, strategy, analysis, business.

donut pie chart ppt powerpoint presentation file skills
This is a donut pie chart ppt powerpoint presentation file skills. This is a five stage process. The stages in this process are donut pie chart, finance, marketing, strategy, business.
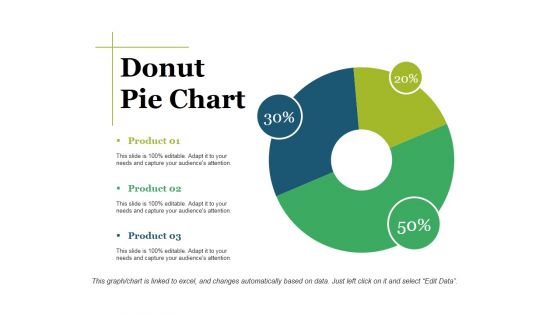
Donut Pie Chart Ppt PowerPoint Presentation Show Graphic Tips
This is a donut pie chart ppt powerpoint presentation show graphic tips. This is a three stage process. The stages in this process are donut pie chart, finance, marketing, strategy, analysis, business.
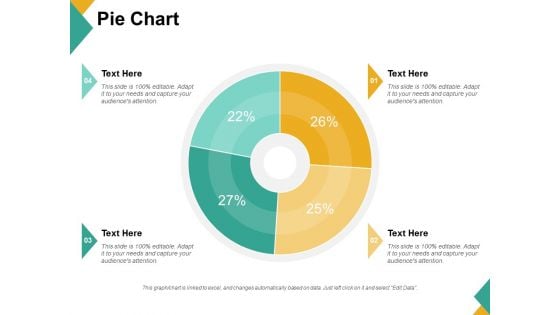
Pie Chart Ppt PowerPoint Presentation Infographic Template Graphics Example
This is a pie chart ppt powerpoint presentation infographic template graphics example. This is a four stage process. The stages in this process are pie chart, finance, marketing, strategy, business.
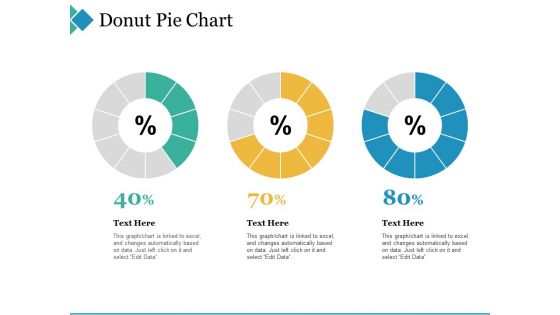
Donut Pie Chart Ppt PowerPoint Presentation Infographic Template Example 2015
This is a donut pie chart ppt powerpoint presentation infographic template example 2015. This is a three stage process. The stages in this process are donut pie chart, finance, marketing, strategy, business.

Donut Pie Chart Ppt PowerPoint Presentation Portfolio Example Topics
This is a donut pie chart ppt powerpoint presentation portfolio example topics. This is a four stage process. The stages in this process are donut pie chart, strategy, business, marketing, finance.
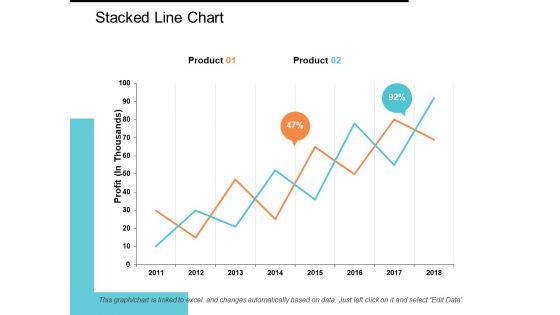
Stacked Line Chart Ppt PowerPoint Presentation Model Show
This is a stacked line chart ppt powerpoint presentation model show. This is a two stage process. The stages in this process are stacked line chart, product, profit, percentage, growth.

Project Team Evaluation Report Ppt PowerPoint Presentation File Diagrams
This is a project team evaluation report ppt powerpoint presentation file diagrams. This is a four stage process. The stages in this process are project analysis, project review, project performance management.
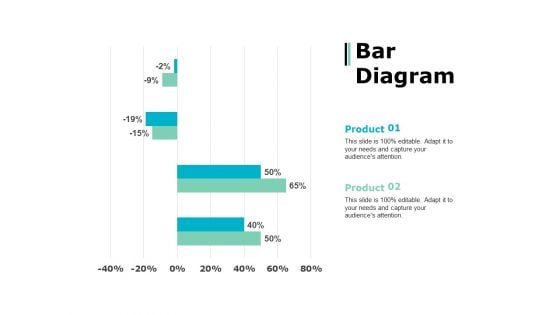
Bar Diagram Percentage Product Ppt PowerPoint Presentation Show Topics
This is a bar diagram percentage product ppt powerpoint presentation show topics. This is a two stage process. The stages in this process are percentage, product, business, management, marketing.
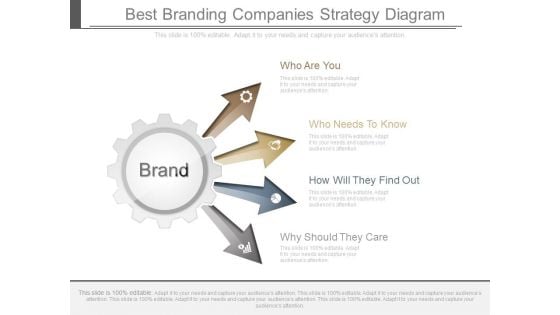
Best Branding Companies Strategy Diagram
This is a best branding companies strategy diagram. This is a four stage process. The stages in this process are brand, who are you, who needs to know, how will they find out, why should they care.
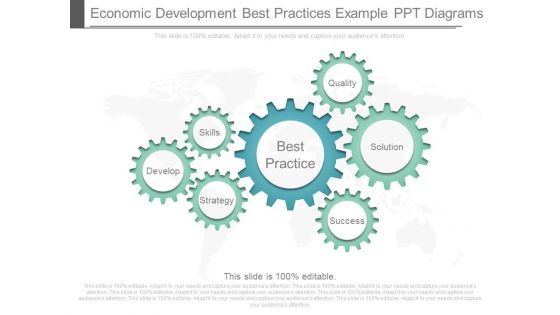
Economic Development Best Practices Example Ppt Diagrams
This is a economic development best practices example ppt diagrams. This is a seven stage process. The stages in this process are develop, skills, strategy, best practice, quality, solution, success.
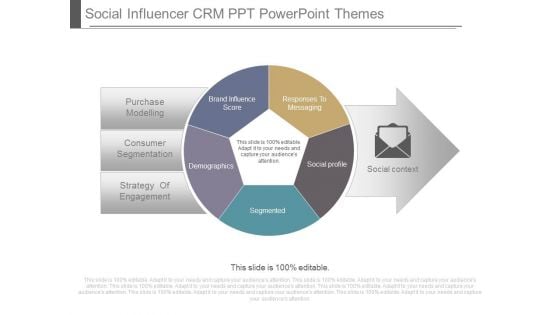
Social Influencer Crm Ppt Powerpoint Themes
This is a social influencer crm ppt powerpoint themes. This is a five stage process. The stages in this process are purchase modelling, consumer segmentation, strategy of engagement, social context, responses to messaging, social profile, segmented, demographics, brand influence score.
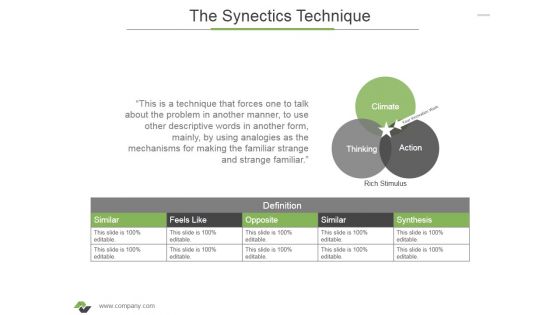
The Synectics Technique Ppt PowerPoint Presentation Visual Aids Outline
This is a the synectics technique ppt powerpoint presentation visual aids outline. This is a two stage process. The stages in this process are climate, thinking, action, rich stimulus, definition.
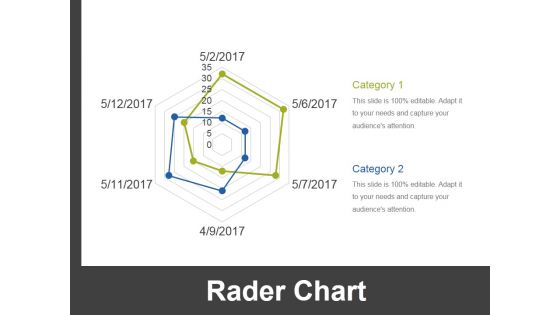
Rader Chart Ppt PowerPoint Presentation Pictures Slide Portrait
This is a rader chart ppt powerpoint presentation pictures slide portrait. This is a two stage process. The stages in this process are rader chart, management, analysis, strategy, business.
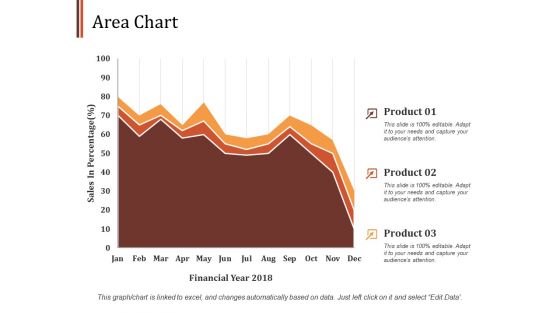
Area Chart Finance Ppt PowerPoint Presentation Infographics Design Ideas
This is a area chart finance ppt powerpoint presentation infographics design ideas. This is a three stage process. The stages in this process are area chart, finance, marketing, management, investment.

Area Chart Finance Ppt PowerPoint Presentation Professional File Formats
This is a area chart finance ppt powerpoint presentation professional file formats . This is a three stage process. The stages in this process are area chart, finance, marketing, management, investment.
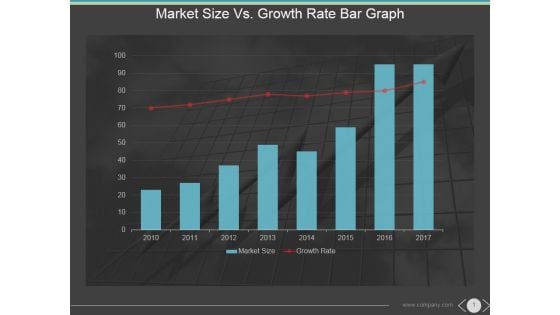
Market Size Vs Growth Rate Bar Graph Ppt PowerPoint Presentation Themes
This is a market size vs growth rate bar graph ppt powerpoint presentation themes. This is a eight stage process. The stages in this process are market size, growth rate, years, future, graph.
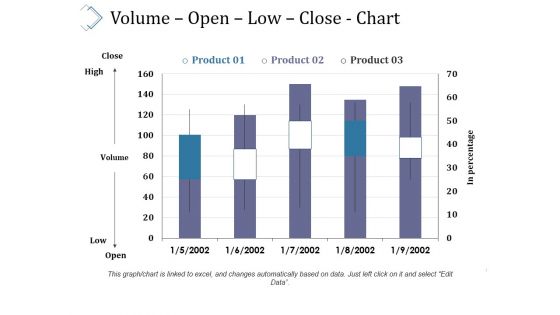
Volume Open Low Close Chart Ppt PowerPoint Presentation Summary Grid
This is a volume open low close chart ppt powerpoint presentation summary grid. This is a three stage process. The stages in this process are volume, open, low, close, chart.
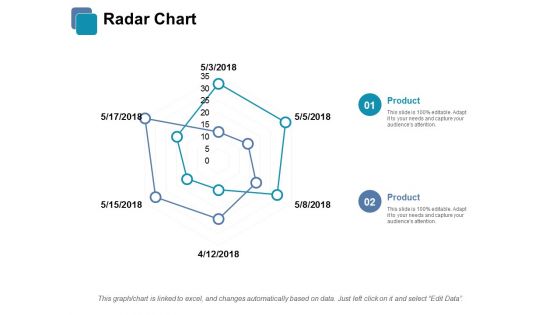
Radar Chart Ppt PowerPoint Presentation Infographic Template Visuals
This is a radar chart ppt powerpoint presentation infographic template visuals. This is a two stage process. The stages in this process are radar chart, finance, business, marketing, analysis.
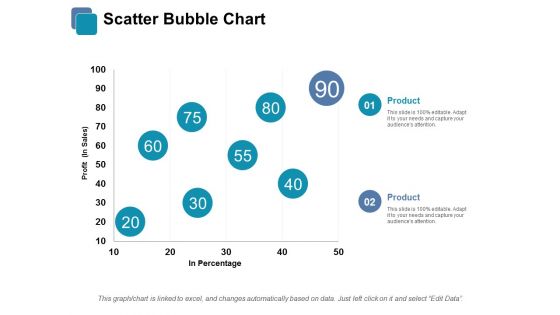
Scatter Bubble Chart Ppt PowerPoint Presentation Infographic Template Infographics
This is a scatter bubble chart ppt powerpoint presentation infographic template infographics. This is a two stage process. The stages in this process are scatter bubble chart, finance, business, marketing, analysis.
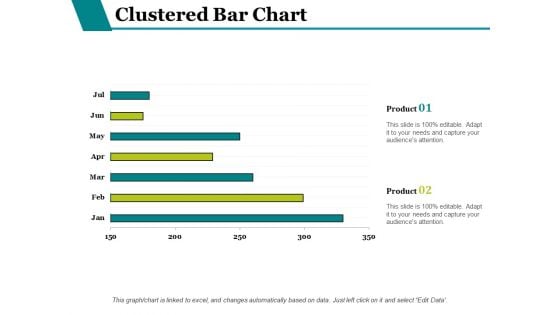
Clustered Bar Chart Finance Ppt PowerPoint Presentation Styles Design Inspiration
This is a clustered bar chart finance ppt powerpoint presentation styles design inspiration. This is a two stage process. The stages in this process are clustered bar chart, finance, business, analysis, investment.
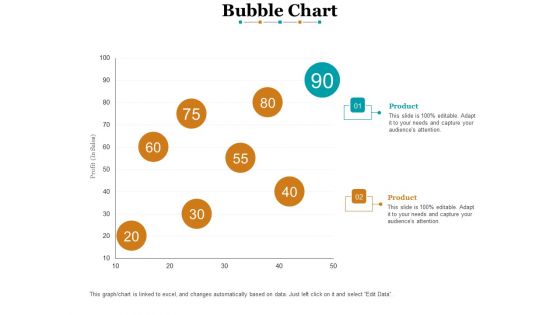
Bubble Chart Finance Ppt PowerPoint Presentation File Graphics
This is a bubble chart finance ppt powerpoint presentation file graphics. This is a two stage process. The stages in this process are bubble chart, finance, marketing, analysis, investment.
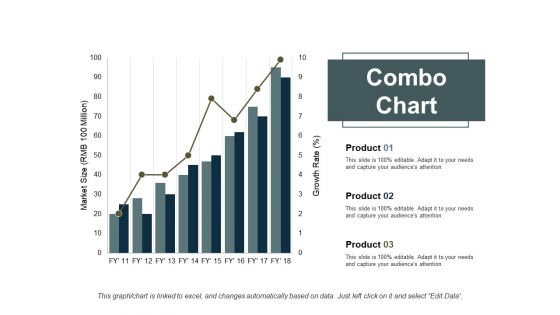
Combo Chart Finance Ppt PowerPoint Presentation Slides Backgrounds
This is a combo chart finance ppt powerpoint presentation slides backgrounds. This is a three stage process. The stages in this process are combo chart, finance, marketing, analysis, business.

Portfolio Gantt Chart Ppt PowerPoint Presentation Complete Deck With Slides
This is a portfolio gantt chart ppt powerpoint presentation complete deck with slides. This is a one stage process. The stages in this process are business, management, marketing, strategy, planning.
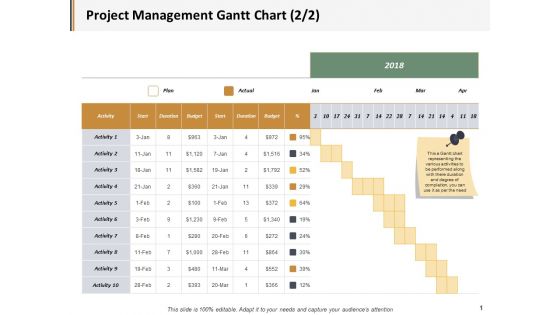
Project Management Gantt Chart Marketing Ppt PowerPoint Presentation Show Guide
This is a project management gantt chart marketing ppt powerpoint presentation show guide. This is a three stage process. The stages in this process are business, management, marketing, compare.
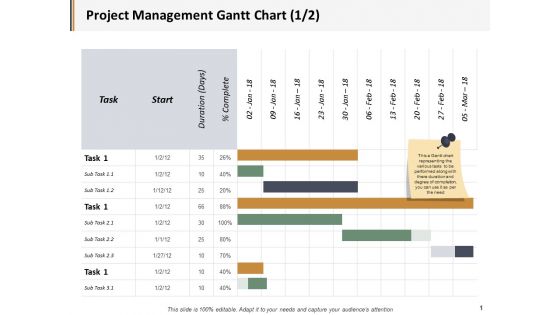
Project Management Gantt Chart Ppt PowerPoint Presentation File Graphic Images
This is a project management gantt chart ppt powerpoint presentation file graphic images. This is a three stage process. The stages in this process are business, management, marketing, compare.
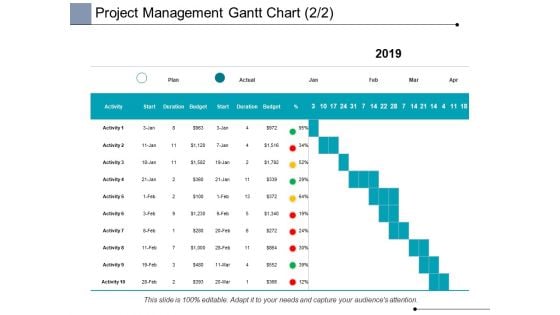
Project Management Gantt Chart Business Ppt PowerPoint Presentation Portfolio
This is a project management gantt chart business ppt powerpoint presentation portfolio. This is a four stage process. The stages in this process are business, planning, strategy, marketing, management.
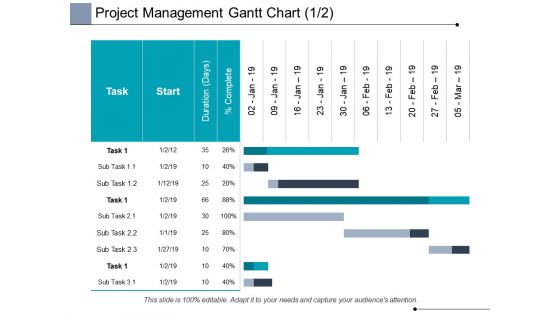
Project Management Gantt Chart Planning Ppt PowerPoint Presentation Visuals
This is a project management gantt chart planning ppt powerpoint presentation visuals. This is a three stage process. The stages in this process are business, planning, strategy, marketing, management.
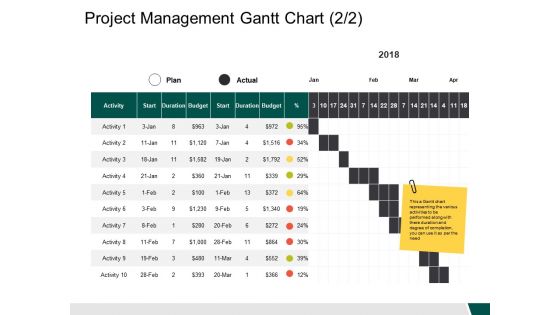
Project Management Gantt Chart Activity Ppt PowerPoint Presentation Inspiration Samples
This is a project management gantt chart activity ppt powerpoint presentation inspiration samples. This is a ten stage process. The stages in this process are business, management, strategy, analysis, marketing.
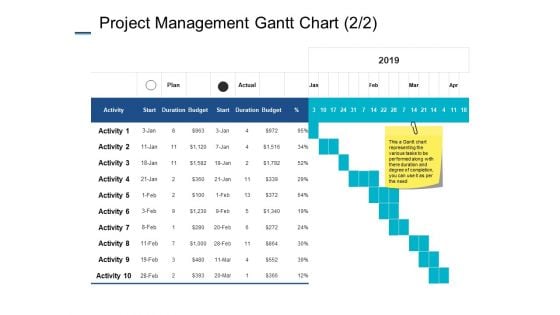
Project Management Gantt Chart Marketing Ppt PowerPoint Presentation Styles Files
This is a project management gantt chart marketing ppt powerpoint presentation styles files. This is a two stage process. The stages in this process are business, planning, strategy, marketing, management.
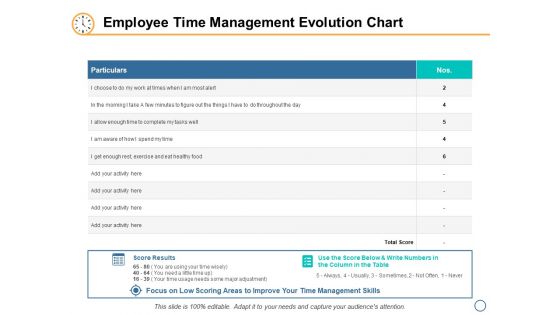
Employee Time Management Evolution Chart Ppt PowerPoint Presentation Slides Outfit
This is a employee time management evolution chart ppt powerpoint presentation slides outfit. This is a two stage process. The stages in this process are business, planning, strategy, marketing, management.
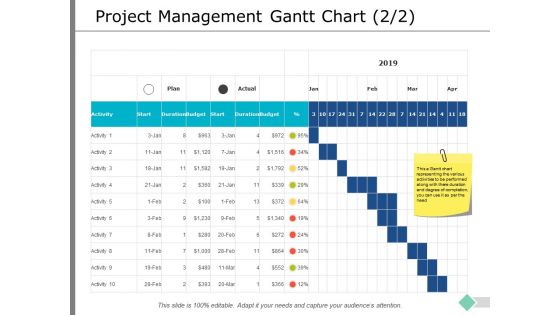
Project Management Gantt Chart Ppt PowerPoint Presentation Show Gridlines
This is a project management gantt chart ppt powerpoint presentation show gridlines. This is a two stage process. The stages in this process are business, planning, strategy, marketing, management.

Project Management Gantt Chart Finance Ppt PowerPoint Presentation Pictures Vector
This is a project management gantt chart finance ppt powerpoint presentation pictures vector. This is a four stage process. The stages in this process are compare, marketing, business, management, planning.
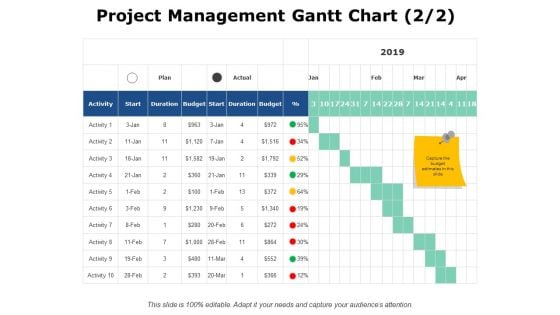
Project Management Gantt Chart Finance Ppt PowerPoint Presentation Infographics Files
This is a project management gantt chart finance ppt powerpoint presentation infographics files. This is a six stage process. The stages in this process are business, planning, strategy, marketing, management.
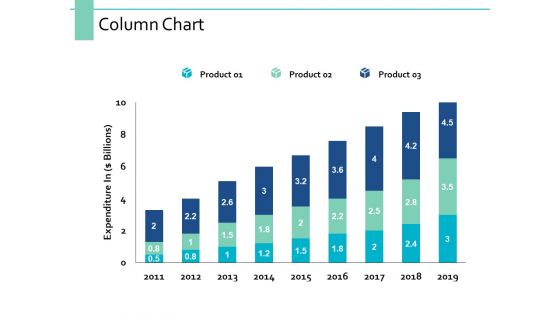
Column Chart Marketing Management Ppt PowerPoint Presentation Professional Images
This is a column chart marketing management ppt powerpoint presentation professional images. This is a three stage process. The stages in this process are finance, marketing, management, investment, analysis.
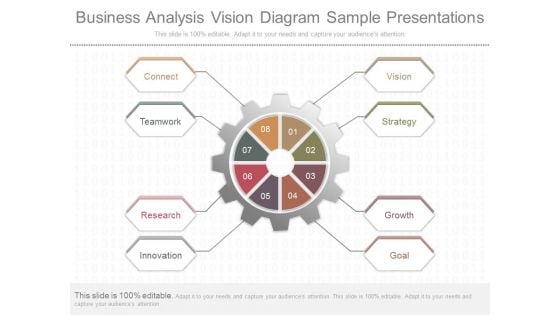
Business Analysis Vision Diagram Sample Presentations
This is a business analysis vision diagram sample presentations. This is a eight stage process. The stages in this process are connect, teamwork, research, innovation, vision, strategy, growth, goal.
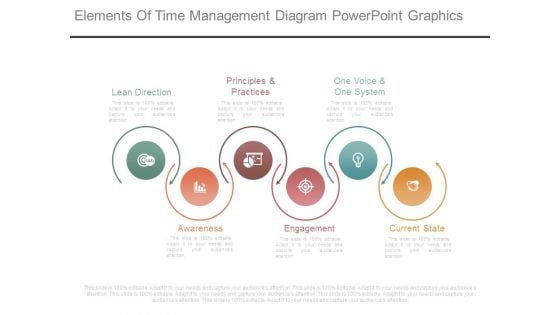
Elements Of Time Management Diagram Powerpoint Graphics
This is a Elements Of Time Management Diagram Powerpoint Graphics. This is a six stage process. The stages in this process are lean direction, principles andpractices, one voice and one system, awareness, engagement, current state.
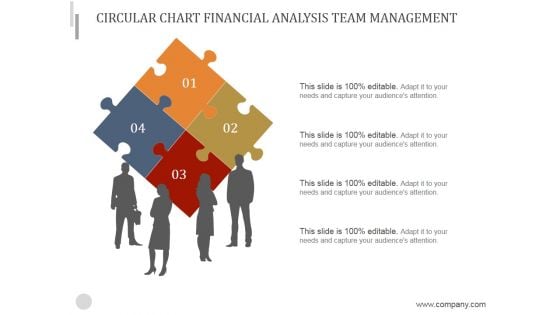
Circular Chart Financial Analysis Team Management Ppt PowerPoint Presentation Guide
This is a circular chart financial analysis team management ppt powerpoint presentation guide. This is a four stage process. The stages in this process are puzzle, teamwork, business, marketing, analysis.
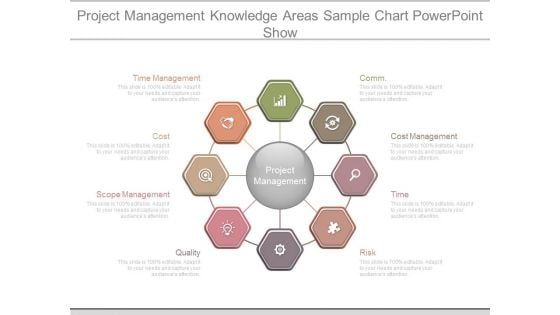
Project Management Knowledge Areas Sample Chart Powerpoint Show
This is a project management knowledge areas sample chart powerpoint show. This is a eight stage process. The stages in this process are comm, cost management, time, risk, quality, scope management, cost, time management, project management.
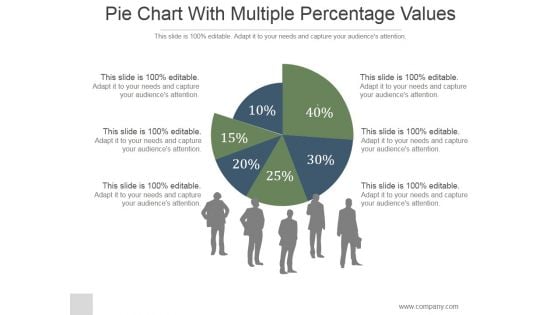
Pie Chart With Multiple Percentage Values Ppt PowerPoint Presentation Show
This is a pie chart with multiple percentage values ppt powerpoint presentation show. This is a six stage process. The stages in this process are pie, finance, people, silhouettes, communication.
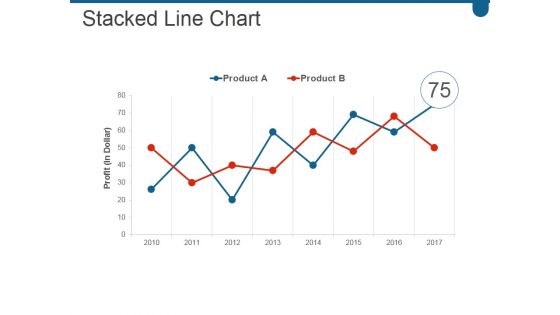
Stacked Line Chart Ppt PowerPoint Presentation Infographic Template Show
This is a stacked line chart ppt powerpoint presentation infographic template show. This is a two stage process. The stages in this process are business, marketing, growth, success, line.
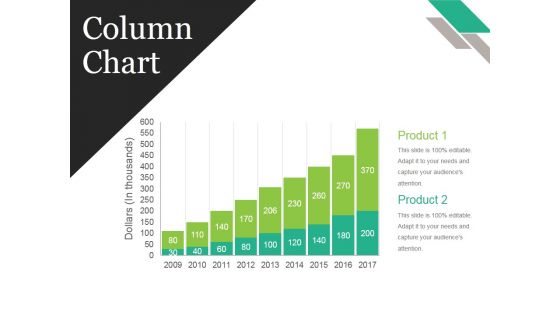
Column Chart Ppt PowerPoint Presentation Show Background Images
This is a column chart ppt powerpoint presentation show background images. This is a nine stage process. The stages in this process are business, strategy, marketing, analysis, growth strategy.
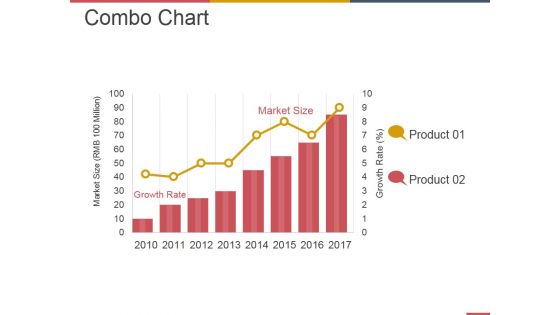
Combo Chart Ppt PowerPoint Presentation Infographic Template Deck
This is a combo chart ppt powerpoint presentation infographic template deck. This is a eight stage process. The stages in this process are business, strategy, marketing, analysis, growth strategy, market size.

Our Charts And Graphs Ppt PowerPoint Presentation File Visuals
This is a our charts and graphs ppt powerpoint presentation file visuals. This is a one stage process. The stages in this process are business, strategy, marketing, analysis, finance.

Combo Chart Ppt PowerPoint Presentation Infographic Template Influencers
This is a combo chart ppt powerpoint presentation infographic template influencers. This is a three stage process. The stages in this process are market size rmb million, growth rate.
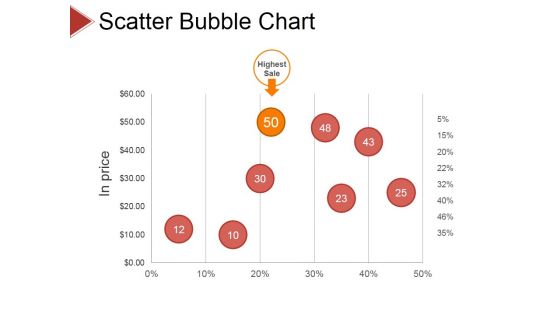
Scatter Bubble Chart Ppt PowerPoint Presentation Pictures Show
This is a scatter bubble chart ppt powerpoint presentation pictures show. This is a eight stage process. The stages in this process are business, strategy, analysis, pretention, highest sale.
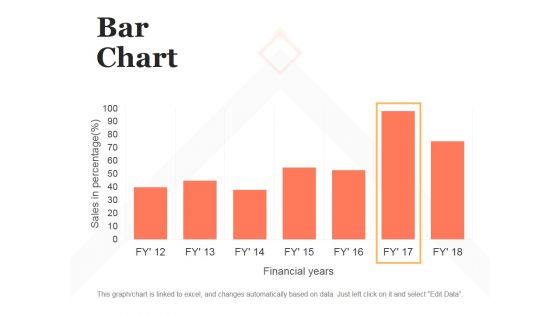
Bar Chart Ppt PowerPoint Presentation Infographic Template Brochure
This is a bar chart ppt powerpoint presentation infographic template brochure. This is a seven stage process. The stages in this process are bar graph, finance, marketing, strategy, analysis, business.
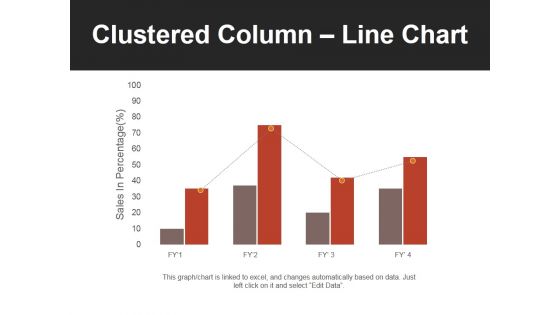
Clustered Column Line Chart Ppt PowerPoint Presentation Professional Slides
This is a clustered column line chart ppt powerpoint presentation professional slides. This is a four stage process. The stages in this process are bar, finance, business, marketing, growth.
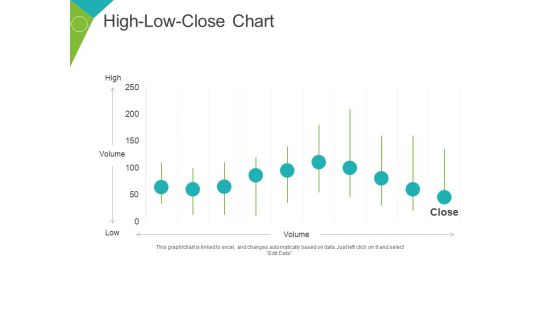
High Low Close Chart Ppt PowerPoint Presentation Layouts Guide
This is a high low close chart ppt powerpoint presentation layouts guide. This is a ten stage process. The stages in this process are high, volume, low, business, marketing, finance.
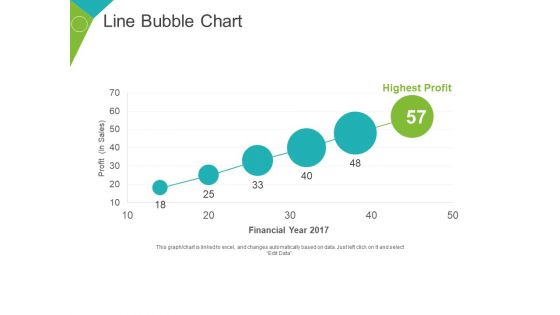
Line Bubble Chart Ppt PowerPoint Presentation Portfolio Slide Portrait
This is a line bubble chart ppt powerpoint presentation portfolio slide portrait. This is a six stage process. The stages in this process are highest profit, financial year, profit in sales, growth, business.
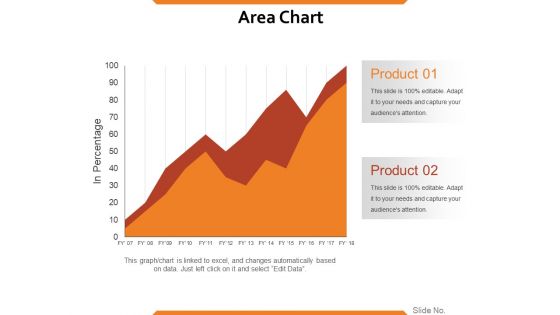
Area Chart Ppt PowerPoint Presentation Inspiration Slide Download
This is a area chart ppt powerpoint presentation inspiration slide download. This is a two stage process. The stages in this process are product, in percentage, business, growth, strategy, finance.
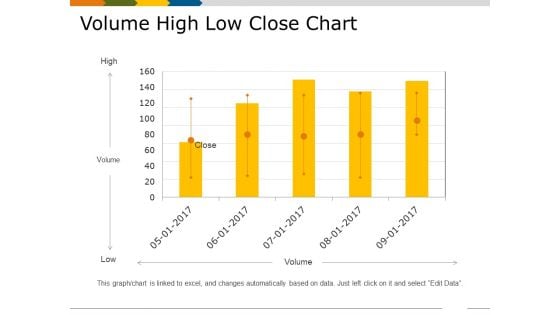
Volume High Low Close Chart Ppt PowerPoint Presentation Gallery Ideas
This is a volume high low close chart ppt powerpoint presentation gallery ideas. This is a five stage process. The stages in this process are high, volume, low, graph, business.
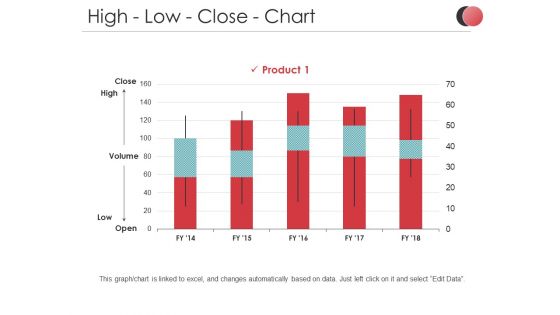
High Low Close Chart Ppt PowerPoint Presentation Ideas Brochure
This is a high low close chart ppt powerpoint presentation ideas brochure. This is a three stage process. The stages in this process are in percentage, product, business, marketing, finance.
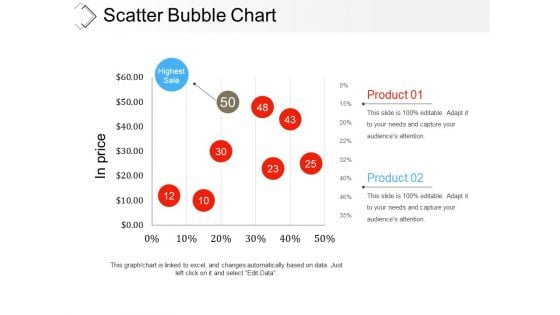
Scatter Bubble Chart Ppt PowerPoint Presentation Infographic Template Examples
This is a scatter bubble chart ppt powerpoint presentation infographic template examples. This is a two stage process. The stages in this process are highest sale, product, in price, finance, business.
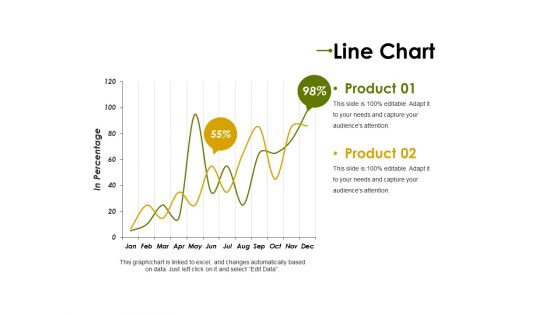
Line Chart Ppt PowerPoint Presentation Professional Clipart Images
This is a line chart ppt powerpoint presentation professional clipart images. This is a two stage process. The stages in this process are product, in percentage, graph, percentage, finance, business.
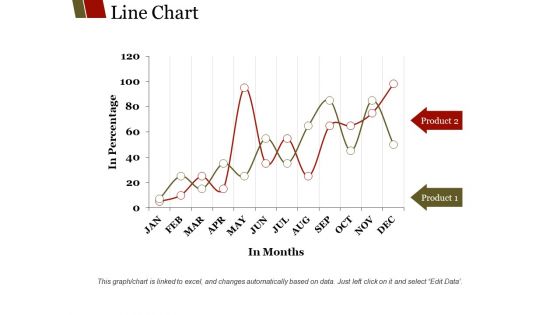
Line Chart Ppt PowerPoint Presentation Show Background Designs
This is a line chart ppt powerpoint presentation show background designs. This is a two stage process. The stages in this process are product, in months, in percentage, business.
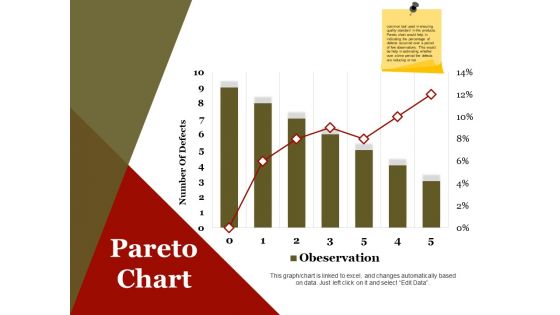
Pareto Chart Ppt PowerPoint Presentation Infographics Design Inspiration
This is a pareto chart ppt powerpoint presentation infographics design inspiration. This is a seven stage process. The stages in this process are number of defects, business, marketing, finance.
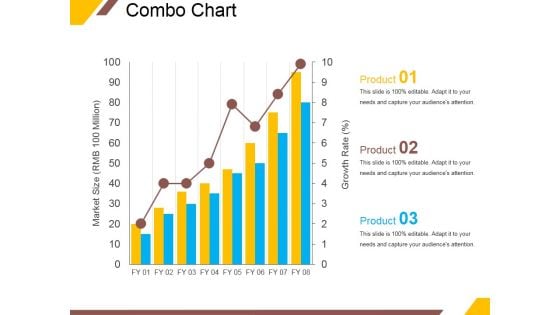
Combo Chart Ppt PowerPoint Presentation Professional Slide Download
This is a combo chart ppt powerpoint presentation professional slide download. This is a three stage process. The stages in this process are market size, growth rate, product, graph, growth.
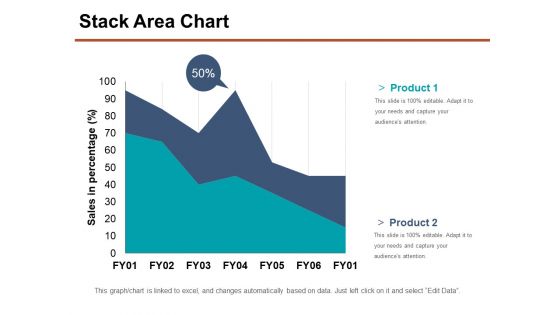
Stack Area Chart Ppt PowerPoint Presentation Show Samples
This is a stack area chart ppt powerpoint presentation show samples. This is a two stage process. The stages in this process are product, sales in percentage, business, marketing, percentage.
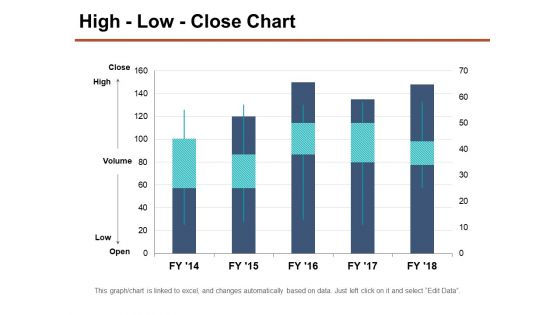
High Low Close Chart Ppt PowerPoint Presentation Layouts Objects
This is a high low close chart ppt powerpoint presentation layouts objects. This is a five stage process. The stages in this process are high, volume, low, business, marketing.
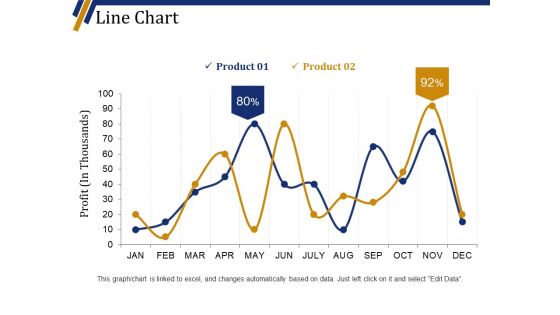
Line Chart Ppt PowerPoint Presentation Portfolio Background Designs
This is a line chart ppt powerpoint presentation portfolio background designs. This is a two stage process. The stages in this process are product, business, finance, marketing, profit in thousands.
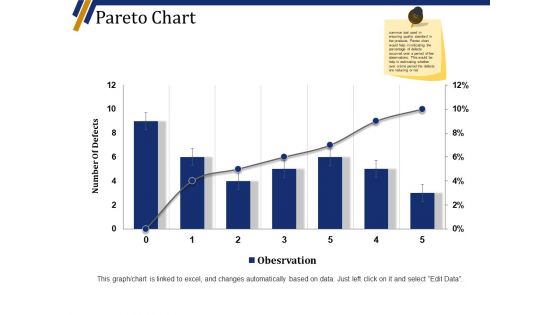
Pareto Chart Ppt PowerPoint Presentation File Infographic Template
This is a pareto chart ppt powerpoint presentation file infographic template. This is a six stage process. The stages in this process are number of defects, business, marketing, graph.
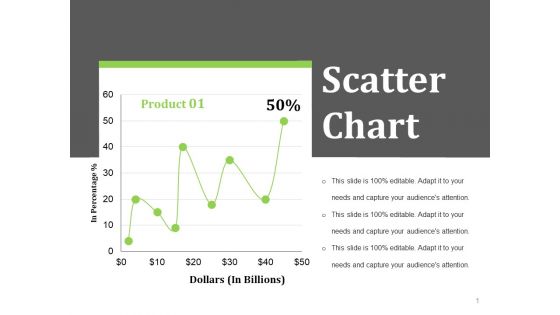
Scatter Chart Ppt PowerPoint Presentation Styles Layout Ideas
This is a scatter chart ppt powerpoint presentation styles layout ideas. This is a one stage process. The stages in this process are dollars in billions, in percentage, business, finance.
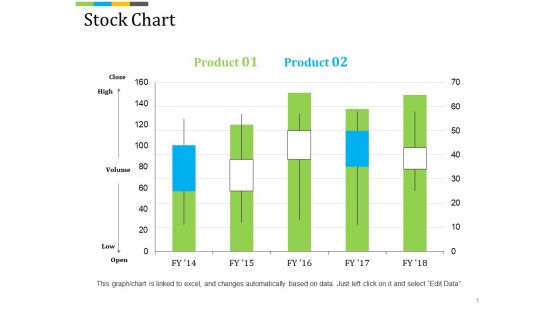
Stock Chart Ppt PowerPoint Presentation Professional Background Image
This is a stock chart ppt powerpoint presentation professional background image. This is a five stage process. The stages in this process are high, volume, low, finance, business, marketing.
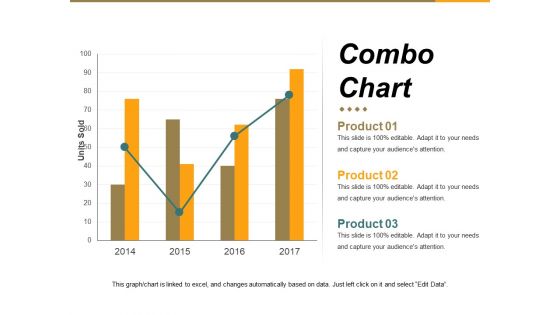
Combo Chart Ppt PowerPoint Presentation Infographics Example Introduction
This is a combo chart ppt powerpoint presentation infographics example introduction. This is a four stage process. The stages in this process are units sold, business, marketing, graph, growth.
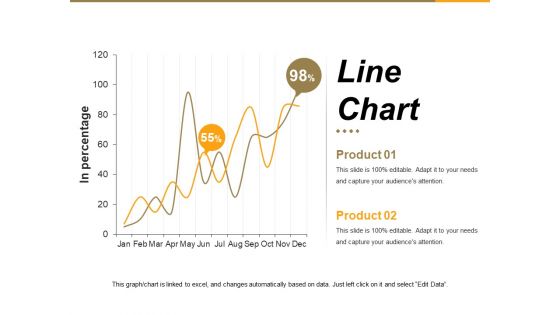
Line Chart Ppt PowerPoint Presentation Summary File Formats
This is a line chart ppt powerpoint presentation summary file formats. This is a two stage process. The stages in this process are in percentage, graph, business, marketing, growth.
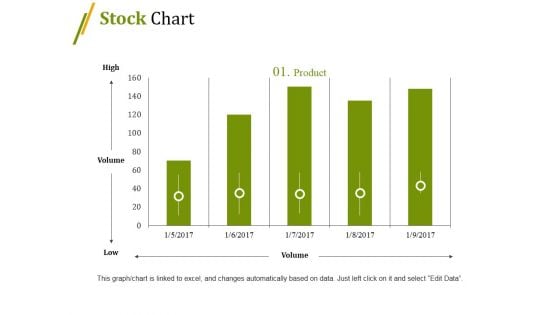
Stock Chart Ppt PowerPoint Presentation Summary File Formats
This is a stock chart ppt powerpoint presentation summary file formats. This is a five stage process. The stages in this process are high, volume, low, business, graph, finance.
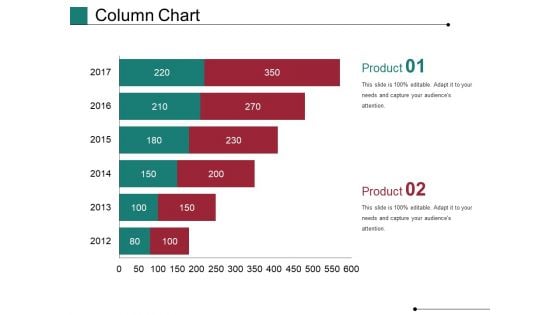
Column Chart Ppt PowerPoint Presentation Show Master Slide
This is a column chart ppt powerpoint presentation show master slide. This is a six stage process. The stages in this process are financial, years, business, marketing, finance, graph.
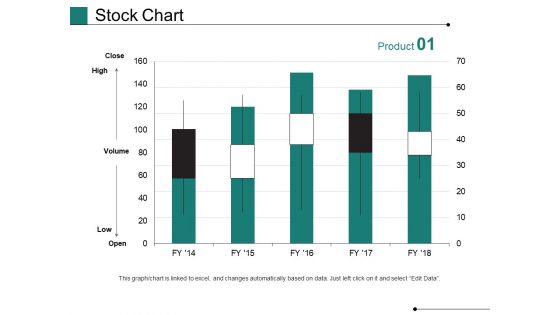
Stock Chart Ppt PowerPoint Presentation Pictures Graphics Design
This is a stock chart ppt powerpoint presentation pictures graphics design. This is a five stage process. The stages in this process are high, volume, low, business, marketing, graph.
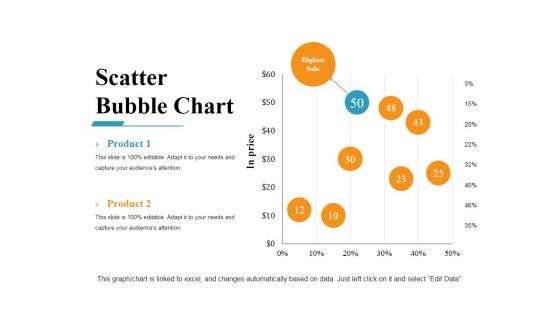
Scatter Bubble Chart Ppt PowerPoint Presentation Gallery Example Introduction
This is a scatter bubble chart ppt powerpoint presentation gallery example introduction. This is a eight stage process. The stages in this process are business, marketing, finance, bubble, scatter.
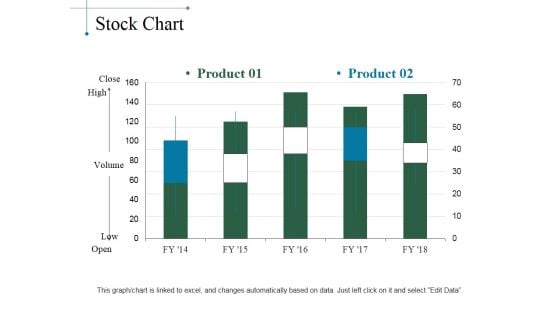
Stock Chart Ppt PowerPoint Presentation Layouts Designs Download
This is a stock chart ppt powerpoint presentation layouts designs download. This is a five stage process. The stages in this process are product, close, high, volume, low, open.

Line Chart Ppt PowerPoint Presentation Infographics Graphic Images
This is a line chart ppt powerpoint presentation infographics graphic images. This is a two stage process. The stages in this process are sales in percentage, financial years, growth, business, marketing.
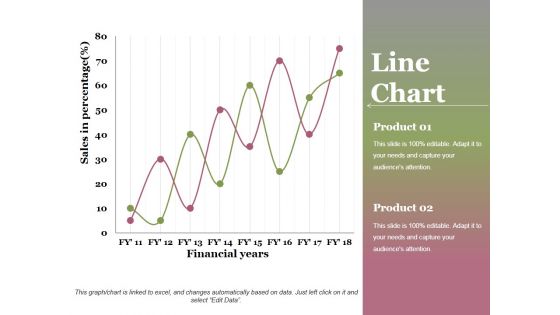
Line Chart Ppt PowerPoint Presentation Professional Graphics Design
This is a line chart ppt powerpoint presentation professional graphics design. This is a two stage process. The stages in this process are financial years, sales in percentage, product, growth, success.
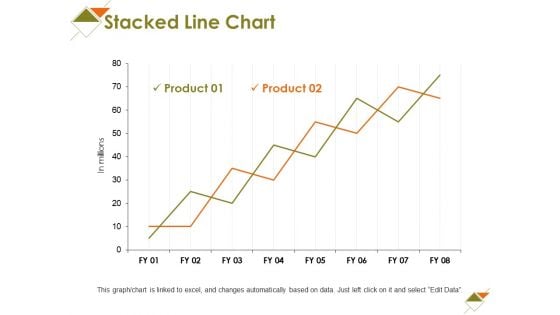
Stacked Line Chart Ppt PowerPoint Presentation File Display
This is a stacked line chart ppt powerpoint presentation file display. This is a two stage process. The stages in this process are business, marketing, graph, strategy, in millions.
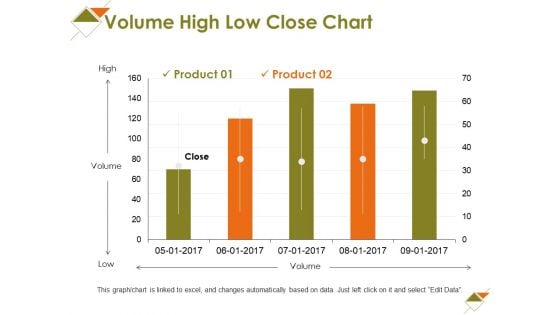
Volume High Low Close Chart Ppt PowerPoint Presentation Slides Styles
This is a volume high low close chart ppt powerpoint presentation slides styles. This is a two stage process. The stages in this process are high, volume, low, business, marketing.
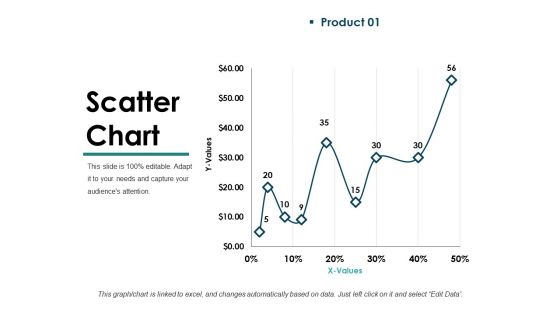
Scatter Chart Template 1 Ppt PowerPoint Presentation Inspiration Guidelines
This is a scatter chart template 1 ppt powerpoint presentation inspiration guidelines. This is a one stage process. The stages in this process are business, marketing, graph, values, growth.
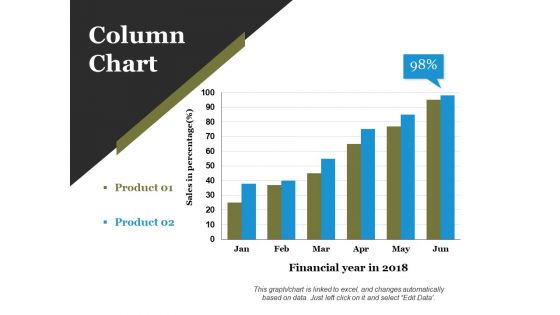
Column Chart Ppt PowerPoint Presentation Infographics Layout Ideas
This is a column chart ppt powerpoint presentation infographics layout ideas. This is a two stage process. The stages in this process are financial year in, business, marketing, growth, graph.
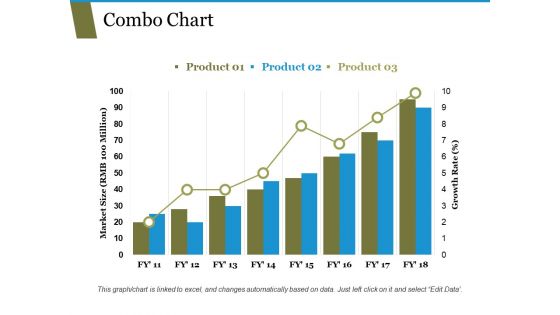
Combo Chart Ppt PowerPoint Presentation Ideas Infographic Template
This is a combo chart ppt powerpoint presentation ideas infographic template. This is a three stage process. The stages in this process are market size growth rate, graph, business, strategy.
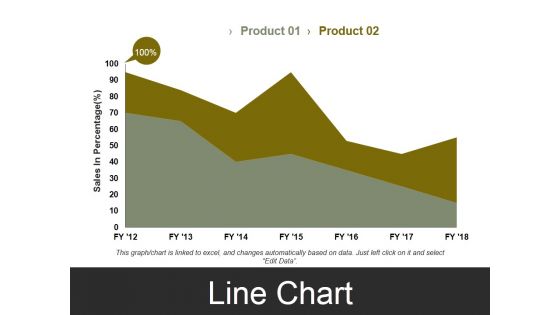
Line Chart Template 3 Ppt PowerPoint Presentation Styles Visual Aids
This is a line chart template 3 ppt powerpoint presentation styles visual aids. This is a two stage process. The stages in this process are sales in percentage, business, marketing, finance, graph.
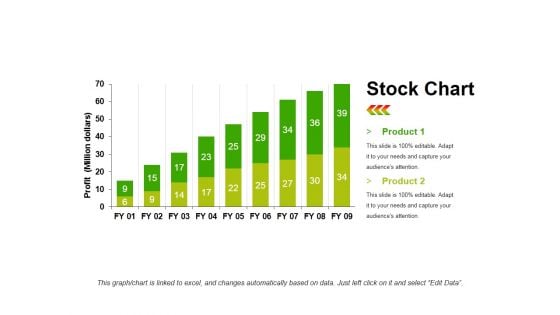
Stock Chart Template 1 Ppt PowerPoint Presentation Infographic Template Objects
This is a stock chart template 1 ppt powerpoint presentation infographic template objects. This is a two stage process. The stages in this process are product, profit, bar graph, growth, success.
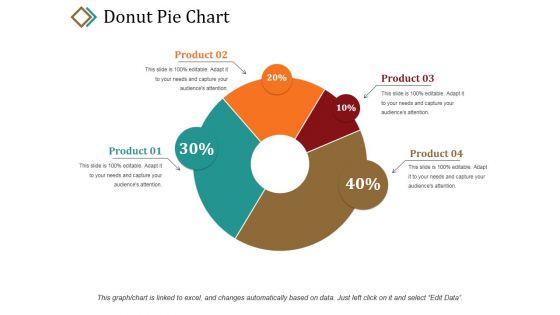
Donut Pie Chart Ppt PowerPoint Presentation Portfolio Graphic Tips
This is a donut pie chart ppt powerpoint presentation portfolio graphic tips. This is a four stage process. The stages in this process are product, percentage, business, marketing, donut.
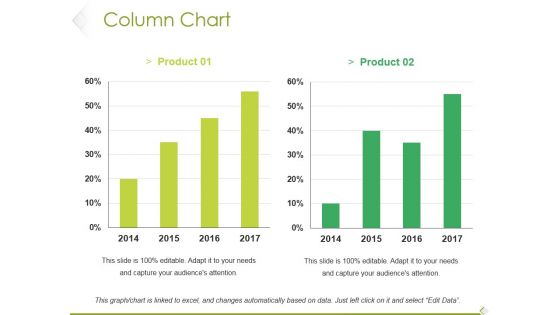
Column Chart Ppt PowerPoint Presentation Model Clipart Images
This is a column chart ppt powerpoint presentation model clipart images. This is a two stage process. The stages in this process are product, bar graph, growth, success, business.
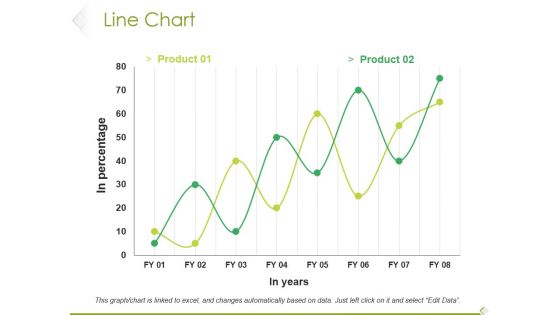
Line Chart Ppt PowerPoint Presentation File Example File
This is a line chart ppt powerpoint presentation file example file. This is a two stage process. The stages in this process are product, in percentage, in years, growth, success.
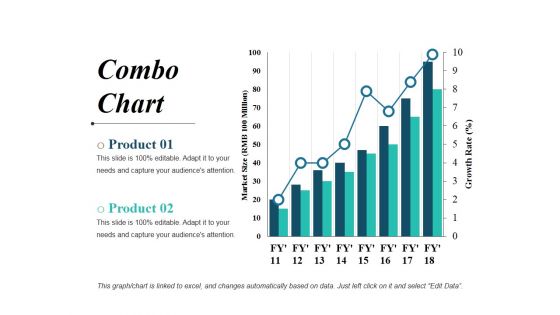
Combo Chart Ppt PowerPoint Presentation File Visual Aids
This is a combo chart ppt powerpoint presentation file visual aids. This is a two stage process. The stages in this process are bar graph, business, marketing, finance, planning.
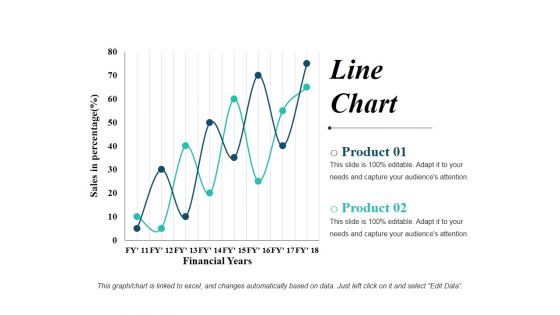
Line Chart Ppt PowerPoint Presentation Show Graphics Design
This is a line chart ppt powerpoint presentation show graphics design. This is a two stage process. The stages in this process are line graph, business, marketing, finance, planning.
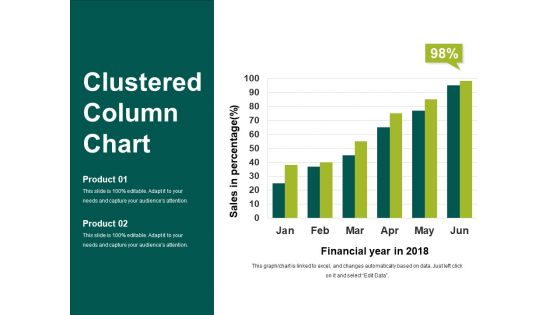
Clustered Column Chart Ppt PowerPoint Presentation Show Slideshow
This is a clustered column chart ppt powerpoint presentation show slideshow. This is a six stage process. The stages in this process are financial year in, sales in percentage, business, marketing, finance.
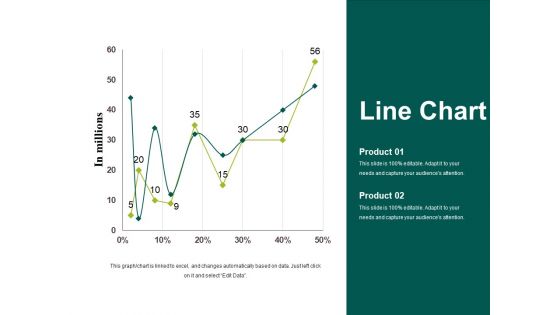
Line Chart Template 1 Ppt PowerPoint Presentation Styles Graphics Tutorials
This is a line chart template 1 ppt powerpoint presentation styles graphics tutorials. This is a two stage process. The stages in this process are in millions, business, marketing, strategy, graph.
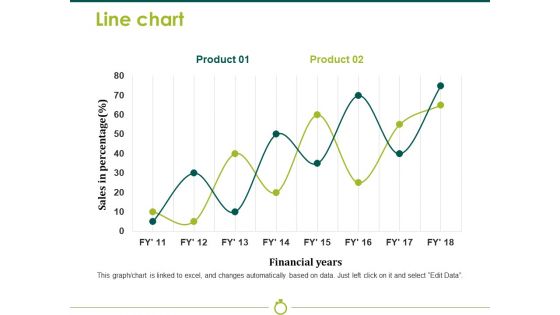
Line Chart Template 2 Ppt PowerPoint Presentation Model Background Image
This is a line chart template 2 ppt powerpoint presentation model background image. This is a two stage process. The stages in this process are sales in percentage, financial years, business, marketing, strategy, graph.

 Home
Home