Process Icon
Economic Control Business Diagram Ppt Presentation Examples
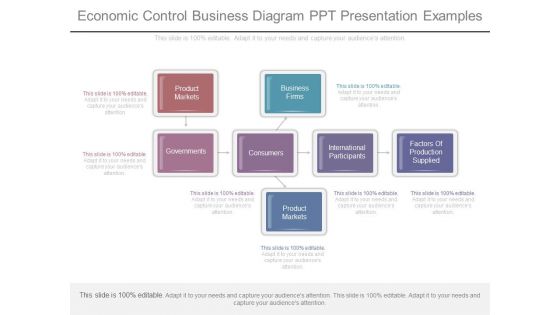
This is a economic control business diagram ppt presentation examples. This is a seven stage process. The stages in this process are product markets, governments, business firms, consumers, international participants, factors of production supplied, product markets.
Strategic Marketing Controlling Diagram Powerpoint Templates Microsoft
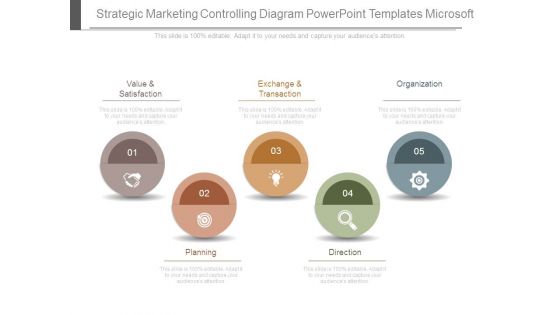
This is a strategic marketing controlling diagram powerpoint templates microsoft. This is a five stage process. The stages in this process are value and satisfaction, planning, exchange and transaction, direction, organization.
Example Of Total Quality Management Systems Diagram Sample Ppt Files
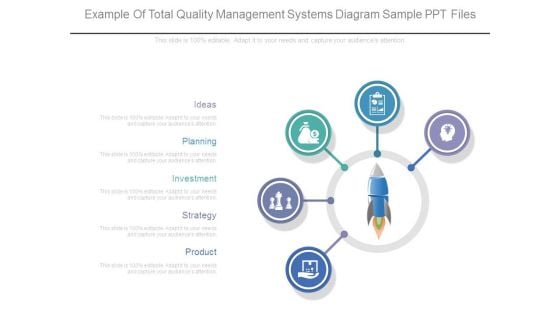
This is a example of total quality management systems diagram sample ppt files. This is a five stage process. The stages in this process are ideas, planning, investment, strategy, product.
Information System Effectiveness Measures Ppt Powerpoint Themes
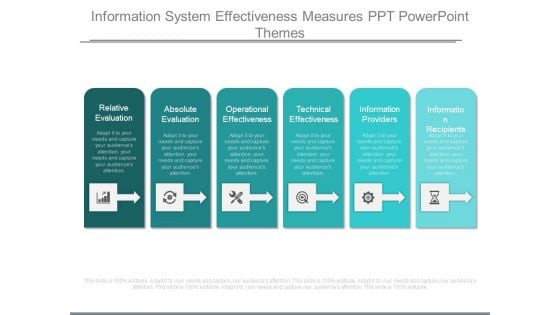
This is a information system effectiveness measures ppt powerpoint themes. This is a six stage process. The stages in this process are relative evaluation, absolute evaluation, operational effectiveness, technical effectiveness, information providers, information recipients.
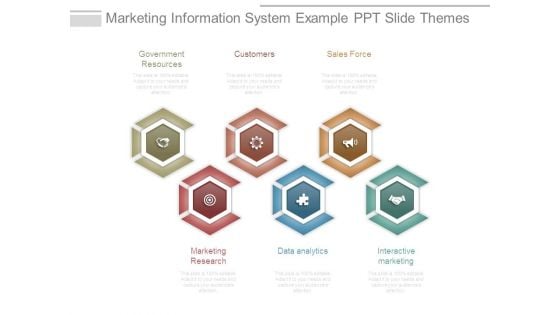
Marketing Information System Example Ppt Slide Themes
This is a marketing information system example ppt slide themes. This is a six stage process. The stages in this process are government resources, customers, sales force, marketing research, data analytics, interactive marketing.
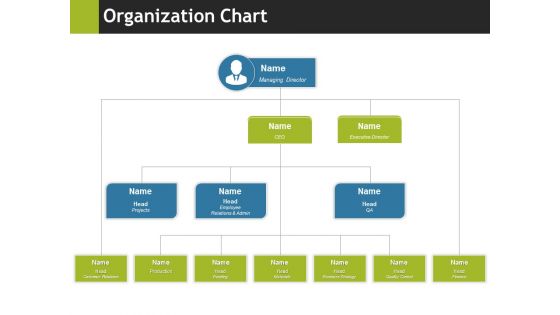
Organization Chart Ppt PowerPoint Presentation Inspiration Slide Download
This is a organization chart ppt powerpoint presentation inspiration slide download. This is a four stage process. The stages in this process are business, marketing, planning, organization chart, management.
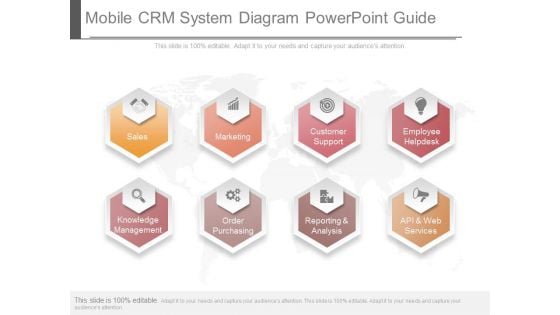
Mobile Crm System Diagram Powerpoint Guide
This is a mobile crm system diagram powerpoint guide. This is a eight stage process. The stages in this process are sales, marketing, customer support, employee helpdesk, knowledge management, order purchasing, reporting and analysis, api and web services.
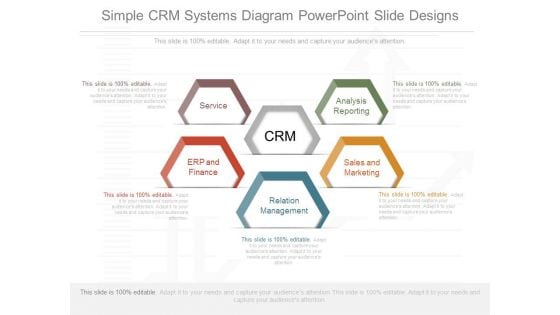
Simple Crm Systems Diagram Powerpoint Slide Designs
This is a simple crm systems diagram powerpoint slide designs. This is a five stage process. The stages in this process are service, erp and finance, analysis reporting, sales and marketing, relation management.
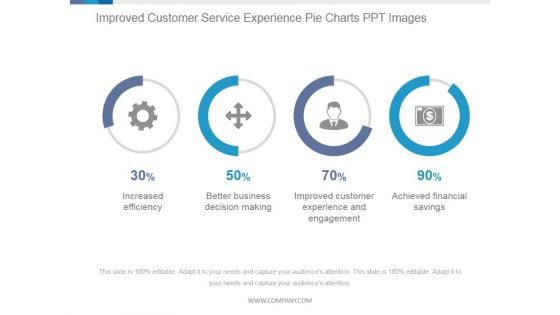
Improved Customer Service Experience Pie Charts Ppt PowerPoint Presentation Templates
This is a improved customer service experience pie charts ppt powerpoint presentation templates. This is a four stage process. The stages in this process are increased efficiency, better business decision making, improved customer experience and engagement, achieved financial savings.
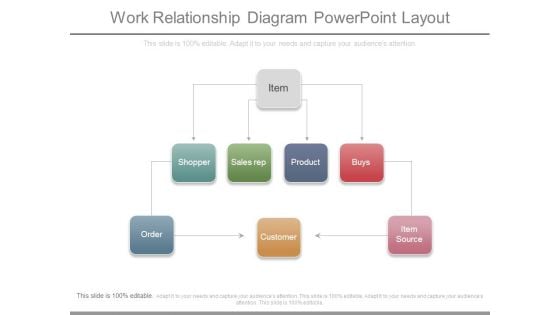
Work Relationship Diagram Powerpoint Layout
This is a work relationship diagram powerpoint layout. This is a seven stage process. The stages in this process are item, shopper, sales rep, product, buys, order, customer, item source.
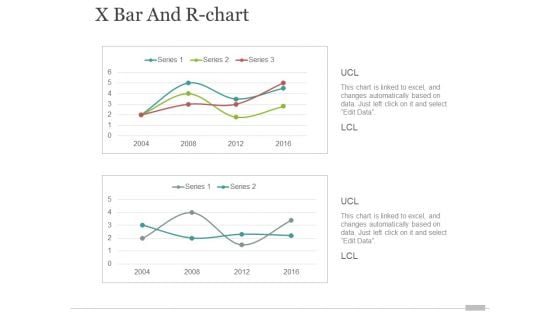
x bar and r chart ppt powerpoint presentation portfolio elements
This is a x bar and r chart ppt powerpoint presentation portfolio elements. This is a two stage process. The stages in this process are finance, business, marketing, growth.
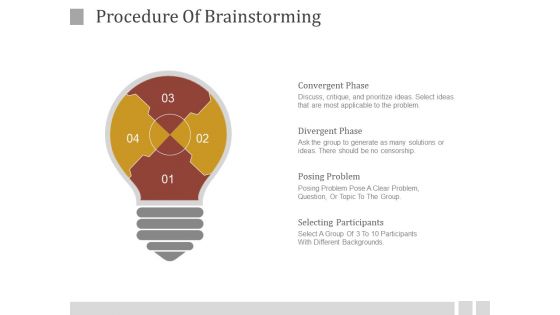
Procedure Of Brainstorming Ppt PowerPoint Presentation Styles
This is a procedure of brainstorming ppt powerpoint presentation styles. This is a three stage process. The stages in this process are convergent phase, divergent phase, posing problem, selecting participants.
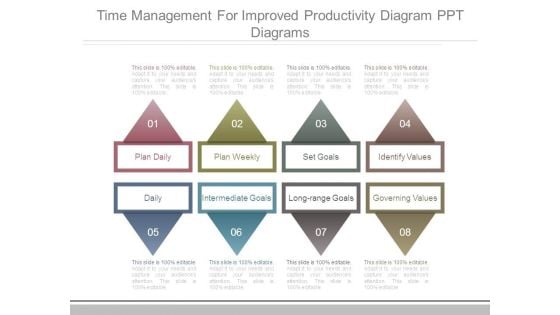
Time Management For Improved Productivity Diagram Ppt Diagrams
This is a time management for improved productivity diagram ppt diagrams. This is a eight stage process. The stages in this process are plan daily, plan weekly, set goals, identify values, daily, intermediate goals, long range goals, governing values.
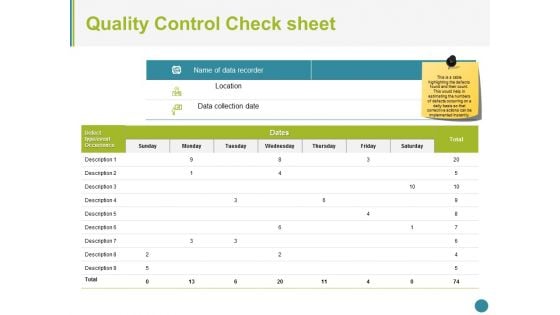
Quality Control Check Sheet Ppt PowerPoint Presentation Pictures Themes
This is a quality control check sheet ppt powerpoint presentation pictures themes. This is a seven stage process. The stages in this process are business, management, analysis, strategy, marketing.

Competence Cycle For Business Excellence Chart Powerpoint Layout
This is a competence cycle for business excellence chart powerpoint layout. This is a four stage process. The stages in this process are confidence competence cycle, competence, comfort, control, confidence.
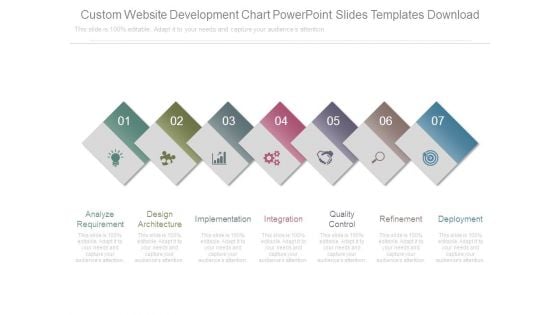
Custom Website Development Chart Powerpoint Slides Templates Download
This is a custom website development chart powerpoint slides templates download. This is a six stage process. The stages in this process are analyze requirement, design architecture, implementation, integration, quality control, refinement, deployment.
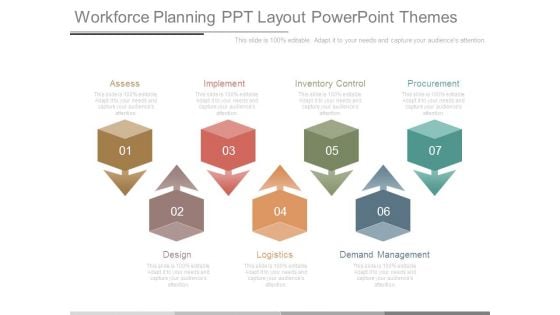
Workforce Planning Ppt Layout Powerpoint Themes
This is a workforce planning ppt layout powerpoint themes. This is a seven stage process. The stages in this process are assess, design, implement, inventory control, procurement, logistics, demand management.
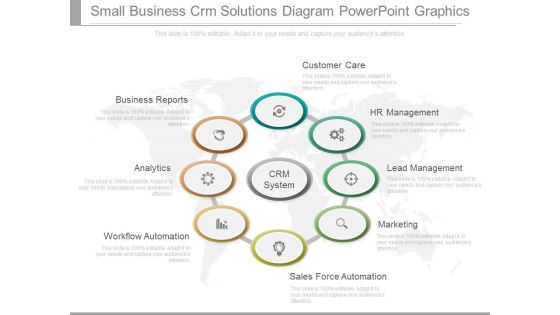
Small Business Crm Solutions Diagram Powerpoint Graphics
This is a small business crm solutions diagram powerpoint graphics. This is a eight stage process. The stages in this process are business reports, analytics, workflow automation, sales force automation, marketing, lead management, hr management, customer care, crm system.

Curve Chart For Product Life Cycle Presentation Outline
This is a curve chart for product life cycle presentation outline. This is a five stage process. The stages in this process are sales over time, product extension, introduction, growth, maturity, decline, time.
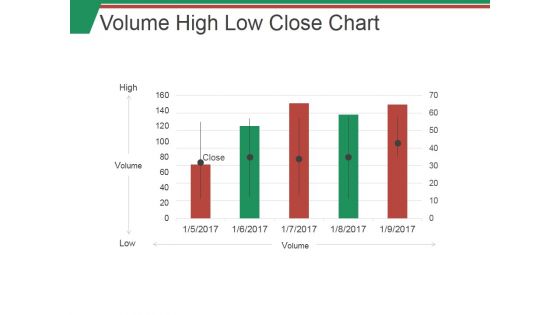
Volume High Low Close Chart Ppt PowerPoint Presentation Outline Examples
This is a volume high low close chart ppt powerpoint presentation outline examples. This is a five stage process. The stages in this process are high, low, volume, graph, business.
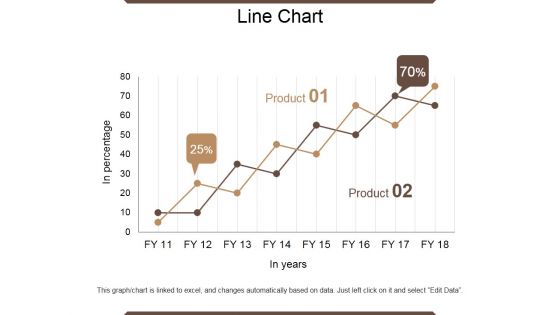
Line Chart Ppt PowerPoint Presentation Outline Infographic Template
This is a line chart ppt powerpoint presentation outline infographic template. This is a two stage process. The stages in this process are in percentage, product, in year, growth, success.
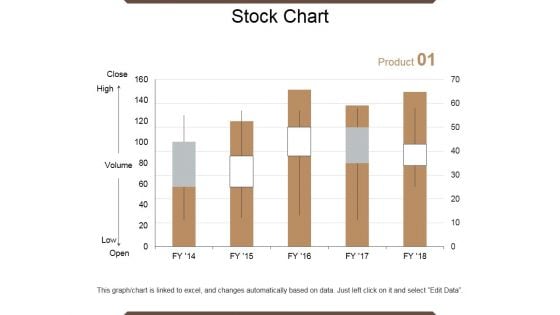
Stock Chart Ppt PowerPoint Presentation Outline Graphics Example
This is a stock chart ppt powerpoint presentation outline graphics example. This is a five stage process. The stages in this process are close, volume, low, high, open, product.
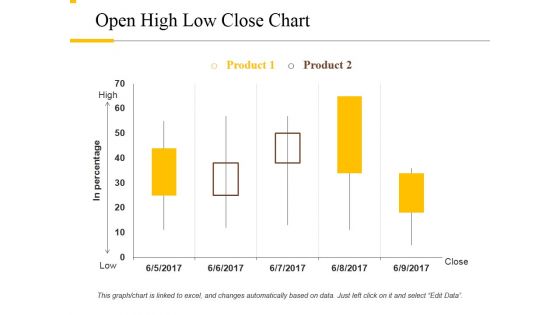
Open High Low Close Chart Ppt PowerPoint Presentation Outline Rules
This is a open high low close chart ppt powerpoint presentation outline rules. This is a two stage process. The stages in this process are product, high, low, close, in percentage.
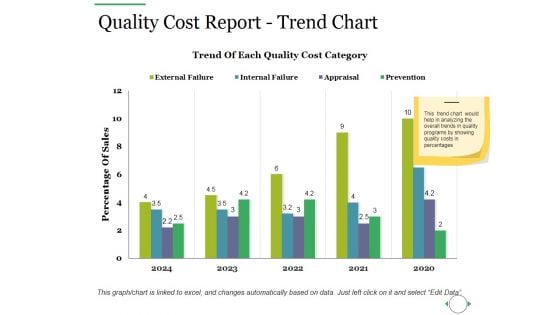
Quality Cost Report Trend Chart Ppt PowerPoint Presentation Outline Guidelines
This is a quality cost report trend chart ppt powerpoint presentation outline guidelines. This is a two stage process. The stages in this process are quality cost, appraisal cost, internal failure cost, external failure cost.
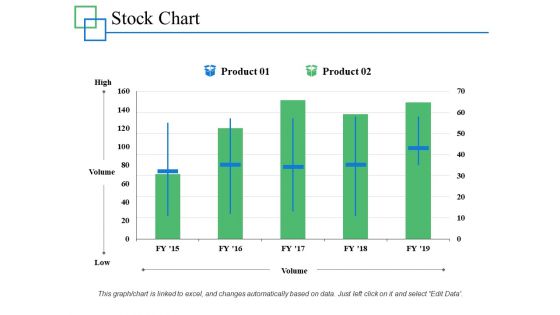
Stock Chart Management Investment Ppt PowerPoint Presentation Infographics Professional
This is a stock chart management investment ppt powerpoint presentation infographics professional. This is a two stage process. The stages in this process are marketing, business, management, percentage, product.
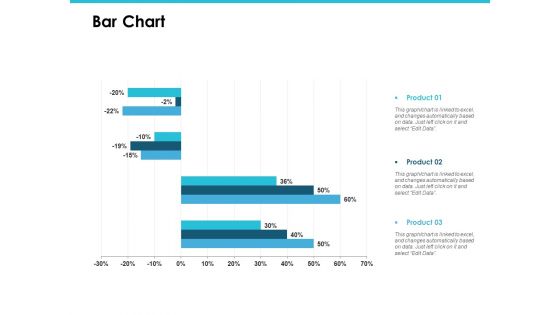
Bar Chart Management Investment Ppt PowerPoint Presentation File Rules
This is a bar chart management investment ppt powerpoint presentation file rules. This is a three stage process. The stages in this process are finance, marketing, management, investment, analysis.
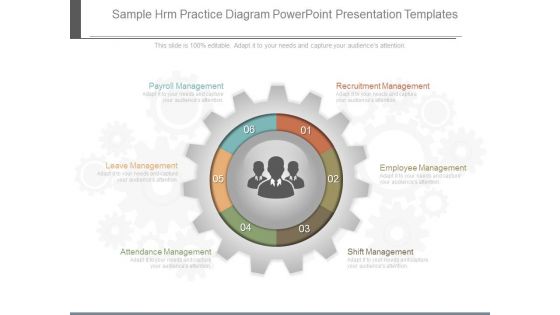
Sample Hrm Practice Diagram Powerpoint Presentation Templates
This is a sample hrm practice diagram powerpoint presentation templates. This is a six stage process. The stages in this process are recruitment management, employee management, shift management, attendance management, leave management, payroll management.
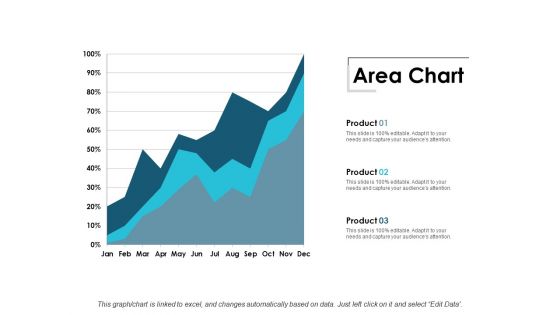
Area Chart Finance Ppt Powerpoint Presentation Slides Picture
This is a area chart finance ppt powerpoint presentation slides picture. This is a three stage process. The stages in this process are area chart, finance, marketing, management, investment.
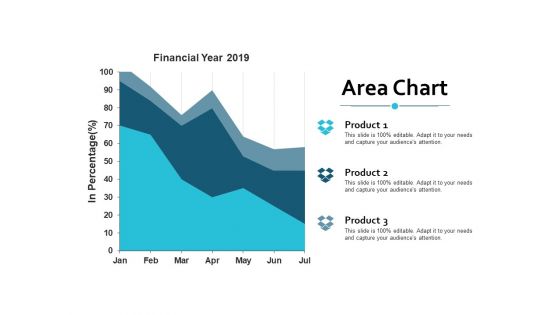
Area Chart Finance Ppt Powerpoint Presentation Inspiration Example
This is a area chart finance ppt powerpoint presentation inspiration example. This is a three stage process. The stages in this process are area chart, finance, marketing, management, investment.
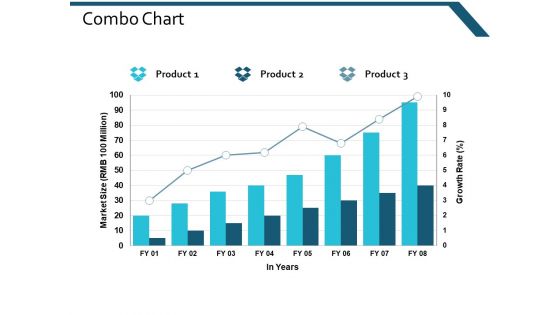
Combo Chart Finance Marketing Ppt Powerpoint Presentation Layouts Inspiration
This is a combo chart finance marketing ppt powerpoint presentation layouts inspiration. This is a three stage process. The stages in this process are combo chart, finance, marketing, management, analysis.
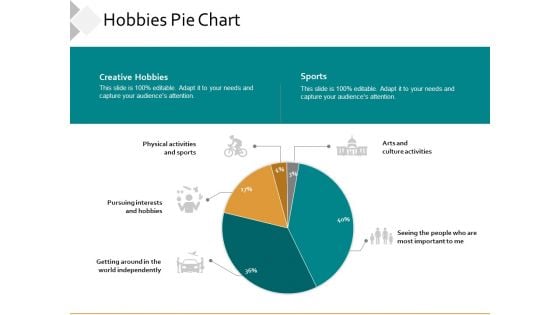
Hobbies Pie Chart Ppt PowerPoint Presentation Show Smartart
This is a hobbies pie chart ppt powerpoint presentation show smartart. This is a five stage process. The stages in this process are financial, business, marketing, management, pie chart.
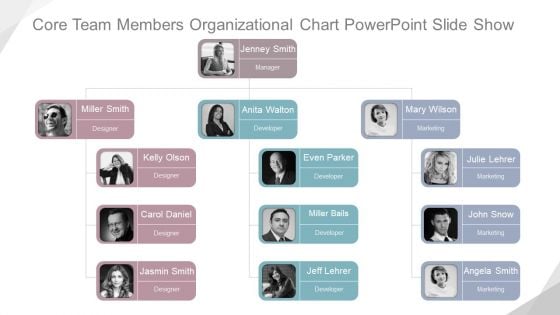
Core Team Members Organizational Chart Ppt PowerPoint Presentation Background Designs
This is a core team members organizational chart ppt powerpoint presentation background designs. This is a five stage process. The stages in this process are manager, designer, developer, marketing.
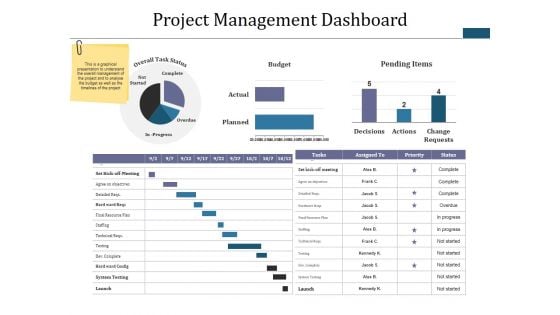
Project Management Dashboard Ppt PowerPoint Presentation Infographic Template Diagrams
This is a project management dashboard ppt powerpoint presentation infographic template diagrams. This is a three stage process. The stages in this process are budget, pending items, complete, overdue, not started.
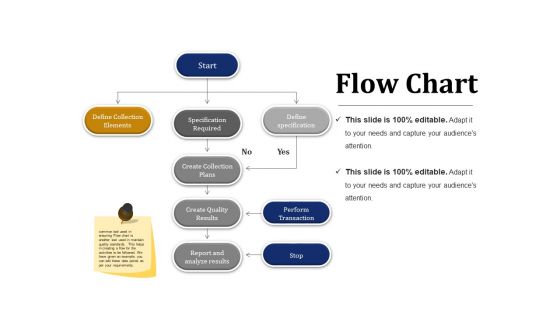
Flow Chart Ppt PowerPoint Presentation Professional Design Templates
This is a flow chart ppt powerpoint presentation professional design templates. This is a three stage process. The stages in this process are define collection elements, specification required, define specification, create collection plans, create quality results.
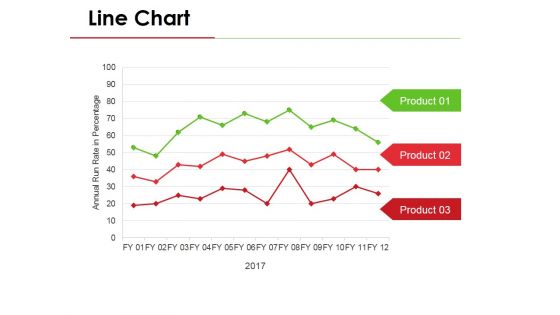
Line Chart Ppt PowerPoint Presentation Visual Aids Pictures
This is a line chart ppt powerpoint presentation visual aids pictures. This is a three stage process. The stages in this process are business, marketing, line chart, analysis, growth.
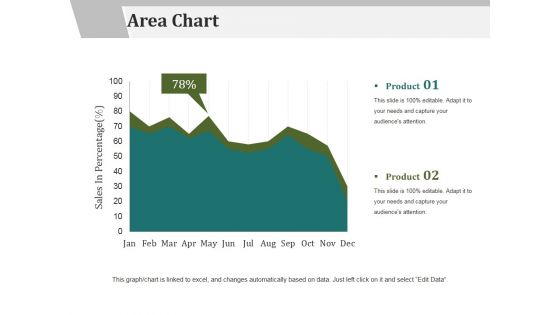
Area Chart Ppt PowerPoint Presentation Infographics Graphics Tutorials
This is a area chart ppt powerpoint presentation infographics graphics tutorials. This is a two stage process. The stages in this process are product, area chart, sales in percentage.
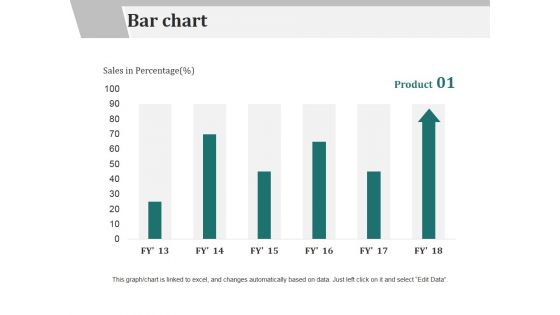
Bar Chart Ppt PowerPoint Presentation Slides Design Ideas
This is a bar chart ppt powerpoint presentation slides design ideas. This is a six stage process. The stages in this process are product, bar chart, sales in percentage.
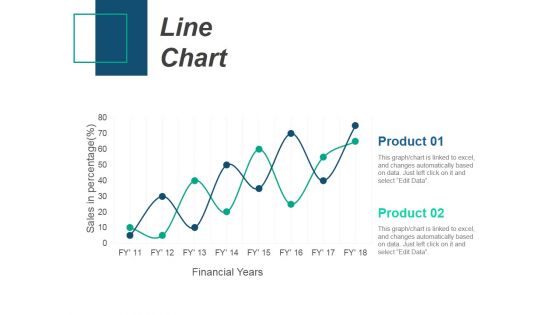
Line Chart Ppt PowerPoint Presentation Infographic Template Introduction
This is a line chart ppt powerpoint presentation infographic template introduction. This is a two stage process. The stages in this process are product, sales in percentage, financial years, line chart.
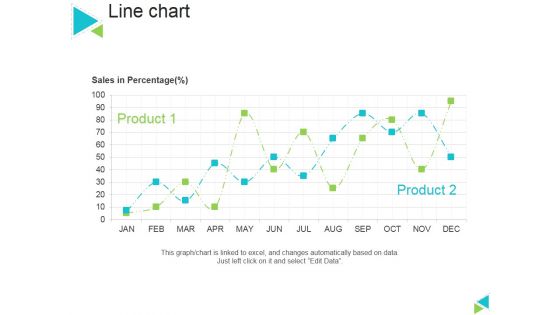
Line Chart Ppt PowerPoint Presentation Gallery Master Slide
This is a line chart ppt powerpoint presentation gallery master slide. This is a two stage process. The stages in this process are sales in percentage, product, line chart.
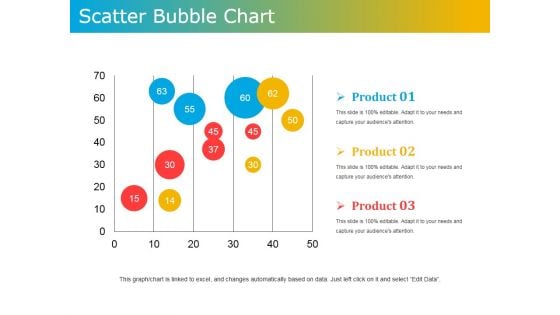
Scatter Bubble Chart Ppt PowerPoint Presentation Ideas Design Templates
This is a scatter bubble chart ppt powerpoint presentation ideas design templates. This is a three stage process. The stages in this process are product, scatter, bubble chart, business, marketing.
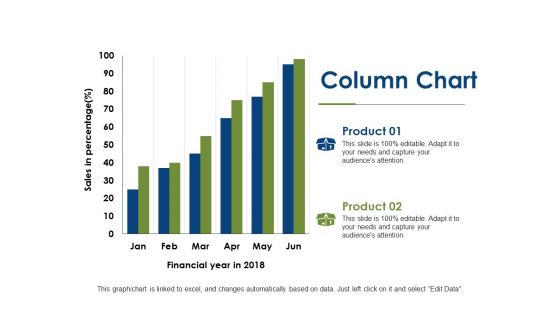
Column Chart Finance Ppt PowerPoint Presentation Infographics Backgrounds
This is a column chart finance ppt powerpoint presentation infographics backgrounds. This is a two stage process. The stages in this process are column chart, investment, marketing, finance, analysis.
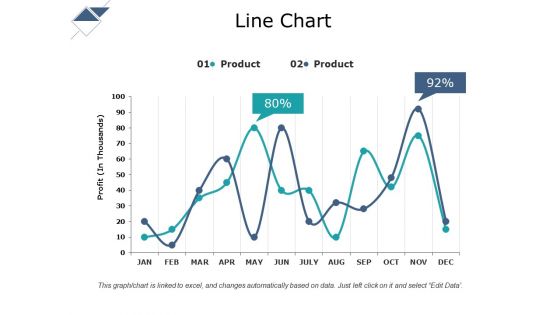
Line Chart Ppt PowerPoint Presentation Gallery Format Ideas
This is a line chart ppt powerpoint presentation gallery format ideas. This is a two stage process. The stages in this process are line chart, product, in year, profit.
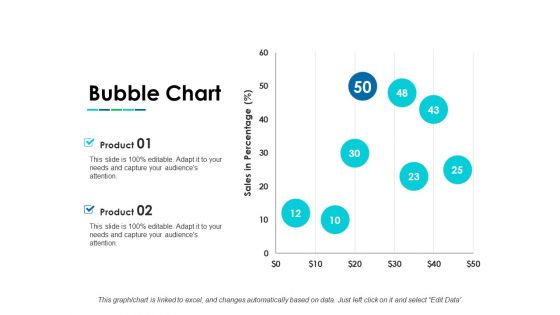
Bubble Chart Ppt PowerPoint Presentation Infographic Template Layouts
This is a bubble chart ppt powerpoint presentation infographic template layouts. This is a two stage process. The stages in this process are bubble chart, product, sales in percentage, growth.

Column Chart Ppt PowerPoint Presentation Gallery Background Images
This is a column chart ppt powerpoint presentation gallery background images. This is a two stage process. The stages in this process are column chart, product, year, growth, expenditure.
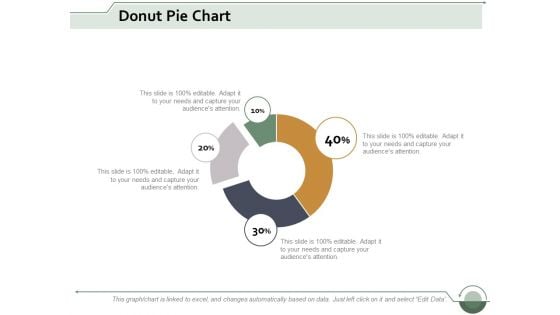
donut pie chart investment ppt powerpoint presentation show guide
This is a donut pie chart investment ppt powerpoint presentation show guide. This is a four stage process. The stages in this process are donut pie chart, finance, marketing, business, analysis.
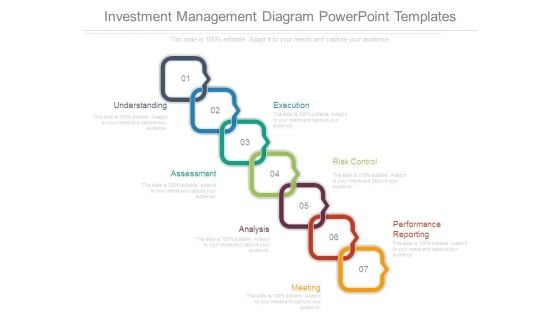
Investment Management Diagram Powerpoint Templates
This is a investment management diagram powerpoint templates. This is a seven stage process. The stages in this process are understanding, execution, risk control, performance reporting, meeting, analysis, assessment.
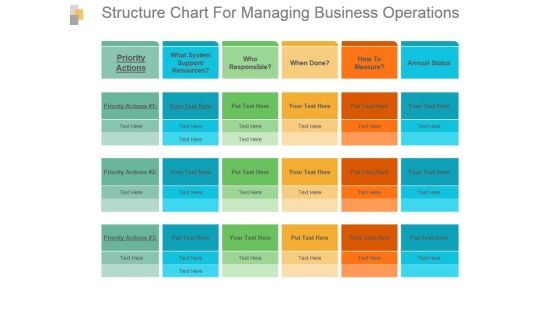
Structure Chart For Managing Business Operations Ppt Slide
This is a structure chart for managing business operations ppt slide. This is a six stage process. The stages in this process are priority actions, what system support resources, who responsible, when done, how to measure, annual status.

Magnifying Glass With Lens For Research Work Ppt PowerPoint Presentation Shapes
This is a magnifying glass with lens for research work ppt powerpoint presentation shapes. This is a six stage process. The stages in this process are magnifying glass, lens, research work, strategy, management, technology.
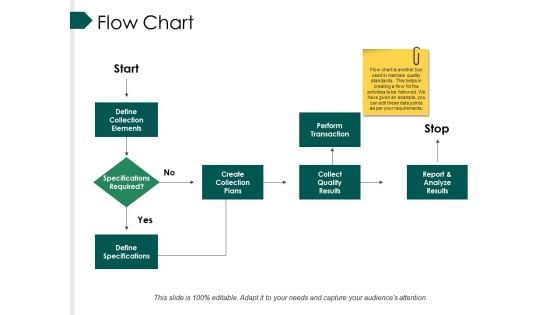
Flow Chart Ppt PowerPoint Presentation Infographic Template Mockup
This is a flow chart ppt powerpoint presentation infographic template mockup. This is a four stage process. The stages in this process are define collection elements, create collection plans, perform, transaction, collect quality results.
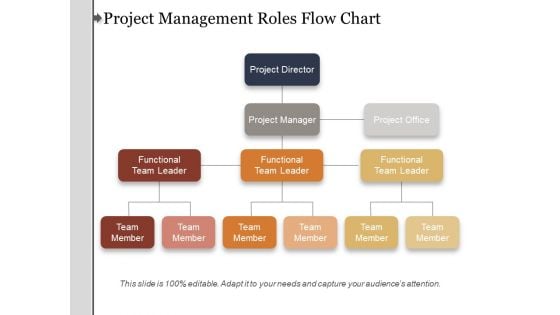
Project Management Roles Flow Chart Ppt PowerPoint Presentation Summary Aids
This is a project management roles flow chart ppt powerpoint presentation summary aids. This is a four stage process. The stages in this process are organization chart, org chart, project team structure.
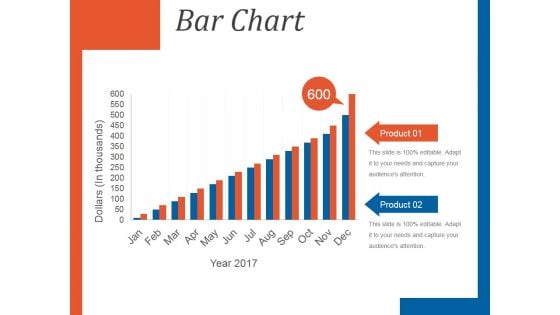
Bar Chart Template 1 Ppt PowerPoint Presentation Background Images
This is a bar chart template 1 ppt powerpoint presentation background images. This is a twelve stage process. The stages in this process are product, bar chart, dollars, year.
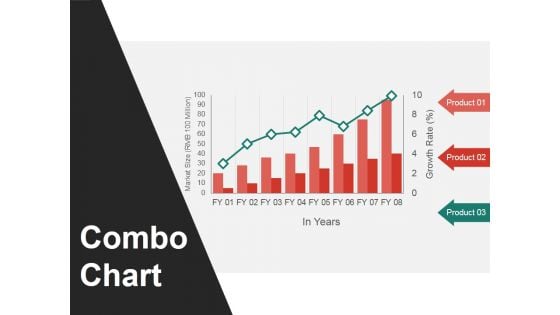
Combo Chart Ppt PowerPoint Presentation Gallery Visual Aids
This is a combo chart ppt powerpoint presentation gallery visual aids. This is a three stage process. The stages in this process are combo chart, in years, market size, product.
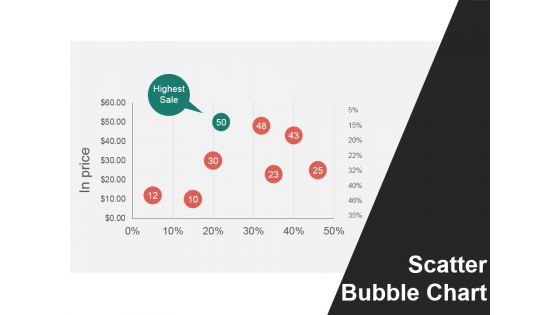
Scatter Bubble Chart Ppt PowerPoint Presentation Show Infographic Template
This is a scatter bubble chart ppt powerpoint presentation show infographic template. This is a six stage process. The stages in this process are in price, scatter bubble chart, highest sale.
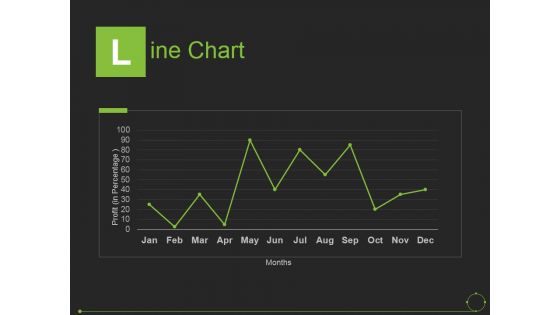
Line Chart Ppt PowerPoint Presentation File Graphics Tutorials
This is a line chart ppt powerpoint presentation file graphics tutorials. This is a one stage process. The stages in this process are months, line chart, bar graph, business, marketing.
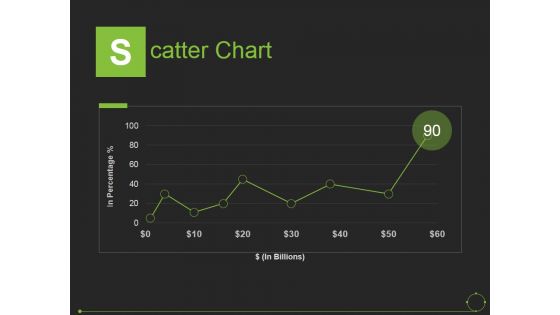
Scatter Chart Ppt PowerPoint Presentation Show Graphic Images
This is a scatter chart ppt powerpoint presentation show graphic images. This is a one stage process. The stages in this process are in percentage, in billions, scatter chart.
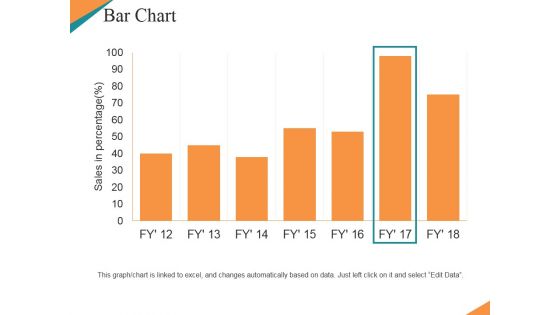
Bar Chart Ppt PowerPoint Presentation Ideas Graphic Tips
This is a bar chart ppt powerpoint presentation ideas graphic tips. This is a seven stage process. The stages in this process are sales in percentage, bar chart, growth, business, marketing.
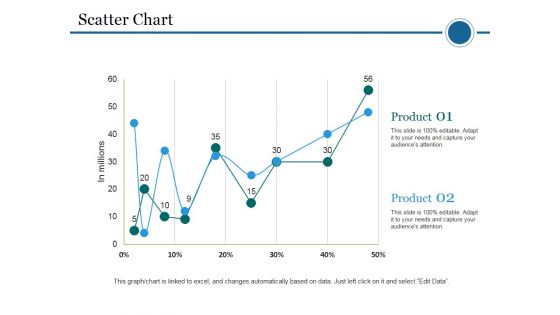
Scatter Chart Template 2 Ppt PowerPoint Presentation Portfolio Skills
This is a scatter chart template 2 ppt powerpoint presentation portfolio skills. This is a two stage process. The stages in this process are scatter chart, in millions, product, business, marketing.
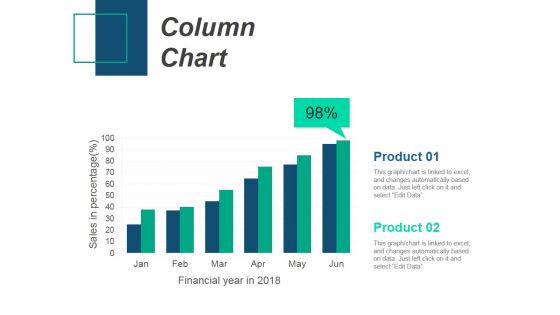
Column Chart Ppt PowerPoint Presentation Gallery Design Inspiration
This is a column chart ppt powerpoint presentation gallery design inspiration. This is a two stage process. The stages in this process are column chart, product, sales in percentage, financial years.
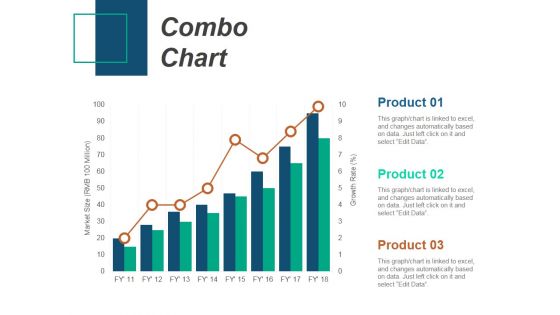
Combo Chart Ppt PowerPoint Presentation Summary Background Image
This is a combo chart ppt powerpoint presentation summary background image. This is a three stage process. The stages in this process are combo chart, product, growth rate, market size.
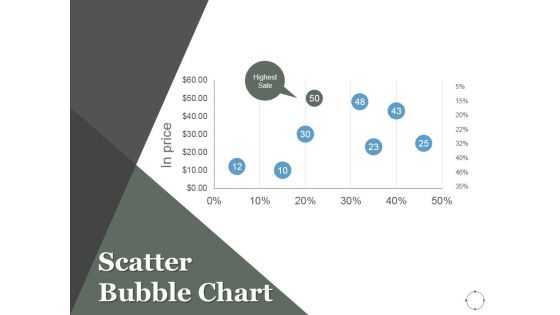
Scatter Bubble Chart Ppt PowerPoint Presentation Background Designs
This is a scatter bubble chart ppt powerpoint presentation background designs. This is a eight stage process. The stages in this process are projects, marketing, scatter chart, finance, management.
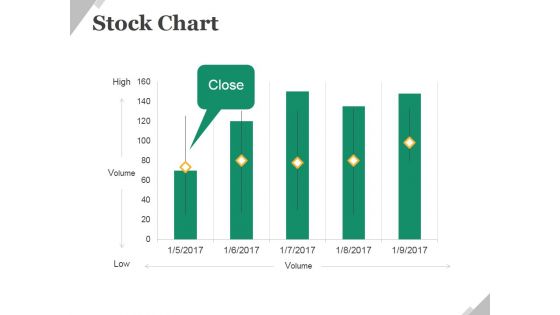
Stock Chart Ppt PowerPoint Presentation Slides Example File
This is a stock chart ppt powerpoint presentation slides example file. This is a five stage process. The stages in this process are business, finance, stock chart, management, planning.
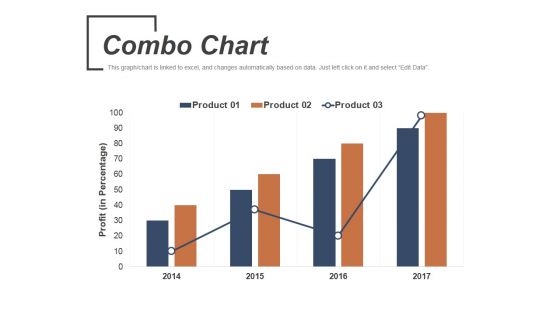
Combo Chart Ppt PowerPoint Presentation Infographic Template Demonstration
This is a combo chart ppt powerpoint presentation infographic template demonstration. This is a four stage process. The stages in this process are combo chart, management, planning, strategy, marketing.
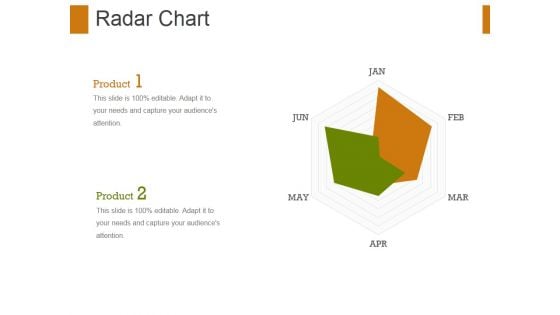
Radar Chart Ppt PowerPoint Presentation Show Graphic Tips
This is a radar chart ppt powerpoint presentation show graphic tips. This is a two stage process. The stages in this process are radar chart, finance, management, marketing, business, analysis.
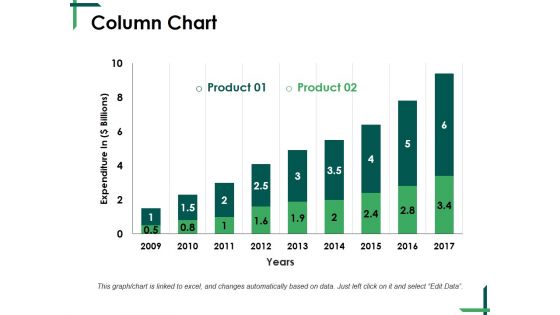
Column Chart Ppt PowerPoint Presentation Gallery Graphics Pictures
This is a column chart ppt powerpoint presentation gallery graphics pictures. This is a two stage process. The stages in this process are column chart, finance, planning, analysis, management, growth.
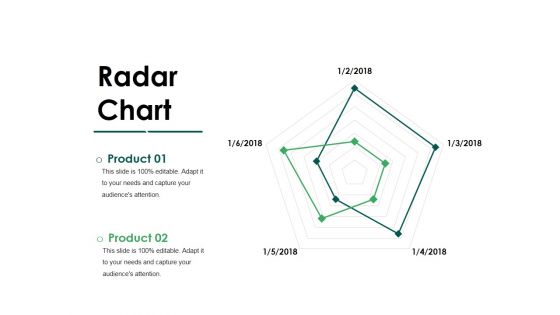
Radar Chart Ppt PowerPoint Presentation Inspiration File Formats
This is a radar chart ppt powerpoint presentation inspiration file formats. This is a two stage process. The stages in this process are radar chart, business, finance, management, analysis.
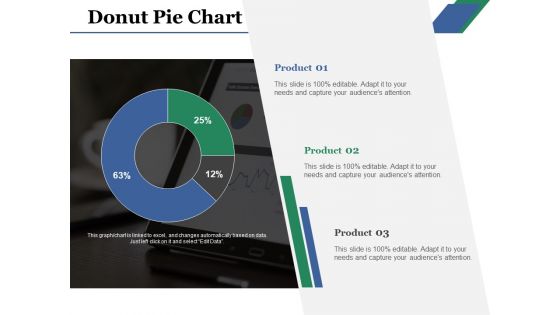
Donut Pie Chart Ppt PowerPoint Presentation Gallery Gridlines
This is a donut pie chart ppt powerpoint presentation gallery gridlines. This is a three stage process. The stages in this process are donut pie chart, product, business, management, analysis.
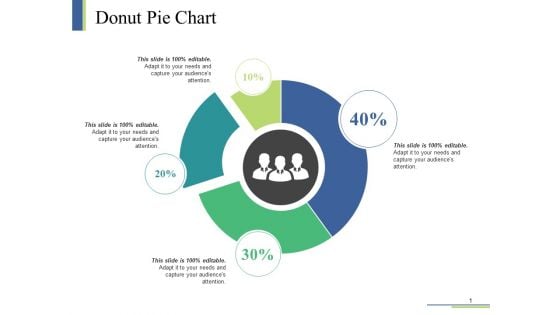
Donut Pie Chart Ppt PowerPoint Presentation Visual Aids Infographic Template
This is a donut pie chart ppt powerpoint presentation visual aids infographic template. This is a four stage process. The stages in this process are donut pie chart, finance, planning, management, marketing.
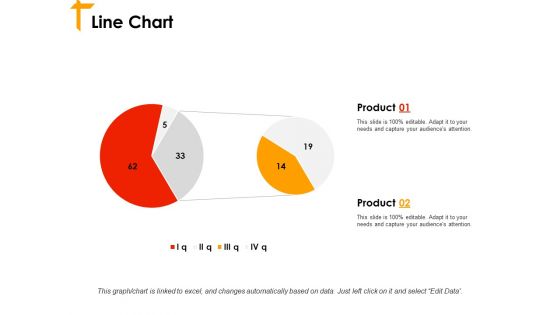
Line Chart Ppt PowerPoint Presentation Styles Format Ideas
This is a line chart ppt powerpoint presentation styles format ideas. This is a two stage process. The stages in this process are line chart, financial, business, planning, marketing, management.

Area Chart Finance Ppt PowerPoint Presentation Show Brochure
This is a area chart finance ppt powerpoint presentation show brochure. This is a two stage process. The stages in this process are area chart, finance, marketing, management, investment.
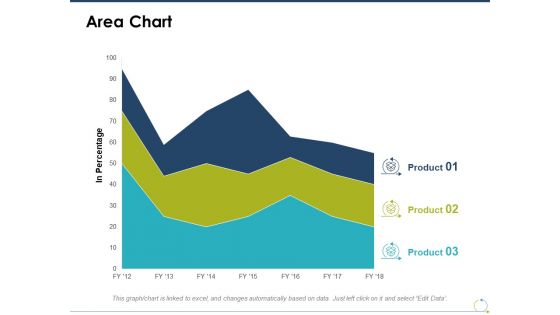
Area Chart Investment Ppt PowerPoint Presentation Gallery Example Introduction
This is a area chart investment ppt powerpoint presentation gallery example introduction. This is a three stage process. The stages in this process are area chart, finance, marketing, management, investment.

Area Chart Product Percentage Ppt PowerPoint Presentation Infographic Template Slide
This is a area chart product percentage ppt powerpoint presentation infographic template slide. This is a four stage process. The stages in this process are area chart, finance, marketing, management, investment.

Area Chart Percentage Ppt PowerPoint Presentation Portfolio Pictures
This is a area chart percentage ppt powerpoint presentation portfolio pictures. This is a three stage process. The stages in this process are area chart, finance, marketing, management, investment.
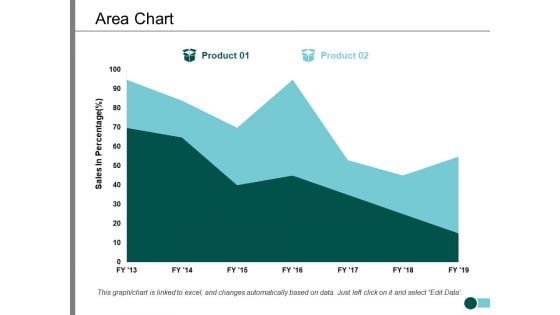
Area Chart Percentage Product Ppt PowerPoint Presentation Infographic Template Slide
This is a area chart percentage product ppt powerpoint presentation infographic template slide. This is a two stage process. The stages in this process are area chart, finance, marketing, management, investment.
Timeline Ppt Template 3 Staged Business Infographics
Document The Process On Our Timeline Ppt Template 3 Staged Business Infographics Powerpoint Templates. Make A Record Of Every Detail.
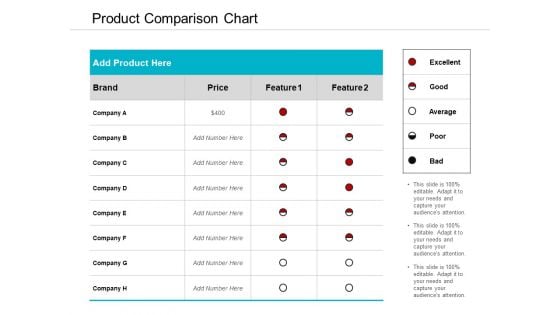
Product Comparison Chart Ppt Powerpoint Presentation Styles Background Designs
This is a product comparison chart ppt powerpoint presentation styles background designs. This is a two stage process. The stages in this process are comparison chart, comparison table, comparison matrix.
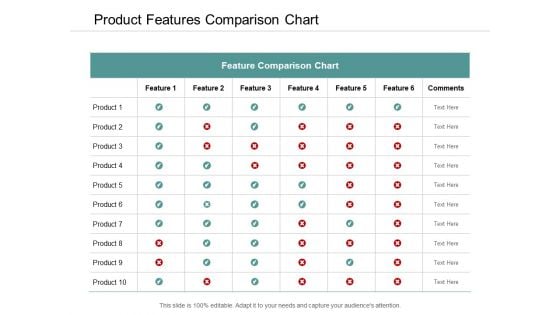
Product Features Comparison Chart Ppt Powerpoint Presentation Model Template
This is a product features comparison chart ppt powerpoint presentation model template. This is a six stage process. The stages in this process are comparison chart, comparison table, comparison matrix.
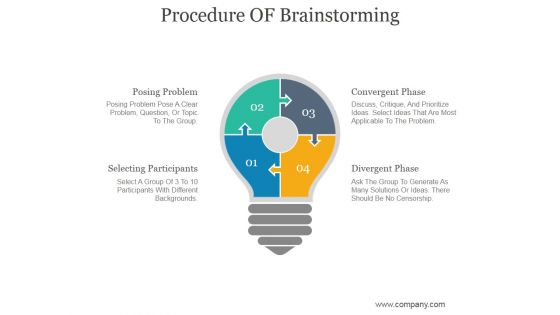
Procedure OF Brainstorming Ppt PowerPoint Presentation Sample
This is a procedure of brainstorming ppt powerpoint presentation sample. This is a four stage process. The stages in this process are posing problem, selecting participants, divergent phase, convergent phase.
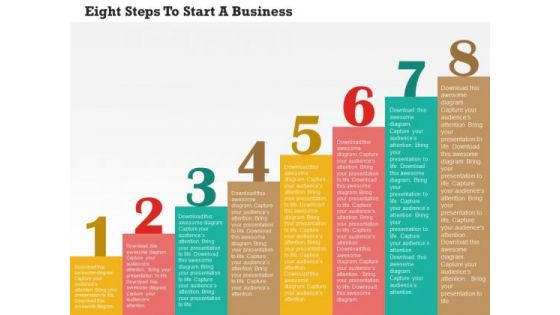
Business Diagram Eight Steps To Start A Business PowerPoint Templates
Eight staged process diagram has been used to design this power point template. This diagram contains steps to chart a business process. Use this diagram for business presentations and create an impact.
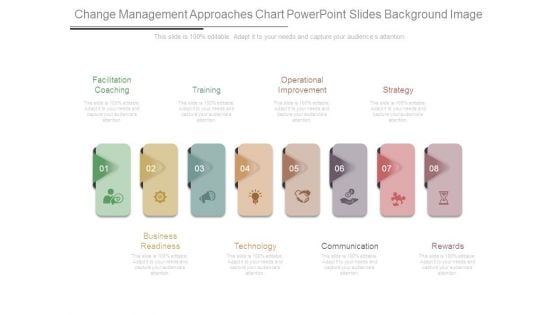
Change Management Approaches Chart Powerpoint Slides Background Image
This is a change management approaches chart powerpoint slides background image. This is a eight stage process. The stages in this process are facilitation coaching, training, operational improvement, strategy, business readiness, technology, communication, rewards.

Data Collection Scatter Diagram Ppt PowerPoint Presentation Gallery Graphics Example
This is a data collection scatter diagram ppt powerpoint presentation gallery graphics example. This is a three stage process. The stages in this process are line chart, finance, marketing, management, investment.
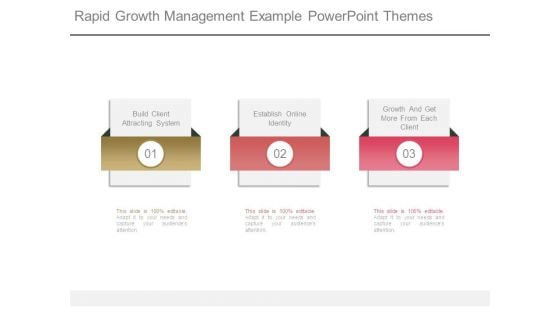
Rapid Growth Management Example Powerpoint Themes
This is a rapid growth management example powerpoint themes. This is a three stage process. The stages in this process are build client attracting system, establish online identity, growth and get more from each client.
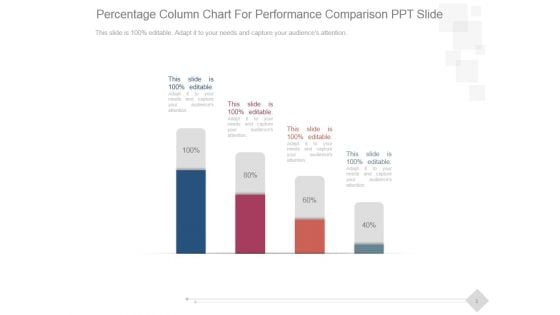
Percentage Column Chart For Performance Comparison Ppt PowerPoint Presentation Good
This is a percentage column chart for performance comparison ppt powerpoint presentation good. This is a four stage process. The stages in this process are business, marketing, technology, presentation, management.
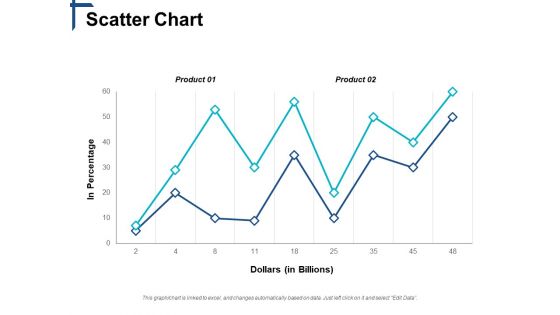
Scatter Chart Competitive Differentiation Ppt PowerPoint Presentation Show Slides
This is a scatter chart competitive differentiation ppt powerpoint presentation show slides. This is a two stage process. The stages in this process are business, management, marketing, strategy, sales.
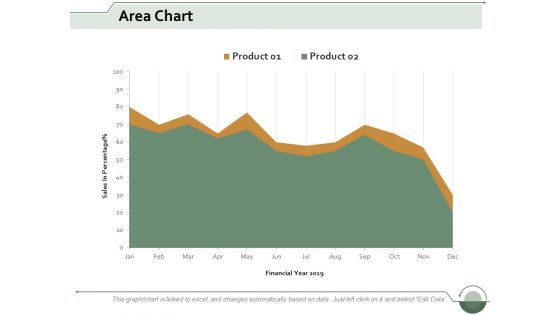
Area Chart Finance Ppt Powerpoint Presentation Infographic Template Clipart Images
This is a area chart finance ppt powerpoint presentation infographic template clipart images. This is a two stage process. The stages in this process are area bar, finance, marketing, management, analysis.
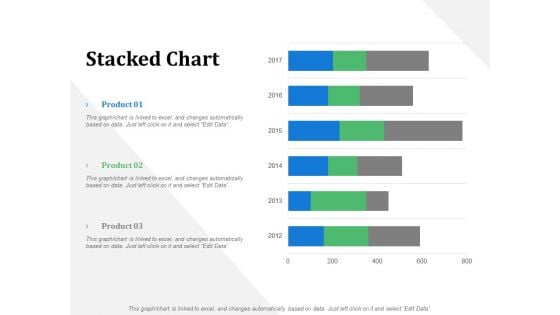
Stacked Chart Business Marketing Ppt PowerPoint Presentation File Design Ideas
This is a stacked chart business marketing ppt powerpoint presentation file design ideas. This is a three stage process. The stages in this process are business, management, marketing, product, percentage.
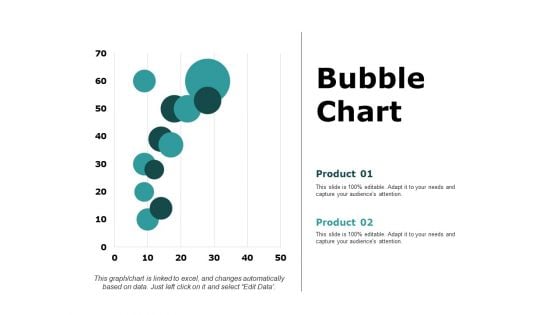
Bubble Chart Percentage Product Ppt PowerPoint Presentation Ideas Aids
This is a bubble chart percentage product ppt powerpoint presentation ideas aids. This is a two stage process. The stages in this process are business, management, marketing, percentage, product.
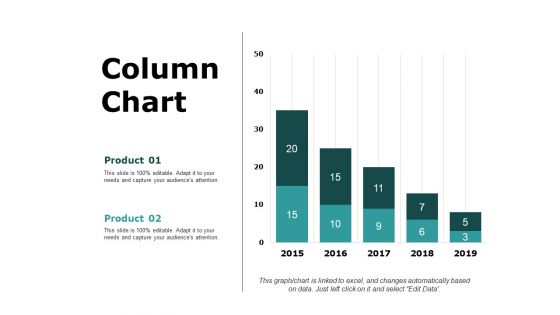
Column Chart Finance Marketing Ppt PowerPoint Presentation Model Example Introduction
This is a column chart finance marketing ppt powerpoint presentation model example introduction. This is a two stage process. The stages in this process are business, management, marketing, percentage, product.
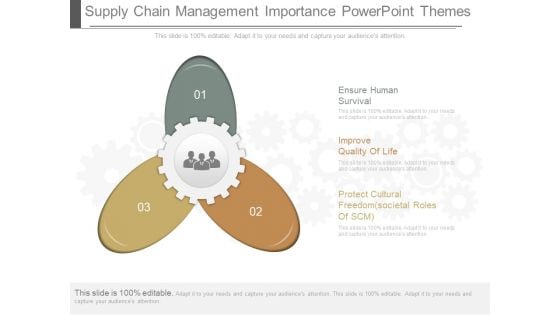
Supply Chain Management Importance Powerpoint Themes
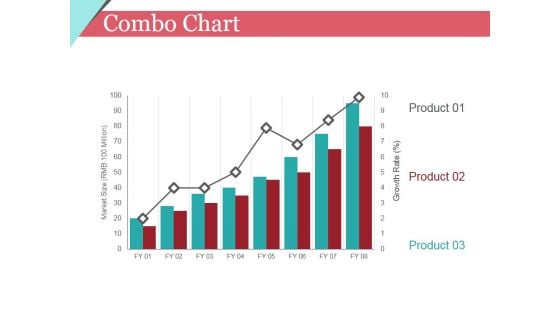
Combo Chart Ppt PowerPoint Presentation Summary Graphics Tutorials
This is a combo chart ppt powerpoint presentation summary graphics tutorials. This is a eight stage process. The stages in this process are product, growth rate, market size, business.
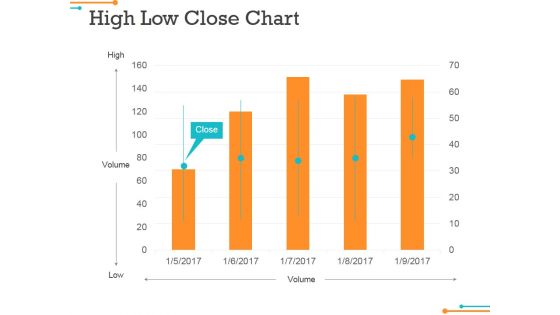
High Low Close Chart Ppt Powerpoint Presentation Gallery Slides
This is a high low close chart ppt powerpoint presentation gallery slides. This is a five stage process. The stages in this process are close, volume, high, low, graph.

High Low Close Chart Ppt PowerPoint Presentation Inspiration Professional
This is a high low close chart ppt powerpoint presentation inspiration professional. This is a ten stage process. The stages in this process are business, strategy, analysis, planning, high, volume, low.
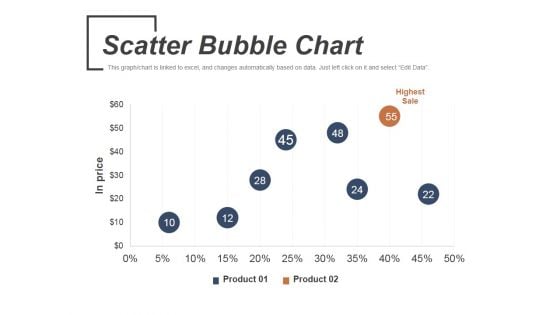
Scatter Bubble Chart Ppt PowerPoint Presentation Infographic Template Graphics
This is a scatter bubble chart ppt powerpoint presentation infographic template graphics. This is a two stage process. The stages in this process are highest sale, product, in price.
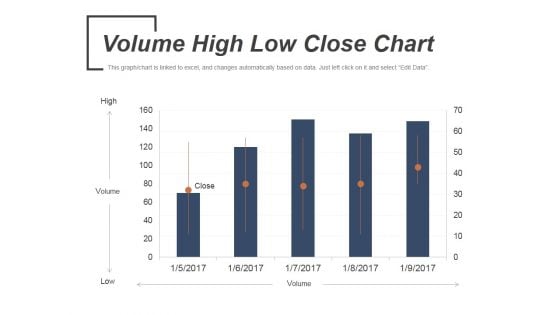
Volume High Low Close Chart Ppt PowerPoint Presentation Slides Portrait
This is a volume high low close chart ppt powerpoint presentation slides portrait. This is a five stage process. The stages in this process are volume, low, high, open, close.
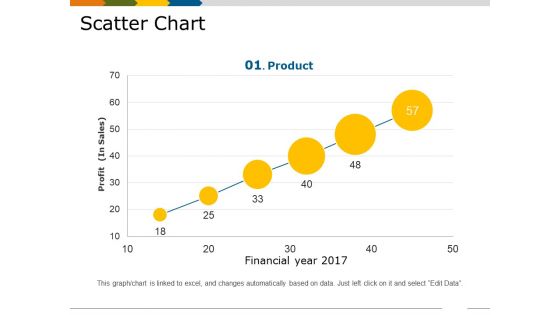
Scatter Chart Template 1 Ppt PowerPoint Presentation Show Slides
This is a scatter chart template 1 ppt powerpoint presentation show slides. This is a six stage process. The stages in this process are financial year, profit in sales, growth, business, marketing, product.
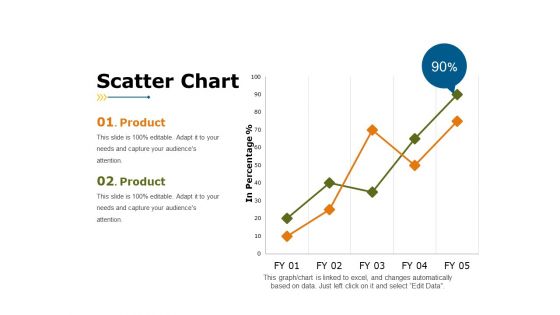
Scatter Chart Template 2 Ppt PowerPoint Presentation Styles Visual Aids
This is a scatter chart template 2 ppt powerpoint presentation styles visual aids. This is a two stage process. The stages in this process are product, business, marketing, in percentage, growth.
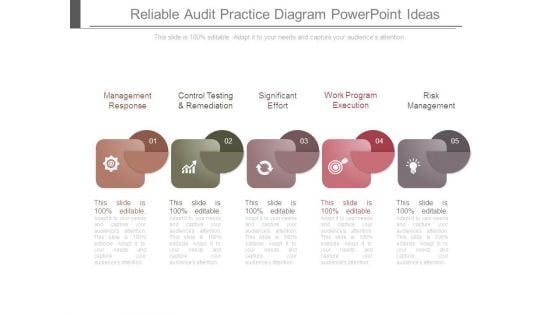
Reliable Audit Practice Diagram Powerpoint Ideas
This is a reliable audit practice diagram powerpoint ideas. This is a five stage process. The stages in this process are management response, control testing and remediation, significant effort, work program execution, risk management.
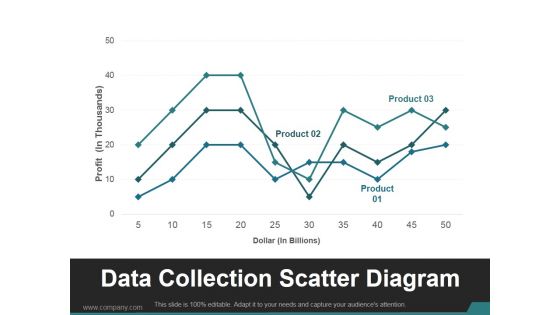
Data Collection Scatter Diagram Ppt PowerPoint Presentation Good
This is a data collection scatter diagram ppt powerpoint presentation good. This is a three stage process. The stages in this process are product, business, marketing, finance, data collection.
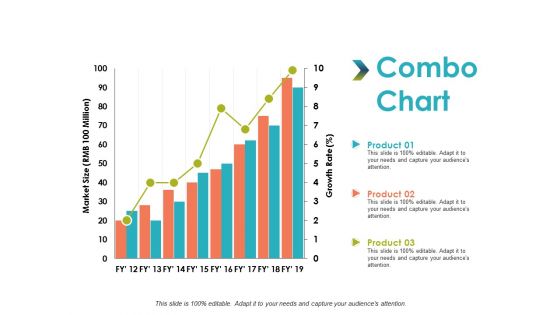
Combo Chart Analysis Management Ppt PowerPoint Presentation Professional Gridlines
This is a combo chart analysis management ppt powerpoint presentation professional gridlines. This is a three stage process. The stages in this process are combo chart, finance, marketing, business, analysis.
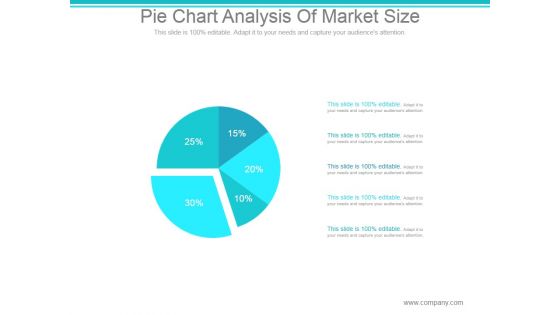
Pie Chart Analysis Of Market Size Ppt PowerPoint Presentation Show
This is a pie chart analysis of market size ppt powerpoint presentation show. This is a five stage process. The stages in this process are chart, graph, pie, percentage, business.
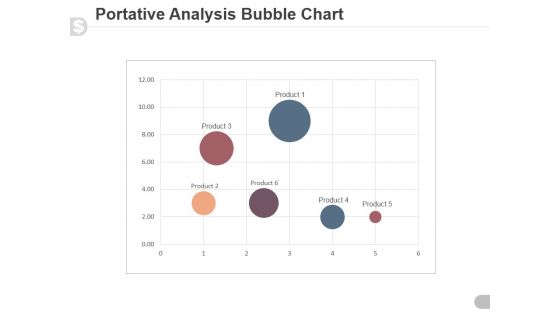
Portative Analysis Bubble Chart Ppt PowerPoint Presentation Slide
This is a portative analysis bubble chart ppt powerpoint presentation slide. This is a six stage process. The stages in this process are portative, analysis, business, graph, bubble chart.
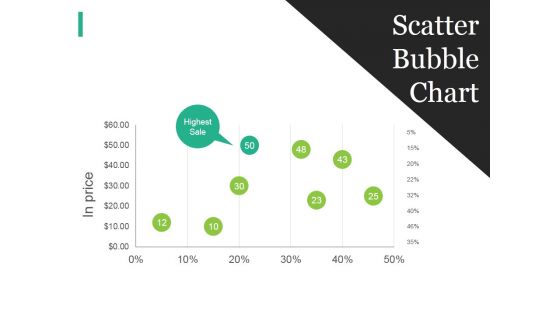
Scatter Bubble Chart Ppt PowerPoint Presentation Summary Mockup
This is a scatter bubble chart ppt powerpoint presentation summary mockup. This is a five stage process. The stages in this process are business, strategy, marketing, analysis, scatter bubble chart.
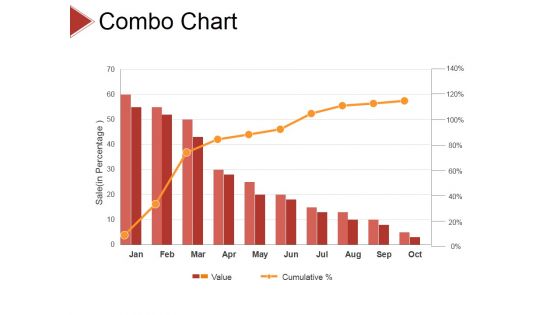
Combo Chart Ppt PowerPoint Presentation File Example Introduction
This is a combo chart ppt powerpoint presentation file example introduction. This is a ten stage process. The stages in this process are business, strategy, analysis, pretention, chart and graph.

Radar Chart Template 1 Ppt PowerPoint Presentation Infographics Designs
This is a radar chart template 1 ppt powerpoint presentation infographics designs. This is a two stage process. The stages in this process are business, strategy, analysis, pretention, radar chart.
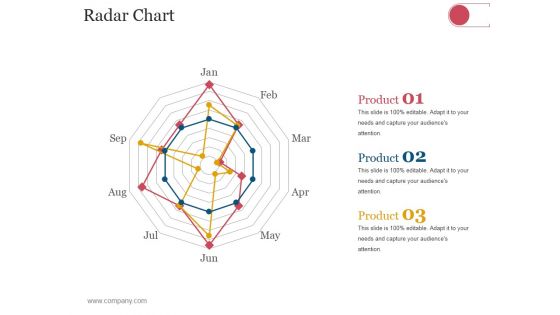
Radar Chart Ppt PowerPoint Presentation Inspiration Example File
This is a radar chart ppt powerpoint presentation inspiration example file. This is a three stage process. The stages in this process are business, strategy, analysis, marketing, radar chart.
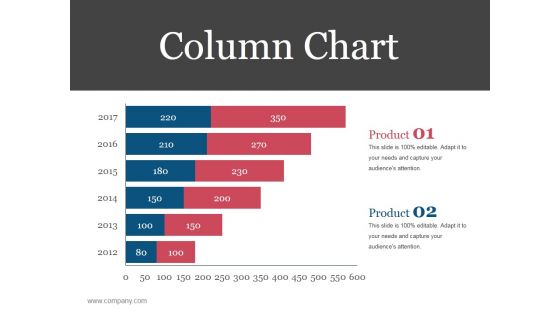
Column Chart Ppt PowerPoint Presentation Ideas Designs Download
This is a column chart ppt powerpoint presentation ideas designs download. This is a six stage process. The stages in this process are business, strategy, analysis, planning, column chart, financial.
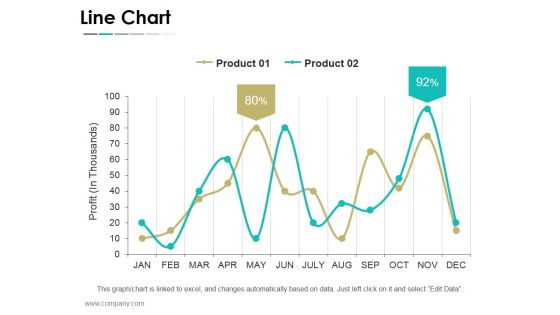
Line Chart Ppt PowerPoint Presentation File Graphics Template
This is a line chart ppt powerpoint presentation file graphics template. This is a twelve stage process. The stages in this process are business, strategy, marketing, success, line chart.
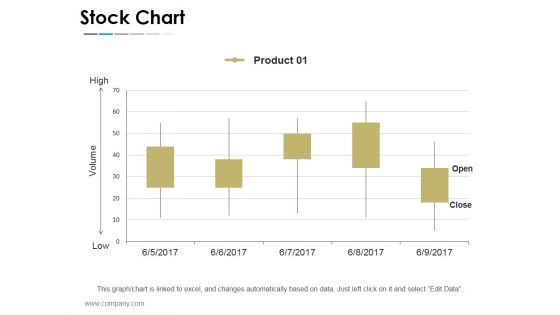
Stock Chart Ppt PowerPoint Presentation Summary Graphic Images
This is a stock chart ppt powerpoint presentation summary graphic images. This is a five stage process. The stages in this process are business, strategy, marketing, success, stock chart.
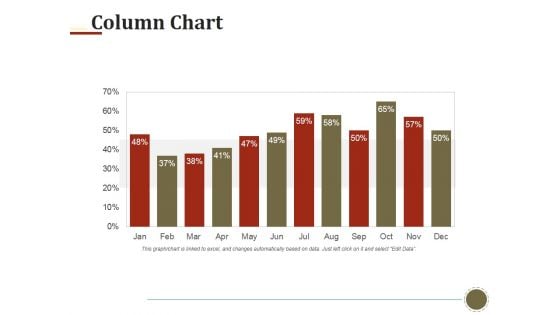
Column Chart Ppt PowerPoint Presentation Infographic Template Graphics Tutorials
This is a column chart ppt powerpoint presentation infographic template graphics tutorials. This is a twelve stage process. The stages in this process are column chart, finance, marketing, strategy, investment, business.
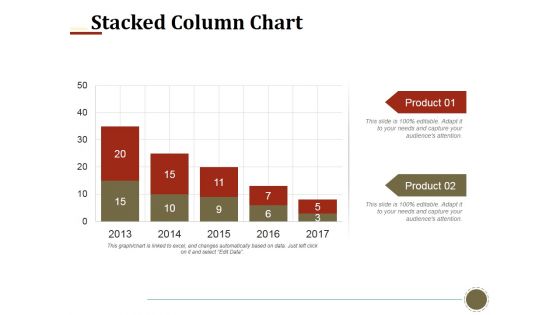
Stacked Column Chart Ppt PowerPoint Presentation Infographics Smartart
This is a stacked column chart ppt powerpoint presentation infographics smartart. This is a two stage process. The stages in this process are stacked column chart, business, finance, marketing, strategy.
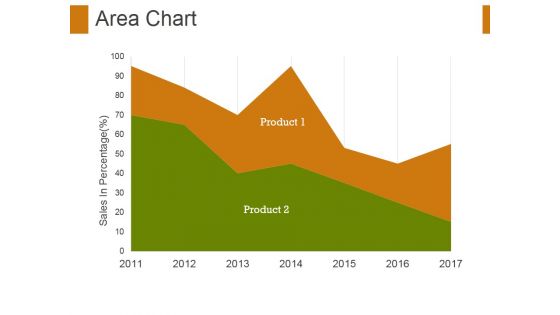
Area Chart Ppt PowerPoint Presentation Visual Aids Example 2015
This is a area chart ppt powerpoint presentation visual aids example 2015. This is a two stage process. The stages in this process are area chart, finance, marketing, strategy, business.
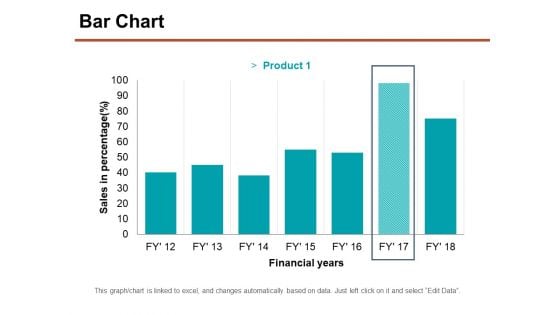
Bar Chart Ppt PowerPoint Presentation Professional Graphics Download
This is a bar chart ppt powerpoint presentation professional graphics download. This is a seven stage process. The stages in this process are sales in percentage, financial years, chart, business.
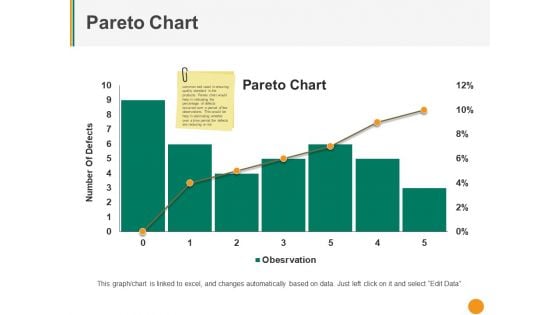
Pareto Chart Ppt PowerPoint Presentation Inspiration Master Slide
This is a pareto chart ppt powerpoint presentation inspiration master slide. This is a six stage process. The stages in this process are number of defects, pareto chart, finance, business, graph.
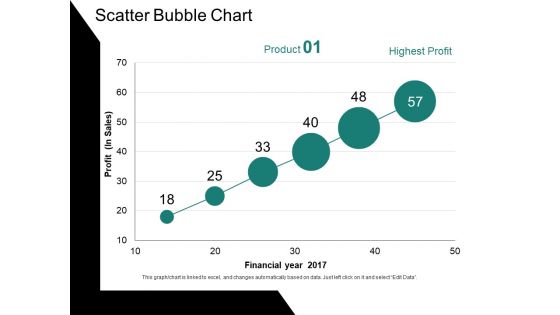
Scatter Bubble Chart Ppt PowerPoint Presentation Ideas Gallery
This is a scatter bubble chart ppt powerpoint presentation ideas gallery. This is a six stage process. The stages in this process are profit, financial year, chart, business, growth.
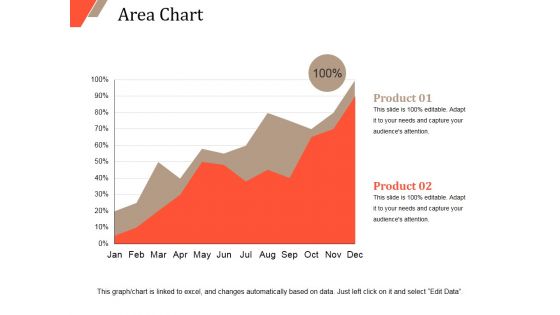
Area Chart Ppt PowerPoint Presentation Inspiration Clipart Images
This is a area chart ppt powerpoint presentation inspiration clipart images. This is a two stage process. The stages in this process are area chart, growth, finance, business, strategy.
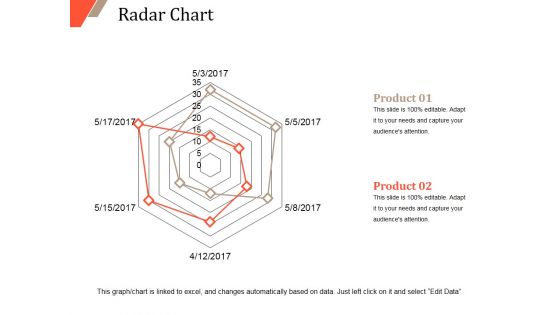
Radar Chart Ppt PowerPoint Presentation Portfolio Design Templates
This is a radar chart ppt powerpoint presentation portfolio design templates. This is a two stage process. The stages in this process are radar chart, product, finance, marketing, strategy, business.
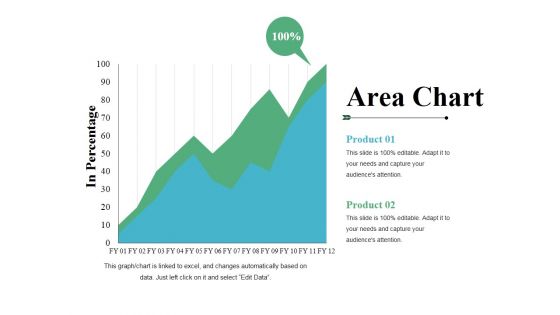
Area Chart Ppt PowerPoint Presentation Infographics Visual Aids
This is a area chart ppt powerpoint presentation infographics visual aids. This is a two stage process. The stages in this process are product, area chart, in percentage, growth, success.
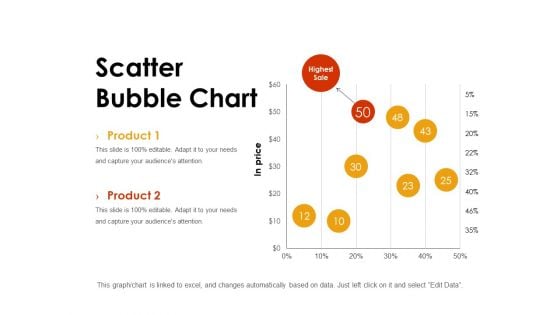
Scatter Bubble Chart Ppt PowerPoint Presentation Styles Background
This is a scatter bubble chart ppt powerpoint presentation styles background. This is a two stage process. The stages in this process are chart, in price, highest sale, finance, marketing.
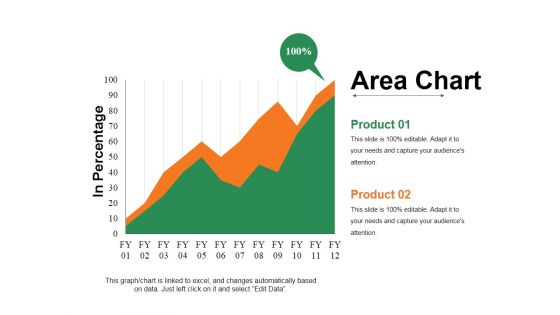
Area Chart Ppt PowerPoint Presentation Infographic Template Guidelines
This is a area chart ppt powerpoint presentation infographic template guidelines. This is a two stage process. The stages in this process are in percentage, chart, business, growth, strategy.

Area Chart Ppt PowerPoint Presentation Infographic Template Layout
This is a area chart ppt powerpoint presentation infographic template layout. This is a two stage process. The stages in this process are product, profit, area chart, growth, success.
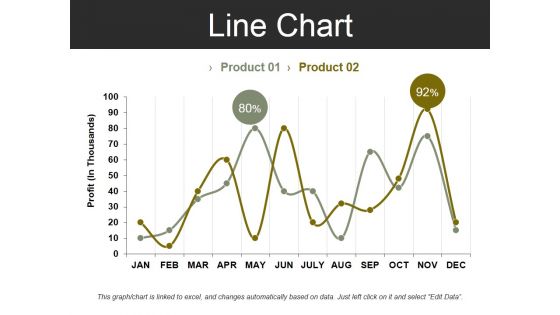
Line Chart Template 2 Ppt PowerPoint Presentation Summary Design Inspiration
This is a line chart template 2 ppt powerpoint presentation summary design inspiration. This is a two stage process. The stages in this process are profit, business, marketing, finance, chart.
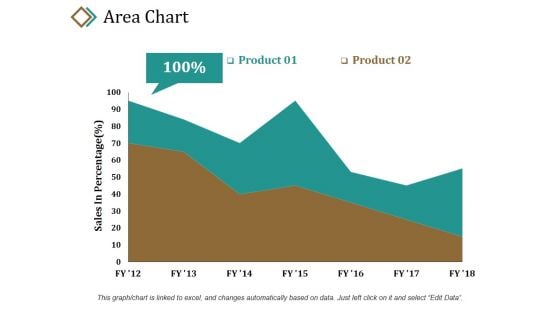
Area Chart Ppt PowerPoint Presentation Summary Example Introduction
This is a area chart ppt powerpoint presentation summary example introduction. This is a two stage process. The stages in this process are product, sales in percentage, percentage, area chart, business.
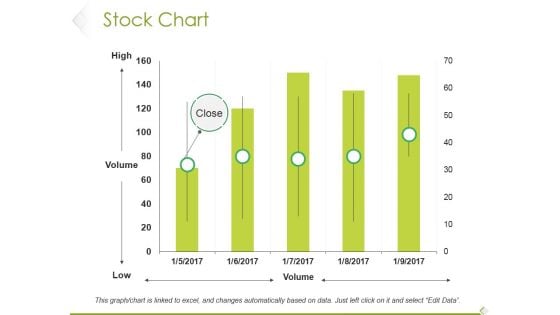
Stock Chart Ppt PowerPoint Presentation Slides Designs Download
This is a stock chart ppt powerpoint presentation slides designs download. This is a five stage process. The stages in this process are high, volume, low, close, stock chart.
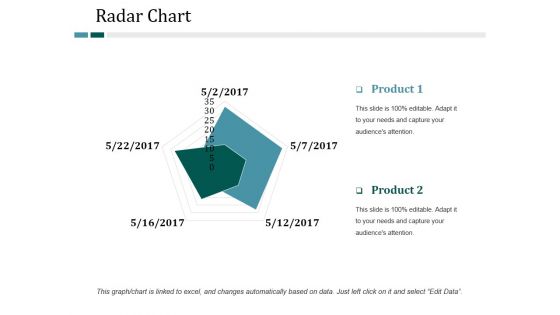
Radar Chart Ppt PowerPoint Presentation Infographic Template Backgrounds
This is a radar chart ppt powerpoint presentation infographic template backgrounds. This is a two stage process. The stages in this process are radar chart, finance, marketing, strategy, business.
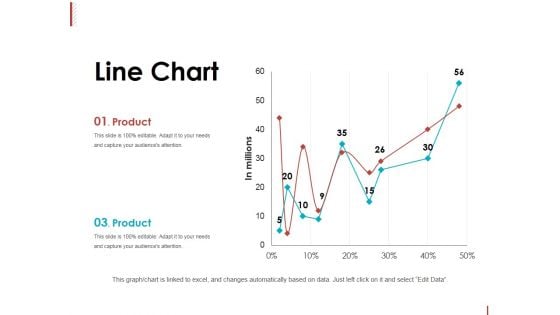
Line Chart Ppt PowerPoint Presentation Slides Graphics Tutorials
This is a line chart ppt powerpoint presentation slides graphics tutorials. This is a two stage process. The stages in this process are product, in millions, line chart, percentage, finance.
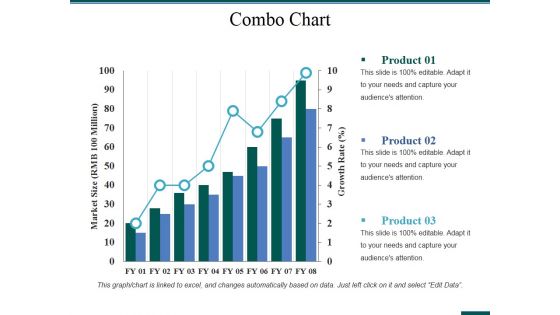
Combo Chart Ppt PowerPoint Presentation Slides Background Image
This is a combo chart ppt powerpoint presentation slides background image. This is a three stage process. The stages in this process are business, finance, planning, combo chart, investment.
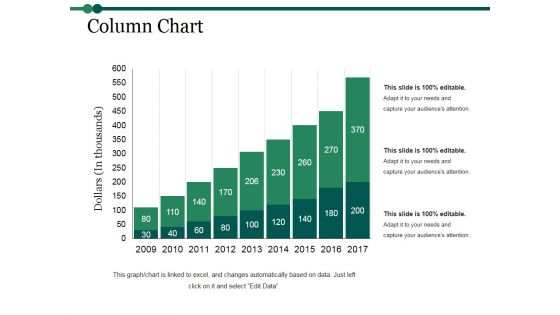
Column Chart Ppt PowerPoint Presentation Inspiration Graphics Example
This is a column chart ppt powerpoint presentation inspiration graphics example. This is a nine stage process. The stages in this process are column chart, finance, marketing, strategy, analysis, business.

Combo Chart Ppt PowerPoint Presentation Inspiration Slide Portrait
This is a combo chart ppt powerpoint presentation inspiration slide portrait. This is a three stage process. The stages in this process are product, market size, bar chart, growth, success.
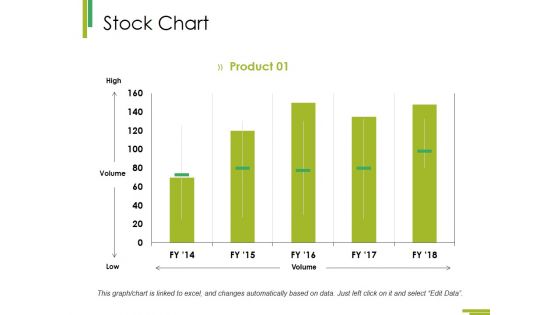
Stock Chart Ppt PowerPoint Presentation Summary Format Ideas
This is a stock chart ppt powerpoint presentation summary format ideas. This is a one stage process. The stages in this process are stock chart, finance, business, analysis, marketing.

Column Chart Ppt PowerPoint Presentation Infographic Template Slides
This is a column chart ppt powerpoint presentation infographic template slides. This is a two stage process. The stages in this process are column chart, finance, marketing, strategy, business.
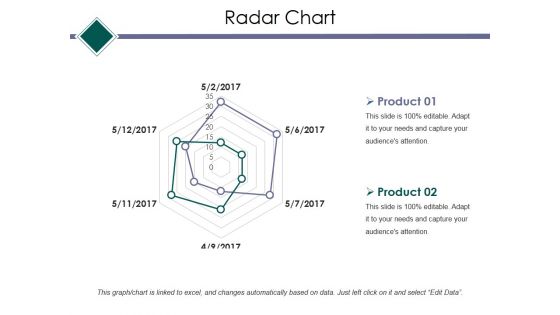
Radar Chart Ppt PowerPoint Presentation Infographic Template Example Topics
This is a radar chart ppt powerpoint presentation infographic template example topics. This is a two stage process. The stages in this process are radar chart, finance, marketing, strategy, business.
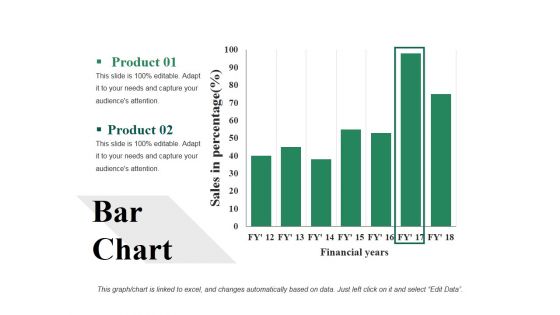
Bar Chart Ppt PowerPoint Presentation Visual Aids Backgrounds
This is a bar chart ppt powerpoint presentation visual aids backgrounds. This is a two stage process. The stages in this process are bar chart, analysis, strategy, finance, business.
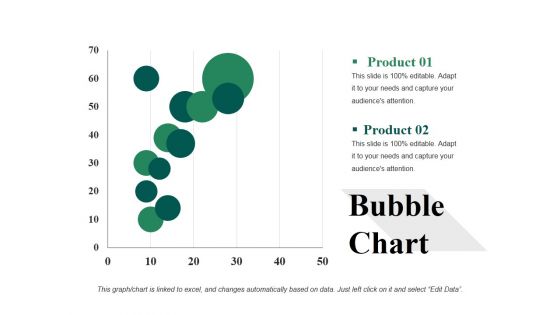
Bubble Chart Ppt PowerPoint Presentation Infographic Template Example 2015
This is a bubble chart ppt powerpoint presentation infographic template example 2015. This is a two stage process. The stages in this process are analysis, strategy, finance, business, bubble chart.

Clustered Chart Ppt PowerPoint Presentation Gallery Background Images
This is a clustered chart ppt powerpoint presentation gallery background images. This is a two stage process. The stages in this process are clustered chart, analysis, strategy, finance, business.
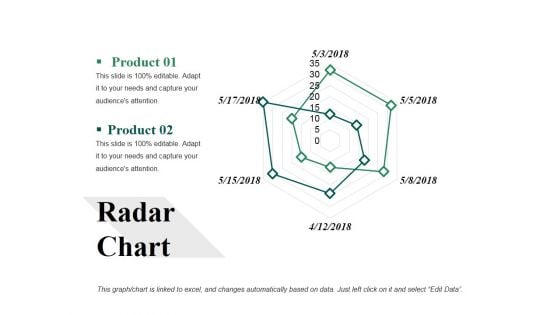
Radar Chart Ppt PowerPoint Presentation File Background Image
This is a radar chart ppt powerpoint presentation file background image. This is a two stage process. The stages in this process are radar chart, finance, analysis, marketing, business.
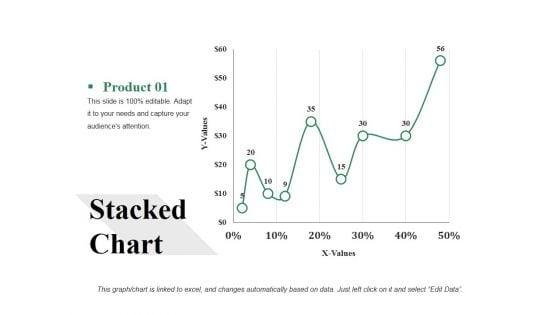
Stacked Chart Ppt PowerPoint Presentation Gallery Infographic Template
This is a stacked chart ppt powerpoint presentation gallery infographic template. This is a one stage process. The stages in this process are stacked chart, finance, analysis, marketing, business.
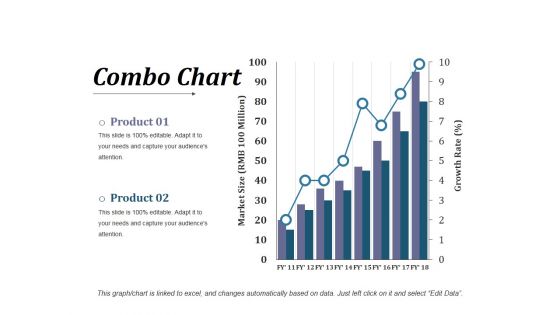
Combo Chart Ppt PowerPoint Presentation Infographic Template Visuals
This is a combo chart ppt powerpoint presentation infographic template visuals. This is a three stage process. The stages in this process are business, finance, strategy, analysis, combo chart.
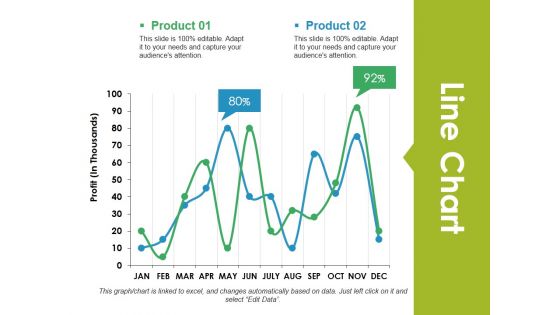
Line Chart Ppt PowerPoint Presentation Ideas Background Designs
This is a line chart ppt powerpoint presentation ideas background designs. This is a two stage process. The stages in this process are line chart, growth, business, marketing, strategy.
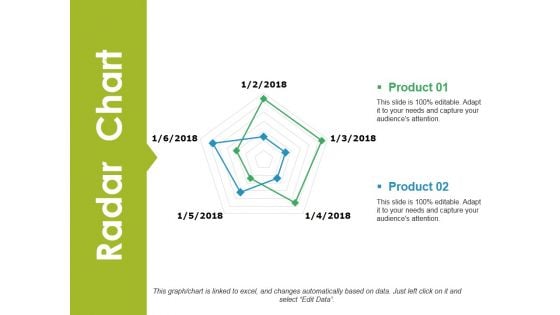
Radar Chart Ppt PowerPoint Presentation Infographic Template Tips
This is a radar chart ppt powerpoint presentation infographic template tips. This is a two stage process. The stages in this process are radar chart, business, finance, analysis, strategy.
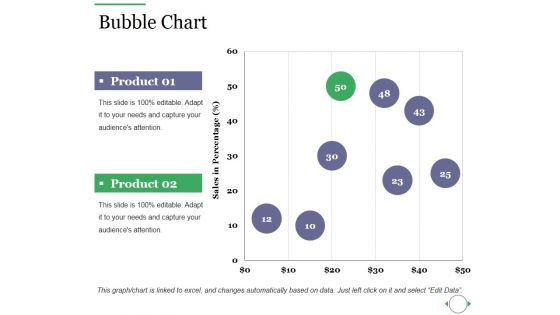
Bubble Chart Ppt PowerPoint Presentation Layouts Graphic Images
This is a bubble chart ppt powerpoint presentation layouts graphic images. This is a two stage process. The stages in this process are bubble chart, finance, marketing, strategy, business, analysis.
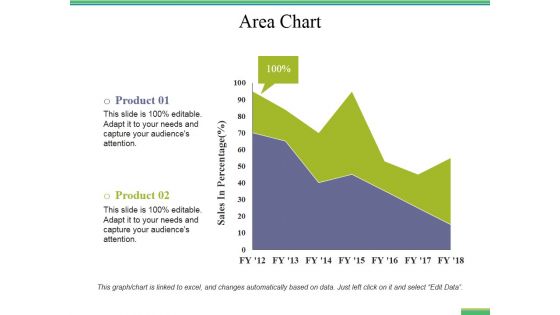
Area Chart Ppt PowerPoint Presentation Portfolio Graphics Template
This is a area chart ppt powerpoint presentation portfolio graphics template. This is a two stage process. The stages in this process are area chart, finance, analysis, business, marketing.
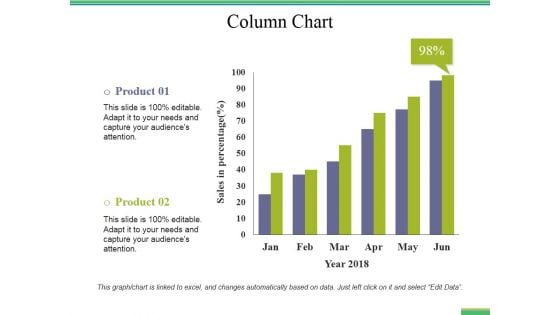
Column Chart Ppt PowerPoint Presentation Pictures Visual Aids
This is a column chart ppt powerpoint presentation pictures visual aids. This is a two stage process. The stages in this process are column chart, business, finance, marketing, analysis, investment.
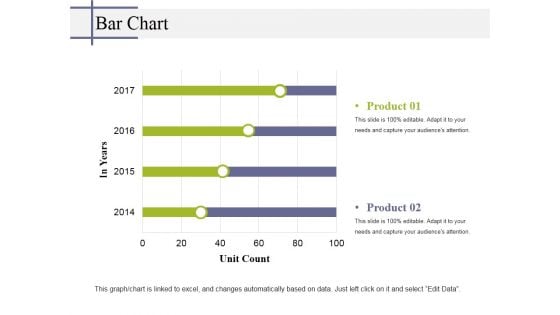
Bar Chart Ppt PowerPoint Presentation Infographic Template Tips
This is a bar chart ppt powerpoint presentation infographic template tips. This is a two stage process. The stages in this process are bar chart, finance, marketing, strategy, business.
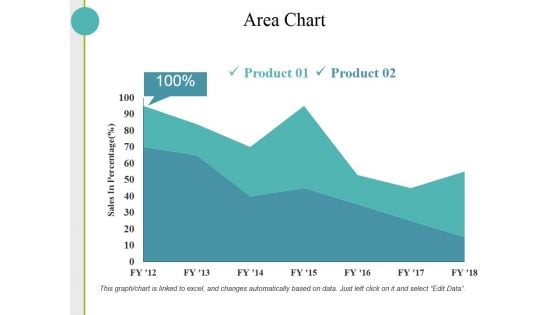
Area Chart Ppt PowerPoint Presentation Slides Visual Aids
This is a area chart ppt powerpoint presentation slides visual aids. This is a two stage process. The stages in this process are area chart, finance, marketing, strategy, business.
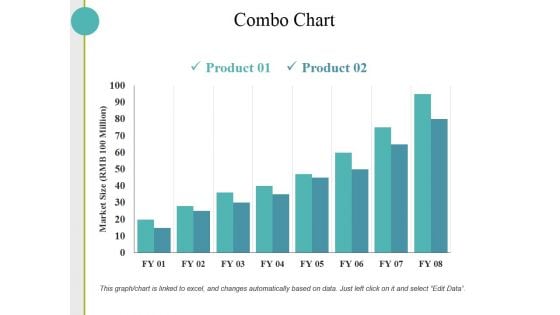
Combo Chart Ppt PowerPoint Presentation Layouts Design Templates
This is a combo chart ppt powerpoint presentation layouts design templates. This is a two stage process. The stages in this process are combo chart, finance, marketing, strategy, analysis, business.
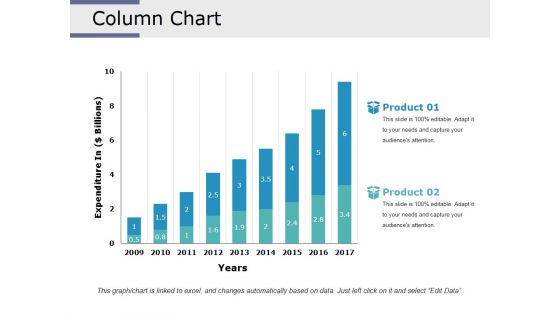
Column Chart Ppt PowerPoint Presentation Infographic Template Designs Download
This is a column chart ppt powerpoint presentation infographic template designs download. This is a two stage process. The stages in this process are column chart, analysis, finance, marketing, strategy, business.
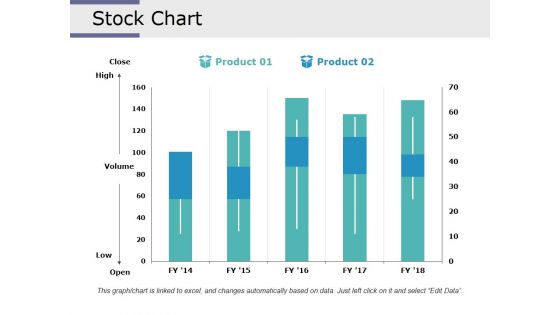
Stock Chart Ppt PowerPoint Presentation Infographic Template Design Inspiration
This is a stock chart ppt powerpoint presentation infographic template design inspiration. This is a two stage process. The stages in this process are stock chart, finance, analysis, business, marketing.
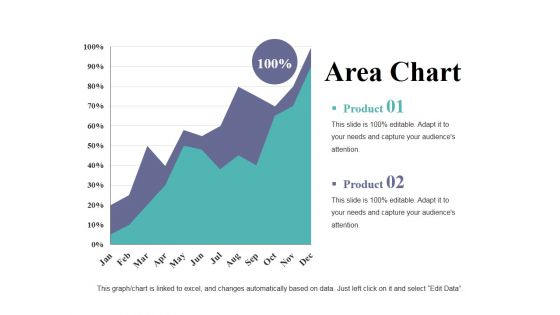
Area Chart Ppt PowerPoint Presentation Professional Graphic Images
This is a area chart ppt powerpoint presentation professional graphic images. This is a two stage process. The stages in this process are area chart, growth, strategy, business, finance, analysis.
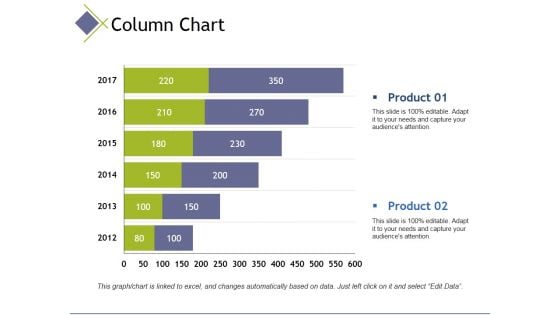
column chart ppt powerpoint presentation portfolio master slide
This is a column chart ppt powerpoint presentation portfolio master slide. This is a two stage process. The stages in this process are column chart, finance, analysis, marketing, business.
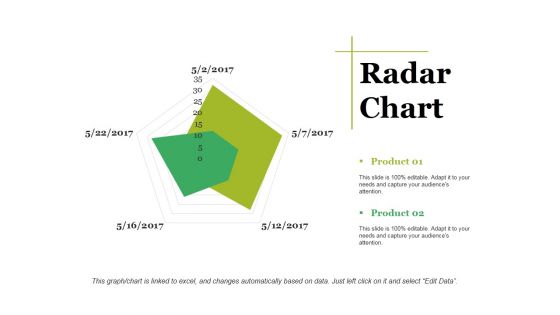
Radar Chart Ppt PowerPoint Presentation Visual Aids Background Images
This is a radar chart ppt powerpoint presentation visual aids background images. This is a two stage process. The stages in this process are radar chart, finance, marketing, strategy, business.
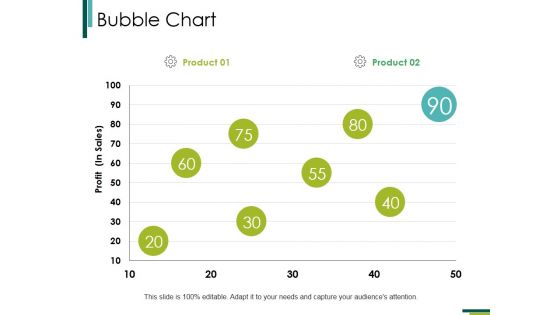
Bubble Chart Ppt PowerPoint Presentation Ideas Background Designs
This is a bubble chart ppt powerpoint presentation ideas background designs. This is a two stage process. The stages in this process are bubble chart, finance, marketing, strategy, business.
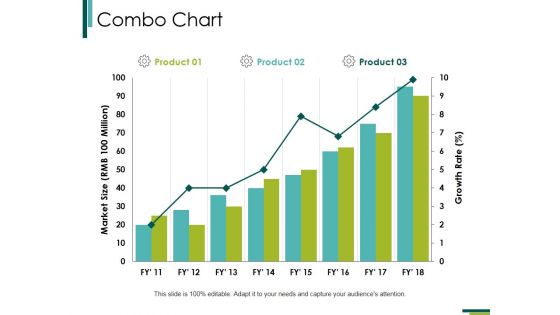
Combo Chart Ppt PowerPoint Presentation Infographic Template Slide Portrait
This is a combo chart ppt powerpoint presentation infographic template slide portrait. This is a three stage process. The stages in this process are combo chart, finance, marketing, strategy, business, growth.
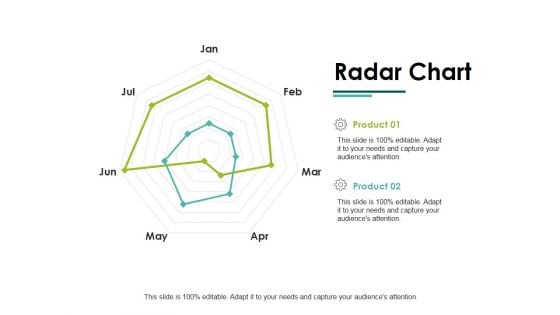
Radar Chart Ppt PowerPoint Presentation Infographics Slide Download
This is a radar chart ppt powerpoint presentation infographics slide download. This is a two stage process. The stages in this process are radar chart, finance, marketing, strategy, business.
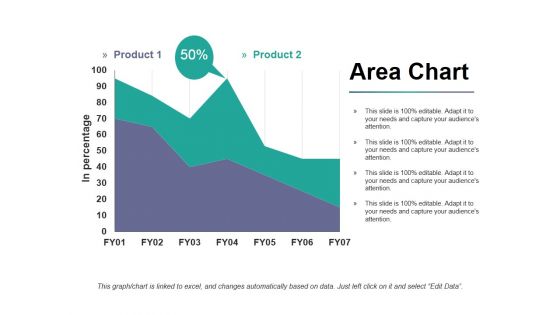
Area Chart Ppt PowerPoint Presentation Styles Graphics Download
This is a area chart ppt powerpoint presentation styles graphics download. This is a two stage process. The stages in this process are product, in percentage, area chart, business, marketing.
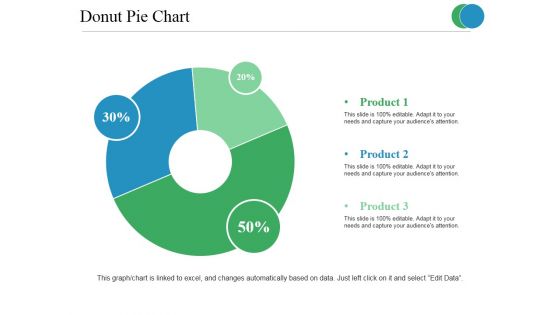
Donut Pie Chart Ppt PowerPoint Presentation Ideas Example
This is a donut pie chart ppt powerpoint presentation ideas example. This is a three stage process. The stages in this process are donut pie chart, finance, marketing, strategy, business.
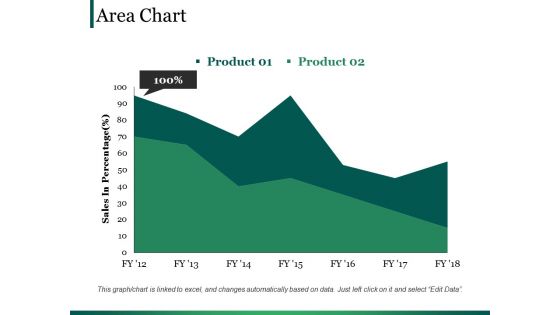
Area Chart Ppt PowerPoint Presentation Portfolio Background Image
This is a area chart ppt powerpoint presentation portfolio background image. This is a two stage process. The stages in this process are business, marketing, finance, planning, area chart.
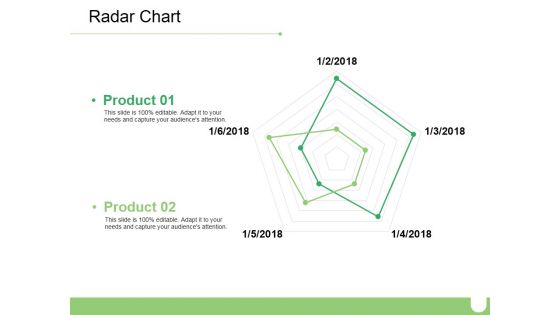
Radar Chart Ppt PowerPoint Presentation Slides Designs Download
This is a radar chart ppt powerpoint presentation slides designs download. This is a two stage process. The stages in this process are business, radar chart, marketing, graph, strategy.

Radar Chart Ppt PowerPoint Presentation Pictures Layout Ideas
This is a radar chart ppt powerpoint presentation pictures layout ideas. This is a two stage process. The stages in this process are business, marketing, radar chart, finance, strategy, graph.

Column Chart Ppt PowerPoint Presentation Inspiration Layout Ideas
This is a column chart ppt powerpoint presentation inspiration layout ideas. This is a two stage process. The stages in this process are in years, dollars, chart, business, marketing, finance.
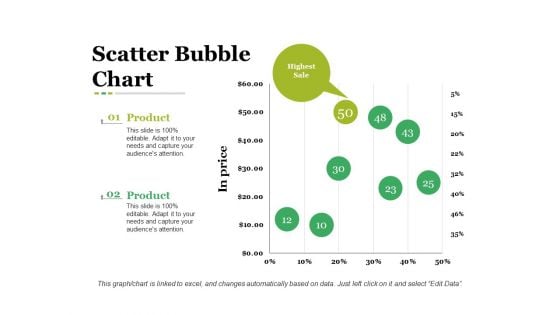
Scatter Bubble Chart Ppt PowerPoint Presentation Infographic Template Graphic Images
This is a scatter bubble chart ppt powerpoint presentation infographic template graphic images. This is a two stage process. The stages in this process are business, in price, bubble chart, marketing, strategy.
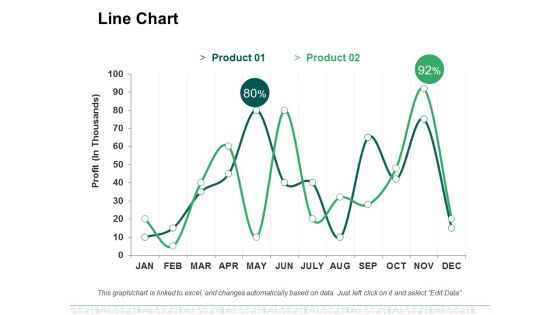
Line Chart Ppt PowerPoint Presentation File Designs Download
This is a line chart ppt powerpoint presentation file designs download. This is a two stage process. The stages in this process are business, marketing, profit, line chart, percentage.
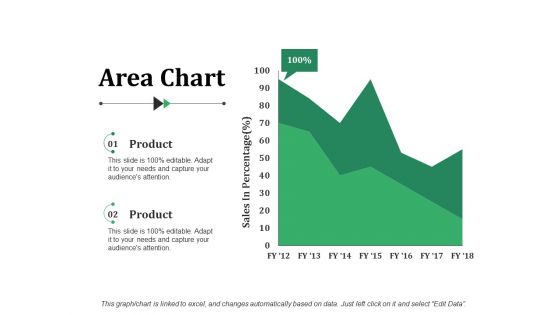
Area Chart Ppt PowerPoint Presentation Visual Aids Gallery
This is a area chart ppt powerpoint presentation visual aids gallery. This is a two stage process. The stages in this process are area chart, finance, marketing, analysis, business.
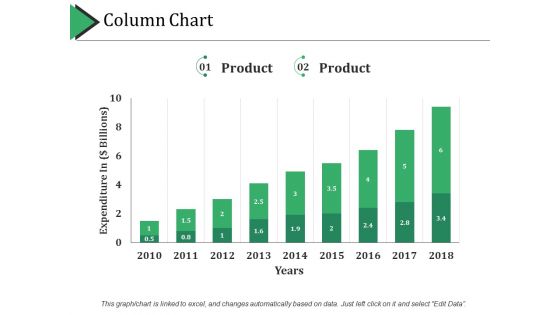
Column Chart Ppt PowerPoint Presentation Professional Example Topics
This is a column chart ppt powerpoint presentation professional example topics. This is a two stage process. The stages in this process are column chart, finance, marketing, strategy, analysis, business.
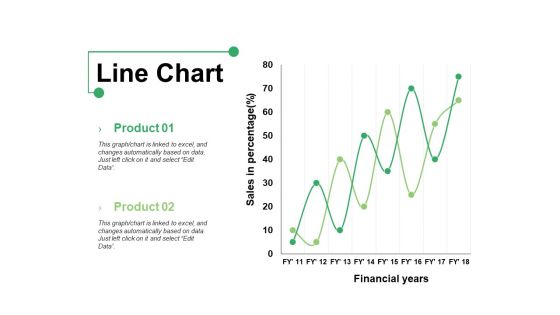
Line Chart Ppt PowerPoint Presentation Show Graphics Example
This is a line chart ppt powerpoint presentation show graphics example. This is a two stage process. The stages in this process are product, line chart, financial years, sales in percentage.
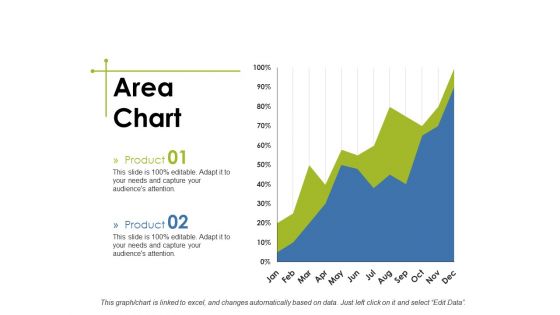
Area Chart Ppt PowerPoint Presentation Slides Master Slide
This is a area chart ppt powerpoint presentation slides master slide. This is a two stage process. The stages in this process are business, marketing, area chart, finance, strategy.
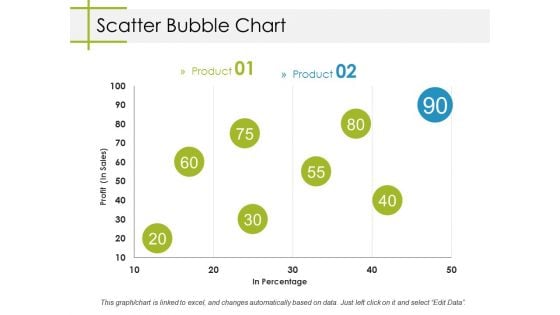
Scatter Bubble Chart Ppt PowerPoint Presentation Model Designs
This is a scatter bubble chart ppt powerpoint presentation model designs. This is a two stage process. The stages in this process are business, profit, in percentage, bubble chart, marketing.
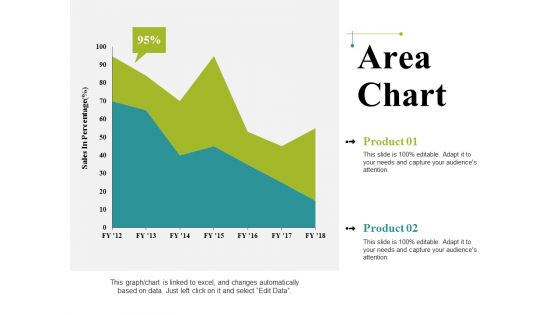
Area Chart Ppt PowerPoint Presentation Infographics Graphics Pictures
This is a area chart ppt powerpoint presentation infographics graphics pictures. This is a two stage process. The stages in this process are business, sales in percentage, area chart, marketing, graph.
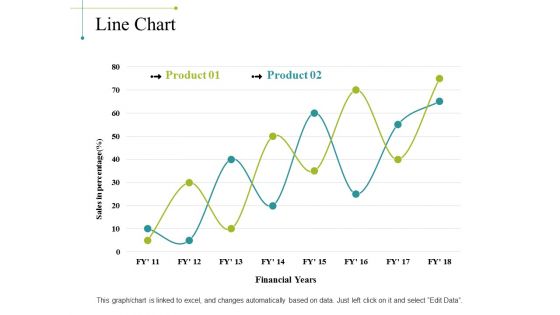
Line Chart Ppt PowerPoint Presentation Portfolio Background Image
This is a line chart ppt powerpoint presentation portfolio background image. This is a two stage process. The stages in this process are sales in percentage, financial years, chart, business, marketing, finance.
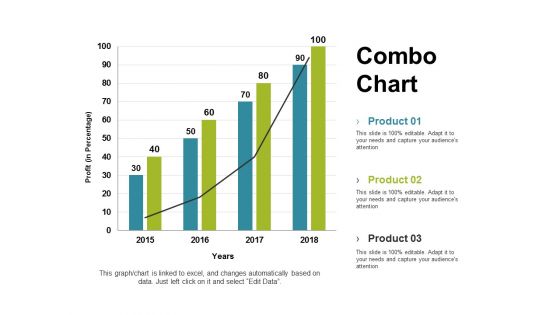
Combo Chart Ppt PowerPoint Presentation Gallery Graphics Tutorials
This is a Combo Chart Ppt PowerPoint Presentation Gallery Graphics Tutorials. This is a three stage process. The stages in this process are combo chart, finance, marketing, strategy, analysis.
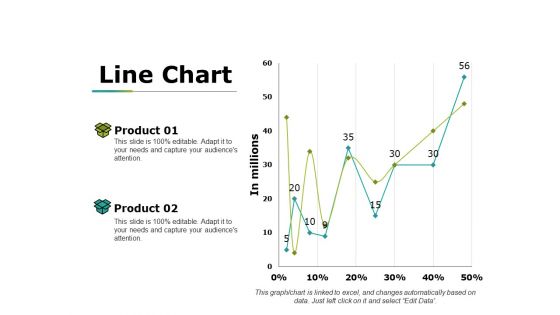
Line Chart Ppt PowerPoint Presentation Infographic Template Design Ideas
This is a line chart ppt powerpoint presentation infographic template design ideas. This is a two stage process. The stages in this process are product, in millions, percentage, line chart, success.
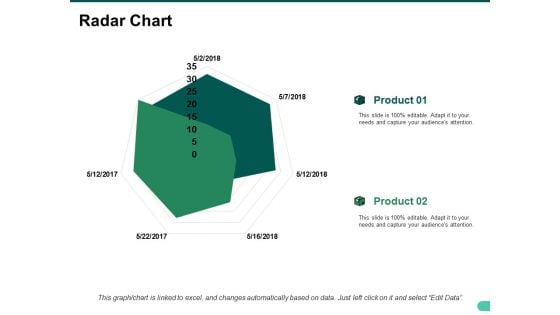
Radar Chart Ppt PowerPoint Presentation Show Graphic Images
This is a radar chart ppt powerpoint presentation show graphic images. This is a two stage process. The stages in this process are business, radar chart, marketing, graph, strategy.
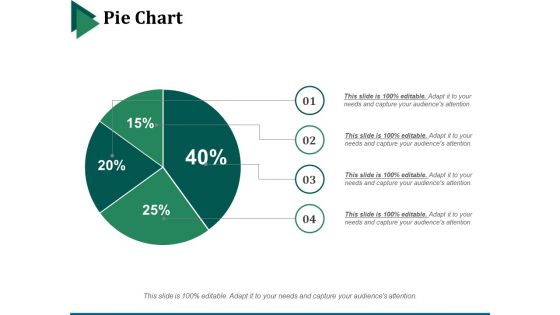
Pie Chart Ppt PowerPoint Presentation Infographic Template Backgrounds
This is a pie chart ppt powerpoint presentation infographic template backgrounds. This is a four stage process. The stages in this process are pie chart, marketing, strategy, finance, analysis.
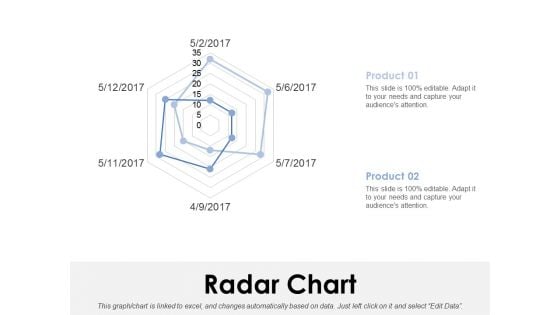
Radar Chart Ppt PowerPoint Presentation Model Clipart Images
This is a radar chart ppt powerpoint presentation model clipart images. This is a two stage process. The stages in this process are radar chart, finance, analysis, marketing, strategy, business.
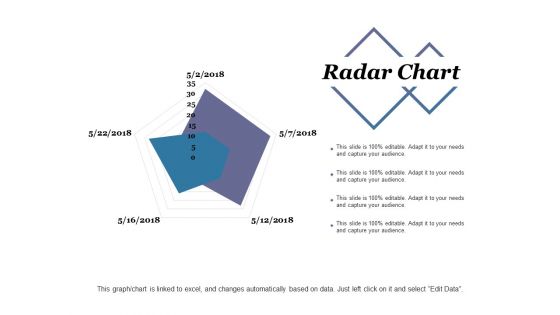
Radar Chart Ppt PowerPoint Presentation Infographic Template Sample
This is a radar chart ppt powerpoint presentation infographic template sample. This is a two stage process. The stages in this process are radar chart, finance, marketing, strategy, analysis.
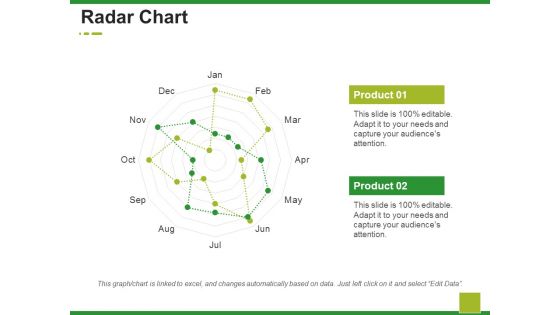
Radar Chart Ppt PowerPoint Presentation Ideas Design Ideas
This is a radar chart ppt powerpoint presentation ideas design ideas. This is a two stage process. The stages in this process are business, marketing, radar chart, finance, strategy.
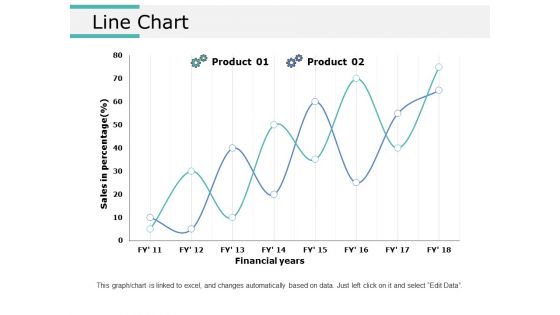
Line Chart Ppt PowerPoint Presentation Ideas Graphics Tutorials
This is a line chart ppt powerpoint presentation ideas graphics tutorials. This is a two stage process. The stages in this process are line chart, marketing, strategy, planning, finance.
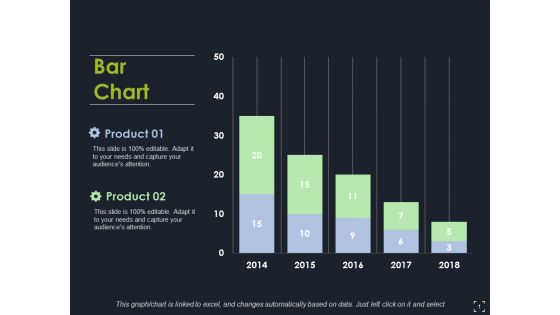
Bar Chart Ppt PowerPoint Presentation Model Clipart Images
This is a bar chart ppt powerpoint presentation model clipart images. This is a two stage process. The stages in this process are bar chart, finance, marketing, strategy, analysis.
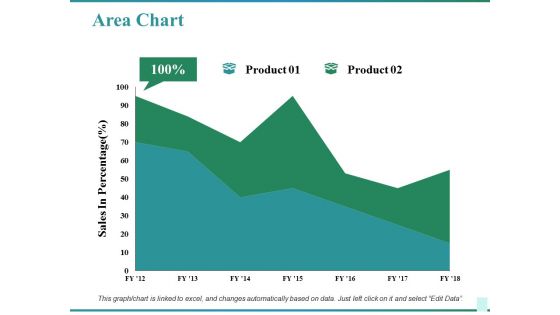
Area Chart Ppt PowerPoint Presentation Inspiration Background Designs
This is a area chart ppt powerpoint presentation inspiration background designs. This is a two stage process. The stages in this process are business, sales in percentage, area chart, marketing, finance.
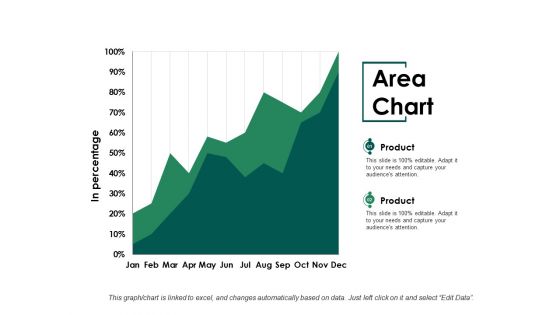
Area Chart Ppt PowerPoint Presentation File Format Ideas
This is a area chart ppt powerpoint presentation file format ideas. This is a two stage process. The stages in this process are area chart, marketing, planning, finance, strategy.
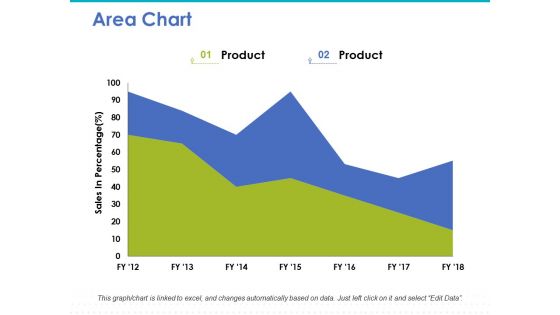
Area Chart Ppt PowerPoint Presentation Infographic Template Inspiration
This is a area chart ppt powerpoint presentation infographic template inspiration. This is a two stage process. The stages in this process are area chart, marketing, strategy, finance, planning.
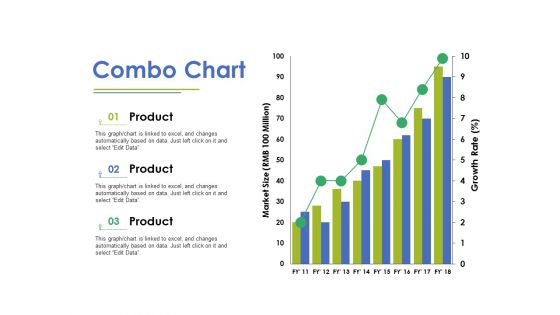
Combo Chart Ppt PowerPoint Presentation Layouts Background Image
This is a combo chart ppt powerpoint presentation layouts background image. This is a three stage process. The stages in this process are bar chart, marketing, strategy, finance, planning.

 Home
Home