Progress Infographic
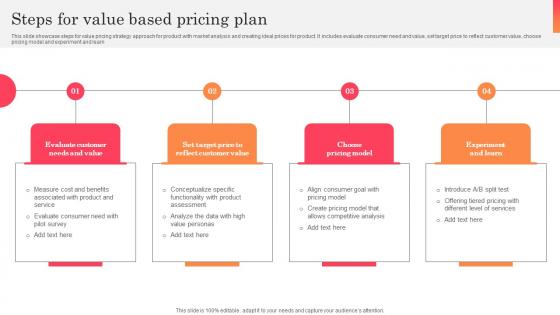
Steps For Value Based Pricing Plan Infographics Pdf
This slide showcase steps for value pricing strategy approach for product with market analysis and creating ideal prices for product. It includes evaluate consumer need and value, set target price to reflect customer value, choose pricing model and experiment and learn. Pitch your topic with ease and precision using this Steps For Value Based Pricing Plan Infographics Pdf. This layout presents information on Value Pricing Strategy Approach, Market Analysis, Ideal Prices For Product. It is also available for immediate download and adjustment. So, changes can be made in the color, design, graphics or any other component to create a unique layout. This slide showcase steps for value pricing strategy approach for product with market analysis and creating ideal prices for product. It includes evaluate consumer need and value, set target price to reflect customer value, choose pricing model and experiment and learn.
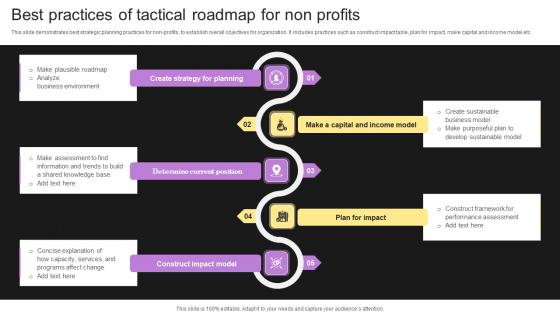
Best Practices Of Tactical Roadmap For Non Profits Infographics Pdf
This slide demonstrates best strategic planning practices for non profits, to establish overall objectives for organization. It includes practices such as construct impact table, plan for impact, make capital and income model etc.Showcasing this set of slides titled Best Practices Of Tactical Roadmap For Non Profits Infographics Pdf The topics addressed in these templates are Determine Current Position, Construct Impact Model, Performance Assessment All the content presented in this PPT design is completely editable. Download it and make adjustments in color, background, font etc. as per your unique business setting. This slide demonstrates best strategic planning practices for non profits, to establish overall objectives for organization. It includes practices such as construct impact table, plan for impact, make capital and income model etc.
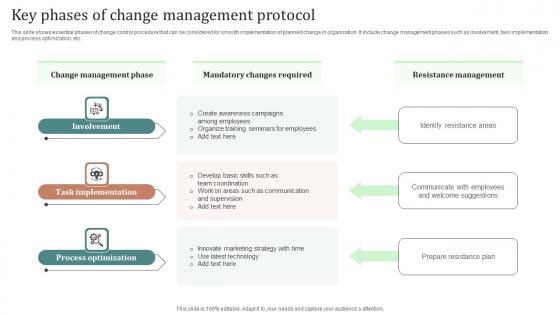
Key Phases Of Change Management Protocols Ppt Infographics Deck Pdf
This slide shows essential phases of change control procedure that can be considered for smooth implementation of planned change in organization. It include change management phases such as involvement, task implementation and process optimization, etc. Showcasing this set of slides titled Key Phases Of Change Management Protocols Ppt Infographics Deck Pdf. The topics addressed in these templates are Involvement, Task Implementation, Process Optimization. All the content presented in this PPT design is completely editable. Download it and make adjustments in color, background, font etc. as per your unique business setting. This slide shows essential phases of change control procedure that can be considered for smooth implementation of planned change in organization. It include change management phases such as involvement, task implementation and process optimization, etc.
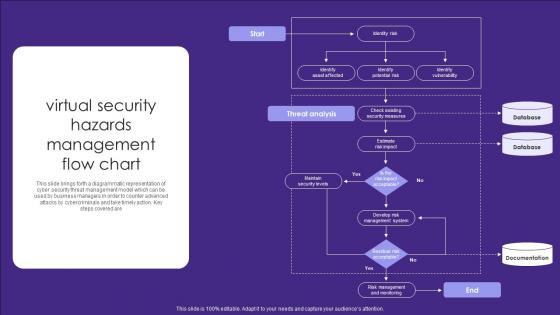
Virtual Security Hazards Management Flow Chart Infographics Pdf
This slide brings forth a diagrammatic representation of cyber security threat management model which can be used by business managers in order to counter advanced attacks by cybercriminals and take timely action. Key steps covered are Showcasing this set of slides titled Virtual Security Hazards Management Flow Chart Infographics Pdf. The topics addressed in these templates are Security Measures, Database, Documentation. All the content presented in this PPT design is completely editable. Download it and make adjustments in color, background, font etc. as per your unique business setting. This slide brings forth a diagrammatic representation of cyber security threat management model which can be used by business managers in order to counter advanced attacks by cybercriminals and take timely action. Key steps covered are
Icon Slide For Green Computing Ppt Powerpoint Infographics Grid
Introducing our well designed Icon Slide For Green Computing Ppt Powerpoint Infographics Grid set of slides. The slide displays editable icons to enhance your visual presentation. The icons can be edited easily. So customize according to your business to achieve a creative edge. Download and share it with your audience. Our Icon Slide For Green Computing Ppt Powerpoint Infographics Grid are topically designed to provide an attractive backdrop to any subject. Use them to look like a presentation pro.
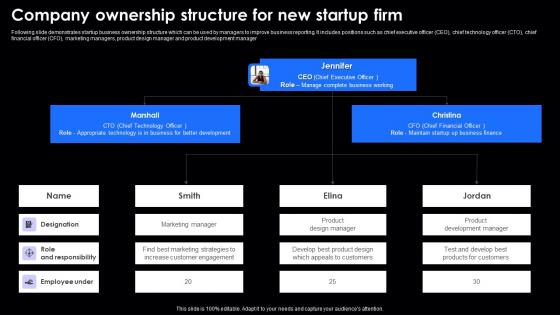
Company Ownership Structure For New Startup Firm Infographics Pdf
Following slide demonstrates startup business ownership structure which can be used by managers to improve business reporting. It includes positions such as chief executive officer CEO, chief technology officer CTO, chief financial officer CFO, marketing managers, product design manager and product development manager Pitch your topic with ease and precision using this Company Ownership Structure For New Startup Firm Infographics Pdf. This layout presents information on Role And Responsibility, Marketing Manager, Product Design Manager. It is also available for immediate download and adjustment. So, changes can be made in the color, design, graphics or any other component to create a unique layout. Following slide demonstrates startup business ownership structure which can be used by managers to improve business reporting. It includes positions such as chief executive officer CEO, chief technology officer CTO, chief financial officer CFO, marketing managers, product design manager and product development manager
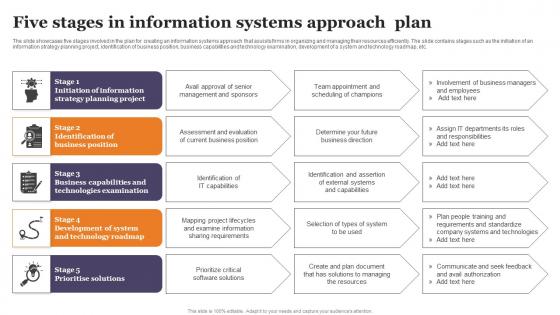
Five Stages In Information Systems Approach Plan Infographics Pdf
The slide showcases five stages involved in the plan for creating an information systems approach that assists firms in organizing and managing their resources efficiently. The slide contains stages such as the initiation of an information strategy planning project, identification of business position, business capabilities and technology examination, development of a system and technology roadmap, etc. Showcasing this set of slides titled Five Stages In Information Systems Approach Plan Infographics Pdf The topics addressed in these templates are Strategy Planning Project, Business Position, Technologies Examination All the content presented in this PPT design is completely editable. Download it and make adjustments in color, background, font etc. as per your unique business setting. The slide showcases five stages involved in the plan for creating an information systems approach that assists firms in organizing and managing their resources efficiently. The slide contains stages such as the initiation of an information strategy planning project, identification of business position, business capabilities and technology examination, development of a system and technology roadmap, etc.
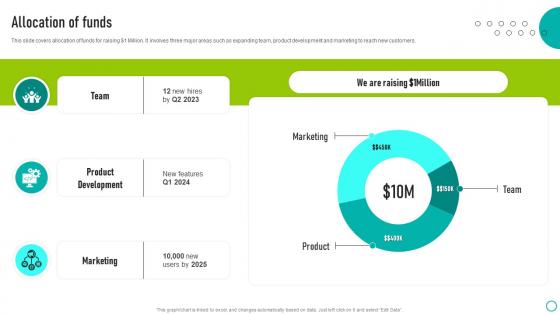
Allocation Of Funds Ovation Capital Funding Pitch Deck Infographics Pdf
This slide covers allocation of funds for raising dollar1 Million. It involves three major areas such as expanding team, product development and marketing to reach new customers. If you are looking for a format to display your unique thoughts, then the professionally designed Allocation Of Funds Ovation Capital Funding Pitch Deck Infographics Pdf is the one for you. You can use it as a Google Slides template or a PowerPoint template. Incorporate impressive visuals, symbols, images, and other charts. Modify or reorganize the text boxes as you desire. Experiment with shade schemes and font pairings. Alter, share or cooperate with other people on your work. Download Allocation Of Funds Ovation Capital Funding Pitch Deck Infographics Pdf and find out how to give a successful presentation. Present a perfect display to your team and make your presentation unforgettable. This slide covers allocation of funds for raising dollar1 Million. It involves three major areas such as expanding team, product development and marketing to reach new customers.

Use Of BI Analysis In Healthcare Industry Infographics Pdf
This slide showcases the usage of BI analytics to increase efficiency in healthcare sector. This includes various use cases such as reputation management, easy collaboration and communication, easy cost allocation, etc. Showcasing this set of slides titled Use Of BI Analysis In Healthcare Industry Infographics Pdf. The topics addressed in these templates are Customized Patients Services, Easy Allocation Of Cost, Reputation Management. All the content presented in this PPT design is completely editable. Download it and make adjustments in color, background, font etc. as per your unique business setting. This slide showcases the usage of BI analytics to increase efficiency in healthcare sector. This includes various use cases such as reputation management, easy collaboration and communication, easy cost allocation, etc.
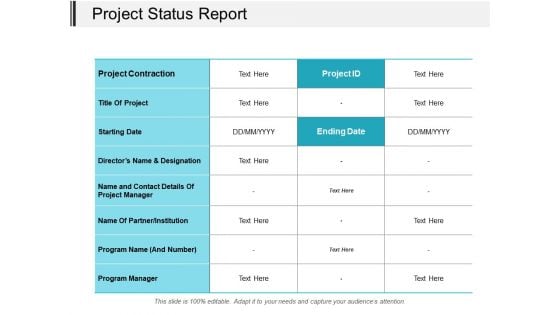
Project Status Report Ppt PowerPoint Presentation Infographics Deck
Presenting this set of slides with name project status report ppt powerpoint presentation infographics deck. The topics discussed in these slides are project management, project progress, project growth. This is a completely editable PowerPoint presentation and is available for immediate download. Download now and impress your audience.
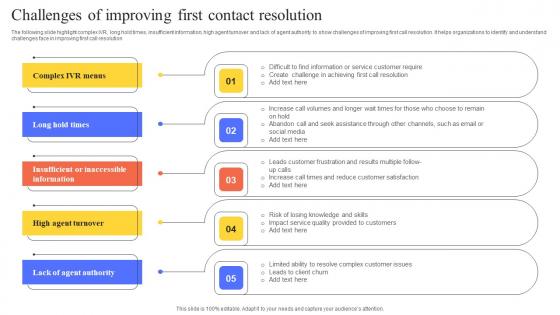
Challenges Of Improving First Contact Resolution Infographics Pdf
The following slide highlight complex IVR, long hold times, insufficient information, high agent turnover and lack of agent authority to show challenges of improving first call resolution. It helps organizations to identify and understand challenges face in improving first call resolution.Pitch your topic with ease and precision using this Challenges Of Improving First Contact Resolution Infographics Pdf This layout presents information on Resolve Complex, Customer Issues, Impact Service It is also available for immediate download and adjustment. So, changes can be made in the color, design, graphics or any other component to create a unique layout. The following slide highlight complex IVR, long hold times, insufficient information, high agent turnover and lack of agent authority to show challenges of improving first call resolution. It helps organizations to identify and understand challenges face in improving first call resolution
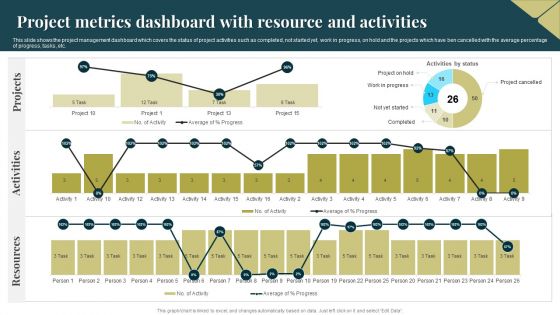
Project Metrics Dashboard With Resource And Activities Infographics PDF
This slide shows the project management dashboard which covers the status of project activities such as completed, not started yet, work in progress, on hold and the projects which have ben cancelled with the average percentage of progress, tasks, etc. Showcasing this set of slides titled Project Metrics Dashboard With Resource And Activities Infographics PDF. The topics addressed in these templates are Activities, Projects, Resources. All the content presented in this PPT design is completely editable. Download it and make adjustments in color, background, font etc. as per your unique business setting.
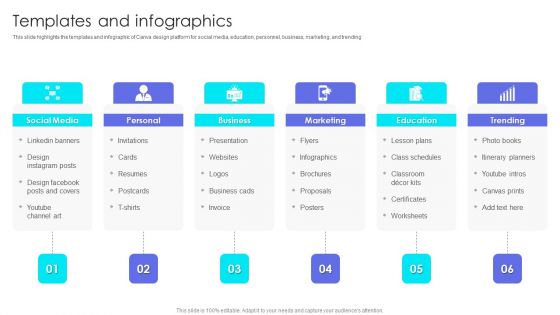
Canva Pro Business Profile Templates And Infographics Designs PDF
This slide highlights the templates and infographic of Canva design platform for social media, education, personnel, business, marketing, and trending. Presenting Canva Pro Business Profile Templates And Infographics Designs PDF to provide visual cues and insights. Share and navigate important information on six stages that need your due attention. This template can be used to pitch topics like Business, Marketing, Education, Trending. In addtion, this PPT design contains high resolution images, graphics, etc, that are easily editable and available for immediate download.

Benefits And Positive Impacts Of Edge Analytics Infographics Pdf
This slide covers the benefits of edge analytics and positive impacts on businesses. The purpose of this template is to showcase the advantages of edge analytics in terms of reduced latency, improved security, and improved compliance. It includes operational efficiency, reduced data breaches, and enhanced decision making.Pitch your topic with ease and precision using this Benefits And Positive Impacts Of Edge Analytics Infographics Pdf This layout presents information on Reduced Latency, Improved Security, Increased Scalability It is also available for immediate download and adjustment. So, changes can be made in the color, design, graphics or any other component to create a unique layout. This slide covers the benefits of edge analytics and positive impacts on businesses. The purpose of this template is to showcase the advantages of edge analytics in terms of reduced latency, improved security, and improved compliance. It includes operational efficiency, reduced data breaches, and enhanced decision making.
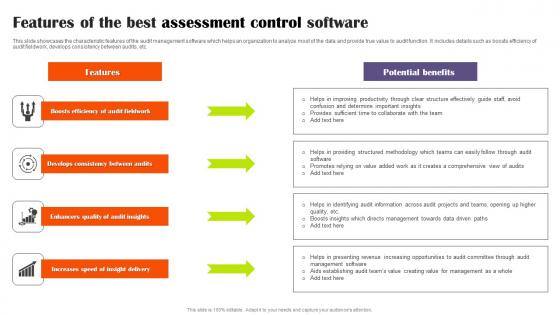
Features Of The Best Assessment Control Software Infographics Pdf
This slide showcases the characteristic features of the audit management software which helps an organization to analyze most of the data and provide true value to audit function. It includes details such as boosts efficiency of audit fieldwork, develops consistency between audits, etc. Showcasing this set of slides titled Features Of The Best Assessment Control Software Infographics Pdf The topics addressed in these templates are Boosts Efficiency, Audit Fieldwork, Develops Consistency All the content presented in this PPT design is completely editable. Download it and make adjustments in color, background, font etc. as per your unique business setting. This slide showcases the characteristic features of the audit management software which helps an organization to analyze most of the data and provide true value to audit function. It includes details such as boosts efficiency of audit fieldwork, develops consistency between audits, etc.
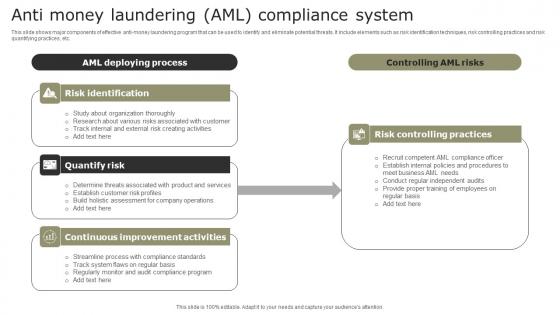
Anti Money Laundering AML Compliance System Infographics Pdf
This slide shows major components of effective anti-money laundering program that can be used to identify and eliminate potential threats. It include elements such as risk identification techniques, risk controlling practices and risk quantifying practices, etc. Showcasing this set of slides titled Anti Money Laundering AML Compliance System Infographics Pdf. The topics addressed in these templates are Risk Identification, Quantify Risk, Continuous Improvement Activities. All the content presented in this PPT design is completely editable. Download it and make adjustments in color, background, font etc. as per your unique business setting. This slide shows major components of effective anti-money laundering program that can be used to identify and eliminate potential threats. It include elements such as risk identification techniques, risk controlling practices and risk quantifying practices, etc.
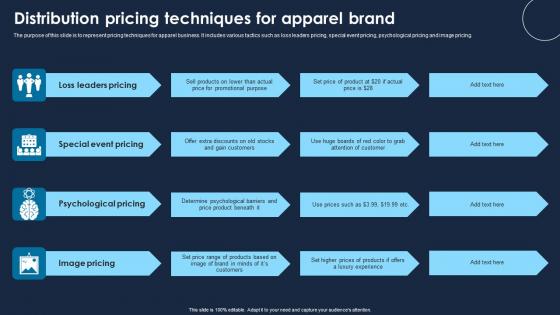
Distribution Pricing Techniques For Apparel Brand Infographics Pdf
The purpose of this slide is to represent pricing techniques for apparel business. It includes various tactics such as loss leaders pricing, special event pricing, psychological pricing and image pricing. Showcasing this set of slides titled Distribution Pricing Techniques For Apparel Brand Infographics Pdf The topics addressed in these templates are Loss Leaders Pricing, Special Event Pricing All the content presented in this PPT design is completely editable. Download it and make adjustments in color, background, font etc. as per your unique business setting. The purpose of this slide is to represent pricing techniques for apparel business. It includes various tactics such as loss leaders pricing, special event pricing, psychological pricing and image pricing.
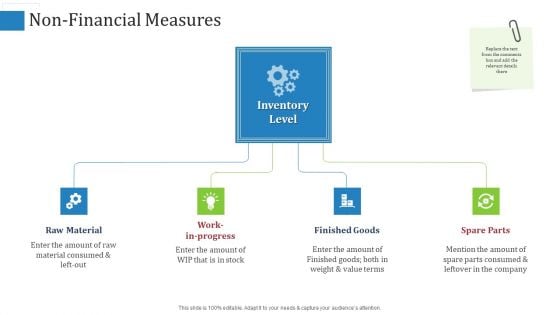
Non Financial Measures Amount Ppt Infographics Tips PDF
This is a NON financial measures amount ppt infographics tips pdf. template with various stages. Focus and dispense information on four stages using this creative set, that comes with editable features. It contains large content boxes to add your information on topics like raw material, work in progress, finished goods, spare parts. You can also showcase facts, figures, and other relevant content using this PPT layout. Grab it now.
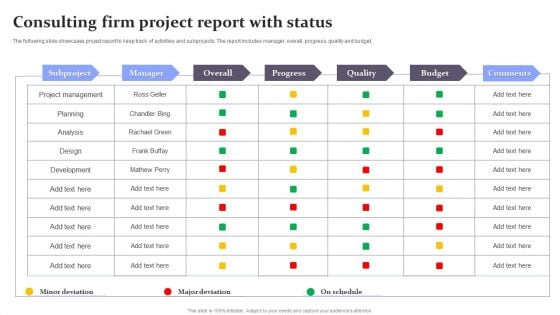
Consulting Firm Project Report With Status Infographics PDF
The following slide showcases project report to keep track of activities and subprojects. The report includes manager, overall, progress, quality and budget. Showcasing this set of slides titled Consulting Firm Project Report With Status Infographics PDF. The topics addressed in these templates are Development, Design, Analysis. All the content presented in this PPT design is completely editable. Download it and make adjustments in color, background, font etc. as per your unique business setting.
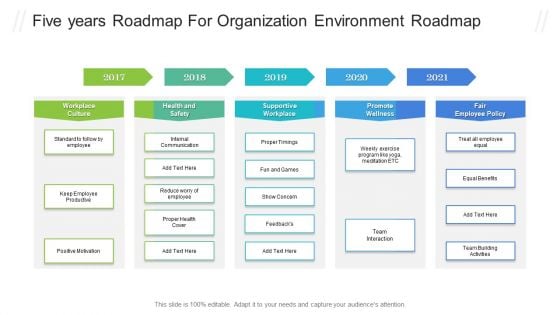
Five Years Roadmap For Organization Environment Roadmap Infographics PDF
Introducing our five years roadmap for organization environment roadmap infographics pdf. This PPT presentation is Google Slides compatible, therefore, you can share it easily with the collaborators for measuring the progress. Also, the presentation is available in both standard screen and widescreen aspect ratios. So edit the template design by modifying the font size, font type, color, and shapes as per your requirements. As this PPT design is fully editable it can be presented in PDF, JPG and PNG formats.

Employee Value Proposition Create Recruitment Content Marketing Plan Infographics PDF
This slide covers recruitment content marketing plan including status update, content types, target audience and publishing platforms etc. Deliver and pitch your topic in the best possible manner with this Employee Value Proposition Create Recruitment Content Marketing Plan Infographics PDF. Use them to share invaluable insights on Stories Testimonials, Career Progression, Thought Leadership and impress your audience. This template can be altered and modified as per your expectations. So, grab it now.

Hybrid Customer Information Software For Enterprises Infographics PDF
The purpose of this slide is to provide overview of hybrid customer data platform that aggregate, centralizes and unifies user information. Information covered in this infographic is related to process of data collection ways.Persuade your audience using this Hybrid Customer Information Software For Enterprises Infographics PDF. This PPT design covers seven stages, thus making it a great tool to use. It also caters to a variety of topics including Engagement, Transactional, Personal Demographic. Download this PPT design now to present a convincing pitch that not only emphasizes the topic but also showcases your presentation skills.
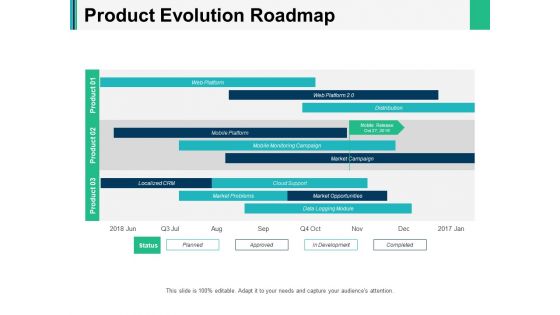
Product Evolution Roadmap Ppt PowerPoint Presentation Infographics Outfit
This is a product evolution roadmap ppt powerpoint presentation infographics outfit. This is a three stage process. The stages in this process are timeline, process, management, planning, business.
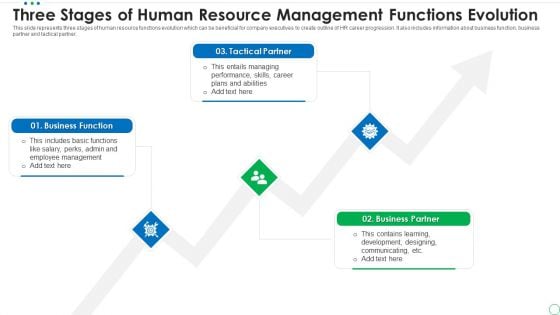
Three Stages Of Human Resource Management Functions Evolution Infographics PDF
This slide represents three stages of human resource functions evolution which can be beneficial for company executives to create outline of HR career progression. It also includes information about business function, business partner and tactical partner. Persuade your audience using this three stages of human resource management functions evolution infographics pdf. This PPT design covers three stages, thus making it a great tool to use. It also caters to a variety of topics including business function, tactical partner, business partner. Download this PPT design now to present a convincing pitch that not only emphasizes the topic but also showcases your presentation skills.
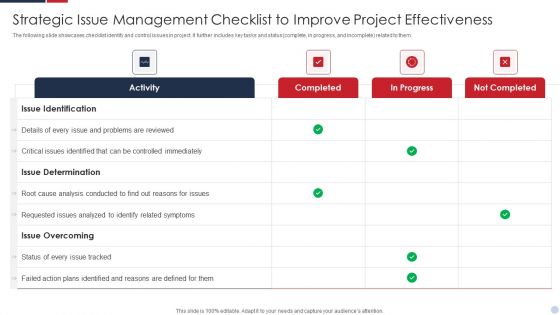
Strategic Issue Management Checklist To Improve Project Effectiveness Infographics PDF
The following slide showcases checklist identify and control issues in project. It further includes key tasks and status complete, in progress, and incomplete related to them. Pitch your topic with ease and precision using this Strategic Issue Management Checklist To Improve Project Effectiveness Infographics PDF. This layout presents information on Issue Overcoming, Issue Identification, Issue Determination. It is also available for immediate download and adjustment. So, changes can be made in the color, design, graphics or any other component to create a unique layout.
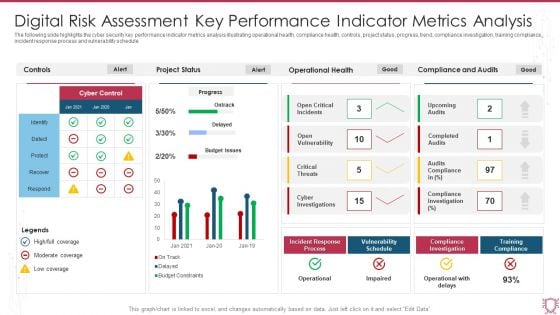
Digital Risk Assessment Key Performance Indicator Metrics Analysis Infographics PDF
The following slide highlights the cyber security key performance indicator metrics analysis illustrating operational health, compliance health, controls, project status, progress, trend, compliance investigation, training compliance, incident response process and vulnerability schedule. Showcasing this set of slides titled Digital Risk Assessment Key Performance Indicator Metrics Analysis Infographics PDF. The topics addressed in these templates are Project Status, Operational Health, Compliance And Audits. All the content presented in this PPT design is completely editable. Download it and make adjustments in color, background, font etc. as per your unique business setting.
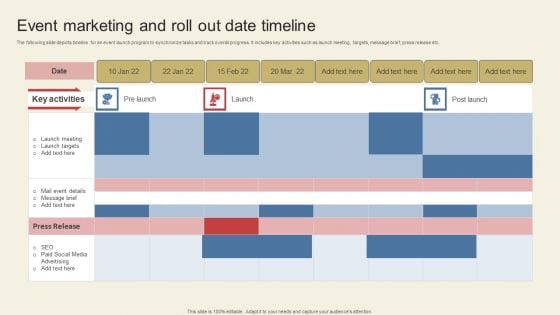
Event Marketing And Roll Out Date Timeline Infographics PDF
The following slide depicts timeline for an event launch program to synchronize tasks and track overall progress. It includes key activities such as launch meeting, targets, message brief, press release etc. Showcasing this set of slides titled Event Marketing And Roll Out Date Timeline Infographics PDF. The topics addressed in these templates are Launch Meeting, Launch Targets, Mail Event Details. All the content presented in this PPT design is completely editable. Download it and make adjustments in color, background, font etc. as per your unique business setting.
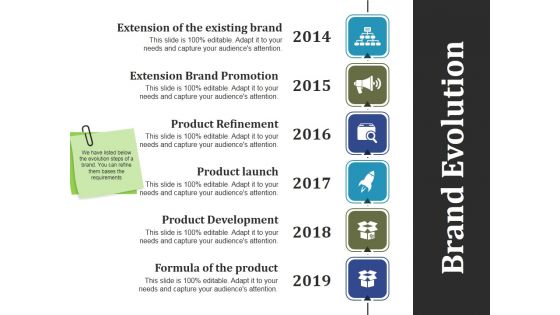
Brand Evolution Template 1 Ppt PowerPoint Presentation Infographics Samples
This is a brand evolution template 1 ppt powerpoint presentation infographics samples. This is a six stage process. The stages in this process are product refinement, product launch, product development, formula of the product, brand evolution.
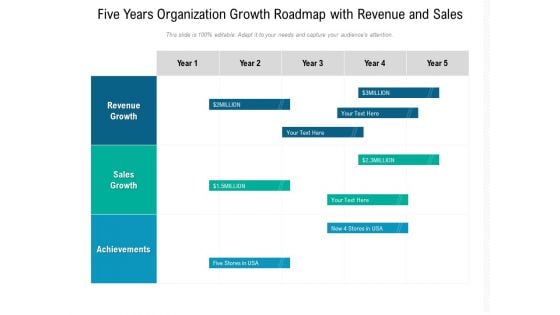
Five Years Organization Growth Roadmap With Revenue And Sales Infographics
Introducing our five years organization growth roadmap with revenue and sales infographics. This PPT presentation is Google Slides compatible, therefore, you can share it easily with the collaborators for measuring the progress. Also, the presentation is available in both standard screen and widescreen aspect ratios. So edit the template design by modifying the font size, font type, color, and shapes as per your requirements. As this PPT design is fully editable it can be presented in PDF, JPG and PNG formats.
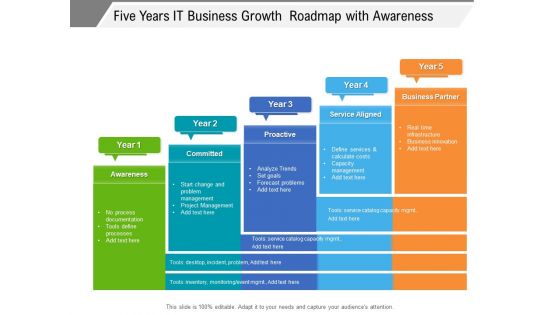
Five Years IT Business Growth Roadmap With Awareness Infographics
Introducing our five years it business growth roadmap with awareness infographics. This PPT presentation is Google Slides compatible, therefore, you can share it easily with the collaborators for measuring the progress. Also, the presentation is available in both standard screen and widescreen aspect ratios. So edit the template design by modifying the font size, font type, color, and shapes as per your requirements. As this PPT design is fully editable it can be presented in PDF, JPG and PNG formats.
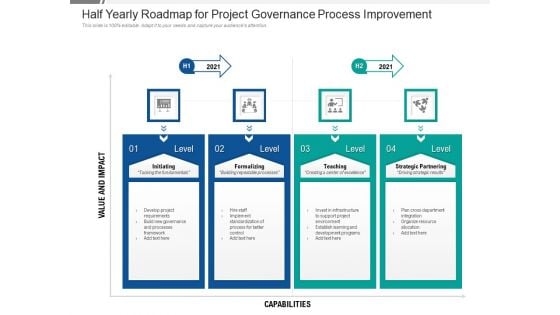
Half Yearly Roadmap For Project Governance Process Improvement Infographics
Introducing our half yearly roadmap for project governance process improvement infographics. This PPT presentation is Google Slides compatible, therefore, you can share it easily with the collaborators for measuring the progress. Also, the presentation is available in both standard screen and widescreen aspect ratios. So edit the template design by modifying the font size, font type, color, and shapes as per your requirements. As this PPT design is fully editable it can be presented in PDF, JPG and PNG formats.
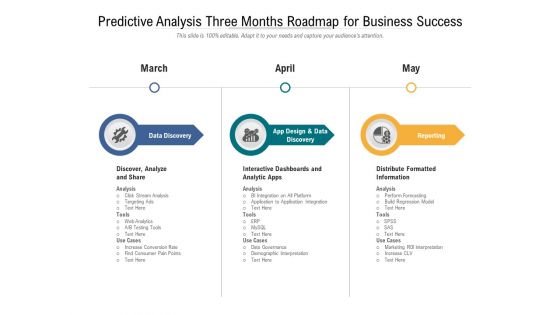
Predictive Analysis Three Months Roadmap For Business Success Infographics
Introducing our predictive analysis three months roadmap for business success infographics. This PPT presentation is Google Slides compatible, therefore, you can share it easily with the collaborators for measuring the progress. Also, the presentation is available in both standard screen and widescreen aspect ratios. So edit the template design by modifying the font size, font type, color, and shapes as per your requirements. As this PPT design is fully editable it can be presented in PDF, JPG and PNG formats.
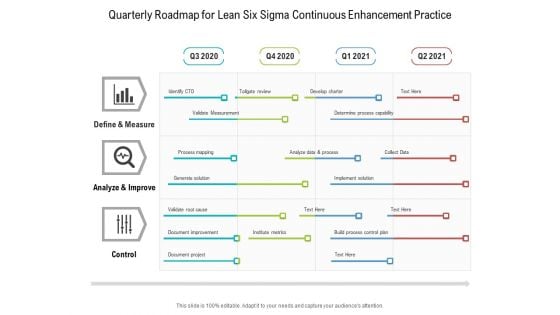
Quarterly Roadmap For Lean Six Sigma Continuous Enhancement Practice Infographics
Introducing our quarterly roadmap for lean six sigma continuous enhancement practice infographics. This PPT presentation is Google Slides compatible, therefore, you can share it easily with the collaborators for measuring the progress. Also, the presentation is available in both standard screen and widescreen aspect ratios. So edit the template design by modifying the font size, font type, color, and shapes as per your requirements. As this PPT design is fully editable it can be presented in PDF, JPG and PNG formats.
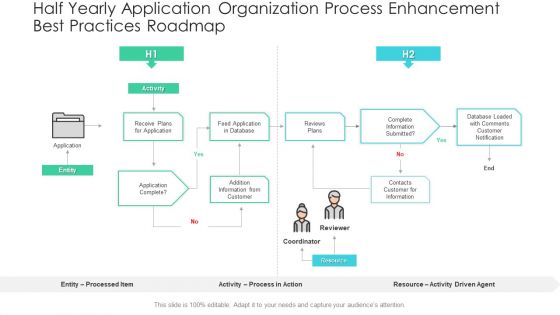
Half Yearly Application Organization Process Enhancement Best Practices Roadmap Infographics
Introducing our half yearly application organization process enhancement best practices roadmap infographics. This PPT presentation is Google Slides compatible, therefore, you can share it easily with the collaborators for measuring the progress. Also, the presentation is available in both standard screen and widescreen aspect ratios. So edit the template design by modifying the font size, font type, color, and shapes as per your requirements. As this PPT design is fully editable it can be presented in PDF, JPG and PNG formats.
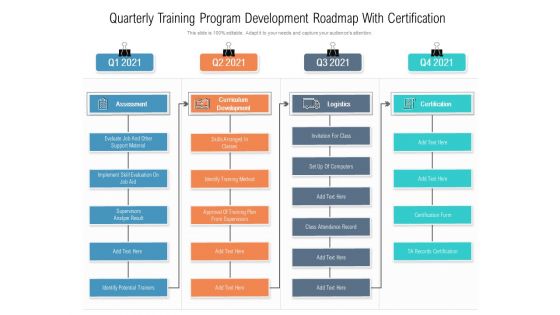
Quarterly Training Program Development Roadmap With Certification Infographics
Introducing our quarterly training program development roadmap with certification infographics. This PPT presentation is Google Slides compatible, therefore, you can share it easily with the collaborators for measuring the progress. Also, the presentation is available in both standard screen and widescreen aspect ratios. So edit the template design by modifying the font size, font type, color, and shapes as per your requirements. As this PPT design is fully editable it can be presented in PDF, JPG and PNG formats.
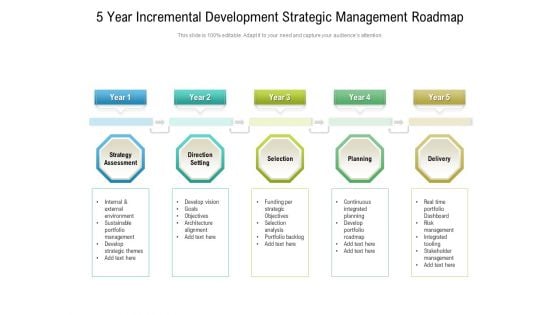
5 Year Incremental Development Strategic Management Roadmap Infographics
Introducing our 5 year incremental development strategic management roadmap infographics. This PPT presentation is Google Slides compatible, therefore, you can share it easily with the collaborators for measuring the progress. Also, the presentation is available in both standard screen and widescreen aspect ratios. So edit the template design by modifying the font size, font type, color, and shapes as per your requirements. As this PPT design is fully editable it can be presented in PDF, JPG and PNG formats.
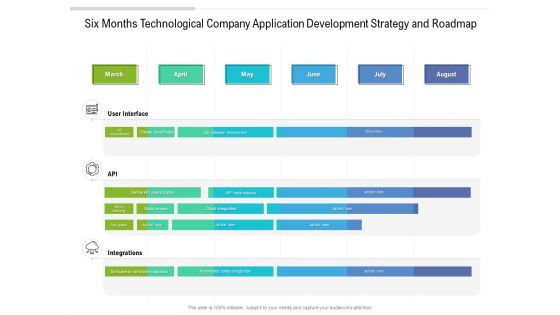
Six Months Technological Company Application Development Strategy And Roadmap Infographics
Introducing our six months technological company application development strategy and roadmap infographics. This PPT presentation is Google Slides compatible, therefore, you can share it easily with the collaborators for measuring the progress. Also, the presentation is available in both standard screen and widescreen aspect ratios. So edit the template design by modifying the font size, font type, color, and shapes as per your requirements. As this PPT design is fully editable it can be presented in PDF, JPG and PNG formats.
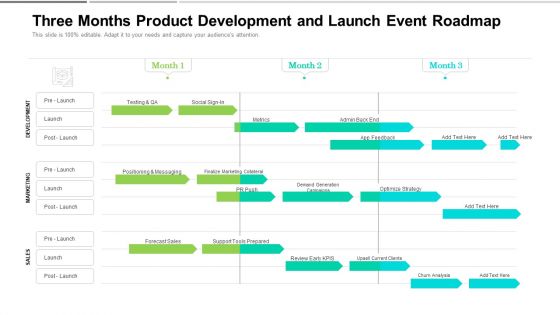
Three Months Product Development And Launch Event Roadmap Infographics
Introducing our three months product development and launch event roadmap infographics. This PPT presentation is Google Slides compatible, therefore, you can share it easily with the collaborators for measuring the progress. Also, the presentation is available in both standard screen and widescreen aspect ratios. So edit the template design by modifying the font size, font type, color, and shapes as per your requirements. As this PPT design is fully editable it can be presented in PDF, JPG and PNG formats.

3 Months Scrum Sprint Roadmap For Product Development Infographics
Introducing our 3 months scrum sprint roadmap for product development infographics. This PPT presentation is Google Slides compatible, therefore, you can share it easily with the collaborators for measuring the progress. Also, the presentation is available in both standard screen and widescreen aspect ratios. So edit the template design by modifying the font size, font type, color, and shapes as per your requirements. As this PPT design is fully editable it can be presented in PDF, JPG and PNG formats.
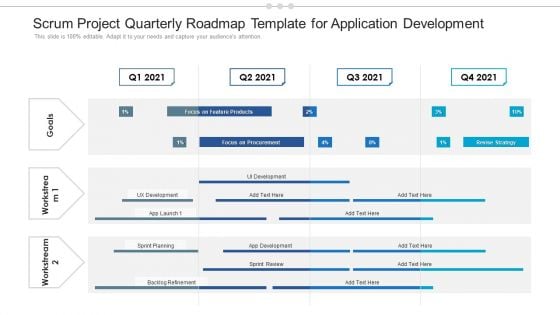
Scrum Project Quarterly Roadmap Template For Application Development Infographics
Introducing our scrum project quarterly roadmap template for application development infographics. This PPT presentation is Google Slides compatible, therefore, you can share it easily with the collaborators for measuring the progress. Also, the presentation is available in both standard screen and widescreen aspect ratios. So edit the template design by modifying the font size, font type, color, and shapes as per your requirements. As this PPT design is fully editable it can be presented in PDF, JPG and PNG formats.
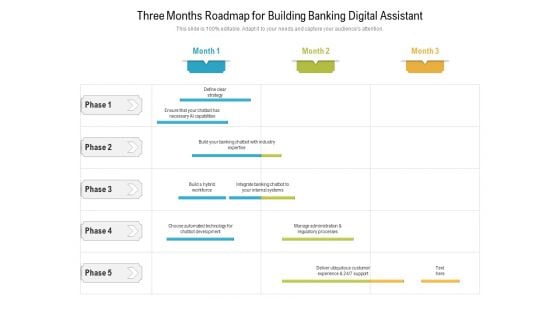
Three Months Roadmap For Building Banking Digital Assistant Infographics
Introducing our three months roadmap for building banking digital assistant infographics. This PPT presentation is Google Slides compatible, therefore, you can share it easily with the collaborators for measuring the progress. Also, the presentation is available in both standard screen and widescreen aspect ratios. So edit the template design by modifying the font size, font type, color, and shapes as per your requirements. As this PPT design is fully editable it can be presented in PDF, JPG and PNG formats.
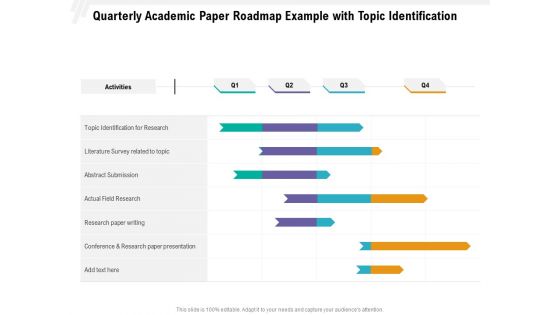
Quarterly Academic Paper Roadmap Example With Topic Identification Infographics
Introducing our quarterly academic paper roadmap example with topic identification infographics. This PPT presentation is Google Slides compatible, therefore, you can share it easily with the collaborators for measuring the progress. Also, the presentation is available in both standard screen and widescreen aspect ratios. So edit the template design by modifying the font size, font type, color, and shapes as per your requirements. As this PPT design is fully editable it can be presented in PDF, JPG and PNG formats.

5 Year Payment Fulfillment Roadmap For New Project Infographics
Introducing our 5 year payment fulfillment roadmap for new project infographics. This PPT presentation is Google Slides compatible, therefore, you can share it easily with the collaborators for measuring the progress. Also, the presentation is available in both standard screen and widescreen aspect ratios. So edit the template design by modifying the font size, font type, color, and shapes as per your requirements. As this PPT design is fully editable it can be presented in PDF, JPG and PNG formats.
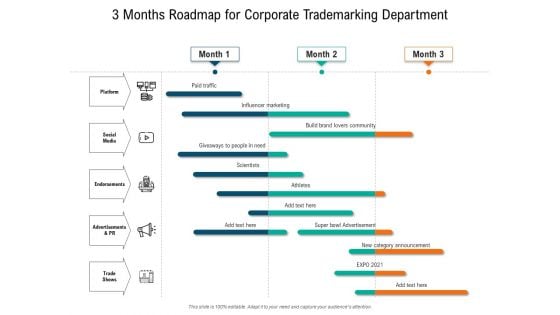
3 Months Roadmap For Corporate Trademarking Department Infographics
Introducing our 3 months roadmap for corporate trademarking department infographics. This PPT presentation is Google Slides compatible, therefore, you can share it easily with the collaborators for measuring the progress. Also, the presentation is available in both standard screen and widescreen aspect ratios. So edit the template design by modifying the font size, font type, color, and shapes as per your requirements. As this PPT design is fully editable it can be presented in PDF, JPG and PNG formats.
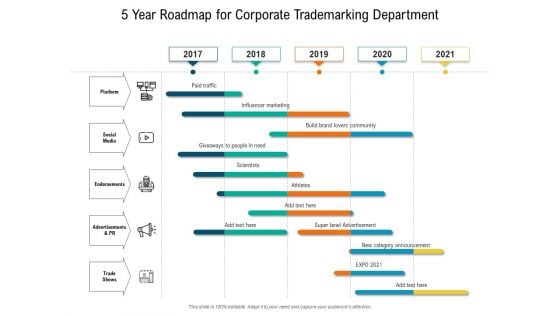
5 Year Roadmap For Corporate Trademarking Department Infographics
Introducing our 5 year roadmap for corporate trademarking department infographics. This PPT presentation is Google Slides compatible, therefore, you can share it easily with the collaborators for measuring the progress. Also, the presentation is available in both standard screen and widescreen aspect ratios. So edit the template design by modifying the font size, font type, color, and shapes as per your requirements. As this PPT design is fully editable it can be presented in PDF, JPG and PNG formats.
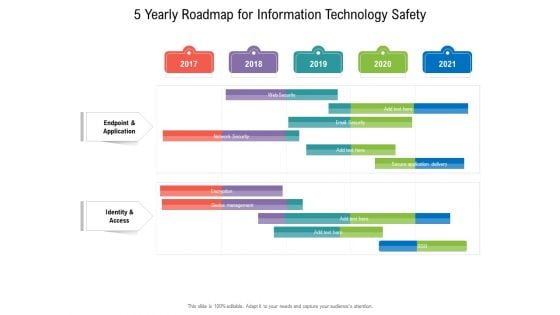
5 Yearly Roadmap For Information Technology Safety Infographics
Introducing our 5 yearly roadmap for information technology safety infographics. This PPT presentation is Google Slides compatible, therefore, you can share it easily with the collaborators for measuring the progress. Also, the presentation is available in both standard screen and widescreen aspect ratios. So edit the template design by modifying the font size, font type, color, and shapes as per your requirements. As this PPT design is fully editable it can be presented in PDF, JPG and PNG formats.
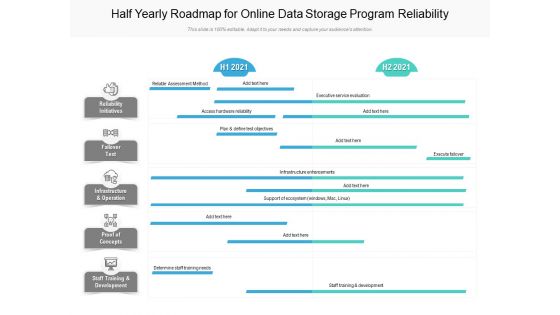
Half Yearly Roadmap For Online Data Storage Program Reliability Infographics
Introducing our half yearly roadmap for online data storage program reliability infographics. This PPT presentation is Google Slides compatible, therefore, you can share it easily with the collaborators for measuring the progress. Also, the presentation is available in both standard screen and widescreen aspect ratios. So edit the template design by modifying the font size, font type, color, and shapes as per your requirements. As this PPT design is fully editable it can be presented in PDF, JPG and PNG formats.
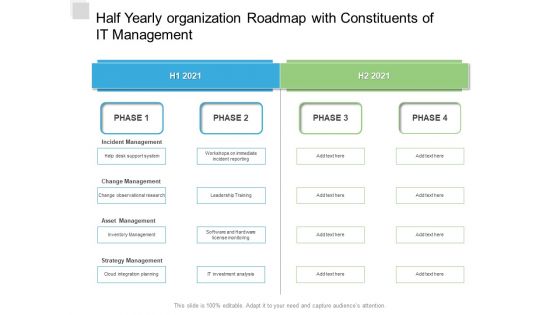
Half Yearly Organization Roadmap With Constituents Of IT Management Infographics
Introducing our half yearly organization roadmap with constituents of it management infographics. This PPT presentation is Google Slides compatible, therefore, you can share it easily with the collaborators for measuring the progress. Also, the presentation is available in both standard screen and widescreen aspect ratios. So edit the template design by modifying the font size, font type, color, and shapes as per your requirements. As this PPT design is fully editable it can be presented in PDF, JPG and PNG formats.
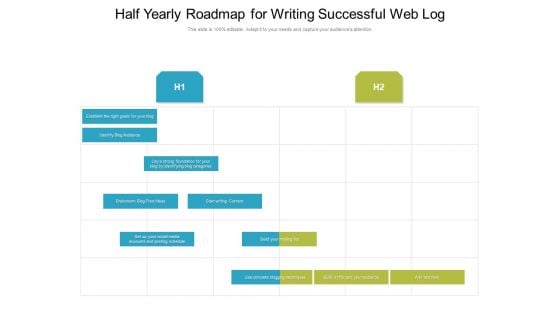
Half Yearly Roadmap For Writing Successful Web Log Infographics
Introducing our half yearly roadmap for writing successful web log infographics. This PPT presentation is Google Slides compatible, therefore, you can share it easily with the collaborators for measuring the progress. Also, the presentation is available in both standard screen and widescreen aspect ratios. So edit the template design by modifying the font size, font type, color, and shapes as per your requirements. As this PPT design is fully editable it can be presented in PDF, JPG and PNG formats.
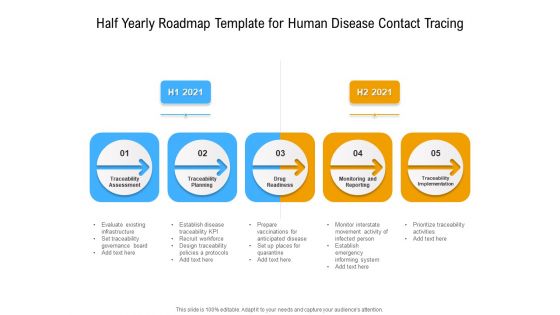
Half Yearly Roadmap Template For Human Disease Contact Tracing Infographics
Introducing our half yearly roadmap template for human disease contact tracing infographics. This PPT presentation is Google Slides compatible, therefore, you can share it easily with the collaborators for measuring the progress. Also, the presentation is available in both standard screen and widescreen aspect ratios. So edit the template design by modifying the font size, font type, color, and shapes as per your requirements. As this PPT design is fully editable it can be presented in PDF, JPG and PNG formats.
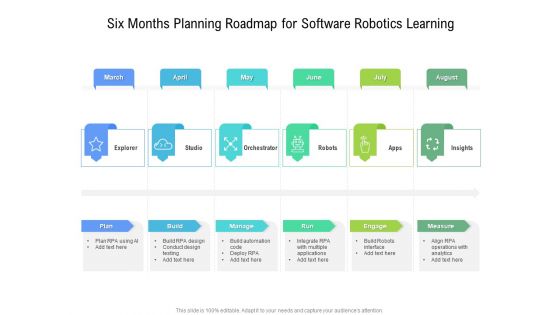
Six Months Planning Roadmap For Software Robotics Learning Infographics
Introducing our six months planning roadmap for software robotics learning infographics. This PPT presentation is Google Slides compatible, therefore, you can share it easily with the collaborators for measuring the progress. Also, the presentation is available in both standard screen and widescreen aspect ratios. So edit the template design by modifying the font size, font type, color, and shapes as per your requirements. As this PPT design is fully editable it can be presented in PDF, JPG and PNG formats.
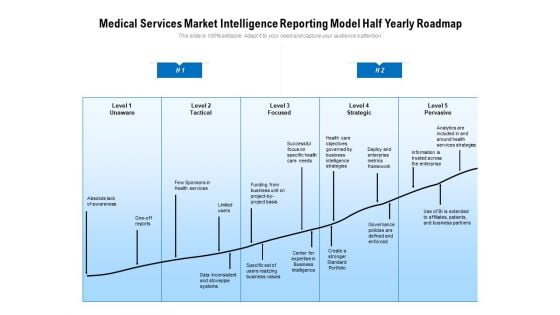
Medical Services Market Intelligence Reporting Model Half Yearly Roadmap Infographics
Introducing our medical services market intelligence reporting model half yearly roadmap infographics. This PPT presentation is Google Slides compatible, therefore, you can share it easily with the collaborators for measuring the progress. Also, the presentation is available in both standard screen and widescreen aspect ratios. So edit the template design by modifying the font size, font type, color, and shapes as per your requirements. As this PPT design is fully editable it can be presented in PDF, JPG and PNG formats.
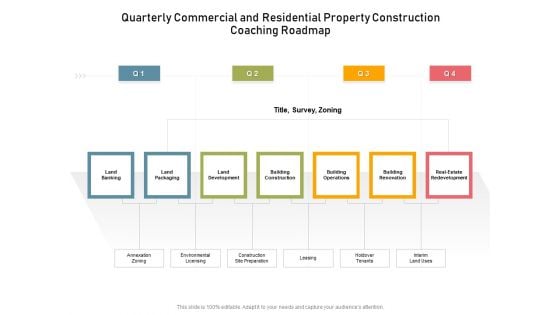
Quarterly Commercial And Residential Property Construction Coaching Roadmap Infographics
Introducing our quarterly commercial and residential property construction coaching roadmap infographics. This PPT presentation is Google Slides compatible, therefore, you can share it easily with the collaborators for measuring the progress. Also, the presentation is available in both standard screen and widescreen aspect ratios. So edit the template design by modifying the font size, font type, color, and shapes as per your requirements. As this PPT design is fully editable it can be presented in PDF, JPG and PNG formats.
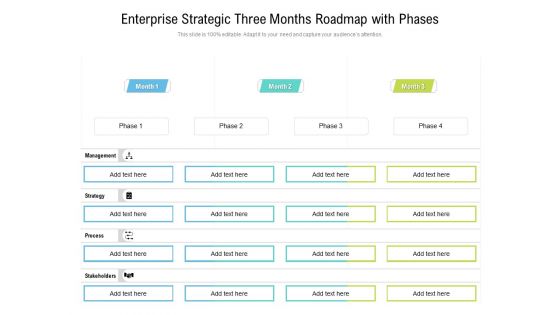
Enterprise Strategic Three Months Roadmap With Phases Infographics
Introducing our enterprise strategic three months roadmap with phases infographics. This PPT presentation is Google Slides compatible, therefore, you can share it easily with the collaborators for measuring the progress. Also, the presentation is available in both standard screen and widescreen aspect ratios. So edit the template design by modifying the font size, font type, color, and shapes as per your requirements. As this PPT design is fully editable it can be presented in PDF, JPG and PNG formats.
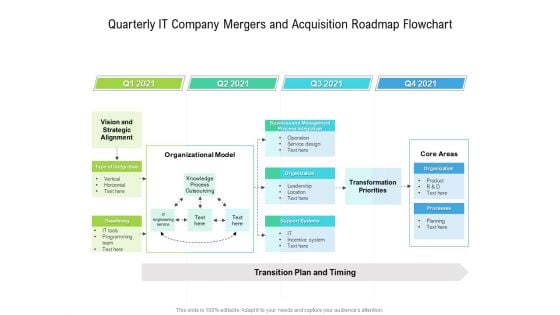
Quarterly IT Company Mergers And Acquisition Roadmap Flowchart Infographics
Introducing our quarterly it company mergers and acquisition roadmap flowchart infographics. This PPT presentation is Google Slides compatible, therefore, you can share it easily with the collaborators for measuring the progress. Also, the presentation is available in both standard screen and widescreen aspect ratios. So edit the template design by modifying the font size, font type, color, and shapes as per your requirements. As this PPT design is fully editable it can be presented in PDF, JPG and PNG formats.
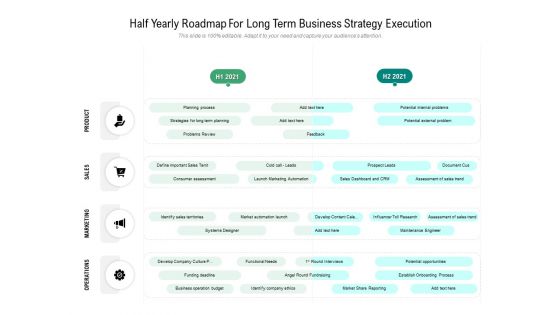
Half Yearly Roadmap For Long Term Business Strategy Execution Infographics
Introducing our half yearly roadmap for long term business strategy execution infographics. This PPT presentation is Google Slides compatible, therefore, you can share it easily with the collaborators for measuring the progress. Also, the presentation is available in both standard screen and widescreen aspect ratios. So edit the template design by modifying the font size, font type, color, and shapes as per your requirements. As this PPT design is fully editable it can be presented in PDF, JPG and PNG formats.
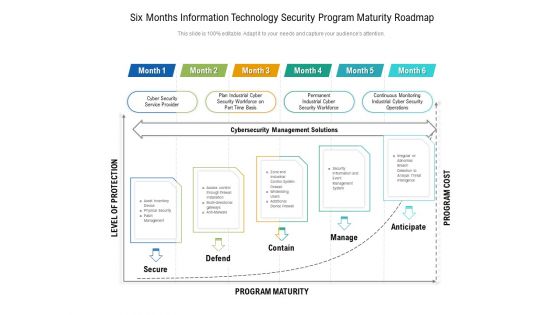
Six Months Information Technology Security Program Maturity Roadmap Infographics
Introducing our six months information technology security program maturity roadmap infographics. This PPT presentation is Google Slides compatible, therefore, you can share it easily with the collaborators for measuring the progress. Also, the presentation is available in both standard screen and widescreen aspect ratios. So edit the template design by modifying the font size, font type, color, and shapes as per your requirements. As this PPT design is fully editable it can be presented in PDF, JPG and PNG formats.
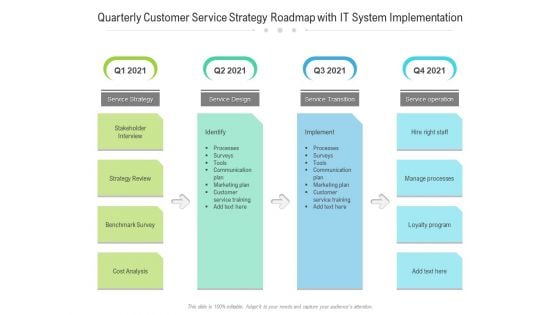
Quarterly Customer Service Strategy Roadmap With IT System Implementation Infographics
Introducing our quarterly customer service strategy roadmap with it system implementation infographics. This PPT presentation is Google Slides compatible, therefore, you can share it easily with the collaborators for measuring the progress. Also, the presentation is available in both standard screen and widescreen aspect ratios. So edit the template design by modifying the font size, font type, color, and shapes as per your requirements. As this PPT design is fully editable it can be presented in PDF, JPG and PNG formats.
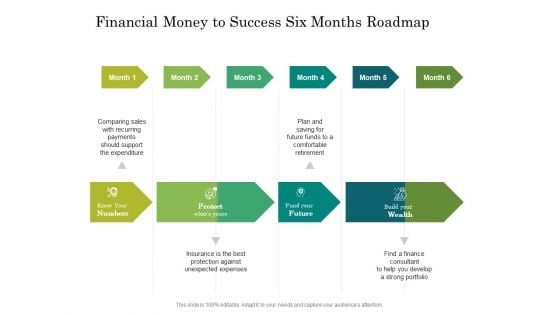
Financial Money To Success Six Months Roadmap Infographics
Introducing our financial money to success six months roadmap infographics. This PPT presentation is Google Slides compatible, therefore, you can share it easily with the collaborators for measuring the progress. Also, the presentation is available in both standard screen and widescreen aspect ratios. So edit the template design by modifying the font size, font type, color, and shapes as per your requirements. As this PPT design is fully editable it can be presented in PDF, JPG and PNG formats.
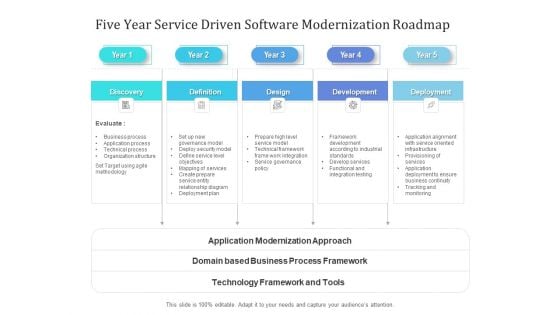
Five Year Service Driven Software Modernization Roadmap Infographics
Introducing our five year service driven software modernization roadmap infographics. This PPT presentation is Google Slides compatible, therefore, you can share it easily with the collaborators for measuring the progress. Also, the presentation is available in both standard screen and widescreen aspect ratios. So edit the template design by modifying the font size, font type, color, and shapes as per your requirements. As this PPT design is fully editable it can be presented in PDF, JPG and PNG formats.


 Continue with Email

 Home
Home


