Progress Infographic
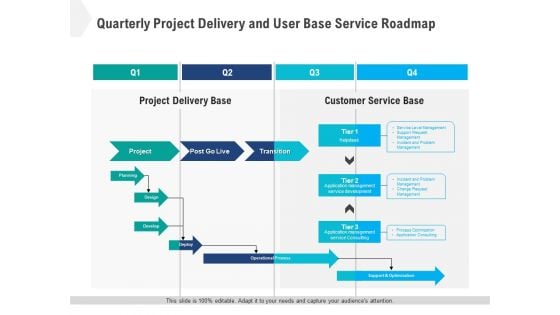
Quarterly Project Delivery And User Base Service Roadmap Infographics
Introducing our quarterly project delivery and user base service roadmap infographics. This PPT presentation is Google Slides compatible, therefore, you can share it easily with the collaborators for measuring the progress. Also, the presentation is available in both standard screen and widescreen aspect ratios. So edit the template design by modifying the font size, font type, color, and shapes as per your requirements. As this PPT design is fully editable it can be presented in PDF, JPG and PNG formats.
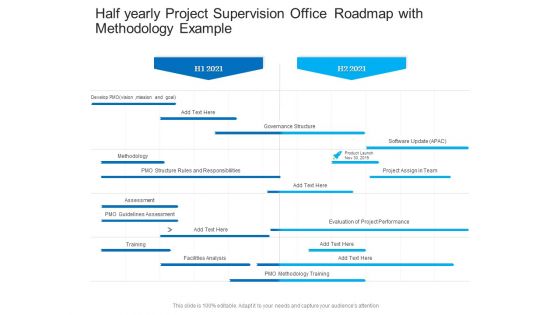
Half Yearly Project Supervision Office Roadmap With Methodology Example Infographics
Introducing our half yearly project supervision office roadmap with methodology example infographics. This PPT presentation is Google Slides compatible, therefore, you can share it easily with the collaborators for measuring the progress. Also, the presentation is available in both standard screen and widescreen aspect ratios. So edit the template design by modifying the font size, font type, color, and shapes as per your requirements. As this PPT design is fully editable it can be presented in PDF, JPG and PNG formats.
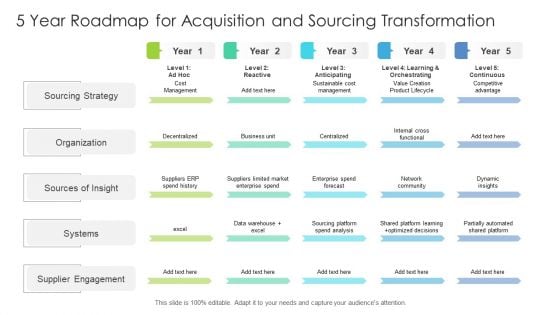
5 Year Roadmap For Acquisition And Sourcing Transformation Infographics
Introducing our 5 year roadmap for acquisition and sourcing transformation infographics. This PPT presentation is Google Slides compatible, therefore, you can share it easily with the collaborators for measuring the progress. Also, the presentation is available in both standard screen and widescreen aspect ratios. So edit the template design by modifying the font size, font type, color, and shapes as per your requirements. As this PPT design is fully editable it can be presented in PDF, JPG and PNG formats.
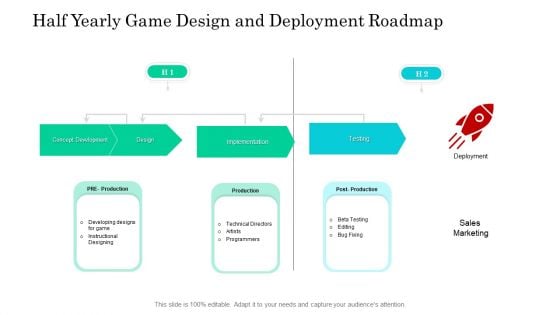
Half Yearly Game Design And Deployment Roadmap Infographics
Introducing our half yearly game design and deployment roadmap infographics. This PPT presentation is Google Slides compatible, therefore, you can share it easily with the collaborators for measuring the progress. Also, the presentation is available in both standard screen and widescreen aspect ratios. So edit the template design by modifying the font size, font type, color, and shapes as per your requirements. As this PPT design is fully editable it can be presented in PDF, JPG and PNG formats.
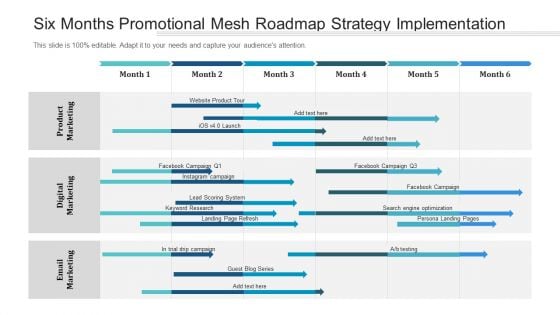
Six Months Promotional Mesh Roadmap Strategy Implementation Infographics
Introducing our six months promotional mesh roadmap strategy implementation infographics. This PPT presentation is Google Slides compatible, therefore, you can share it easily with the collaborators for measuring the progress. Also, the presentation is available in both standard screen and widescreen aspect ratios. So edit the template design by modifying the font size, font type, color, and shapes as per your requirements. As this PPT design is fully editable it can be presented in PDF, JPG and PNG formats.

Three Months Product Feature Prioritization Structure Roadmap Infographics
Introducing our three months product feature prioritization structure roadmap infographics. This PPT presentation is Google Slides compatible, therefore, you can share it easily with the collaborators for measuring the progress. Also, the presentation is available in both standard screen and widescreen aspect ratios. So edit the template design by modifying the font size, font type, color, and shapes as per your requirements. As this PPT design is fully editable it can be presented in PDF, JPG and PNG formats.
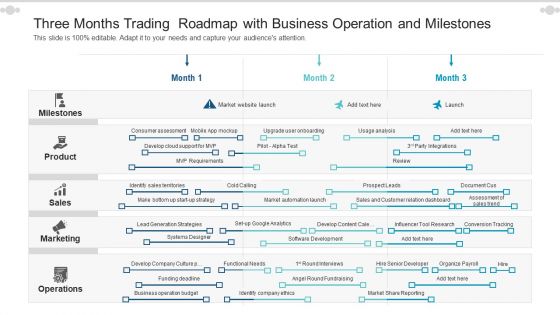
Three Months Trading Roadmap With Business Operation And Milestones Infographics
Introducing our three months trading roadmap with business operation and milestones infographics. This PPT presentation is Google Slides compatible, therefore, you can share it easily with the collaborators for measuring the progress. Also, the presentation is available in both standard screen and widescreen aspect ratios. So edit the template design by modifying the font size, font type, color, and shapes as per your requirements. As this PPT design is fully editable it can be presented in PDF, JPG and PNG formats.
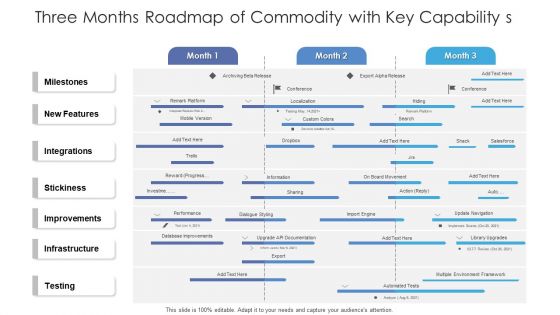
Three Months Roadmap Of Commodity With Key Capability S Infographics
Introducing our three months roadmap of commodity with key capability s infographics. This PPT presentation is Google Slides compatible, therefore, you can share it easily with the collaborators for measuring the progress. Also, the presentation is available in both standard screen and widescreen aspect ratios. So edit the template design by modifying the font size, font type, color, and shapes as per your requirements. As this PPT design is fully editable it can be presented in PDF, JPG and PNG formats.
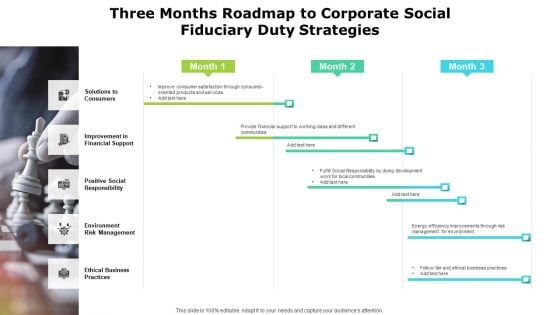
Three Months Roadmap To Corporate Social Fiduciary Duty Strategies Infographics
Introducing our three months roadmap to corporate social fiduciary duty strategies infographics. This PPT presentation is Google Slides compatible, therefore, you can share it easily with the collaborators for measuring the progress. Also, the presentation is available in both standard screen and widescreen aspect ratios. So edit the template design by modifying the font size, font type, color, and shapes as per your requirements. As this PPT design is fully editable it can be presented in PDF, JPG and PNG formats.
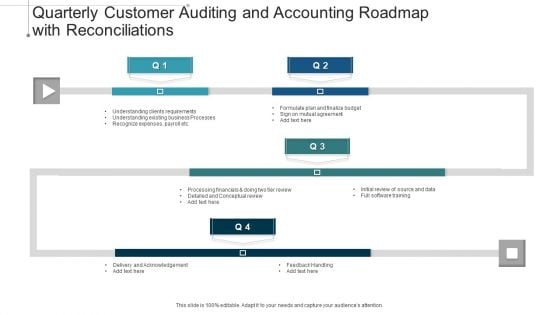
Quarterly Customer Auditing And Accounting Roadmap With Reconciliations Infographics
Introducing our quarterly customer auditing and accounting roadmap with reconciliations infographics. This PPT presentation is Google Slides compatible, therefore, you can share it easily with the collaborators for measuring the progress. Also, the presentation is available in both standard screen and widescreen aspect ratios. So edit the template design by modifying the font size, font type, color, and shapes as per your requirements. As this PPT design is fully editable it can be presented in PDF, JPG and PNG formats.
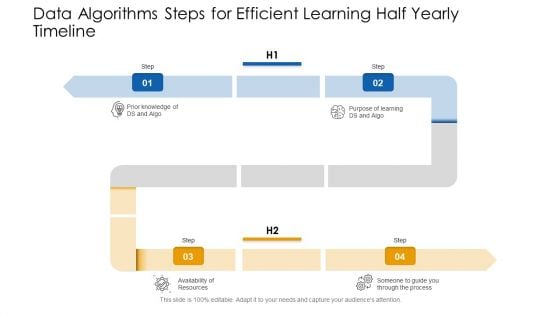
Data Algorithms Steps For Efficient Learning Half Yearly Timeline Infographics
Introducing our data algorithms steps for efficient learning half yearly timeline infographics. This PPT presentation is Google Slides compatible, therefore, you can share it easily with the collaborators for measuring the progress. Also, the presentation is available in both standard screen and widescreen aspect ratios. So edit the template design by modifying the font size, font type, color, and shapes as per your requirements. As this PPT design is fully editable it can be presented in PDF, JPG and PNG formats.
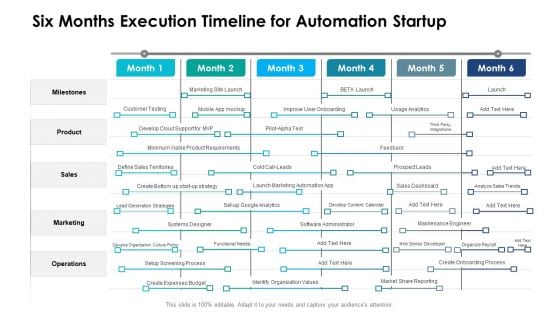
Six Months Execution Timeline For Automation Startup Infographics
Introducing our six months execution timeline for automation startup infographics. This PPT presentation is Google Slides compatible, therefore, you can share it easily with the collaborators for measuring the progress. Also, the presentation is available in both standard screen and widescreen aspect ratios. So edit the template design by modifying the font size, font type, color, and shapes as per your requirements. As this PPT design is fully editable it can be presented in PDF, JPG and PNG formats.
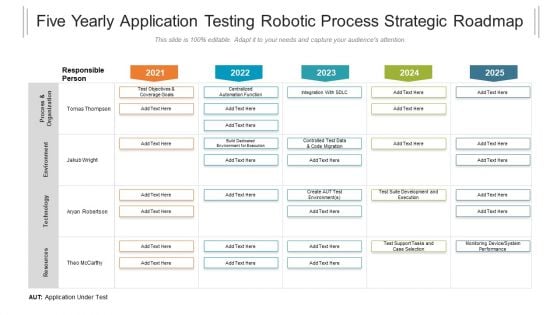
Five Yearly Application Testing Robotic Process Strategic Roadmap Infographics
Introducing our five yearly application testing robotic process strategic roadmap infographics. This PPT presentation is Google Slides compatible, therefore, you can share it easily with the collaborators for measuring the progress. Also, the presentation is available in both standard screen and widescreen aspect ratios. So edit the template design by modifying the font size, font type, color, and shapes as per your requirements. As this PPT design is fully editable it can be presented in PDF, JPG and PNG formats.
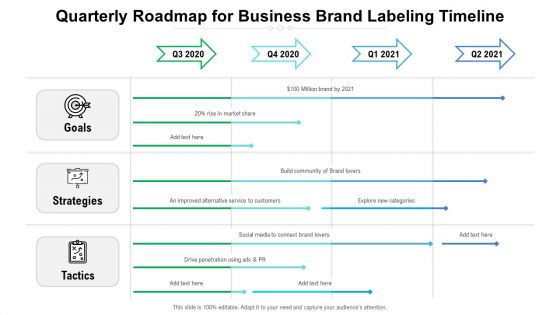
Quarterly Roadmap For Business Brand Labeling Timeline Infographics
Introducing our quarterly roadmap for business brand labeling timeline infographics. This PPT presentation is Google Slides compatible, therefore, you can share it easily with the collaborators for measuring the progress. Also, the presentation is available in both standard screen and widescreen aspect ratios. So edit the template design by modifying the font size, font type, color, and shapes as per your requirements. As this PPT design is fully editable it can be presented in PDF, JPG and PNG formats.
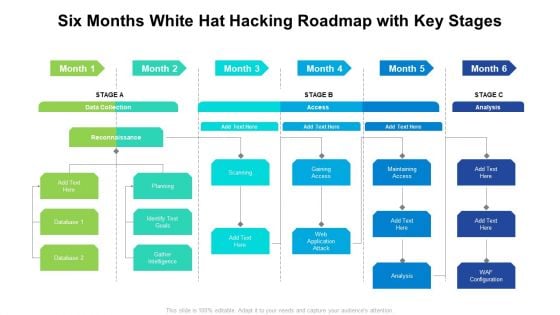
Six Months White Hat Hacking Roadmap With Key Stages Infographics
Introducing our six months white hat hacking roadmap with key stages infographics. This PPT presentation is Google Slides compatible, therefore, you can share it easily with the collaborators for measuring the progress. Also, the presentation is available in both standard screen and widescreen aspect ratios. So edit the template design by modifying the font size, font type, color, and shapes as per your requirements. As this PPT design is fully editable it can be presented in PDF, JPG and PNG formats.
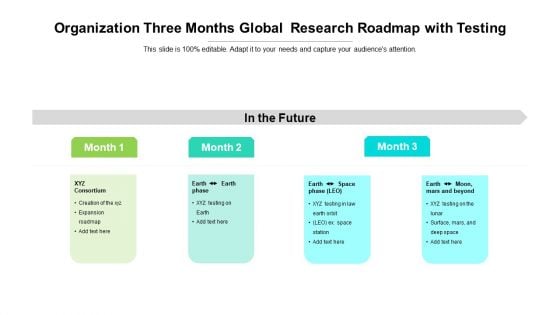
Organization Three Months Global Research Roadmap With Testing Infographics
Introducing our organization three months global research roadmap with testing infographics. This PPT presentation is Google Slides compatible, therefore, you can share it easily with the collaborators for measuring the progress. Also, the presentation is available in both standard screen and widescreen aspect ratios. So edit the template design by modifying the font size, font type, color, and shapes as per your requirements. As this PPT design is fully editable it can be presented in PDF, JPG and PNG formats.
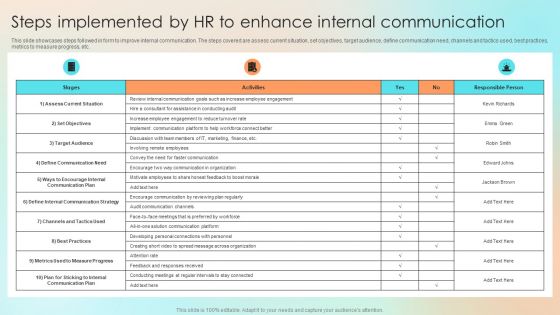
Steps Implemented By HR To Enhance Internal Communication Infographics PDF
This slide showcases steps followed in form to improve internal communication. The steps covered are assess current situation, set objectives, target audience, define communication need, channels and tactics used, best practices, metrics to measure progress, etc. Are you searching for a Steps Implemented By HR To Enhance Internal Communication Infographics PDF that is uncluttered, straightforward, and original Its easy to edit, and you can change the colors to suit your personal or business branding. For a presentation that expresses how much effort you have put in, this template is ideal With all of its features, including tables, diagrams, statistics, and lists, its perfect for a business plan presentation. Make your ideas more appealing with these professional slides. Download Steps Implemented By HR To Enhance Internal Communication Infographics PDF from Slidegeeks today.
Icons Slide Digital Approaches To Increase Business Growth Infographics Pdf
Introducing our well designed Icons Slide Digital Approaches To Increase Business Growth Infographics Pdf set of slides. The slide displays editable icons to enhance your visual presentation. The icons can be edited easily. So customize according to your business to achieve a creative edge. Download and share it with your audience. Our Icons Slide Digital Approaches To Increase Business Growth Infographics Pdf are topically designed to provide an attractive backdrop to any subject. Use them to look like a presentation pro.
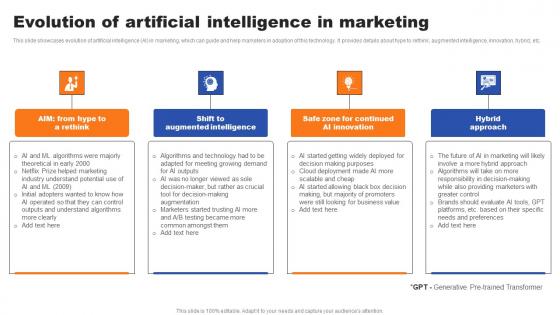
Evolution Of Artificial Intelligence In Marketing Ppt Infographics Influencers Pdf
This slide showcases evolution of artificial intelligence AI in marketing, which can guide and help marketers in adoption of this technology. It provides details about hype to rethink, augmented intelligence, innovation, hybrid, etc. Do you have to make sure that everyone on your team knows about any specific topic I yes, then you should give Evolution Of Artificial Intelligence In Marketing Ppt Infographics Influencers Pdf a try. Our experts have put a lot of knowledge and effort into creating this impeccable Evolution Of Artificial Intelligence In Marketing Ppt Infographics Influencers Pdf. You can use this template for your upcoming presentations, as the slides are perfect to represent even the tiniest detail. You can download these templates from the Slidegeeks website and these are easy to edit. So grab these today This slide showcases evolution of artificial intelligence AI in marketing, which can guide and help marketers in adoption of this technology. It provides details about hype to rethink, augmented intelligence, innovation, hybrid, etc.
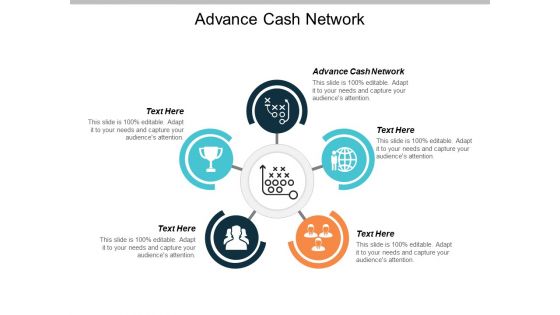
Advance Cash Network Ppt PowerPoint Presentation Infographics Information Cpb
This is a advance cash network ppt powerpoint presentation infographics information cpb. This is a five stage process. The stages in this process are advance cash network.
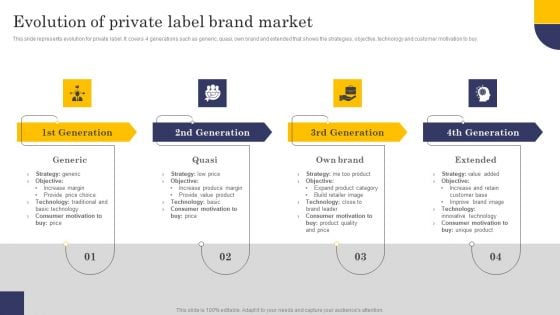
Evolution Of Private Label Brand Market Infographics PDF
This slide represents evolution for private label. It covers 4 generations such as generic, quasi, own brand and extended that shows the strategies, objective, technology and customer motivation to buy. Create an editable Evolution Of Private Label Brand Market Infographics PDF that communicates your idea and engages your audience. Whether you are presenting a business or an educational presentation, pre designed presentation templates help save time. Evolution Of Private Label Brand Market Infographics PDF is highly customizable and very easy to edit, covering many different styles from creative to business presentations. Slidegeeks has creative team members who have crafted amazing templates. So, go and get them without any delay.
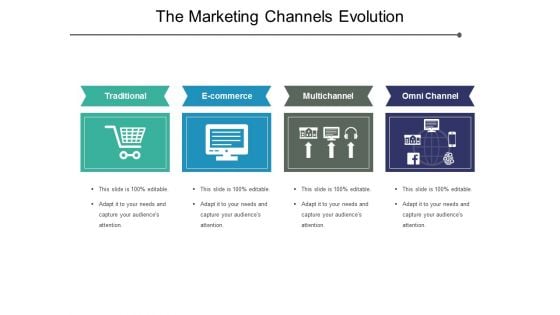
The Marketing Channels Evolution Ppt PowerPoint Presentation Infographics Inspiration
This is a the marketing channels evolution ppt powerpoint presentation infographics inspiration. This is a four stage process. The stages in this process are ecommerce, omni channel, multi channel, cross channel.
Supplier Evolution Icons Slide Marketing Ppt PowerPoint Presentation Infographics Guidelines
This is a supplier evolution icons slide marketing ppt powerpoint presentation infographics guidelines. This is a one stage process. The stages in this process are business, management, marketing, icons.
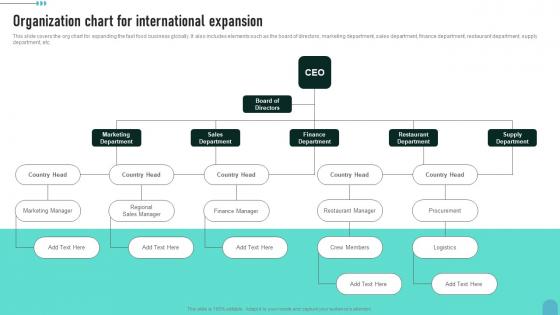
Organization Chart For International Expansion Enhancing Global Presence Infographics Pdf
This slide covers the org chart for expanding the fast food business globally. It also includes elements such as the board of directors, marketing department, sales department, finance department, restaurant department, supply department, etc.Slidegeeks has constructed Organization Chart For International Expansion Enhancing Global Presence Infographics Pdf after conducting extensive research and examination. These presentation templates are constantly being generated and modified based on user preferences and critiques from editors. Here, you will find the most attractive templates for a range of purposes while taking into account ratings and remarks from users regarding the content. This is an excellent jumping-off point to explore our content and will give new users an insight into our top-notch PowerPoint Templates. This slide covers the org chart for expanding the fast food business globally. It also includes elements such as the board of directors, marketing department, sales department, finance department, restaurant department, supply department, etc.

Infographics Marketing Ppt PowerPoint Presentation Outline Summary Cpb
This is a infographics marketing ppt powerpoint presentation outline summary cpb. This is a three stage process. The stages in this process are infographics marketing.
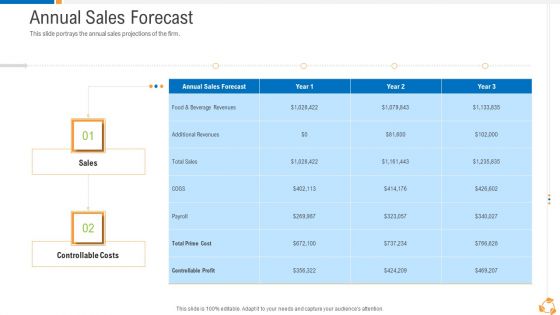
Business Advancement Internal Growth Annual Sales Forecast Infographics PDF
This slide portrays the annual sales projections of the firm. Deliver an awe-inspiring pitch with this creative business advancement internal growth annual sales forecast infographics pdf bundle. Topics like sales, controllable costs can be discussed with this completely editable template. It is available for immediate download depending on the needs and requirements of the user.
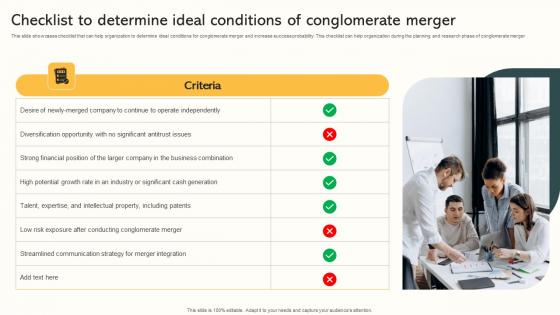
Checklist To Determine Ideal Conditions Market Expansion Through Infographics Pdf
This slide showcases checklist that can help organization to determine ideal conditions for conglomerate merger and increase success probability. This checklist can help organization during the planning and research phase of conglomerate merger. Are you searching for a Checklist To Determine Ideal Conditions Market Expansion Through Infographics Pdf that is uncluttered, straightforward, and original It is easy to edit, and you can change the colors to suit your personal or business branding. For a presentation that expresses how much effort you have put in, this template is ideal With all of its features, including tables, diagrams, statistics, and lists, it is perfect for a business plan presentation. Make your ideas more appealing with these professional slides. Download Checklist To Determine Ideal Conditions Market Expansion Through Infographics Pdf from Slidegeeks today. This slide showcases checklist that can help organization to determine ideal conditions for conglomerate merger and increase success probability. This checklist can help organization during the planning and research phase of conglomerate merger.
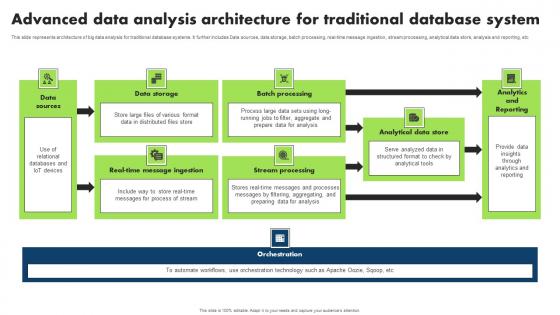
Advanced Data Analysis Architecture For Traditional Database System Infographics Pdf
This slide represents architecture of big data analysis for traditional database systems. It further includes Data sources, data storage, batch processing, real time message ingestion, stream processing, analytical data store, analysis and reporting, etc Showcasing this set of slides titled Advanced Data Analysis Architecture For Traditional Database System Infographics Pdf. The topics addressed in these templates are Data Storage, Batch Processing, Stream Processing. All the content presented in this PPT design is completely editable. Download it and make adjustments in color, background, font etc. as per your unique business setting. This slide represents architecture of big data analysis for traditional database systems. It further includes Data sources, data storage, batch processing, real time message ingestion, stream processing, analytical data store, analysis and reporting, etc

Seven Steps With Upward Arrows Ppt Powerpoint Presentation Infographics Ideas
This is a seven steps with upward arrows ppt powerpoint presentation infographics ideas. This is a seven stage process. The stages in this process are markets converging, market convergence.
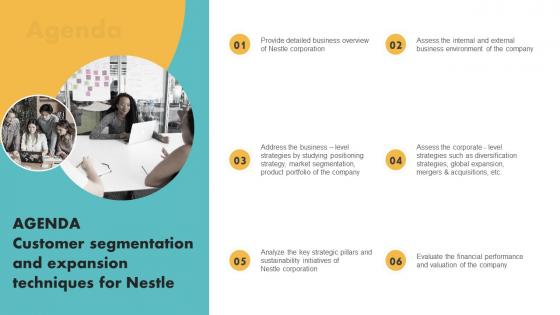
Agenda Customer Segmentation And Expansion Techniques For Nestle Infographics Pdf
Whether you have daily or monthly meetings, a brilliant presentation is necessary. Agenda Customer Segmentation And Expansion Techniques For Nestle Infographics Pdf can be your best option for delivering a presentation. Represent everything in detail using Agenda Customer Segmentation And Expansion Techniques For Nestle Infographics Pdf and make yourself stand out in meetings. The template is versatile and follows a structure that will cater to your requirements. All the templates prepared by Slidegeeks are easy to download and edit. Our research experts have taken care of the corporate themes as well. So, give it a try and see the results. Our Agenda Customer Segmentation And Expansion Techniques For Nestle Infographics Pdf are topically designed to provide an attractive backdrop to any subject. Use them to look like a presentation pro.
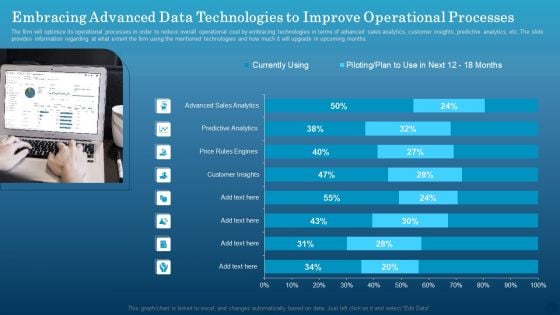
Embracing Advanced Data Technologies To Improve Operational Processes Infographics PDF
The firm will optimize its operational processes in order to reduce overall operational cost by embracing technologies in terms of advanced sales analytics, customer insights, predictive analytics, etc. The slide provides information regarding at what extent the firm using the mentioned technologies and how much it will upgrade in upcoming months. Formulating a presentation can take up a lot of effort and time, so the content and message should always be the primary focus. The visuals of the PowerPoint can enhance the presenters message, so our Embracing Advanced Data Technologies To Improve Operational Processes Infographics PDF was created to help save time. Instead of worrying about the design, the presenter can concentrate on the message while our designers work on creating the ideal templates for whatever situation is needed. Slidegeeks has experts for everything from amazing designs to valuable content, we have put everything into Embracing Advanced Data Technologies To Improve Operational Processes Infographics PDF.
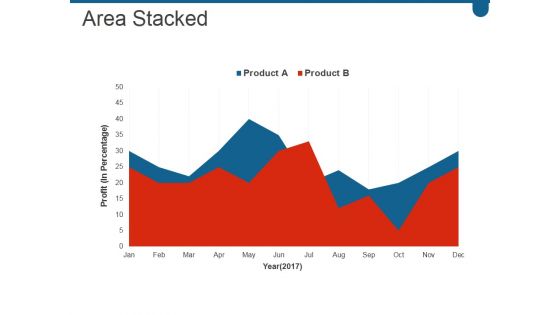
Area Stacked Ppt PowerPoint Presentation Infographics Designs Download
This is a area stacked ppt powerpoint presentation infographics designs download. This is a two stage process. The stages in this process are years, growth, success, business, marketing.
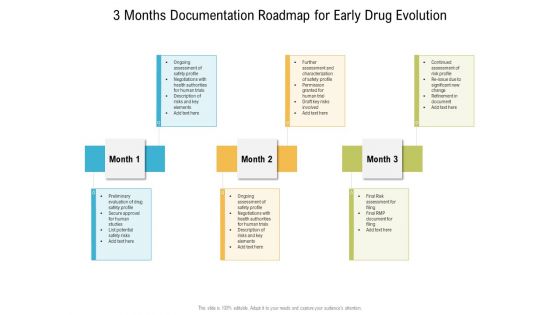
3 Months Documentation Roadmap For Early Drug Evolution Infographics
We present our 3 months documentation roadmap for early drug evolution infographics. This PowerPoint layout is easy-to-edit so you can change the font size, font type, color, and shape conveniently. In addition to this, the PowerPoint layout is Google Slides compatible, so you can share it with your audience and give them access to edit it. Therefore, download and save this well-researched 3 months documentation roadmap for early drug evolution infographics in different formats like PDF, PNG, and JPG to smoothly execute your business plan.

Key Performance Indicators KPI Ppt PowerPoint Presentation Infographics Cpb
This is a key performance indicators kpi ppt powerpoint presentation infographics cpb. This is a five stage process. The stages in this process are key performance indicators kpi.
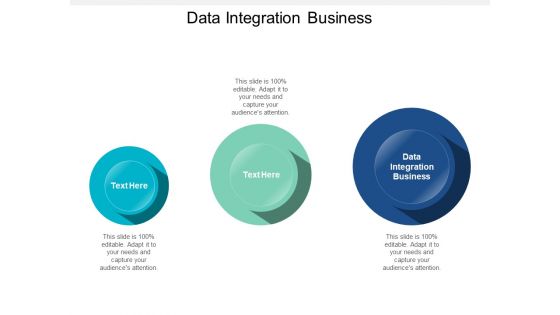
Data Integration Business Ppt PowerPoint Presentation Infographics Visuals Cpb
This is a data integration business ppt powerpoint presentation infographics visuals cpb. This is a three stage process. The stages in this process are data integration business.
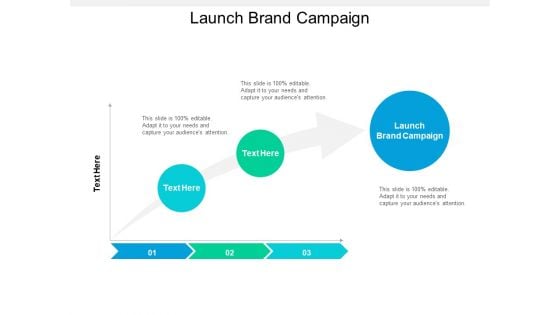
Launch Brand Campaign Ppt PowerPoint Presentation Infographics Objects Cpb
This is a launch brand campaign ppt powerpoint presentation infographics objects cpb. This is a three stage process. The stages in this process are launch brand campaign.
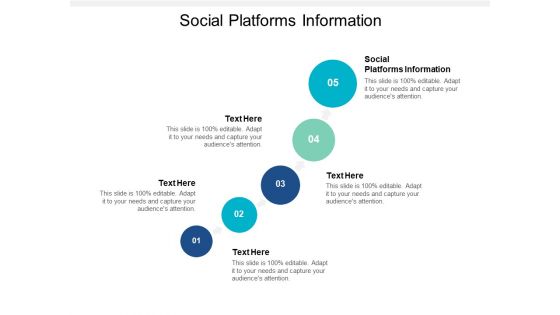
Social Platforms Information Ppt PowerPoint Presentation Infographics Outline Cpb
This is a social platforms information ppt powerpoint presentation infographics outline cpb. This is a five stage process. The stages in this process are social platforms information.
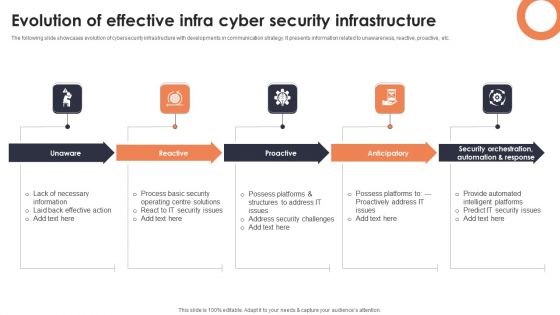
Evolution Of Effective Infra Cyber Security Infrastructure Infographics PDF
The following slide showcases evolution of cybersecurity infrastructure with developments in communication strategy. It presents information related to unawareness, reactive, proactive, etc. Presenting Evolution Of Effective Infra Cyber Security Infrastructure Infographics PDF to dispense important information. This template comprises four stages. It also presents valuable insights into the topics including Unaware, Reactive, Proactive. This is a completely customizable PowerPoint theme that can be put to use immediately. So, download it and address the topic impactfully.
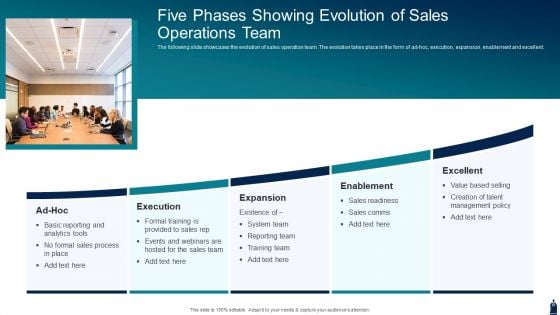
Five Phases Showing Evolution Of Sales Operations Team Infographics PDF
The following slide showcases the evolution of sales operation team. The evolution takes place in the form of ad hoc, execution, expansion, enablement and excellent. Presenting five phases showing evolution of sales operations team infographics pdf to dispense important information. This template comprises five stages. It also presents valuable insights into the topics including execution, expansion, enablement. This is a completely customizable PowerPoint theme that can be put to use immediately. So, download it and address the topic impactfully.
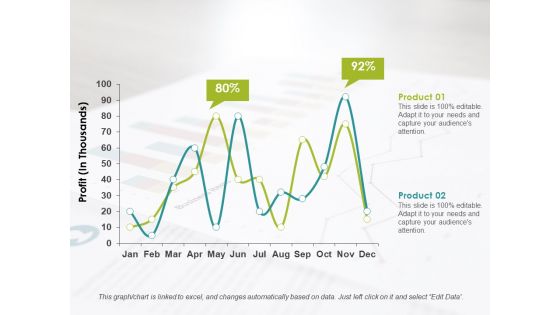
Line Chart Ppt PowerPoint Presentation Infographics Format Ideas
This is a line chart ppt powerpoint presentation infographics format ideas. This is a two stage process. The stages in this process are product, profit, business.
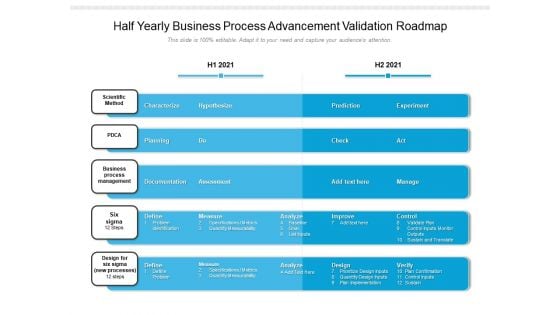
Half Yearly Business Process Advancement Validation Roadmap Infographics
We present our half yearly business process advancement validation roadmap infographics. This PowerPoint layout is easy-to-edit so you can change the font size, font type, color, and shape conveniently. In addition to this, the PowerPoint layout is Google Slides compatible, so you can share it with your audience and give them access to edit it. Therefore, download and save this well-researched half yearly business process advancement validation roadmap infographics in different formats like PDF, PNG, and JPG to smoothly execute your business plan.
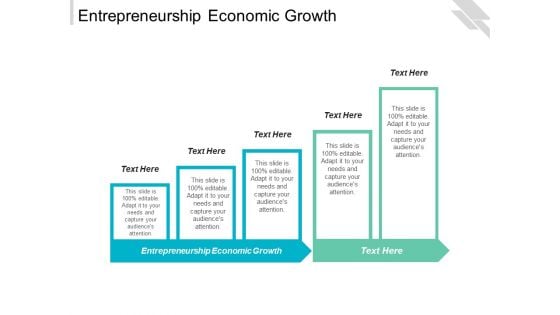
Entrepreneurship Economic Growth Ppt PowerPoint Presentation Infographics Shapes Cpb
This is a entrepreneurship economic growth ppt powerpoint presentation infographics shapes cpb. This is a five stage process. The stages in this process are entrepreneurship economic growth.
Global Communication Strategy Icon To Improve Business Revenue Infographics PDF
Presenting Global Communication Strategy Icon To Improve Business Revenue Infographics PDF to dispense important information. This template comprises three stages. It also presents valuable insights into the topics including Global Communication Strategy Icon, Improve Business Revenue. This is a completely customizable PowerPoint theme that can be put to use immediately. So, download it and address the topic impactfully.
Red Upward Arrow On Bar Graph Ppt Powerpoint Presentation Infographics
This is a red upward arrow on bar graph ppt powerpoint presentation infographics. This is a four stage process. The stages in this process are increasing arrows, improving arrows, growing arrows.
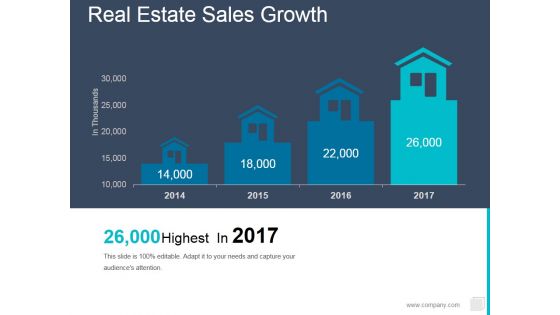
Real Estate Sales Growth Ppt PowerPoint Presentation Infographics Skills
This is a real estate sales growth ppt powerpoint presentation infographics skills. This is a two stage process. The stages in this process are growth, year, marketing, business.
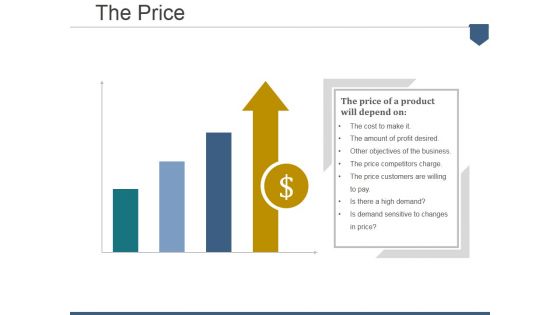
The Price Ppt PowerPoint Presentation Infographics Layout Ideas
This is a the price ppt powerpoint presentation infographics layout ideas. This is a four stage process. The stages in this process are growth, strategy, management, marketing, business.
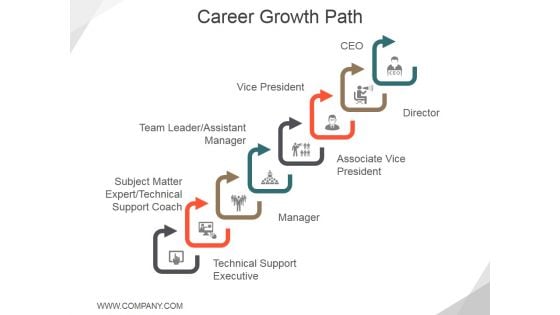
Career Growth Path Ppt PowerPoint Presentation Infographics Deck
This is a career growth path ppt powerpoint presentation infographics deck. This is a eight stage process. The stages in this process are ceo, vice president, director.
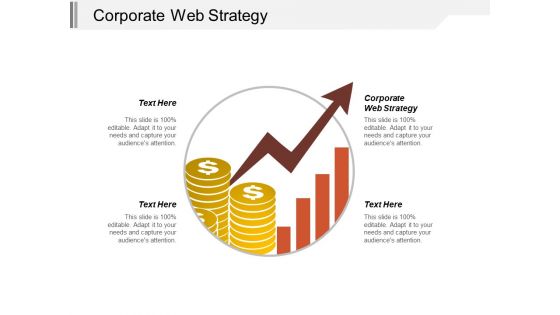
Corporate Web Strategy Ppt Powerpoint Presentation Infographics Layout Ideas Cpb
This is a corporate web strategy ppt powerpoint presentation infographics layout ideas cpb. This is a four stage process. The stages in this process are corporate web strategy.

Business Leads Ppt Powerpoint Presentation Infographics Styles Cpb
This is a business leads ppt powerpoint presentation infographics styles cpb. This is a three stage process. The stages in this process are business leads.

Company Credit Scores Ppt PowerPoint Presentation Infographics Files Cpb
This is a company credit scores ppt powerpoint presentation infographics files cpb. This is a three stage process. The stages in this process are company credit scores.

Employee Engagement Committee Ppt PowerPoint Presentation Layouts Infographics Cpb
This is a employee engagement committee ppt powerpoint presentation layouts infographics cpb. This is a five stage process. The stages in this process are employee engagement committee.
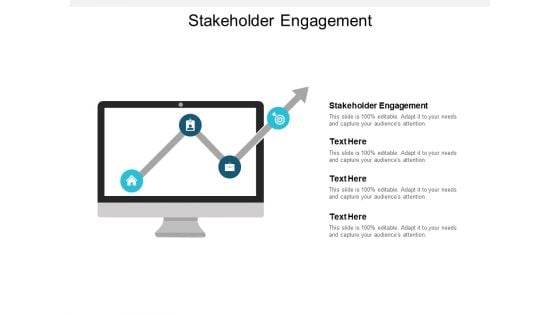
Stakeholder Engagement Ppt PowerPoint Presentation Infographics Maker Cpb
This is a stakeholder engagement ppt powerpoint presentation infographics maker cpb. This is a four stage process. The stages in this process are stakeholder engagement.
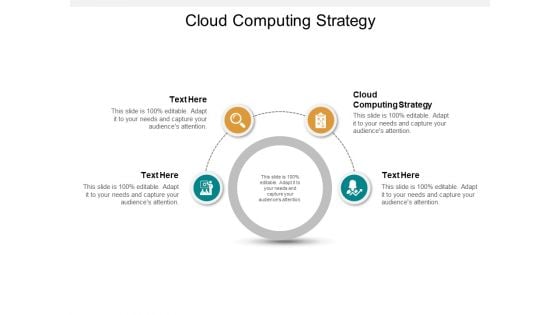
Cloud Computing Strategy Ppt PowerPoint Presentation Infographics Show Cpb
This is a cloud computing strategy ppt powerpoint presentation infographics show cpb. This is a four stage process. The stages in this process are cloud computing strategy.
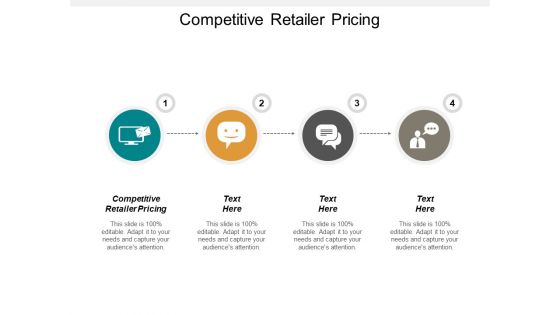
Competitive Retailer Pricing Ppt PowerPoint Presentation Infographics Layouts Cpb
This is a competitive retailer pricing ppt powerpoint presentation infographics layouts cpb. This is a four stage process. The stages in this process are competitive retailer pricing.
Enterprise Data Management Ppt PowerPoint Presentation Infographics Design Templates Cpb
This is a enterprise data management ppt powerpoint presentation infographics design templates cpb. This is a four stage process. The stages in this process are enterprise data management.

Enterprise It Architecture Ppt PowerPoint Presentation Infographics Slide Cpb
This is a enterprise it architecture ppt powerpoint presentation infographics slide cpb. This is a three stage process. The stages in this process are enterprise it architecture.
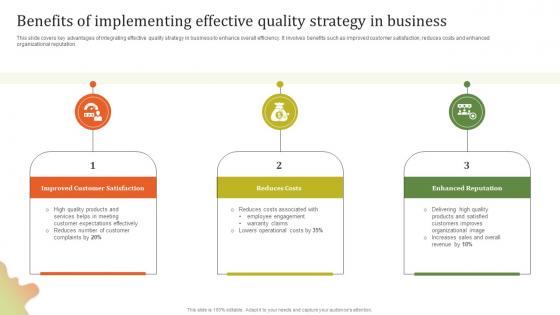
Benefits Of Implementing Executing Effective Quality Enhancement Infographics Pdf
This slide covers key advantages of integrating effective quality strategy in business to enhance overall efficiency. It involves benefits such as improved customer satisfaction, reduces costs and enhanced organizational reputation. Create an editable Benefits Of Implementing Executing Effective Quality Enhancement Infographics Pdf that communicates your idea and engages your audience. Whether you are presenting a business or an educational presentation, pre designed presentation templates help save time. Benefits Of Implementing Executing Effective Quality Enhancement Infographics Pdf is highly customizable and very easy to edit, covering many different styles from creative to business presentations. Slidegeeks has creative team members who have crafted amazing templates. So, go and get them without any delay. This slide covers key advantages of integrating effective quality strategy in business to enhance overall efficiency. It involves benefits such as improved customer satisfaction, reduces costs and enhanced organizational reputation.
Growth Innovation Ppt PowerPoint Presentation Infographics Format Ideas
This is a growth innovation ppt powerpoint presentation infographics format ideas. This is a five stage process. The stages in this process are growth innovation.
Revenue Growth Ppt PowerPoint Presentation Infographics Slide Cpb
This is a revenue growth ppt powerpoint presentation infographics slide cpb. This is a five stage process. The stages in this process are revenue growth.
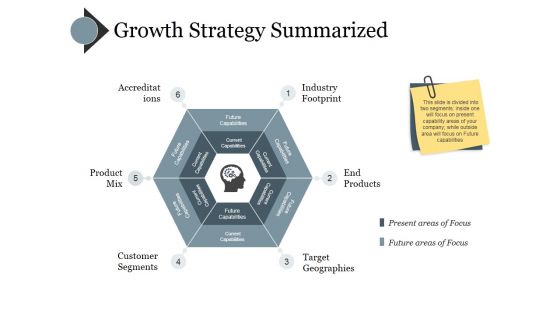
Growth Strategy Summarized Ppt PowerPoint Presentation Infographics Example Introduction
This is a growth strategy summarized ppt powerpoint presentation infographics example introduction. This is a six stage process. The stages in this process are future capabilities, current capabilities.


 Continue with Email

 Home
Home


