Project Kpi
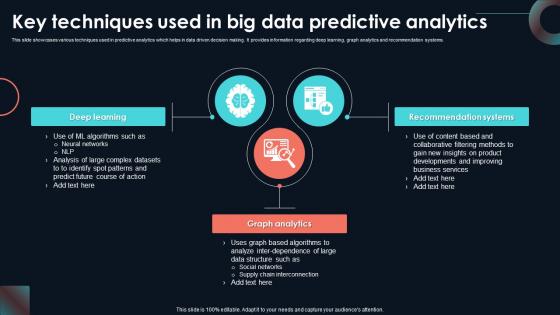
Key Techniques Used In Big Data Predictive Developing Strategic Insights Using Big Data Analytics SS V
This slide showcases various techniques used in predictive analytics which helps in data driven decision making. It provides information regarding deep learning, graph analytics and recommendation systems. Are you in need of a template that can accommodate all of your creative concepts This one is crafted professionally and can be altered to fit any style. Use it with Google Slides or PowerPoint. Include striking photographs, symbols, depictions, and other visuals. Fill, move around, or remove text boxes as desired. Test out color palettes and font mixtures. Edit and save your work, or work with colleagues. Download Key Techniques Used In Big Data Predictive Developing Strategic Insights Using Big Data Analytics SS V and observe how to make your presentation outstanding. Give an impeccable presentation to your group and make your presentation unforgettable. This slide showcases various techniques used in predictive analytics which helps in data driven decision making. It provides information regarding deep learning, graph analytics and recommendation systems.

HR Analytics Metrics For Data Driven Decision Summary Pdf
This slide illustrates human resource key performance indicators that help organization to analyze actionable insights for taking effective and date driven decision. It includes KPIs such as recruitment, employee engagement, retention and diversity and inclusion.Pitch your topic with ease and precision using this HR Analytics Metrics For Data Driven Decision Summary Pdf This layout presents information on Estimate Accumulated, Involved Recruitment, Provide Actionable Insight It is also available for immediate download and adjustment. So, changes can be made in the color, design, graphics or any other component to create a unique layout. This slide illustrates human resource key performance indicators that help organization to analyze actionable insights for taking effective and date driven decision. It includes KPIs such as recruitment, employee engagement, retention and diversity and inclusion.
Icons Slide For Predictive Analytics For Empowering Data Driven Decision Making Designs Pdf
Download our innovative and attention grabbing Icons Slide For Predictive Analytics For Empowering Data Driven Decision Making Designs Pdf template. The set of slides exhibit completely customizable icons. These icons can be incorporated into any business presentation. So download it immediately to clearly communicate with your clientele. Our Icons Slide For Predictive Analytics For Empowering Data Driven Decision Making Designs Pdf are topically designed to provide an attractive backdrop to any subject. Use them to look like a presentation pro.

Integration Of Big Data Text And Predictive Analytics PPT Example SS
This slide outlines the integrated architecture of big data, text analytics, and predictive analytics, including elements deployment, modeling, statistics, etc. Welcome to our selection of the Integration Of Big Data Text And Predictive Analytics PPT Example SS. These are designed to help you showcase your creativity and bring your sphere to life. Planning and Innovation are essential for any business that is just starting out. This collection contains the designs that you need for your everyday presentations. All of our PowerPoints are 100Percent editable, so you can customize them to suit your needs. This multi-purpose template can be used in various situations. Grab these presentation templates today. This slide outlines the integrated architecture of big data, text analytics, and predictive analytics, including elements deployment, modeling, statistics, etc.
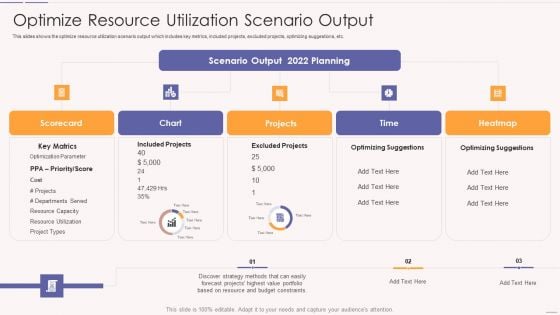
Asset Usage And Monitoring With Resource Management Plan Optimize Resource Utilization Clipart PDF
This slides shows the optimize resource utilization scenario output which includes key metrics, included projects, excluded projects, optimizing suggestions, etc.Deliver and pitch your topic in the best possible manner with this asset usage and monitoring with resource management plan optimize resource utilization clipart pdf Use them to share invaluable insights on included projects, excluded projects, optimizing suggestions and impress your audience. This template can be altered and modified as per your expectations. So, grab it now.
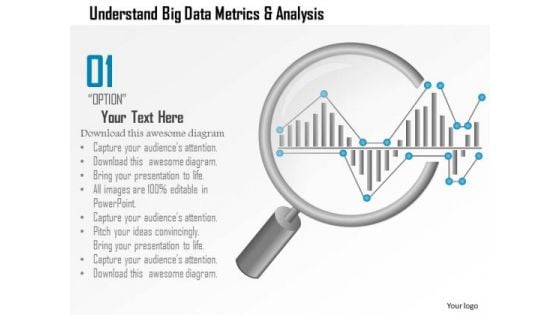
Business Diagram Understand Big Data Metrics And Analysis Showing By Magnifying Glass Ppt Slide
This PPT slide has been designed with big data metrics and magnifying glass. This diagram helps to portray concept of data analysis and data search. Download this diagram to make professional presentations.
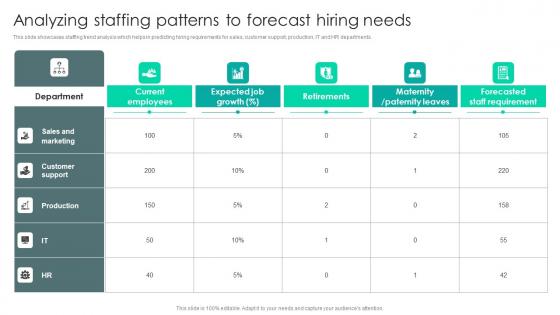
Strategic Staffing Using Data Analyzing Staffing Patterns To Forecast Hiring Needs CRP DK SS V
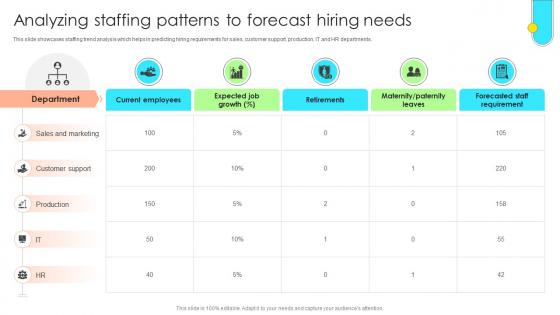
This slide showcases staffing trend analysis which helps in predicting hiring requirements for sales, customer support, production, IT and HR departments. From laying roadmaps to briefing everything in detail, our templates are perfect for you. You can set the stage with your presentation slides. All you have to do is download these easy-to-edit and customizable templates. Strategic Staffing Using Data Analyzing Staffing Patterns To Forecast Hiring Needs CRP DK SS V will help you deliver an outstanding performance that everyone would remember and praise you for. Do download this presentation today. This slide showcases staffing trend analysis which helps in predicting hiring requirements for sales, customer support, production, IT and HR departments.
Data Driven Approach To Optimise Analyzing Staffing Patterns To Forecast CRP SS V
This slide showcases staffing trend analysis which helps in predicting hiring requirements for sales, customer support, production, IT and HR departments. Get a simple yet stunning designed Data Driven Approach To Optimise Analyzing Staffing Patterns To Forecast CRP SS V. It is the best one to establish the tone in your meetings. It is an excellent way to make your presentations highly effective. So, download this PPT today from Slidegeeks and see the positive impacts. Our easy-to-edit Data Driven Approach To Optimise Analyzing Staffing Patterns To Forecast CRP SS V can be your go-to option for all upcoming conferences and meetings. So, what are you waiting for Grab this template today. This slide showcases staffing trend analysis which helps in predicting hiring requirements for sales, customer support, production, IT and HR departments.
Sales Forecasting Analysis Powerpoint Slide Ideas
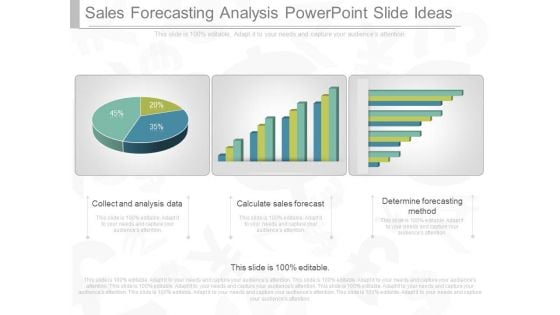
This is a sales forecasting analysis powerpoint slide ideas. This is a three stage process. The stages in this process are collect and analysis data, calculate sales forecast, determine forecasting method.
Budget For Statistical Data Analytics For Informed Decision Ppt Slide
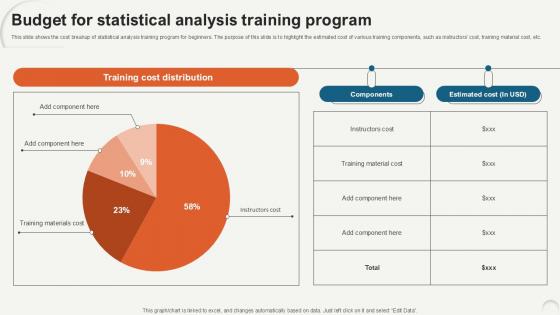
This slide shows the cost breakup of statistical analysis training program for beginners. The purpose of this slide is to highlight the estimated cost of various training components, such as instructors cost, training material cost, etc. Do you have to make sure that everyone on your team knows about any specific topic I yes, then you should give Budget For Statistical Data Analytics For Informed Decision Ppt Slide a try. Our experts have put a lot of knowledge and effort into creating this impeccable Budget For Statistical Data Analytics For Informed Decision Ppt Slide. You can use this template for your upcoming presentations, as the slides are perfect to represent even the tiniest detail. You can download these templates from the Slidegeeks website and these are easy to edit. So grab these today This slide shows the cost breakup of statistical analysis training program for beginners. The purpose of this slide is to highlight the estimated cost of various training components, such as instructors cost, training material cost, etc.
Predictive Analytics For Empowering Overview Of Predictive Analytics Framework Mockup Pdf
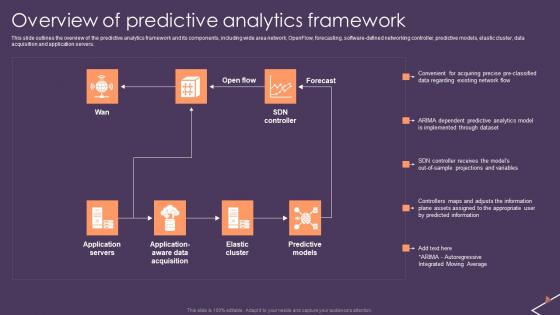
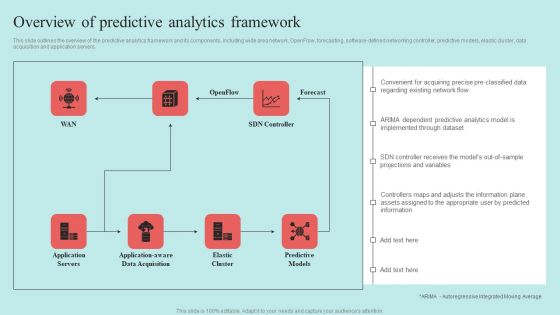
This slide outlines the overview of the predictive analytics framework and its components, including wide area network, OpenFlow, forecasting, software-defined networking controller, predictive models, elastic cluster, data acquisition and application servers. Find highly impressive Predictive Analytics For Empowering Overview Of Predictive Analytics Framework Mockup Pdf on Slidegeeks to deliver a meaningful presentation. You can save an ample amount of time using these presentation templates. No need to worry to prepare everything from scratch because Slidegeeks experts have already done a huge research and work for you. You need to download Predictive Analytics For Empowering Overview Of Predictive Analytics Framework Mockup Pdf for your upcoming presentation. All the presentation templates are 100 percent editable and you can change the color and personalize the content accordingly. Download now. This slide outlines the overview of the predictive analytics framework and its components, including wide area network, OpenFlow, forecasting, software-defined networking controller, predictive models, elastic cluster, data acquisition and application servers.
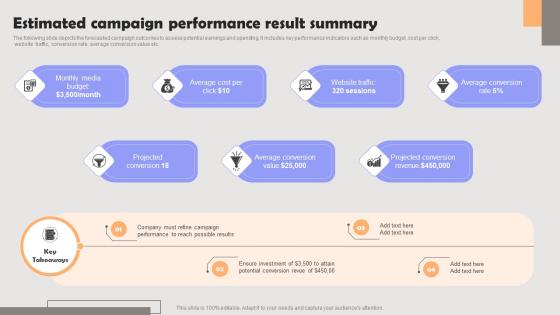
Improving PPC Campaign Results Estimated Campaign Performance Result Information Pdf
The following slide depicts the forecasted campaign outcomes to assess potential earnings and spending. It includes key performance indicators such as monthly budget, cost per click, website traffic, conversion rate, average conversion value etc. Crafting an eye-catching presentation has never been more straightforward. Let your presentation shine with this tasteful yet straightforward Improving PPC Campaign Results Estimated Campaign Performance Result Information Pdf template. It offers a minimalistic and classy look that is great for making a statement. The colors have been employed intelligently to add a bit of playfulness while still remaining professional. Construct the ideal Improving PPC Campaign Results Estimated Campaign Performance Result Information Pdf that effortlessly grabs the attention of your audience. Begin now and be certain to wow your customers. The following slide depicts the forecasted campaign outcomes to assess potential earnings and spending. It includes key performance indicators such as monthly budget, cost per click, website traffic, conversion rate, average conversion value etc.
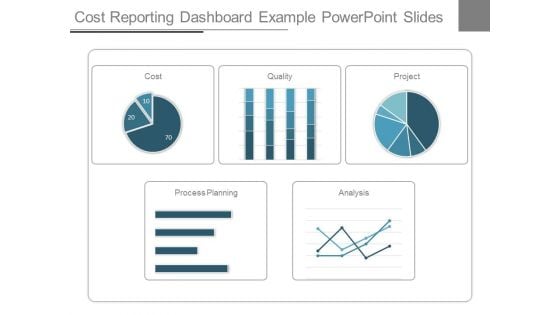
Cost Reporting Dashboard Example Powerpoint Slides
This is a cost reporting dashboard example powerpoint slides. This is a five stage process. The stages in this process are cost, quality, project, process planning, analysis.

Predictive Analytics For Empowering Introduction To Predictive Analytics Technology Sample Pdf
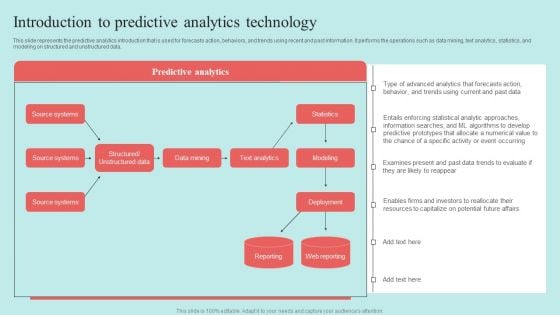
This slide represents the predictive analytics introduction that is used for forecasts action, behaviors, and trends using recent and past information. It performs the operations such as data mining, text analytics, statistics, and modeling on structured and unstructured data. Do you have to make sure that everyone on your team knows about any specific topic I yes, then you should give Predictive Analytics For Empowering Introduction To Predictive Analytics Technology Sample Pdf a try. Our experts have put a lot of knowledge and effort into creating this impeccable Predictive Analytics For Empowering Introduction To Predictive Analytics Technology Sample Pdf You can use this template for your upcoming presentations, as the slides are perfect to represent even the tiniest detail. You can download these templates from the Slidegeeks website and these are easy to edit. So grab these today. This slide represents the predictive analytics introduction that is used for forecasts action, behaviors, and trends using recent and past information. It performs the operations such as data mining, text analytics, statistics, and modeling on structured and unstructured data.
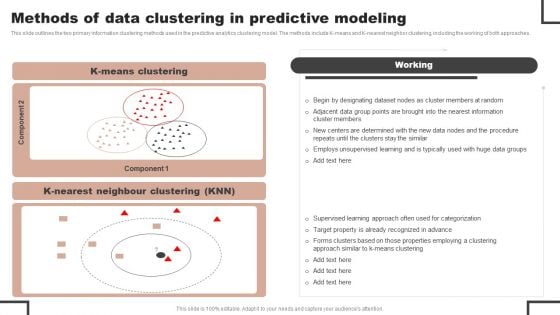
Forecast Analysis Technique IT Methods Of Data Clustering In Predictive Modeling Formats PDF
This slide outlines the two primary information clustering methods used in the predictive analytics clustering model. The methods include K means and K nearest neighbor clustering, including the working of both approaches. Create an editable Forecast Analysis Technique IT Methods Of Data Clustering In Predictive Modeling Formats PDF that communicates your idea and engages your audience. Whether you are presenting a business or an educational presentation, pre designed presentation templates help save time. Forecast Analysis Technique IT Methods Of Data Clustering In Predictive Modeling Formats PDF is highly customizable and very easy to edit, covering many different styles from creative to business presentations. Slidegeeks has creative team members who have crafted amazing templates. So, go and get them without any delay.
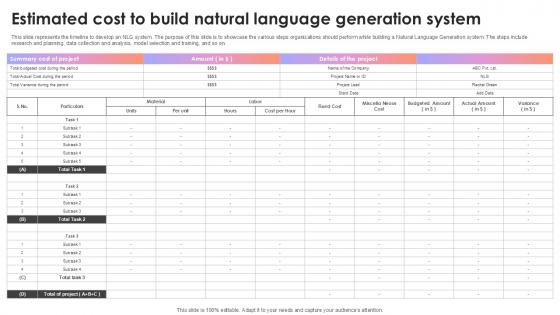
Estimated Cost To Build Natural Language Generation System AI Content Creation It Ppt Powerpoint
This slide represents the timeline to develop an NLG system. The purpose of this slide is to showcase the various steps organizations should perform while building a Natural Language Generation system. The steps include research and planning, data collection and analysis, model selection and training, and so on. Make sure to capture your audiences attention in your business displays with our gratis customizable Estimated Cost To Build Natural Language Generation System AI Content Creation It Ppt Powerpoint These are great for business strategies, office conferences, capital raising or task suggestions. If you desire to acquire more customers for your tech business and ensure they stay satisfied, create your own sales presentation with these plain slides. This slide represents the timeline to develop an NLG system. The purpose of this slide is to showcase the various steps organizations should perform while building a Natural Language Generation system. The steps include research and planning, data collection and analysis, model selection and training, and so on.
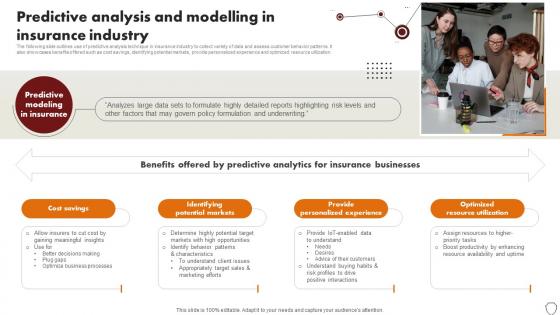
Technology Trends In Online Insurance Predictive Analysis And Modelling In Insurance Industry
The following slide outlines use of predictive analysis technique in insurance industry to collect variety of data and assess customer behavior patterns. It also showcases benefits offered such as cost savings, identifying potential markets, provide personalized experience and optimized resource utilization. Find highly impressive Technology Trends In Online Insurance Predictive Analysis And Modelling In Insurance Industry on Slidegeeks to deliver a meaningful presentation. You can save an ample amount of time using these presentation templates. No need to worry to prepare everything from scratch because Slidegeeks experts have already done a huge research and work for you. You need to download Technology Trends In Online Insurance Predictive Analysis And Modelling In Insurance Industry for your upcoming presentation. All the presentation templates are 100 percent editable and you can change the color and personalize the content accordingly. Download now The following slide outlines use of predictive analysis technique in insurance industry to collect variety of data and assess customer behavior patterns. It also showcases benefits offered such as cost savings, identifying potential markets, provide personalized experience and optimized resource utilization.

Import And Export Price Indices To Calculate Strategies For Inflation A Tactical Guide Fin SS V
This slide shows step by step process which can be used to calculate inflation rate by using import and export price indices. It includes stages such as select year, collect data, calculate export and import price index and interpret results. This Import And Export Price Indices To Calculate Strategies For Inflation A Tactical Guide Fin SS V is perfect for any presentation, be it in front of clients or colleagues. It is a versatile and stylish solution for organizing your meetings. The Import And Export Price Indices To Calculate Strategies For Inflation A Tactical Guide Fin SS V features a modern design for your presentation meetings. The adjustable and customizable slides provide unlimited possibilities for acing up your presentation. Slidegeeks has done all the homework before launching the product for you. So, do not wait, grab the presentation templates today This slide shows step by step process which can be used to calculate inflation rate by using import and export price indices. It includes stages such as select year, collect data, calculate export and import price index and interpret results.
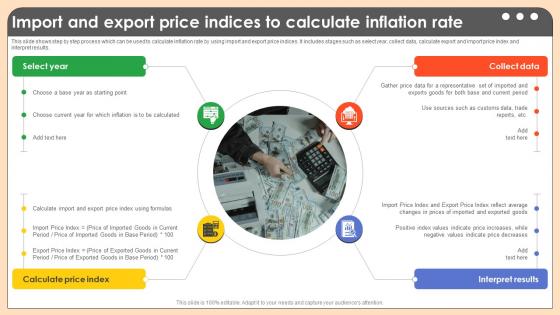
Import And Export Price Indices To Calculate Comprehensive Guide On Inflation Control CM SS V
This slide shows step by step process which can be used to calculate inflation rate by using import and export price indices. It includes stages such as select year, collect data, calculate export and import price index and interpret results. This Import And Export Price Indices To Calculate Comprehensive Guide On Inflation Control CM SS V is perfect for any presentation, be it in front of clients or colleagues. It is a versatile and stylish solution for organizing your meetings. The Import And Export Price Indices To Calculate Comprehensive Guide On Inflation Control CM SS V features a modern design for your presentation meetings. The adjustable and customizable slides provide unlimited possibilities for acing up your presentation. Slidegeeks has done all the homework before launching the product for you. So, do not wait, grab the presentation templates today This slide shows step by step process which can be used to calculate inflation rate by using import and export price indices. It includes stages such as select year, collect data, calculate export and import price index and interpret results.
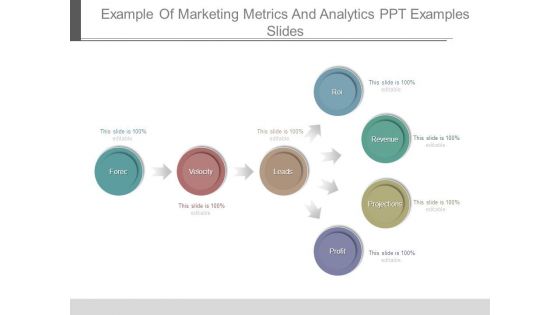
Example Of Marketing Metrics And Analytics Ppt Examples Slides
This is a example of marketing metrics and analytics ppt examples slides. This is a seven stage process. The stages in this process are forec, velocity, leads, roi, revenue, projections, profit.
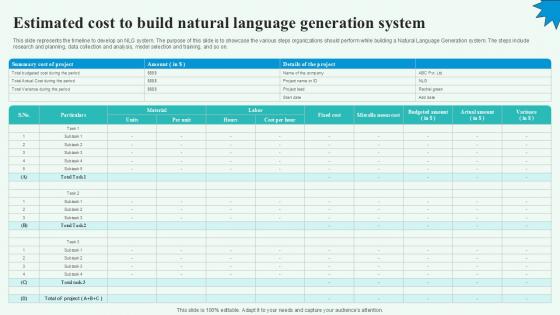
Estimated Cost To Build Natural Automated Content Generation PPT Example
This slide represents the timeline to develop an NLG system. The purpose of this slide is to showcase the various steps organizations should perform while building a Natural Language Generation system. The steps include research and planning, data collection and analysis, model selection and training, and so on. Crafting an eye-catching presentation has never been more straightforward. Let your presentation shine with this tasteful yet straightforward Estimated Cost To Build Natural Automated Content Generation PPT Example template. It offers a minimalistic and classy look that is great for making a statement. The colors have been employed intelligently to add a bit of playfulness while still remaining professional. Construct the ideal Estimated Cost To Build Natural Automated Content Generation PPT Example that effortlessly grabs the attention of your audience Begin now and be certain to wow your customers This slide represents the timeline to develop an NLG system. The purpose of this slide is to showcase the various steps organizations should perform while building a Natural Language Generation system. The steps include research and planning, data collection and analysis, model selection and training, and so on.
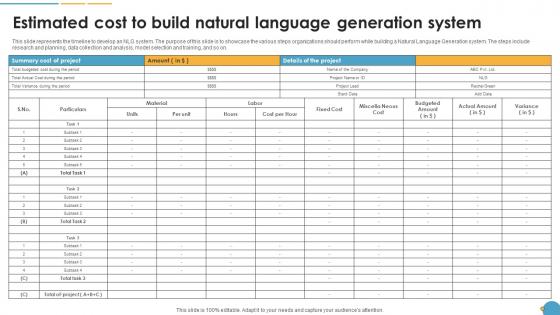
Estimated Cost To Build Natural Language Generation System Natural Language Automation
This slide represents the timeline to develop an NLG system. The purpose of this slide is to showcase the various steps organizations should perform while building a Natural Language Generation system. The steps include research and planning, data collection and analysis, model selection and training, and so on. Crafting an eye-catching presentation has never been more straightforward. Let your presentation shine with this tasteful yet straightforward Estimated Cost To Build Natural Language Generation System Natural Language Automation template. It offers a minimalistic and classy look that is great for making a statement. The colors have been employed intelligently to add a bit of playfulness while still remaining professional. Construct the ideal Estimated Cost To Build Natural Language Generation System Natural Language Automation that effortlessly grabs the attention of your audience Begin now and be certain to wow your customers This slide represents the timeline to develop an NLG system. The purpose of this slide is to showcase the various steps organizations should perform while building a Natural Language Generation system. The steps include research and planning, data collection and analysis, model selection and training, and so on.
External Analysis Labour Market Forecasts Ppt PowerPoint Presentation Icon Guidelines
This is a external analysis labour market forecasts ppt powerpoint presentation icon guidelines. This is a seven stage process. The stages in this process are labour market characteristic, tables, data, analysis, planning.
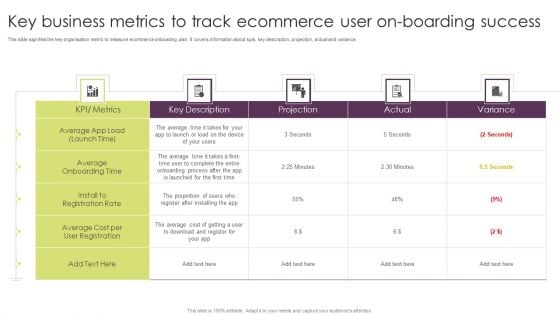
Key Business Metrics To Track Ecommerce User On Boarding Success Pictures PDF
This slide signifies the key organisation metric to measure ecommerce onboading plan. It covers information about kpis, key description, projection, actual and variance. Pitch your topic with ease and precision using this Key Business Metrics To Track Ecommerce User On Boarding Success Pictures PDF. This layout presents information on Key Description, Projection, Variance. It is also available for immediate download and adjustment. So, changes can be made in the color, design, graphics or any other component to create a unique layout.
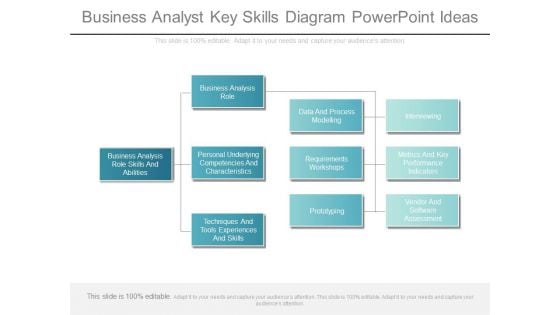
Business Analyst Key Skills Diagram Powerpoint Ideas
This is a business analyst key skills diagram powerpoint ideas. This is a four stage process. The stages in this process are business analysis role skills and abilities, business analysis role, personal underlying competencies and characteristics, techniques and tools experiences and skills, data and process modelling, requirements workshops, prototyping, interviewing, metrics and key performance indicators, vendor and software assessment.
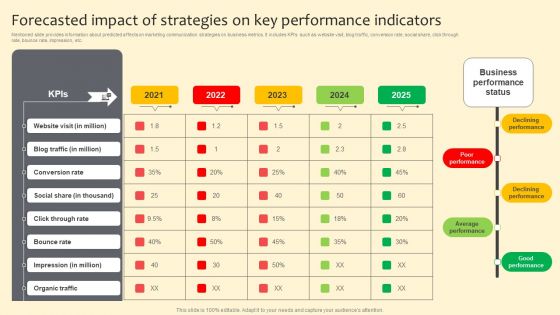
Forecasted Impact Of Strategies On Key Performance Indicators Slides PDF
Mentioned slide provides information about predicted affects on marketing communication strategies on business metrics. It includes KPIs such as website visit, blog traffic, conversion rate, social share, click through rate, bounce rate, impression, etc. Boost your pitch with our creative Forecasted Impact Of Strategies On Key Performance Indicators Slides PDF. Deliver an awe inspiring pitch that will mesmerize everyone. Using these presentation templates you will surely catch everyones attention. You can browse the ppts collection on our website. We have researchers who are experts at creating the right content for the templates. So you do not have to invest time in any additional work. Just grab the template now and use them.
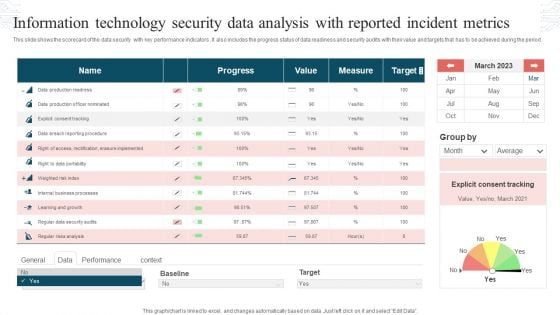
Information Technology Security Data Analysis With Reported Incident Metrics Rules PDF
This slide shows the scorecard of the data security with key performance indicators. It also includes the progress status of data readiness and security audits with their value and targets that has to be achieved during the period. Pitch your topic with ease and precision using this Information Technology Security Data Analysis With Reported Incident Metrics Rules PDF. This layout presents information on Progress, Value, Measure, Target. It is also available for immediate download and adjustment. So, changes can be made in the color, design, graphics or any other component to create a unique layout.
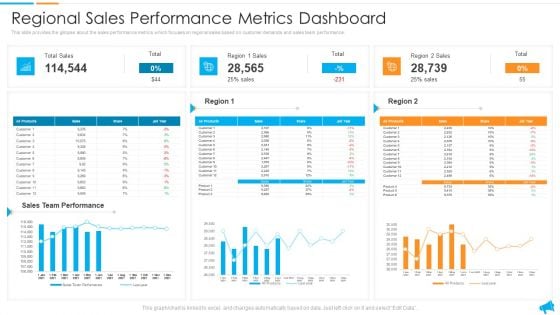
Strategy For Regional Economic Progress Outlining Regional Sales Performance Metrics Dashboard Designs PDF
This slide provides the glimpse about the sales performance metrics which focuses on regional sales based on customer demands and sales team performance. Deliver and pitch your topic in the best possible manner with this strategy for regional economic progress outlining regional sales performance metrics dashboard designs pdf. Use them to share invaluable insights on sales team performance, regional sales performance metrics dashboard and impress your audience. This template can be altered and modified as per your expectations. So, grab it now.
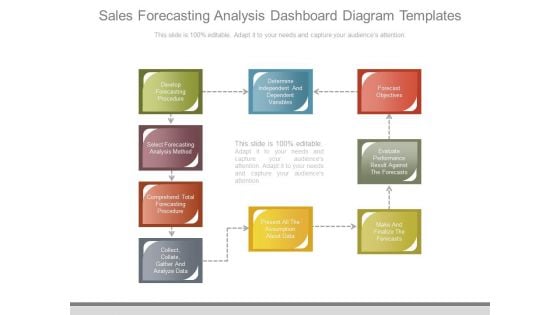
Sales Forecasting Analysis Dashboard Diagram Templates
This is a sales forecasting analysis dashboard diagram templates. This is a nine stage process. The stages in this process are develop forecasting procedure, select forecasting analysis method, comprehend total forecasting procedure, collect collate gather and analyze data, determine independent and dependent variables, present all the assumption about data, forecast objectives, evaluate performance result against the forecasts, make and finalize the forecasts.
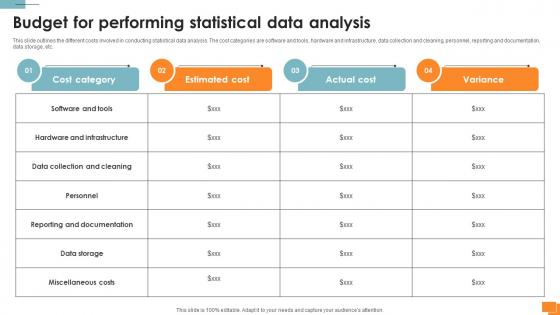
Statistical Tools For Evidence Budget For Performing Statistical Data Analysis
This slide outlines the different costs involved in conducting statistical data analysis. The cost categories are software and tools, hardware and infrastructure, data collection and cleaning, personnel, reporting and documentation, data storage, etc. Slidegeeks is here to make your presentations a breeze with Statistical Tools For Evidence Budget For Performing Statistical Data Analysis With our easy-to-use and customizable templates, you can focus on delivering your ideas rather than worrying about formatting. With a variety of designs to choose from, you are sure to find one that suits your needs. And with animations and unique photos, illustrations, and fonts, you can make your presentation pop. So whether you are giving a sales pitch or presenting to the board, make sure to check out Slidegeeks first This slide outlines the different costs involved in conducting statistical data analysis. The cost categories are software and tools, hardware and infrastructure, data collection and cleaning, personnel, reporting and documentation, data storage, etc.
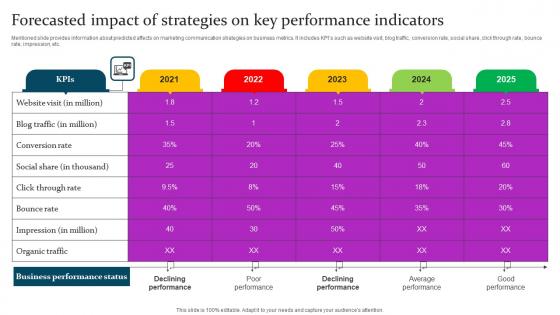
Forecasted Impact Of Strategies Marketing Mix Communication Guide Client Guidelines Pdf
Mentioned slide provides information about predicted affects on marketing communication strategies on business metrics. It includes KPIs such as website visit, blog traffic, conversion rate, social share, click through rate, bounce rate, impression, etc. Present like a pro with Forecasted Impact Of Strategies Marketing Mix Communication Guide Client Guidelines Pdf Create beautiful presentations together with your team, using our easy to use presentation slides. Share your ideas in real time and make changes on the fly by downloading our templates. So whether you are in the office, on the go, or in a remote location, you can stay in sync with your team and present your ideas with confidence. With Slidegeeks presentation got a whole lot easier. Grab these presentations today. Mentioned slide provides information about predicted affects on marketing communication strategies on business metrics. It includes KPIs such as website visit, blog traffic, conversion rate, social share, click through rate, bounce rate, impression, etc.
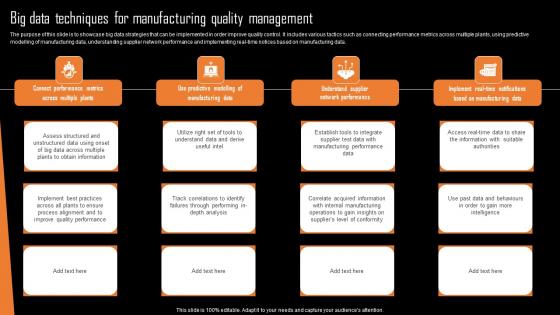
Big Data Techniques For Manufacturing Quality Management Introduction Pdf
The purpose of this slide is to showcase big data strategies that can be implemented in order improve quality control. It includes various tactics such as connecting performance metrics across multiple plants, using predictive modelling of manufacturing data, understanding supplier network performance and implementing real-time notices based on manufacturing data.Showcasing this set of slides titled Big Data Techniques For Manufacturing Quality Management Introduction Pdf The topics addressed in these templates are Connect Performance Metrics, Manufacturing Data, Network Performance All the content presented in this PPT design is completely editable. Download it and make adjustments in color, background, font etc. as per your unique business setting. The purpose of this slide is to showcase big data strategies that can be implemented in order improve quality control. It includes various tactics such as connecting performance metrics across multiple plants, using predictive modelling of manufacturing data, understanding supplier network performance and implementing real time notices based on manufacturing data.
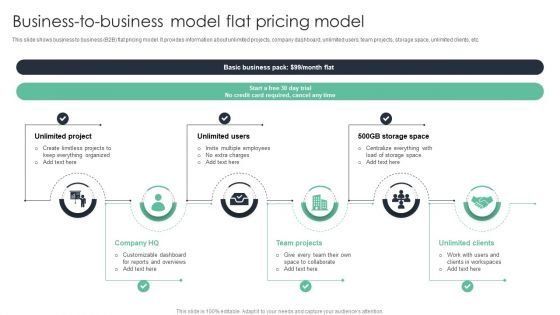
Business To Business Model Flat Pricing Model Ppt File Grid PDF
This slide shows business to business B2B flat pricing model. It provides information about unlimited projects, company dashboard, unlimited users, team projects, storage space, unlimited clients, etc. Persuade your audience using this Business To Business Model Flat Pricing Model Ppt File Grid PDF. This PPT design covers six stages, thus making it a great tool to use. It also caters to a variety of topics including Unlimited Project, Unlimited Users, Team Projects. Download this PPT design now to present a convincing pitch that not only emphasizes the topic but also showcases your presentation skills.
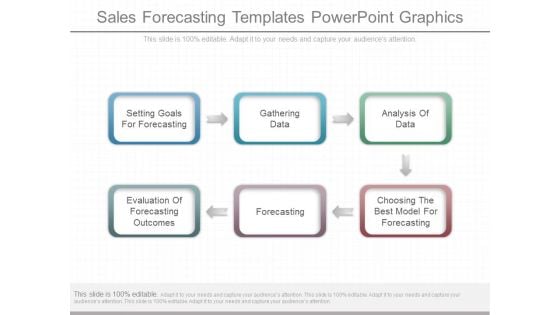
Sales Forecasting Templates Powerpoint Graphics
This is a sales forecasting templates powerpoint graphics. This is a six stage process. The stages in this process are setting goals for forecasting, gathering data, analysis of data, evaluation of forecasting outcomes, forecasting, choosing the best model for forecasting.
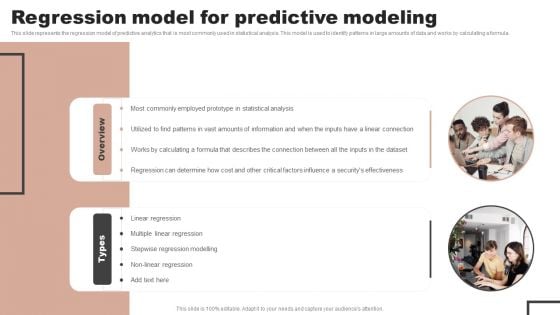
Forecast Analysis Technique IT Regression Model For Predictive Modeling Mockup PDF
This slide represents the regression model of predictive analytics that is most commonly used in statistical analysis. This model is used to identify patterns in large amounts of data and works by calculating a formula. Crafting an eye catching presentation has never been more straightforward. Let your presentation shine with this tasteful yet straightforward Forecast Analysis Technique IT Regression Model For Predictive Modeling Mockup PDF template. It offers a minimalistic and classy look that is great for making a statement. The colors have been employed intelligently to add a bit of playfulness while still remaining professional. Construct the ideal Forecast Analysis Technique IT Regression Model For Predictive Modeling Mockup PDF that effortlessly grabs the attention of your audience Begin now and be certain to wow your customers.
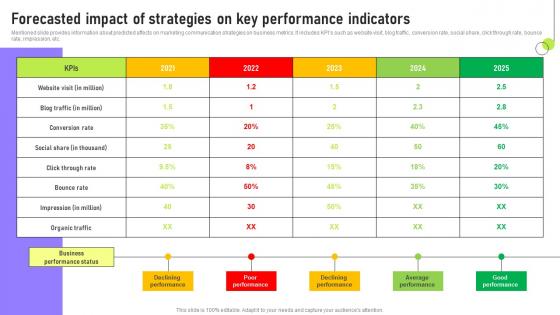
Forecasted Impact Of Strategies On Deployment Of Marketing Communication Portrait Pdf
Mentioned slide provides information about predicted affects on marketing communication strategies on business metrics. It includes KPIs such as website visit, blog traffic, conversion rate, social share, click through rate, bounce rate, impression, etc. Whether you have daily or monthly meetings, a brilliant presentation is necessary. Forecasted Impact Of Strategies On Deployment Of Marketing Communication Portrait Pdf can be your best option for delivering a presentation. Represent everything in detail using Forecasted Impact Of Strategies On Deployment Of Marketing Communication Portrait Pdf and make yourself stand out in meetings. The template is versatile and follows a structure that will cater to your requirements. All the templates prepared by Slidegeeks are easy to download and edit. Our research experts have taken care of the corporate themes as well. So, give it a try and see the results. Mentioned slide provides information about predicted affects on marketing communication strategies on business metrics. It includes KPIs such as website visit, blog traffic, conversion rate, social share, click through rate, bounce rate, impression, etc.
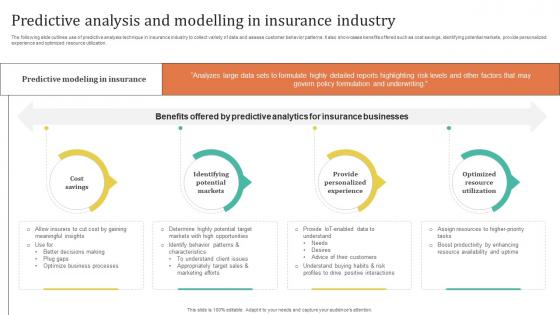
Improving Customer Satisfaction Predictive Analysis And Modelling In Insurance Industry
The following slide outlines use of predictive analysis technique in insurance industry to collect variety of data and assess customer behavior patterns. It also showcases benefits offered such as cost savings, identifying potential markets, provide personalized experience and optimized resource utilization. Slidegeeks is here to make your presentations a breeze with Improving Customer Satisfaction Predictive Analysis And Modelling In Insurance Industry With our easy-to-use and customizable templates, you can focus on delivering your ideas rather than worrying about formatting. With a variety of designs to choose from, you are sure to find one that suits your needs. And with animations and unique photos, illustrations, and fonts, you can make your presentation pop. So whether you are giving a sales pitch or presenting to the board, make sure to check out Slidegeeks first The following slide outlines use of predictive analysis technique in insurance industry to collect variety of data and assess customer behavior patterns. It also showcases benefits offered such as cost savings, identifying potential markets, provide personalized experience and optimized resource utilization.
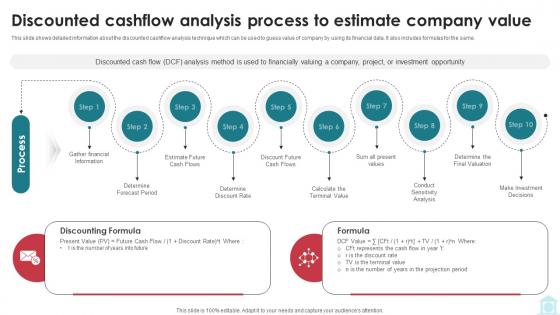
Discounted Cashflow Analysis Process To Estimate Mastering Investment Banking Fin SS V
This slide shows detailed information about the discounted cashflow analysis technique which can be used to guess value of company by using its financial data. It also includes formulas for the same. Make sure to capture your audiences attention in your business displays with our gratis customizable Discounted Cashflow Analysis Process To Estimate Mastering Investment Banking Fin SS V These are great for business strategies, office conferences, capital raising or task suggestions. If you desire to acquire more customers for your tech business and ensure they stay satisfied, create your own sales presentation with these plain slides. This slide shows detailed information about the discounted cashflow analysis technique which can be used to guess value of company by using its financial data. It also includes formulas for the same.
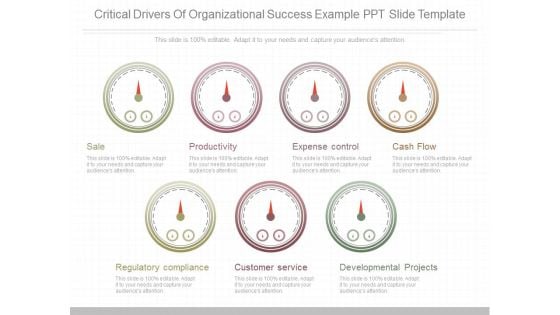
Critical Drivers Of Organizational Success Example Ppt Slide Template
This is a critical drivers of organizational success example ppt slide template. This is a seven stage process. The stages in this process are sale, productivity, expense control, cash flow, regulatory compliance, customer service, developmental projects.
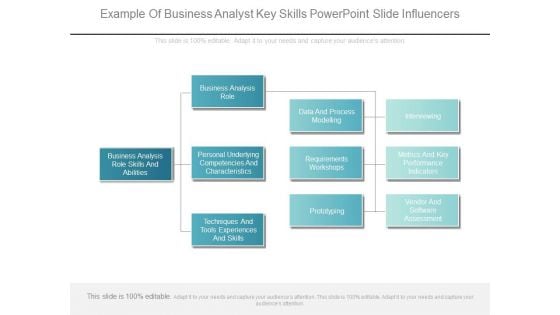
Example Of Business Analyst Key Skills Powerpoint Slide Influencers
This is a example of business analyst key skills powerpoint slide influencers. This is a three stage process. The stages in this process are business analysis role skills and abilities, business analysis role, personal underlying competencies and characteristics, techniques and tools experiences and skills, data and process modelling, requirements workshops, prototyping, interviewing, metrics and key performance indicators, vendor and software assessment.
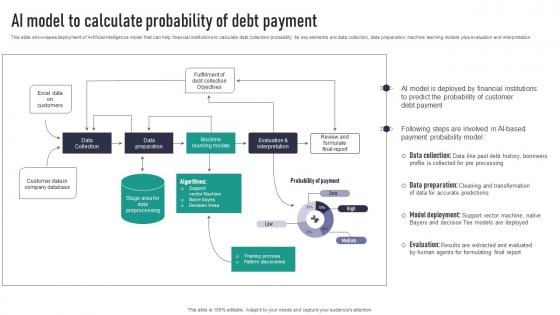
AI Model To Calculate Probability Of Debt Payment Rules Pdf
This slide showcases deployment of Artificial intelligence model that can help financial institutions to calculate debt collection probability. Its key elements are data collection, data preparation, machine learning models plus evaluation and interpretation. Crafting an eye-catching presentation has never been more straightforward. Let your presentation shine with this tasteful yet straightforward AI Model To Calculate Probability Of Debt Payment Rules Pdf template. It offers a minimalistic and classy look that is great for making a statement. The colors have been employed intelligently to add a bit of playfulness while still remaining professional. Construct the ideal AI Model To Calculate Probability Of Debt Payment Rules Pdf that effortlessly grabs the attention of your audience Begin now and be certain to wow your customers This slide showcases deployment of Artificial intelligence model that can help financial institutions to calculate debt collection probability. Its key elements are data collection, data preparation, machine learning models plus evaluation and interpretation.
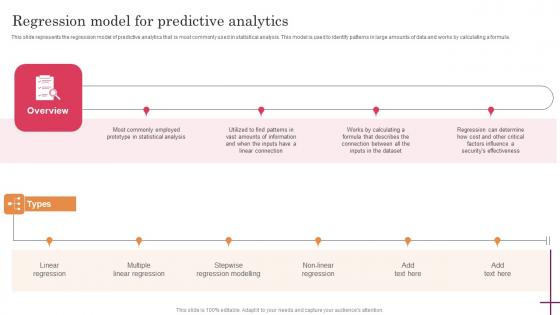
Regression Model For Predictive Analytics Predictive Analytics For Improved Sample Pdf
This slide represents the regression model of predictive analytics that is most commonly used in statistical analysis. This model is used to identify patterns in large amounts of data and works by calculating a formula. Boost your pitch with our creative Regression Model For Predictive Analytics Predictive Analytics For Improved Sample Pdf. Deliver an awe-inspiring pitch that will mesmerize everyone. Using these presentation templates you will surely catch everyones attention. You can browse the ppts collection on our website. We have researchers who are experts at creating the right content for the templates. So you do not have to invest time in any additional work. Just grab the template now and use them. This slide represents the regression model of predictive analytics that is most commonly used in statistical analysis. This model is used to identify patterns in large amounts of data and works by calculating a formula.
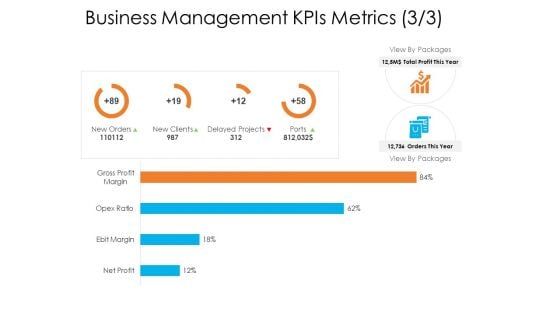
Enterprise Governance Business Management Kpis Metrics Demonstration PDF
Deliver and pitch your topic in the best possible manner with this enterprise governance business management kpis metrics demonstration pdf. Use them to share invaluable insights on new clients, delayed projects, gross profit margin and impress your audience. This template can be altered and modified as per your expectations. So, grab it now.
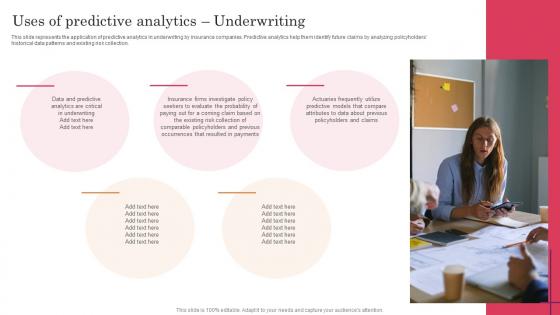
Uses Of Predictive Analytics Underwriting Predictive Analytics For Improved Slides Pdf
This slide represents the application of predictive analytics in underwriting by insurance companies. Predictive analytics help them identify future claims by analyzing policyholders historical data patterns and existing risk collection. Find highly impressive Uses Of Predictive Analytics Underwriting Predictive Analytics For Improved Slides Pdf on Slidegeeks to deliver a meaningful presentation. You can save an ample amount of time using these presentation templates. No need to worry to prepare everything from scratch because Slidegeeks experts have already done a huge research and work for you. You need to download Uses Of Predictive Analytics Underwriting Predictive Analytics For Improved Slides Pdf for your upcoming presentation. All the presentation templates are 100 percent editable and you can change the color and personalize the content accordingly. Download now. This slide represents the application of predictive analytics in underwriting by insurance companies. Predictive analytics help them identify future claims by analyzing policyholders historical data patterns and existing risk collection.
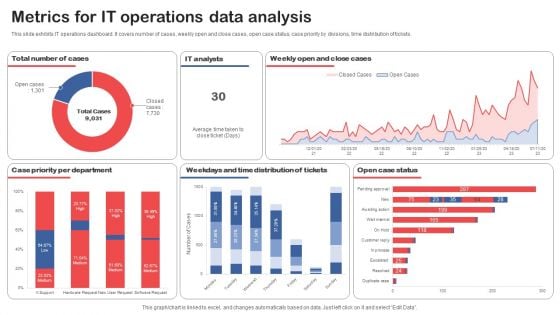
Metrics For IT Operations Data Analysis Topics PDF
This slide exhibits IT operations dashboard. It covers number of cases, weekly open and close cases, open case status, case priority by divisions, time distribution of tickets. Pitch your topic with ease and precision using this Metrics For IT Operations Data Analysis Topics PDF. This layout presents information on Case Priority Per Department, Distribution Of Tickets, Open Case Status. It is also available for immediate download and adjustment. So, changes can be made in the color, design, graphics or any other component to create a unique layout.
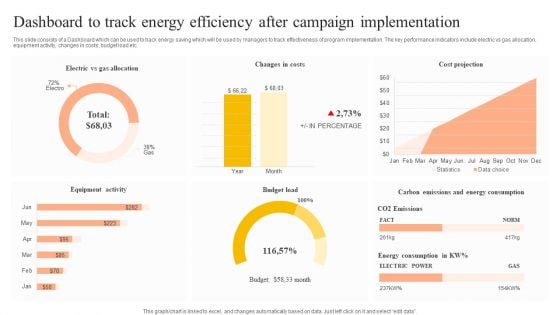
Dashboard To Track Energy Efficiency After Campaign Implementation Pictures PDF
This slide consists of a Dashboard which can be used to track energy saving which will be used by managers to track effectiveness of program implementation. The key performance indicators include electric vs gas allocation, equipment activity, changes in costs, budget load etc. Showcasing this set of slides titled Dashboard To Track Energy Efficiency After Campaign Implementation Pictures PDF. The topics addressed in these templates are Equipment Activity, Budget Load, Cost Projection. All the content presented in this PPT design is completely editable. Download it and make adjustments in color, background, font etc. as per your unique business setting.
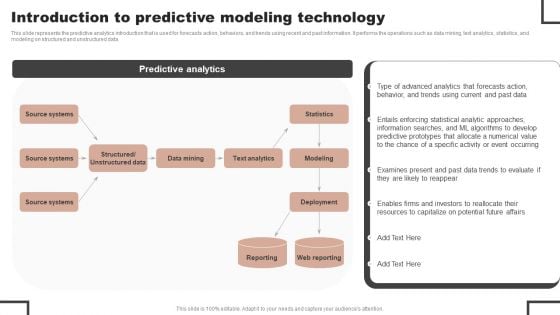
Forecast Analysis Technique IT Introduction To Predictive Modeling Technology Portrait PDF
This slide represents the predictive analytics introduction that is used for forecasts action, behaviors, and trends using recent and past information. It performs the operations such as data mining, text analytics, statistics, and modeling on structured and unstructured data. Boost your pitch with our creative Forecast Analysis Technique IT Introduction To Predictive Modeling Technology Portrait PDF. Deliver an awe inspiring pitch that will mesmerize everyone. Using these presentation templates you will surely catch everyones attention. You can browse the ppts collection on our website. We have researchers who are experts at creating the right content for the templates. So you do not have to invest time in any additional work. Just grab the template now and use them.
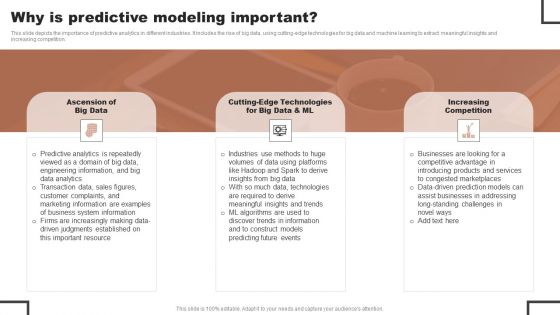
Forecast Analysis Technique IT Why Is Predictive Modeling Important Mockup PDF
This slide depicts the importance of predictive analytics in different industries. It includes the rise of big data, using cutting-edge technologies for big data and machine learning to extract meaningful insights and increasing competition. The Forecast Analysis Technique IT Why Is Predictive Modeling Important Mockup PDF is a compilation of the most recent design trends as a series of slides. It is suitable for any subject or industry presentation, containing attractive visuals and photo spots for businesses to clearly express their messages. This template contains a variety of slides for the user to input data, such as structures to contrast two elements, bullet points, and slides for written information. Slidegeeks is prepared to create an impression.
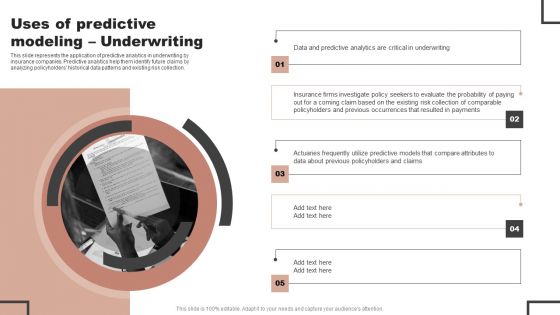
Forecast Analysis Technique IT Uses Of Predictive Modeling Underwriting Portrait PDF
This slide represents the application of predictive analytics in underwriting by insurance companies. Predictive analytics help them identify future claims by analyzing policyholders historical data patterns and existing risk collection. The best PPT templates are a great way to save time, energy, and resources. Slidegeeks have 100 percent editable powerpoint slides making them incredibly versatile. With these quality presentation templates, you can create a captivating and memorable presentation by combining visually appealing slides and effectively communicating your message. Download Forecast Analysis Technique IT Uses Of Predictive Modeling Underwriting Portrait PDF from Slidegeeks and deliver a wonderful presentation.
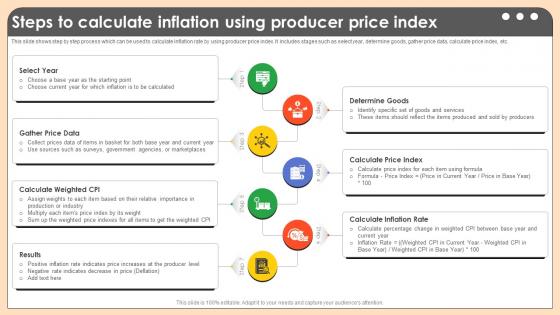
Steps To Calculate Inflation Using Producer Comprehensive Guide On Inflation Control CM SS V
This slide shows step by step process which can be used to calculate inflation rate by using producer price index. It includes stages such as select year, determine goods, gather price data, calculate price index, etc. Present like a pro with Steps To Calculate Inflation Using Producer Comprehensive Guide On Inflation Control CM SS V. Create beautiful presentations together with your team, using our easy-to-use presentation slides. Share your ideas in real-time and make changes on the fly by downloading our templates. So whether you are in the office, on the go, or in a remote location, you can stay in sync with your team and present your ideas with confidence. With Slidegeeks presentation got a whole lot easier. Grab these presentations today. This slide shows step by step process which can be used to calculate inflation rate by using producer price index. It includes stages such as select year, determine goods, gather price data, calculate price index, etc.
Predictive Data Model Introduction To Predictive Analytics Technology Introduction PDF

Forecast Analysis Technique IT Roadmap For Predictive Modeling Model Development Summary PDF
This slide represents the roadmap for predictive analytics model development, including the steps to be performed in the process, such as highlighting and formulating a problem, data preparation, information exploration, transforming and choosing, making, validating, and so on. Make sure to capture your audiences attention in your business displays with our gratis customizable Forecast Analysis Technique IT Roadmap For Predictive Modeling Model Development Summary PDF. These are great for business strategies, office conferences, capital raising or task suggestions. If you desire to acquire more customers for your tech business and ensure they stay satisfied, create your own sales presentation with these plain slides.
Forecast Analysis Technique IT Predictive Modeling In Banking And Finance Industry Topics PDF
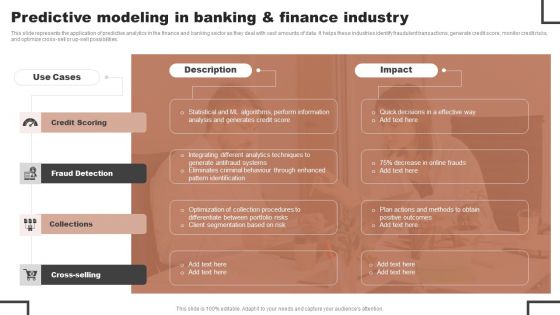
This slide represents the application of predictive analytics in the finance and banking sector as they deal with vast amounts of data. It helps these industries identify fraudulent transactions, generate credit score, monitor credit risks, and optimize cross-sell or up-sell possibilities. Do you have to make sure that everyone on your team knows about any specific topic I yes, then you should give Forecast Analysis Technique IT Predictive Modeling In Banking And Finance Industry Topics PDF a try. Our experts have put a lot of knowledge and effort into creating this impeccable Forecast Analysis Technique IT Predictive Modeling In Banking And Finance Industry Topics PDF. You can use this template for your upcoming presentations, as the slides are perfect to represent even the tiniest detail. You can download these templates from the Slidegeeks website and these are easy to edit. So grab these today.
Important Kpis For Tracking Cloud Data Intelligence Sample Pdf
This slide covers the top key performance indicators KPIs for tracking data analytics. The purpose of this template is to provide an overview of the KPIs that can help assess the effectiveness, adoption, accuracy, and efficiency of data analytics initiatives. It includes stat driven targets and actionable steps. Pitch your topic with ease and precision using this Important Kpis For Tracking Cloud Data Intelligence Sample Pdf. This layout presents information on Analytics Regularly, Generate Insights, Optimize Workflows. It is also available for immediate download and adjustment. So, changes can be made in the color, design, graphics or any other component to create a unique layout. This slide covers the top key performance indicators KPIs for tracking data analytics. The purpose of this template is to provide an overview of the KPIs that can help assess the effectiveness, adoption, accuracy, and efficiency of data analytics initiatives. It includes stat driven targets and actionable steps.
Lead Metrics To Track And Measure Product Success Ppt Visual Aids Ideas Pdf
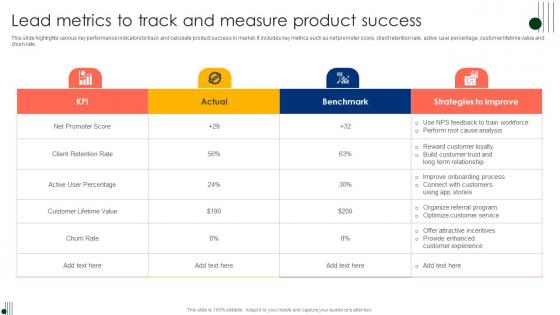
This slide highlights various key performance indicators to track and calculate product success in market. It includes key metrics such as net promoter score, client retention rate, active user percentage, customer lifetime value and churn rate. Showcasing this set of slides titled Lead Metrics To Track And Measure Product Success Ppt Visual Aids Ideas Pdf. The topics addressed in these templates are Client Retention Rate, Active User Percentage, Customer Lifetime. All the content presented in this PPT design is completely editable. Download it and make adjustments in color, background, font etc. as per your unique business setting. This slide highlights various key performance indicators to track and calculate product success in market. It includes key metrics such as net promoter score, client retention rate, active user percentage, customer lifetime value and churn rate.
Predictive Data Model Overview Of Predictive Analytics Framework Summary PDF
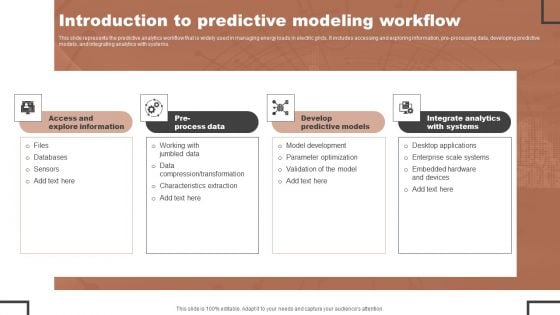
Forecast Analysis Technique IT Introduction To Predictive Modeling Workflow Ideas PDF
This slide represents the predictive analytics workflow that is widely used in managing energy loads in electric grids. It includes accessing and exploring information, pre-processing data, developing predictive models, and integrating analytics with systems. Presenting this PowerPoint presentation, titled Forecast Analysis Technique IT Introduction To Predictive Modeling Workflow Ideas PDF, with topics curated by our researchers after extensive research. This editable presentation is available for immediate download and provides attractive features when used. Download now and captivate your audience. Presenting this Forecast Analysis Technique IT Introduction To Predictive Modeling Workflow Ideas PDF. Our researchers have carefully researched and created these slides with all aspects taken into consideration. This is a completely customizable Forecast Analysis Technique IT Introduction To Predictive Modeling Workflow Ideas PDF that is available for immediate downloading. Download now and make an impact on your audience. Highlight the attractive features available with our PPTs.

Data Interpretation And Analysis Playbook Business Intelligence And Predictive Analytics Challenges Template PDF
This template covers the problems while implementing BI and predictive analytics in the organization. The challenges are undefined KPIs and metrics, and unable to hire right data science talent. Presenting data interpretation and analysis playbook business intelligence and predictive analytics challenges template pdf to provide visual cues and insights. Share and navigate important information on two stages that need your due attention. This template can be used to pitch topics like security vulnerabilities, operationalizing, perform analysis, deployed. In addtion, this PPT design contains high resolution images, graphics, etc, that are easily editable and available for immediate download.

Forecast Analysis Technique IT Lifecycle Of Predictive Modeling Model Summary PDF
This slide depicts the lifecycle of the predictive analytics model, and it includes highlighting and formulating a problem, data preparation, information exploration, transforming and choosing, making, validating, and deploying a model, and then evaluating and monitoring results. From laying roadmaps to briefing everything in detail, our templates are perfect for you. You can set the stage with your presentation slides. All you have to do is download these easy to edit and customizable templates. Forecast Analysis Technique IT Lifecycle Of Predictive Modeling Model Summary PDF will help you deliver an outstanding performance that everyone would remember and praise you for. Do download this presentation today.
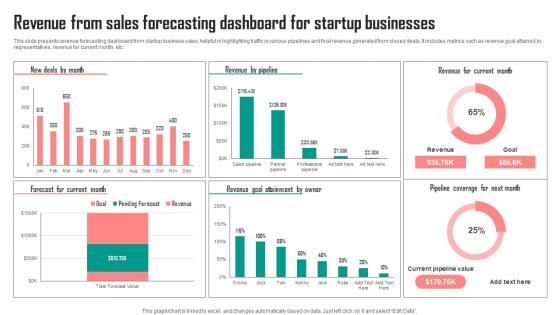
Revenue From Sales Forecasting Dashboard For Startup Businesses Graphics Pdf
This slide presents revenue forecasting dashboard from startup business sales, helpful in highlighting traffic in various pipelines and final revenue generated from closed deals. It includes metrics such as revenue goal attained by representatives, revenue for current month, etc. Showcasing this set of slides titled Revenue From Sales Forecasting Dashboard For Startup Businesses Graphics Pdf. The topics addressed in these templates are Owner, Current Month, Businesses. All the content presented in this PPT design is completely editable. Download it and make adjustments in color, background, font etc. as per your unique business setting. This slide presents revenue forecasting dashboard from startup business sales, helpful in highlighting traffic in various pipelines and final revenue generated from closed deals. It includes metrics such as revenue goal attained by representatives, revenue for current month, etc.


 Continue with Email

 Home
Home


