Project Kpi

Six Stage Process To Calculate Inflation Rate Comprehensive Guide On Inflation Control CM SS V
This slide shows step by step process which can be used to calculate inflation rate by using ECI. It includes stages such as select year, collect data, calculate ECI for wages and benefits and interpret results. Do you have to make sure that everyone on your team knows about any specific topic I yes, then you should give Six Stage Process To Calculate Inflation Rate Comprehensive Guide On Inflation Control CM SS V a try. Our experts have put a lot of knowledge and effort into creating this impeccable Six Stage Process To Calculate Inflation Rate Comprehensive Guide On Inflation Control CM SS V. You can use this template for your upcoming presentations, as the slides are perfect to represent even the tiniest detail. You can download these templates from the Slidegeeks website and these are easy to edit. So grab these today This slide shows step by step process which can be used to calculate inflation rate by using ECI. It includes stages such as select year, collect data, calculate ECI for wages and benefits and interpret results.
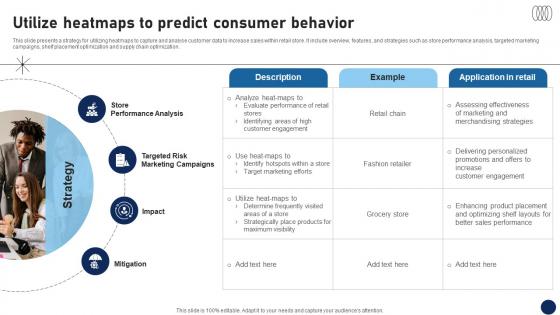
Utilize Heatmaps To Predict Consumer Behavior DT SS V
This slide presents a strategy for utilizing heatmaps to capture and analyse customer data to increase sales within retail store. It include overview, features, and strategies such as store performance analysis, targeted marketing campaigns, shelf placement optimization and supply chain optimization. Present like a pro with Utilize Heatmaps To Predict Consumer Behavior DT SS V. Create beautiful presentations together with your team, using our easy-to-use presentation slides. Share your ideas in real-time and make changes on the fly by downloading our templates. So whether you are in the office, on the go, or in a remote location, you can stay in sync with your team and present your ideas with confidence. With Slidegeeks presentation got a whole lot easier. Grab these presentations today. This slide presents a strategy for utilizing heatmaps to capture and analyse customer data to increase sales within retail store. It include overview, features, and strategies such as store performance analysis, targeted marketing campaigns, shelf placement optimization and supply chain optimization.
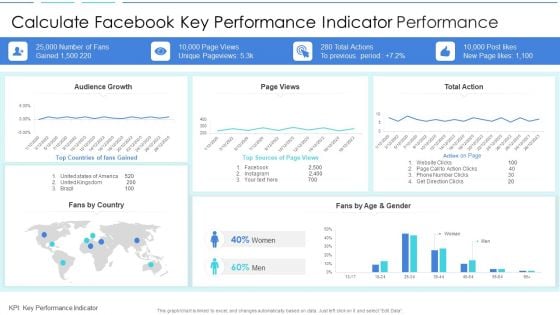
Calculate Facebook Key Performance Indicator Performance Sample PDF
Pitch your topic with ease and precision using this calculate facebook key performance indicator performance sample pdf. This layout presents information on calculate facebook key performance indicator performance. It is also available for immediate download and adjustment. So, changes can be made in the color, design, graphics or any other component to create a unique layout.
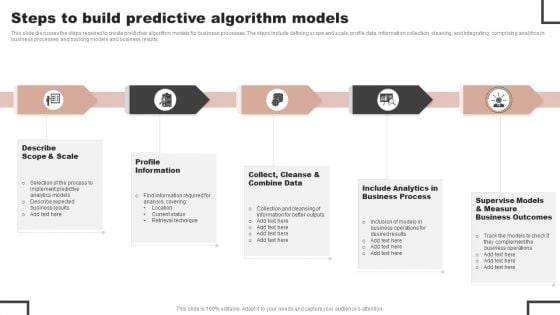
Forecast Analysis Technique IT Steps To Build Predictive Algorithm Models Mockup PDF
This slide discusses the steps required to create predictive algorithm models for business processes. The steps include defining scope and scale, profile data, information collection, cleaning, and integrating, comprising analytics in business processes, and tracking models and business results. Do you have an important presentation coming up Are you looking for something that will make your presentation stand out from the rest Look no further than Forecast Analysis Technique IT Steps To Build Predictive Algorithm Models Mockup PDF. With our professional designs, you can trust that your presentation will pop and make delivering it a smooth process. And with Slidegeeks, you can trust that your presentation will be unique and memorable. So why wait Grab Forecast Analysis Technique IT Steps To Build Predictive Algorithm Models Mockup PDF today and make your presentation stand out from the rest.
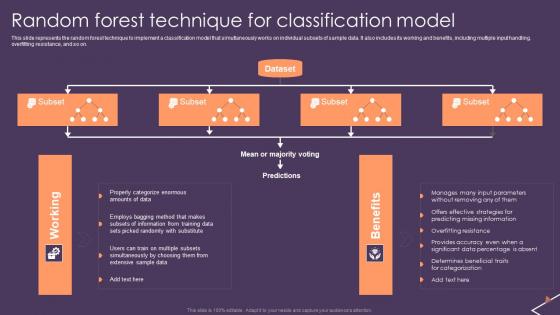
Predictive Analytics For Empowering Random Forest Technique For Classification Model Guidelines Pdf
This slide represents the random forest technique to implement a classification model that simultaneously works on individual subsets of sample data. It also includes its working and benefits, including multiple input handling, overfitting resistance, and so on. This Predictive Analytics For Empowering Random Forest Technique For Classification Model Guidelines Pdf from Slidegeeks makes it easy to present information on your topic with precision. It provides customization options, so you can make changes to the colors, design, graphics, or any other component to create a unique layout. It is also available for immediate download, so you can begin using it right away. Slidegeeks has done good research to ensure that you have everything you need to make your presentation stand out. Make a name out there for a brilliant performance. This slide represents the random forest technique to implement a classification model that simultaneously works on individual subsets of sample data. It also includes its working and benefits, including multiple input handling, overfitting resistance, and so on.
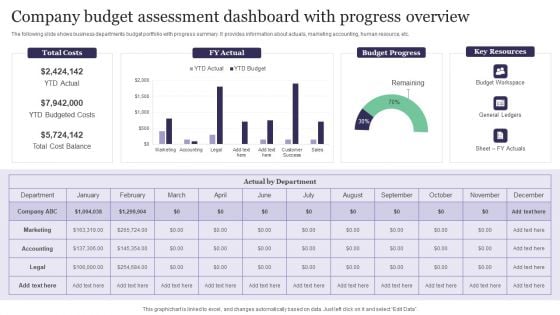
Company Budget Assessment Dashboard With Progress Overview Background PDF
The following slide shows business departments budget portfolio with progress summary. It provides information about actuals, marketing accounting, human resource, etc. Showcasing this set of slides titled Company Budget Assessment Dashboard With Progress Overview Background PDF. The topics addressed in these templates are Total Costs, Budget Progress, Key Resources. All the content presented in this PPT design is completely editable. Download it and make adjustments in color, background, font etc. as per your unique business setting.
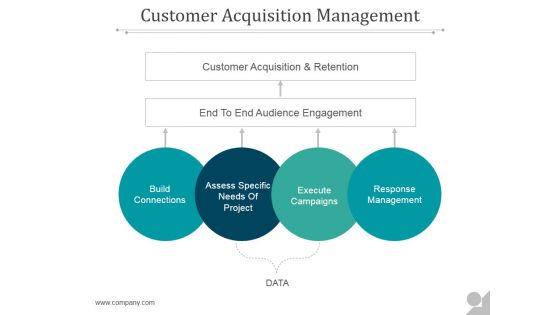
Customer Acquisition Management Ppt PowerPoint Presentation Files
This is a customer acquisition management ppt powerpoint presentation files. This is a four stage process. The stages in this process are build connections, assess specific needs of project, execute campaigns, response management.
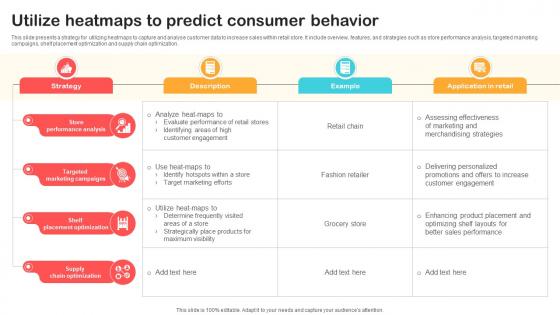
Utilize Heatmaps To Predict Consumer Behavior Optimizing Retail Operations With Digital DT SS V
This slide presents a strategy for utilizing heatmaps to capture and analyse customer data to increase sales within retail store. It include overview, features, and strategies such as store performance analysis, targeted marketing campaigns, shelf placement optimization and supply chain optimization. Present like a pro with Utilize Heatmaps To Predict Consumer Behavior Optimizing Retail Operations With Digital DT SS V. Create beautiful presentations together with your team, using our easy-to-use presentation slides. Share your ideas in real-time and make changes on the fly by downloading our templates. So whether you are in the office, on the go, or in a remote location, you can stay in sync with your team and present your ideas with confidence. With Slidegeeks presentation got a whole lot easier. Grab these presentations today. This slide presents a strategy for utilizing heatmaps to capture and analyse customer data to increase sales within retail store. It include overview, features, and strategies such as store performance analysis, targeted marketing campaigns, shelf placement optimization and supply chain optimization.
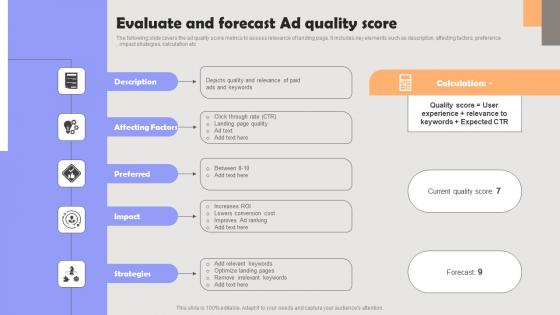
Improving PPC Campaign Results Evaluate And Forecast Ad Quality Score Microsoft Pdf
The following slide covers the ad quality score metrics to assess relevance of landing page. It includes key elements such as description, affecting factors, preference, impact strategies, calculation etc. Make sure to capture your audiences attention in your business displays with our gratis customizable Improving PPC Campaign Results Evaluate And Forecast Ad Quality Score Microsoft Pdf. These are great for business strategies, office conferences, capital raising or task suggestions. If you desire to acquire more customers for your tech business and ensure they stay satisfied, create your own sales presentation with these plain slides. The following slide covers the ad quality score metrics to assess relevance of landing page. It includes key elements such as description, affecting factors, preference, impact strategies, calculation etc.
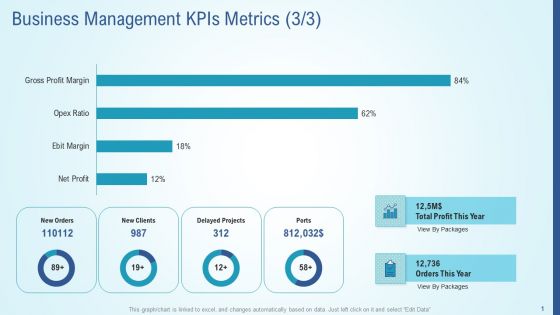
Business Strategy Development Process Business Management Kpis Metrics Clients Introduction PDF
Deliver an awe inspiring pitch with this creative business strategy development process business management kpis metrics clients introduction pdf bundle. Topics like delayed projects, ports, new clients, new orders can be discussed with this completely editable template. It is available for immediate download depending on the needs and requirements of the user.
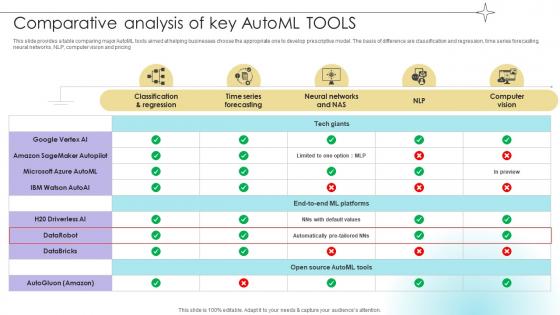
Comparative Analysis Of Key Automl Tools Data Analytics SS V
This slide provides a table comparing major AutoML tools aimed at helping businesses choose the appropriate one to develop prescriptive model. The basis of difference are classification and regression, time series forecasting, neural networks, NLP, computer vision and pricing.The Comparative Analysis Of Key Automl Tools Data Analytics SS V is a compilation of the most recent design trends as a series of slides. It is suitable for any subject or industry presentation, containing attractive visuals and photo spots for businesses to clearly express their messages. This template contains a variety of slides for the user to input data, such as structures to contrast two elements, bullet points, and slides for written information. Slidegeeks is prepared to create an impression. This slide provides a table comparing major AutoML tools aimed at helping businesses choose the appropriate one to develop prescriptive model. The basis of difference are classification and regression, time series forecasting, neural networks, NLP, computer vision and pricing.
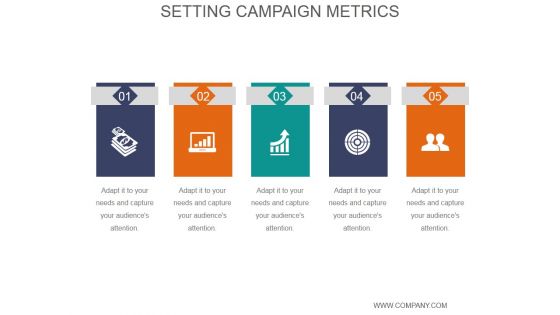
Setting Campaign Metrics Ppt PowerPoint Presentation Slide Download
This is a setting campaign metrics ppt powerpoint presentation slide download. This is a five stage process. The stages in this process are icons, process, strategy, business, marketing, management.
Data Quality Kpis Assessment Metrics Icon Topics PDF
Showcasing this set of slides titled Data Quality Kpis Assessment Metrics Icon Topics PDF. The topics addressed in these templates are Data Quality Kpis, Assessment Metrics Icon. All the content presented in this PPT design is completely editable. Download it and make adjustments in color, background, font etc. as per your unique business setting.
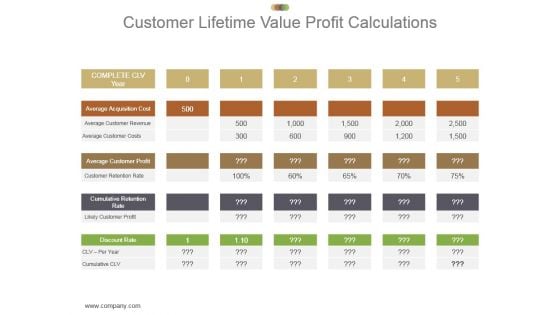
Customer Lifetime Value Profit Calculations Ppt Presentation
This is a customer lifetime value profit calculations ppt presentation. This is a five stage process. The stages in this process are complete clv year, average acquisition cost, average customer revenue, average customer costs, average customer profit, customer retention rate, cumulative retention rate, likely customer profit, discount rate.
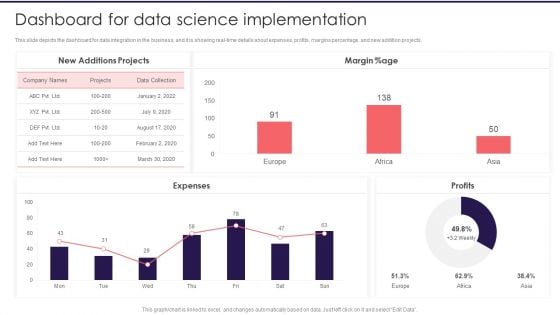
Information Studies Dashboard For Data Science Implementation Structure PDF
This slide depicts the dashboard for data integration in the business, and it is showing real time details about expenses, profits, margins percentage, and new addition projects. Deliver an awe inspiring pitch with this creative Information Studies Dashboard For Data Science Implementation Structure PDF bundle. Topics like New Additions Projects, Margin, Expenses can be discussed with this completely editable template. It is available for immediate download depending on the needs and requirements of the user.
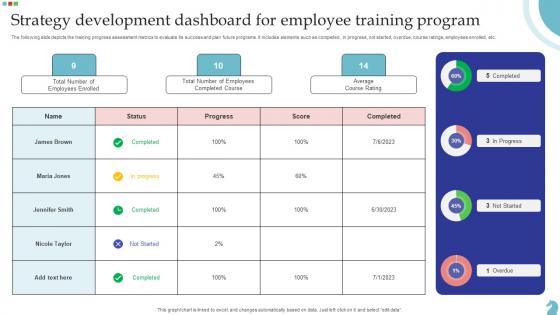
Strategy Development Dashboard For Employee Training Program Designs Pdf
The following slide depicts the training progress assessment metrics to evaluate its success and plan future programs. It includes elements such as completed, in progress, not started, overdue, course ratings, employees enrolled, etc. Showcasing this set of slides titled Strategy Development Dashboard For Employee Training Program Designs Pdf. The topics addressed in these templates are Strategy Development Dashboard, Employee Training Program, Average Course Rating. All the content presented in this PPT design is completely editable. Download it and make adjustments in color, background, font etc. as per your unique business setting. The following slide depicts the training progress assessment metrics to evaluate its success and plan future programs. It includes elements such as completed, in progress, not started, overdue, course ratings, employees enrolled, etc.
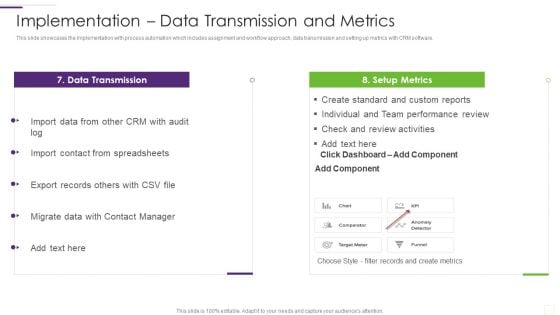
CRM Implementation Strategy Implementation Data Transmission And Metrics Slides PDF
This slide showcases the Implementation with process automation which includes assignment and workflow approach, data transmission and setting up metrics with CRM software.Deliver and pitch your topic in the best possible manner with this CRM Implementation Strategy Implementation Data Transmission And Metrics Slides PDF Use them to share invaluable insights on Data Transmission, Performance Review, Review Activities and impress your audience. This template can be altered and modified as per your expectations. So, grab it now.
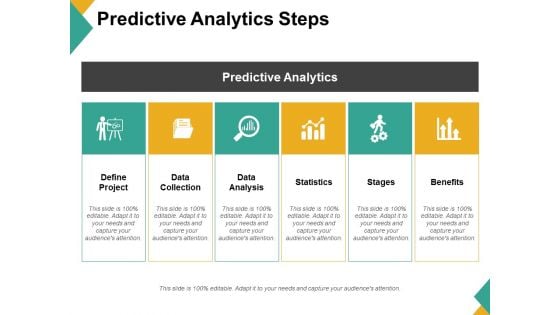
Predictive Analytics Steps Ppt PowerPoint Presentation Styles Guidelines
This is a predictive analytics steps ppt powerpoint presentation styles guidelines. This is a six stage process. The stages in this process are define project, data collection, data analysis, statistics, stages, benefits.
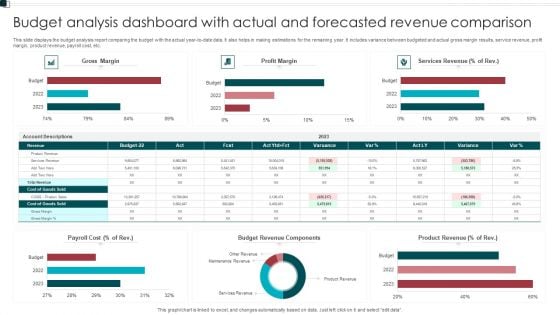
Budget Analysis Dashboard With Actual And Forecasted Revenue Comparison Structure PDF
This slide displays the budget analysis report comparing the budget with the actual year to date data. It also helps in making estimations for the remaining year. It includes variance between budgeted and actual gross margin results, service revenue, profit margin, product revenue, payroll cost, etc. Pitch your topic with ease and precision using this Budget Analysis Dashboard With Actual And Forecasted Revenue Comparison Structure PDF. This layout presents information on Payroll Cost, Budget Revenue Components, Product Revenue. It is also available for immediate download and adjustment. So, changes can be made in the color, design, graphics or any other component to create a unique layout.
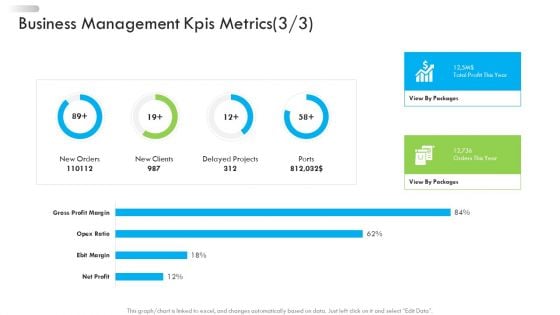
Enterprise Tactical Planning Enterprise Tactical Planning Business Management Kpis Metrics Ports Formats PDF
Deliver an awe-inspiring pitch with this creative enterprise tactical planning enterprise tactical planning business management kpis metrics ports formats pdf bundle. Topics like delayed projects, ports, new clients, gross profit margin, net profit can be discussed with this completely editable template. It is available for immediate download depending on the needs and requirements of the user.
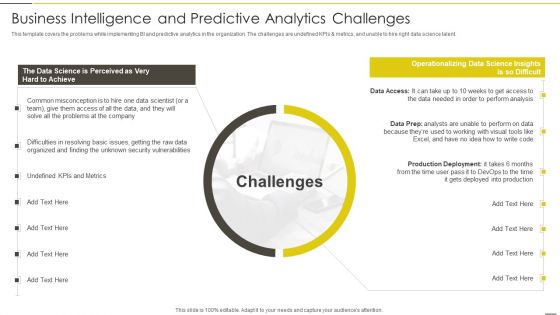
Administered Data And Analytic Quality Playbook Business Intelligence And Predictive Download PDF
This template covers the problems while implementing BI and predictive analytics in the organization. The challenges are undefined KPIs and metrics, and unable to hire right data science talent. Deliver and pitch your topic in the best possible manner with this Administered Data And Analytic Quality Playbook Business Intelligence And Predictive Download PDF Use them to share invaluable insights on Common Misconception, Operationalizing, Production Deployment and impress your audience. This template can be altered and modified as per your expectations. So, grab it now.
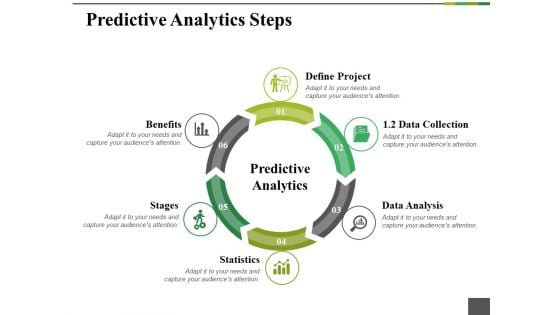
Predictive Analytics Steps Ppt PowerPoint Presentation Portfolio Template
This is a predictive analytics steps ppt powerpoint presentation portfolio template. This is a six stage process. The stages in this process are define project, benefits, stages, statistics, data analysis.
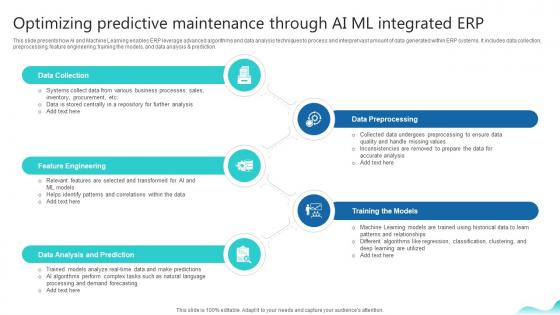
Optimizing Predictive Maintenance Through Ai Ml Erp And Digital Transformation For Maximizing DT SS V
This slide presents how AI and Machine Learning enables ERP leverage advanced algorithms and data analysis techniques to process and interpret vast amount of data generated within ERP systems. It includes data collection, preprocessing, feature engineering, training the models, and data analysis and prediction.This Optimizing Predictive Maintenance Through Ai Ml Erp And Digital Transformation For Maximizing DT SS V is perfect for any presentation, be it in front of clients or colleagues. It is a versatile and stylish solution for organizing your meetings. The Optimizing Predictive Maintenance Through Ai Ml Erp And Digital Transformation For Maximizing DT SS V features a modern design for your presentation meetings. The adjustable and customizable slides provide unlimited possibilities for acing up your presentation. Slidegeeks has done all the homework before launching the product for you. So, do not wait, grab the presentation templates today This slide presents how AI and Machine Learning enables ERP leverage advanced algorithms and data analysis techniques to process and interpret vast amount of data generated within ERP systems. It includes data collection, preprocessing, feature engineering, training the models, and data analysis and prediction.
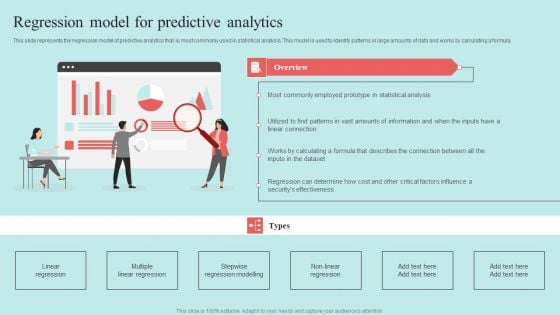
Predictive Data Model Regression Model For Predictive Analytics Sample PDF
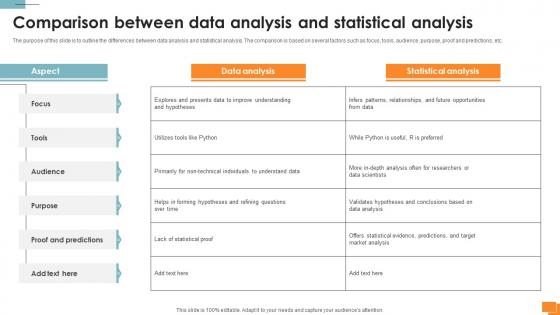
Statistical Tools For Evidence Comparison Between Data Analysis And Statistical Analysis
The purpose of this slide is to outline the differences between data analysis and statistical analysis. The comparison is based on several factors such as focus, tools, audience, purpose, proof and predictions, etc. Find highly impressive Statistical Tools For Evidence Comparison Between Data Analysis And Statistical Analysis on Slidegeeks to deliver a meaningful presentation. You can save an ample amount of time using these presentation templates. No need to worry to prepare everything from scratch because Slidegeeks experts have already done a huge research and work for you. You need to download Statistical Tools For Evidence Comparison Between Data Analysis And Statistical Analysis for your upcoming presentation. All the presentation templates are 100 percent editable and you can change the color and personalize the content accordingly. Download now The purpose of this slide is to outline the differences between data analysis and statistical analysis. The comparison is based on several factors such as focus, tools, audience, purpose, proof and predictions, etc.
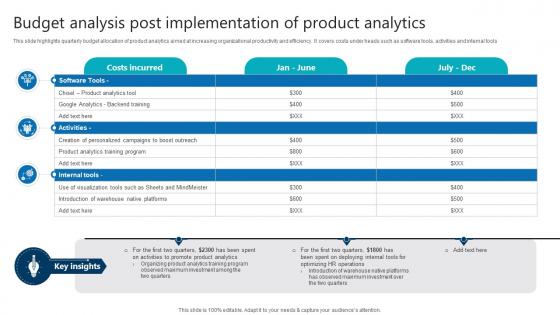
Budget Analysis Post Implementation Of Product Analytics Product Analytics Implementation Data Analytics V
This slide highlights quarterly budget allocation of product analytics aimed at increasing organizational productivity and efficiency. It covers costs under heads such as software tools, activities and internal tools From laying roadmaps to briefing everything in detail, our templates are perfect for you. You can set the stage with your presentation slides. All you have to do is download these easy-to-edit and customizable templates. Budget Analysis Post Implementation Of Product Analytics Product Analytics Implementation Data Analytics V will help you deliver an outstanding performance that everyone would remember and praise you for. Do download this presentation today. This slide highlights quarterly budget allocation of product analytics aimed at increasing organizational productivity and efficiency. It covers costs under heads such as software tools, activities and internal tools
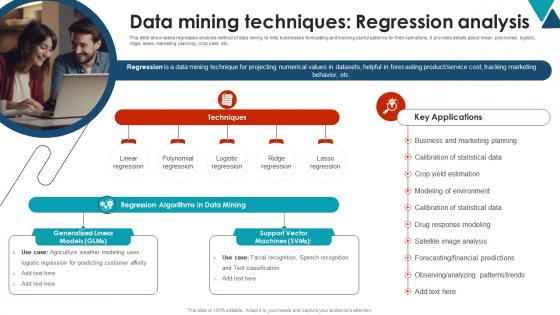
Data Mining Techniques Regression Analysis Using Data Mining Tools To Optimize Processes AI SS V
This slide showcases regression analysis method of data mining to help businesses forecasting and tracking useful patterns for their operations. It provides details about linear, polynomial, logistic, ridge, lasso, marketing planning, crop yield, etc. Presenting this PowerPoint presentation, titled Data Mining Techniques Regression Analysis Using Data Mining Tools To Optimize Processes AI SS V, with topics curated by our researchers after extensive research. This editable presentation is available for immediate download and provides attractive features when used. Download now and captivate your audience. Presenting this Data Mining Techniques Regression Analysis Using Data Mining Tools To Optimize Processes AI SS V. Our researchers have carefully researched and created these slides with all aspects taken into consideration. This is a completely customizable Data Mining Techniques Regression Analysis Using Data Mining Tools To Optimize Processes AI SS V that is available for immediate downloading. Download now and make an impact on your audience. Highlight the attractive features available with our PPTs. This slide showcases regression analysis method of data mining to help businesses forecasting and tracking useful patterns for their operations. It provides details about linear, polynomial, logistic, ridge, lasso, marketing planning, crop yield, etc.
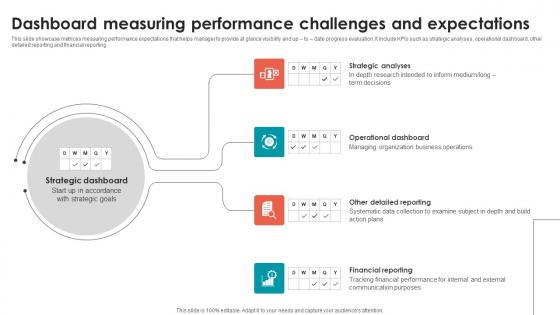
Dashboard Measuring Performance Challenges And Expectations Portrait Pdf
This slide showcase metrices measuring performance expectations that helps manager to provide at glance visibility and up to date progress evaluation. It include KPIs such as strategic analyses, operational dashboard, other detailed reporting and financial reporting. Showcasing this set of slides titled Dashboard Measuring Performance Challenges And Expectations Portrait Pdf. The topics addressed in these templates are Operational Dashboard, Strategic Analyses, Financial Reporting. All the content presented in this PPT design is completely editable. Download it and make adjustments in color, background, font etc. as per your unique business setting. This slide showcase metrices measuring performance expectations that helps manager to provide at glance visibility and up to date progress evaluation. It include KPIs such as strategic analyses, operational dashboard, other detailed reporting and financial reporting.
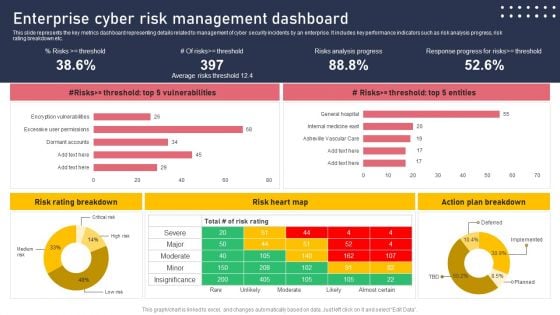
Enterprise Cyber Risk Management Dashboard Sample PDF
This slide represents the key metrics dashboard representing details related to management of cyber security incidents by an enterprise. It includes key performance indicators such as risk analysis progress, risk rating breakdown etc. There are so many reasons you need a Enterprise Cyber Risk Management Dashboard Sample PDF. The first reason is you cannot spend time making everything from scratch, Thus, Slidegeeks has made presentation templates for you too. You can easily download these templates from our website easily.
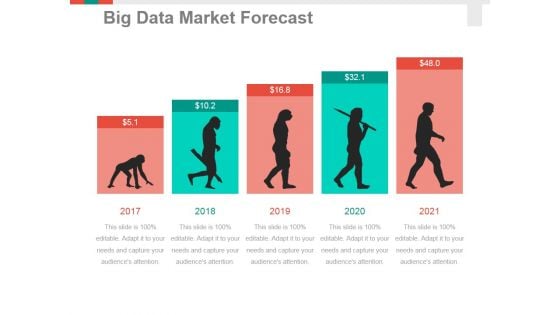
Big Data Market Forecast Ppt PowerPoint Presentation Portfolio Inspiration
This is a big data market forecast ppt powerpoint presentation portfolio inspiration. This is a five stage process. The stages in this process are business, growth, analysis, strategy, success.
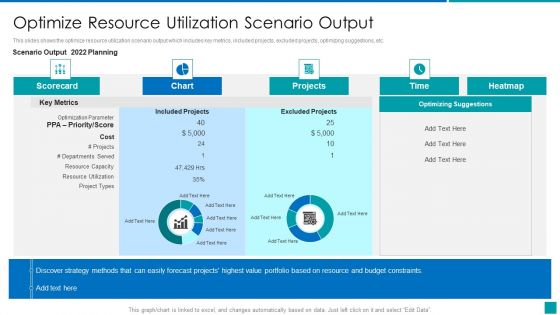
Optimize Resource Utilization Scenario Output Rules PDF
This slides shows the optimize resource utilization scenario output which includes key metrics, included projects, excluded projects, optimizing suggestions, etc. Deliver and pitch your topic in the best possible manner with this Optimize Resource Utilization Scenario Output Rules PDF. Use them to share invaluable insights on Portfolio, Strategy, Budget, Resource and impress your audience. This template can be altered and modified as per your expectations. So, grab it now.
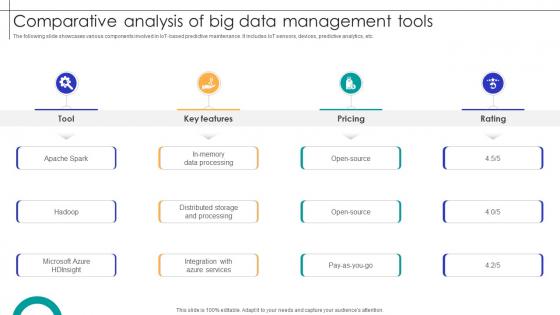
Comparative Analysis Of Big Data Management Tools Streamlining Production Ppt Powerpoint
The following slide showcases various components involved in IoT-based predictive maintenance. It includes IoT sensors, devices, predictive analytics, etc. Are you in need of a template that can accommodate all of your creative concepts This one is crafted professionally and can be altered to fit any style. Use it with Google Slides or PowerPoint. Include striking photographs, symbols, depictions, and other visuals. Fill, move around, or remove text boxes as desired. Test out color palettes and font mixtures. Edit and save your work, or work with colleagues. Download Comparative Analysis Of Big Data Management Tools Streamlining Production Ppt Powerpoint and observe how to make your presentation outstanding. Give an impeccable presentation to your group and make your presentation unforgettable. The following slide showcases various components involved in IoT-based predictive maintenance. It includes IoT sensors, devices, predictive analytics, etc.

Calculate Facebook Key Performance Indicator Campaign Success Template PDF
Pitch your topic with ease and precision using this calculate facebook key performance indicator campaign success template pdf. This layout presents information on calculate facebook key performance indicator campaign success. It is also available for immediate download and adjustment. So, changes can be made in the color, design, graphics or any other component to create a unique layout.
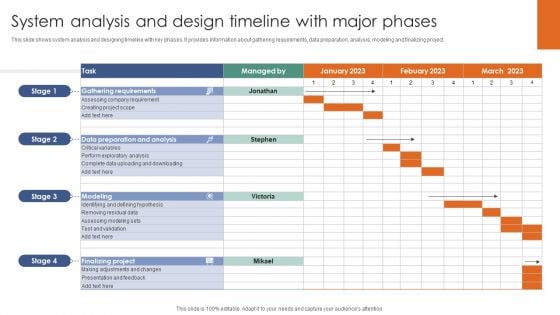
System Analysis And Design Timeline With Major Phases Ppt Pictures Slide Portrait PDF
This slide shows system analysis and designing timeline with key phases. It provides information about gathering requirements, data preparation, analysis, modeling and finalizing project. Showcasing this set of slides titled System Analysis And Design Timeline With Major Phases Ppt Pictures Slide Portrait PDF. The topics addressed in these templates are Modeling, Finalizing Project, Gathering Requirements. All the content presented in this PPT design is completely editable. Download it and make adjustments in color, background, font etc. as per your unique business setting.
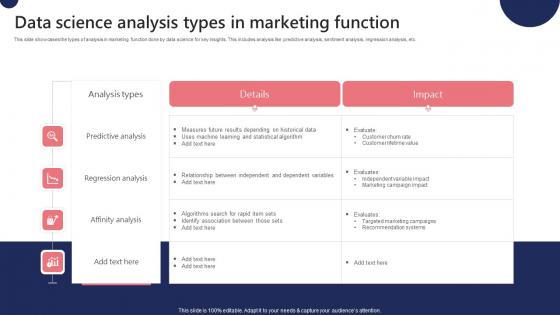
Data Science Analysis Types In Marketing Function Ppt Ideas Designs Download Pdf
This slide showcases the types of analysis in marketing function done by data science for key insights. This includes analysis like predictive analysis, sentiment analysis, regression analysis, etc. Pitch your topic with ease and precision using this Data Science Analysis Types In Marketing Function Ppt Ideas Designs Download Pdf. This layout presents information on Predictive Analysis, Sentiment Analysis, Regression Analysis. It is also available for immediate download and adjustment. So, changes can be made in the color, design, graphics or any other component to create a unique layout. This slide showcases the types of analysis in marketing function done by data science for key insights. This includes analysis like predictive analysis, sentiment analysis, regression analysis, etc.
Calculate Facebook Key Performance Indicator The Engagement Rate Background PDF
Persuade your audience using this calculate facebook key performance indicator the engagement rate background pdf. This PPT design covers four stages, thus making it a great tool to use. It also caters to a variety of topics including calculate facebook key performance indicator the engagement rate. Download this PPT design now to present a convincing pitch that not only emphasizes the topic but also showcases your presentation skills.
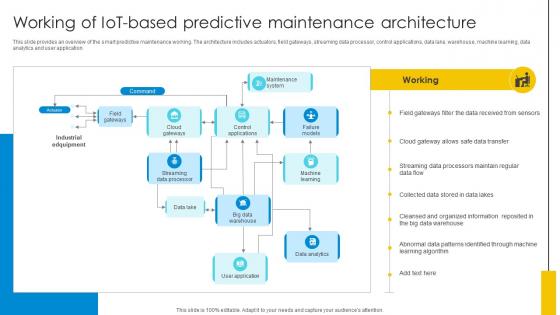
Working Of IoT Based Predictive Maintenance Architecture Optimizing Inventory Management IoT SS V
This slide provides an overview of the smart predictive maintenance working. The architecture includes actuators, field gateways, streaming data processor, control applications, data lake, warehouse, machine learning, data analytics and user application. There are so many reasons you need a Working Of IoT Based Predictive Maintenance Architecture Optimizing Inventory Management IoT SS V. The first reason is you can not spend time making everything from scratch, Thus, Slidegeeks has made presentation templates for you too. You can easily download these templates from our website easily. This slide provides an overview of the smart predictive maintenance working. The architecture includes actuators, field gateways, streaming data processor, control applications, data lake, warehouse, machine learning, data analytics and user application.
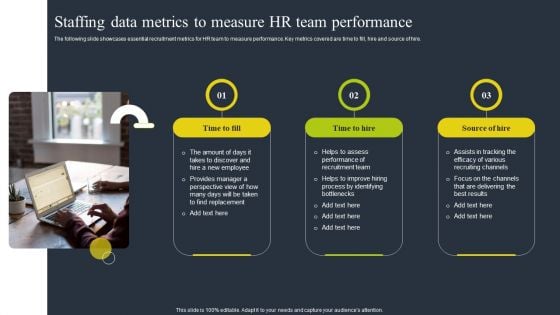
Staffing Data Metrics To Measure HR Team Performance Graphics PDF
The following slide showcases essential recruitment metrics for HR team to measure performance. Key metrics covered are time to fill, hire and source of hire. Presenting Staffing Data Metrics To Measure HR Team Performance Graphics PDF to dispense important information. This template comprises three stages. It also presents valuable insights into the topics including Employee, Recruitment Team, Recruiting Channels. This is a completely customizable PowerPoint theme that can be put to use immediately. So, download it and address the topic impactfully.

Data Analysis Types Provides By BI Mockup Pdf
This slide represents the type of analytics provided by the business intelligence for business performance enhancement. This includes descriptive analysis, diagnostic analysis, predictive analytics, etc. Pitch your topic with ease and precision using this Data Analysis Types Provides By BI Mockup Pdf. This layout presents information on Descriptive Analytics, Diagnostic Analytics, Predictive Analytics. It is also available for immediate download and adjustment. So, changes can be made in the color, design, graphics or any other component to create a unique layout. This slide represents the type of analytics provided by the business intelligence for business performance enhancement. This includes descriptive analysis, diagnostic analysis, predictive analytics, etc.
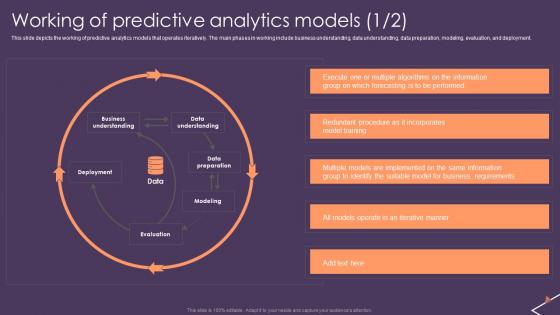
Working Of Predictive Analytics Models Predictive Analytics For Empowering Graphics Pdf
This slide depicts the working of predictive analytics models that operates iteratively. The main phases in working include business understanding, data understanding, data preparation, modeling, evaluation, and deployment. This Working Of Predictive Analytics Models Predictive Analytics For Empowering Graphics Pdf from Slidegeeks makes it easy to present information on your topic with precision. It provides customization options, so you can make changes to the colors, design, graphics, or any other component to create a unique layout. It is also available for immediate download, so you can begin using it right away. Slidegeeks has done good research to ensure that you have everything you need to make your presentation stand out. Make a name out there for a brilliant performance. This slide depicts the working of predictive analytics models that operates iteratively. The main phases in working include business understanding, data understanding, data preparation, modeling, evaluation, and deployment.
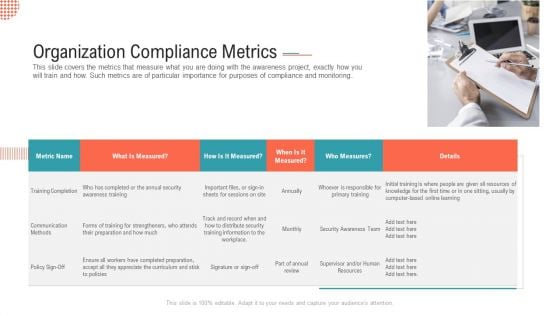
Organization Compliance Metrics Pictures PDF
This slide covers the metrics that measure what you are doing with the awareness project, exactly how you will train and how. Such metrics are of particular importance for purposes of compliance and monitoring.Presenting organization compliance metrics pictures pdf. to provide visual cues and insights. Share and navigate important information on one stage that need your due attention. This template can be used to pitch topics like training completion, communication methods. In addtion, this PPT design contains high resolution images, graphics, etc, that are easily editable and available for immediate download.
Success Metrics For Data Analytics Speculation Business Analysis Modification Toolkit Icons PDF
This slide shows the key success factors for evaluating the success of data analytics program. The foremost key metrics includes discovery, insights, outcomes and actions.Presenting Success Metrics For Data Analytics Speculation Business Analysis Modification Toolkit Icons PDF to provide visual cues and insights. Share and navigate important information on four stages that need your due attention. This template can be used to pitch topics like Observations Information, Generate Insights, Keys Success. In addtion, this PPT design contains high resolution images, graphics, etc, that are easily editable and available for immediate download.

Customer Behavioral Data And Analytics Email Engagement Metrics Mockup PDF
This is a customer behavioral data and analytics email engagement metrics mockup pdf template with various stages. Focus and dispense information on four stages using this creative set, that comes with editable features. It contains large content boxes to add your information on topics like email engagement metrics. You can also showcase facts, figures, and other relevant content using this PPT layout. Grab it now.
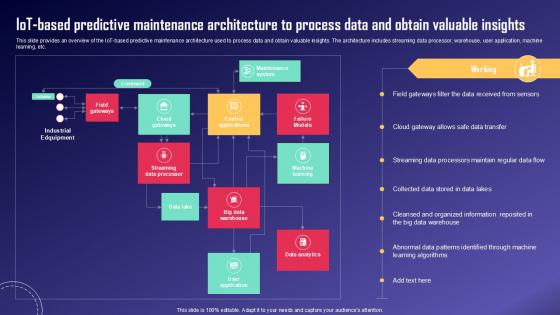
IoT Based Predictive Maintenance IoT Fleet Monitoring Ppt Template IoT SS V
This slide provides an overview of the IoT-based predictive maintenance architecture used to process data and obtain valuable insights. The architecture includes streaming data processor, warehouse, user application, machine learning, etc. The IoT Based Predictive Maintenance IoT Fleet Monitoring Ppt Template IoT SS V is a compilation of the most recent design trends as a series of slides. It is suitable for any subject or industry presentation, containing attractive visuals and photo spots for businesses to clearly express their messages. This template contains a variety of slides for the user to input data, such as structures to contrast two elements, bullet points, and slides for written information. Slidegeeks is prepared to create an impression. This slide provides an overview of the IoT-based predictive maintenance architecture used to process data and obtain valuable insights. The architecture includes streaming data processor, warehouse, user application, machine learning, etc.
Quantitative Data Analysis Icon For Predictive Modelling Ppt Ideas Images PDF
Presenting Quantitative Data Analysis Icon For Predictive Modelling Ppt Ideas Images PDF to dispense important information. This template comprises one stages. It also presents valuable insights into the topics including Quantitative Data, Analysis Icon, Predictive Modelling. This is a completely customizable PowerPoint theme that can be put to use immediately. So, download it and address the topic impactfully.
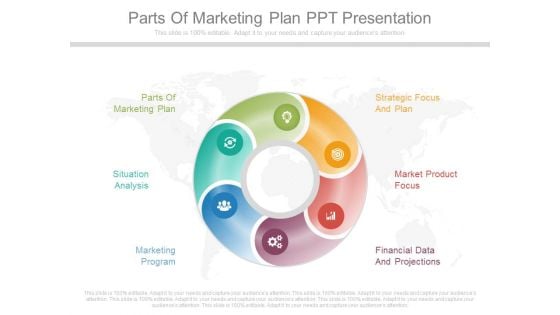
Parts Of Marketing Plan Ppt Presentation
This is a parts of marketing plan ppt presentation. This is a six stage process. The stages in this process are parts of marketing plan, strategic focus and plan, situation analysis, market product focus, marketing program, financial data and projections.
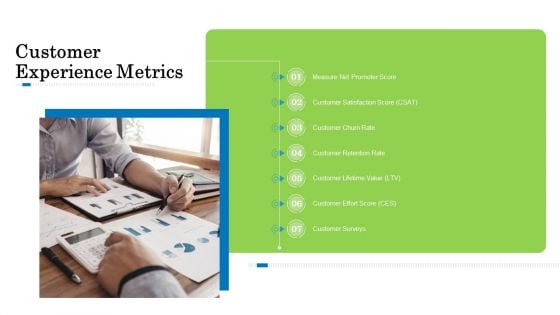
Customer Behavioral Data And Analytics Customer Experience Metrics Topics PDF
Presenting customer behavioral data and analytics customer experience metrics topics pdf to provide visual cues and insights. Share and navigate important information on seven stages that need your due attention. This template can be used to pitch topics like measure net promoter score, customer satisfaction score, customer churn rate, customer retention rate, customer lifetime value. In addtion, this PPT design contains high resolution images, graphics, etc, that are easily editable and available for immediate download.
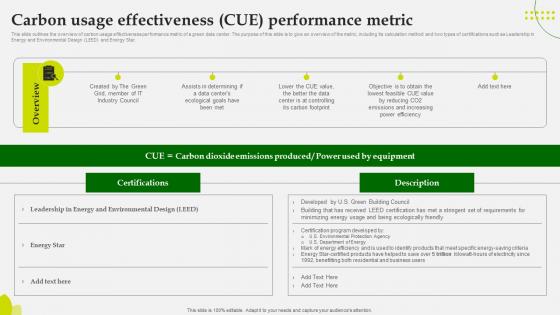
Green Computing Carbon Usage Effectiveness Cue Performance Metric
This slide outlines the overview of carbon usage effectiveness performance matric of a green data center. The purpose of this slide is to give an overview of the metric, including its calculation method and two types of certifications such as Leadership in Energy and Environmental Design LEED and Energy Star. Create an editable Green Computing Carbon Usage Effectiveness Cue Performance Metric that communicates your idea and engages your audience. Whether you are presenting a business or an educational presentation, pre-designed presentation templates help save time. Green Computing Carbon Usage Effectiveness Cue Performance Metric is highly customizable and very easy to edit, covering many different styles from creative to business presentations. Slidegeeks has creative team members who have crafted amazing templates. So, go and get them without any delay. This slide outlines the overview of carbon usage effectiveness performance matric of a green data center. The purpose of this slide is to give an overview of the metric, including its calculation method and two types of certifications such as Leadership in Energy and Environmental Design LEED and Energy Star.
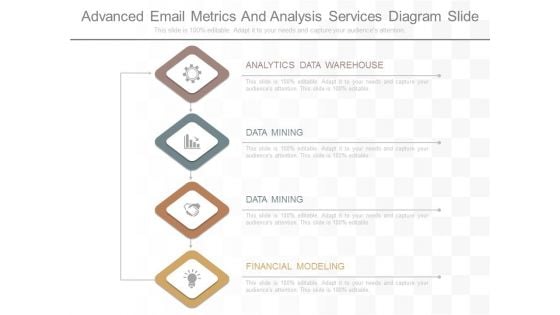
Advanced Email Metrics And Analysis Services Diagram Slide
This is a advanced email metrics and analysis services diagram slide. This is a four stage process. The stages in this process are analytics data warehouse, data mining, financial modeling.

Business Financial Metrics Data Analysis Ppt PowerPoint Presentation Complete Deck With Slides
Improve your presentation delivery using this business financial metrics data analysis ppt powerpoint presentation complete deck with slides. Support your business vision and objectives using this well-structured PPT deck. This template offers a great starting point for delivering beautifully designed presentations on the topic of your choice. Comprising twenty nine this professionally designed template is all you need to host discussion and meetings with collaborators. Each slide is self-explanatory and equipped with high-quality graphics that can be adjusted to your needs. Therefore, you will face no difficulty in portraying your desired content using this PPT slideshow. This PowerPoint slideshow contains every important element that you need for a great pitch. It is not only editable but also available for immediate download and utilization. The color, font size, background, shapes everything can be modified to create your unique presentation layout. Therefore, download it now.
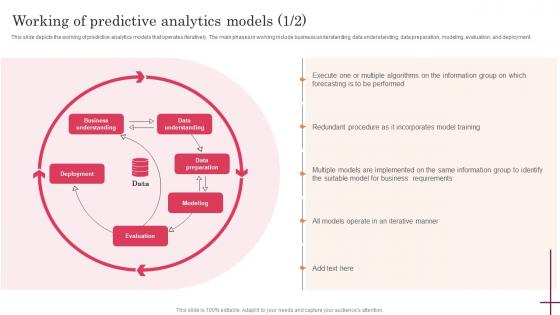
Predictive Analytics For Improved Working Of Predictive Analytics Models Template Pdf
This slide depicts the working of predictive analytics models that operates iteratively. The main phases in working include business understanding, data understanding, data preparation, modeling, evaluation, and deployment. If you are looking for a format to display your unique thoughts, then the professionally designed Predictive Analytics For Improved Working Of Predictive Analytics Models Template Pdf is the one for you. You can use it as a Google Slides template or a PowerPoint template. Incorporate impressive visuals, symbols, images, and other charts. Modify or reorganize the text boxes as you desire. Experiment with shade schemes and font pairings. Alter, share or cooperate with other people on your work. Download Working Of Predictive Analytics Models Predictive Analytics For Improved Template Pdf and find out how to give a successful presentation. Present a perfect display to your team and make your presentation unforgettable. This slide depicts the working of predictive analytics models that operates iteratively. The main phases in working include business understanding, data understanding, data preparation, modeling, evaluation, and deployment.
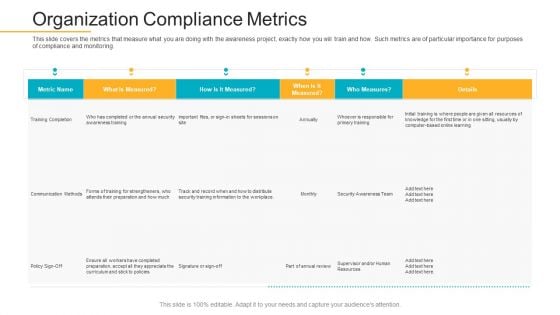
Data Breach Prevention Recognition Organization Compliance Metrics Themes PDF
This slide covers the metrics that measure what you are doing with the awareness project, exactly how you will train and how. Such metrics are of particular importance for purposes of compliance and monitoring. Deliver an awe-inspiring pitch with this creative data breach prevention recognition organization compliance metrics themes pdf bundle. Topics like organization compliance metrics can be discussed with this completely editable template. It is available for immediate download depending on the needs and requirements of the user.
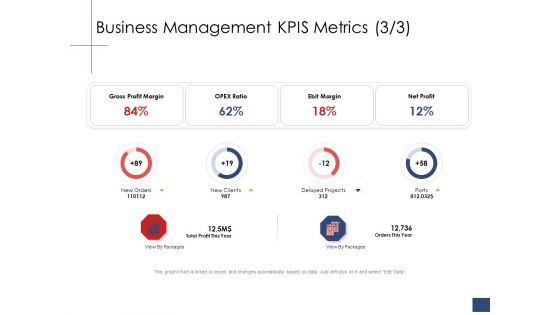
Business Assessment Outline Business Management KPIS Metrics Ratio Ppt Model Layout Ideas PDF
Deliver and pitch your topic in the best possible manner with this business assessment outline business management kpis metrics ratio ppt model layout ideas pdf. Use them to share invaluable insights on gross profit margin, opex ratio, ebit margin, net profit, new orders, delayed projects, new clients and impress your audience. This template can be altered and modified as per your expectations. So, grab it now.
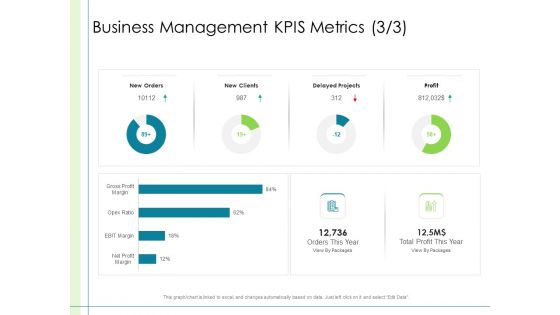
In Depth Business Assessment Business Management Kpis Metrics Profit Ppt PowerPoint Presentation Show Layouts PDF
Deliver and pitch your topic in the best possible manner with this in depth business assessment business management kpis metrics profit ppt powerpoint presentation show layouts pdf. Use them to share invaluable insights on gross profit margin, opex ratio, ebit margin, net profit, new orders, delayed projects, new clients and impress your audience. This template can be altered and modified as per your expectations. So, grab it now.
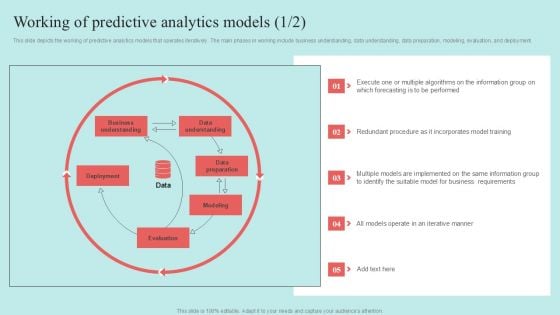
Predictive Data Model Working Of Predictive Analytics Models Pictures PDF
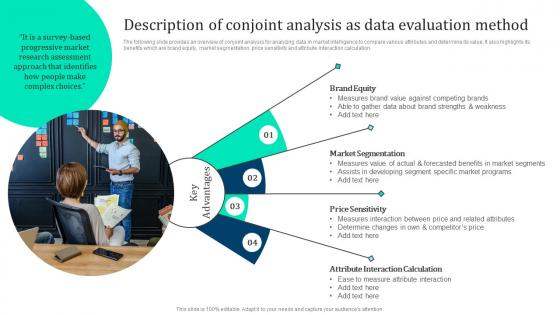
Description Conjoint Analysis Data Marketing Intelligence Guide Data Gathering Microsoft Pdf
The following slide provides an overview of conjoint analysis for analyzing data in market intelligence to compare various attributes and determine its value. It also highlights its benefits which are brand equity, market segmentation, price sensitivity and attribute interaction calculation. Do you have an important presentation coming up Are you looking for something that will make your presentation stand out from the rest Look no further than Description Conjoint Analysis Data Marketing Intelligence Guide Data Gathering Microsoft Pdf. With our professional designs, you can trust that your presentation will pop and make delivering it a smooth process. And with Slidegeeks, you can trust that your presentation will be unique and memorable. So why wait Grab Description Conjoint Analysis Data Marketing Intelligence Guide Data Gathering Microsoft Pdf today and make your presentation stand out from the rest The following slide provides an overview of conjoint analysis for analyzing data in market intelligence to compare various attributes and determine its value. It also highlights its benefits which are brand equity, market segmentation, price sensitivity and attribute interaction calculation.

ROI Calculation Ppt PowerPoint Presentation Complete Deck With Slides
This is a roi calculation ppt powerpoint presentation complete deck with slides. This is a one stage process. The stages in this process are business, planning, strategy, marketing, management.
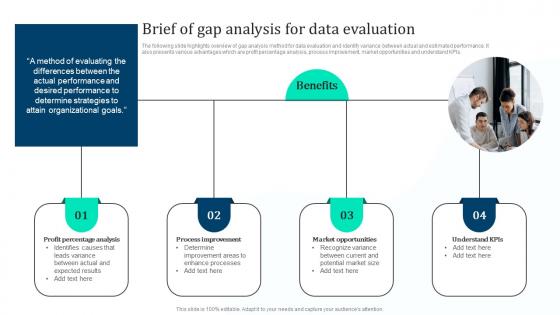
Brief Of Gap Analysis Data Marketing Intelligence Guide Data Gathering Clipart Pdf
The following slide highlights overview of gap analysis method for data evaluation and identify variance between actual and estimated performance. It also presents various advantages which are profit percentage analysis, process improvement, market opportunities and understand KPIs. Slidegeeks is one of the best resources for PowerPoint templates. You can download easily and regulate Brief Of Gap Analysis Data Marketing Intelligence Guide Data Gathering Clipart Pdf for your personal presentations from our wonderful collection. A few clicks is all it takes to discover and get the most relevant and appropriate templates. Use our Templates to add a unique zing and appeal to your presentation and meetings. All the slides are easy to edit and you can use them even for advertisement purposes. The following slide highlights overview of gap analysis method for data evaluation and identify variance between actual and estimated performance. It also presents various advantages which are profit percentage analysis, process improvement, market opportunities and understand KPIs.
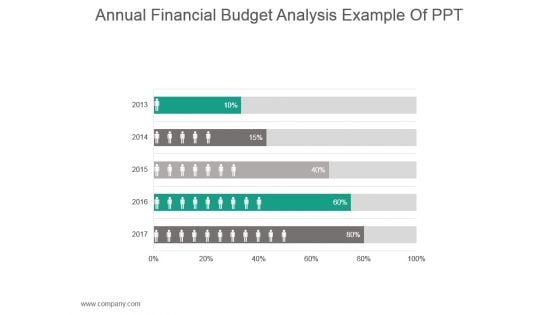
Annual Financial Budget Analysis Example Of Ppt
This is a annual financial budget analysis example of ppt. This is a five stage process. The stages in this process are business, strategy, finance, planning, compare.
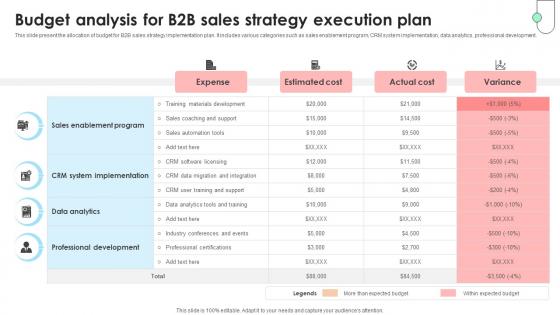
Navigating B2B Sales Budget Analysis For B2B Sales Strategy Execution Plan SA SS V
This slide present the allocation of budget for B2B sales strategy implementation plan. It includes various categories such as sales enablement program, CRM system implementation, data analytics, professional development. If you are looking for a format to display your unique thoughts, then the professionally designed Navigating B2B Sales Budget Analysis For B2B Sales Strategy Execution Plan SA SS V is the one for you. You can use it as a Google Slides template or a PowerPoint template. Incorporate impressive visuals, symbols, images, and other charts. Modify or reorganize the text boxes as you desire. Experiment with shade schemes and font pairings. Alter, share or cooperate with other people on your work. Download Navigating B2B Sales Budget Analysis For B2B Sales Strategy Execution Plan SA SS V and find out how to give a successful presentation. Present a perfect display to your team and make your presentation unforgettable. This slide present the allocation of budget for B2B sales strategy implementation plan. It includes various categories such as sales enablement program, CRM system implementation, data analytics, professional development.


 Continue with Email

 Home
Home


