Rating Meter

Construction Management Services Infrastructure KPI Metrics Showing Square Meter Area Designs PDF
Presenting construction management services infrastructure kpi metrics showing square meter area designs pdf to provide visual cues and insights. Share and navigate important information on three stages that need your due attention. This template can be used to pitch topics like square meter price, actual construction time, activities. In addition, this PPT design contains high-resolution images, graphics, etc, that are easily editable and available for immediate download.
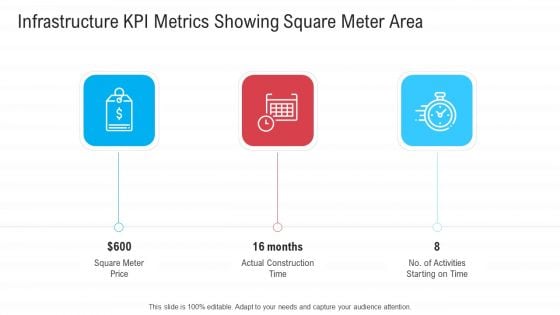
Infrastructure Designing And Administration Infrastructure KPI Metrics Showing Square Meter Area Guidelines PDF
Presenting infrastructure designing and administration infrastructure kpi metrics showing square meter area guidelines pdf to provide visual cues and insights. Share and navigate important information on three stages that need your due attention. This template can be used to pitch topics like square meter price, actual construction time, no of activities starting on time. In addtion, this PPT design contains high resolution images, graphics, etc, that are easily editable and available for immediate download.
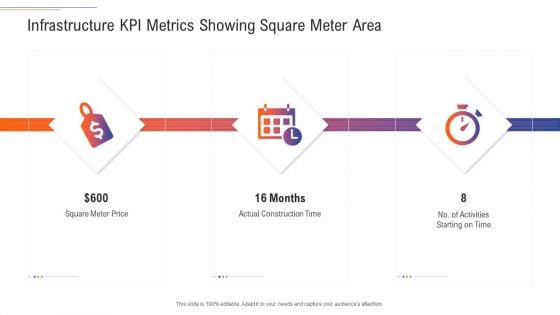
Support Services Management Infrastructure KPI Metrics Showing Square Meter Area Ideas PDF
Presenting support services management infrastructure kpi metrics showing square meter area ideas pdf to provide visual cues and insights. Share and navigate important information on three stages that need your due attention. This template can be used to pitch topics like square meter price, actual construction time, no of activities starting on time. In addtion, this PPT design contains high resolution images, graphics, etc, that are easily editable and available for immediate download.
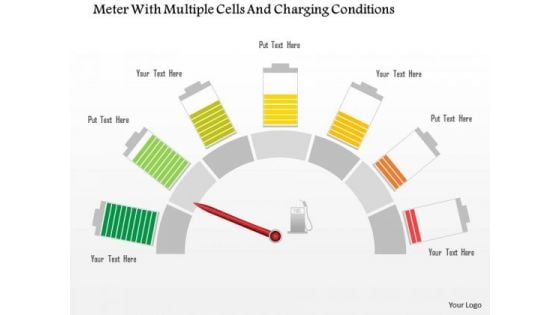
Business Diagram Meter With Multiple Cells And Charging Conditions Presentation Template
This Power Point template slide has been designed with graphic of meter and multiple cells. This PPT slide contains the concept of power consumption and charging. Use this PPT in your presentation and build an innovative presentation for power related topics.

Picture Of Old Vintage Meter Ppt PowerPoint Presentation Infographic Template Sample
Presenting this set of slides with name picture of old vintage meter ppt powerpoint presentation infographic template sample. This is a one stage process. The stages in this process are weighing scale, measure, weighing machine. This is a completely editable PowerPoint presentation and is available for immediate download. Download now and impress your audience.
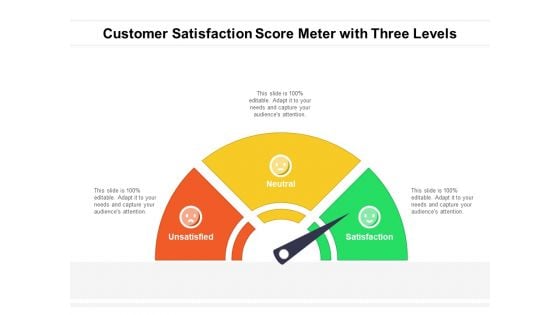
Customer Satisfaction Score Meter With Three Levels Ppt PowerPoint Presentation Gallery Smartart PDF
Presenting customer satisfaction score meter with three levels ppt powerpoint presentation gallery smartart pdf to dispense important information. This template comprises three stages. It also presents valuable insights into the topics including unsatisfied, neutral, satisfaction. This is a completely customizable PowerPoint theme that can be put to use immediately. So, download it and address the topic impactfully.
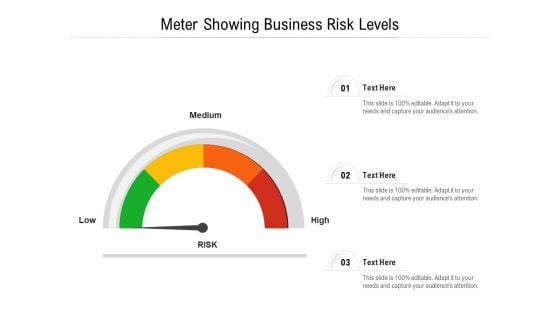
Meter Showing Business Risk Levels Ppt PowerPoint Presentation Show Slide PDF
Persuade your audience using this meter showing business risk levels ppt powerpoint presentation show slide pdf. This PPT design covers three stages, thus making it a great tool to use. It also caters to a variety of topics including low, medium, high. Download this PPT design now to present a convincing pitch that not only emphasizes the topic but also showcases your presentation skills.
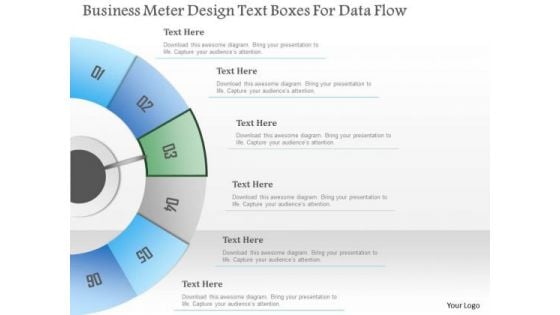
Busines Diagram Business Meter Design Text Boxes For Data Flow Presentation Template
Concept of data flow can be well defined with this exclusive business diagram. This slide contains the diagram of six steps in semi-circle. Use this professional diagram to impress your viewers.
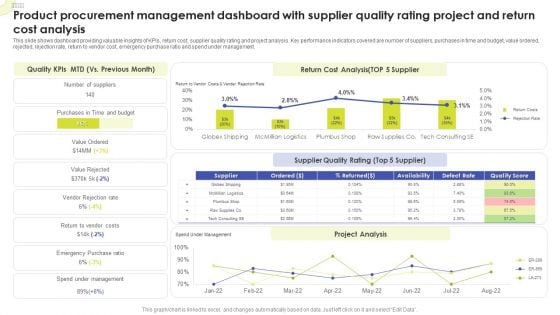
Product Procurement Management Dashboard With Supplier Quality Rating Project And Return Cost Analysis Sample PDF
This slide shows dashboard providing valuable insights of KPIs, return cost, supplier quality rating and project analysis. Key performance indicators covered are number of suppliers, purchases in time and budget, value ordered, rejected, rejection rate, return to vendor cost, emergency purchase ratio and spend under management. Pitch your topic with ease and precision using this Product Procurement Management Dashboard With Supplier Quality Rating Project And Return Cost Analysis Sample PDF. This layout presents information on Quality KPIs, Return Cost Analysis, Supplier Quality Rating. It is also available for immediate download and adjustment. So, changes can be made in the color, design, graphics or any other component to create a unique layout.
Customer NPS Metric Image Indicating Customer Giving Experience Rating On Device Icons PDF
Presenting Customer NPS Metric Image Indicating Customer Giving Experience Rating On Device Icons PDF to dispense important information. This template comprises five stages. It also presents valuable insights into the topics including Customers Retention, Enhance Customer Experience, Business Assessment. This is a completely customizable PowerPoint theme that can be put to use immediately. So, download it and address the topic impactfully.
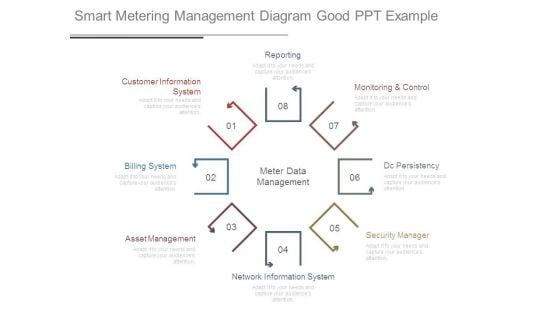
Smart Metering Management Diagram Good Ppt Example
This is a smart metering management diagram good ppt example. This is a eight stage process. The stages in this process are reporting, customer information system, billing system, asset management, network information system, security manager, dc persistency, monitoring and control, meter data management.
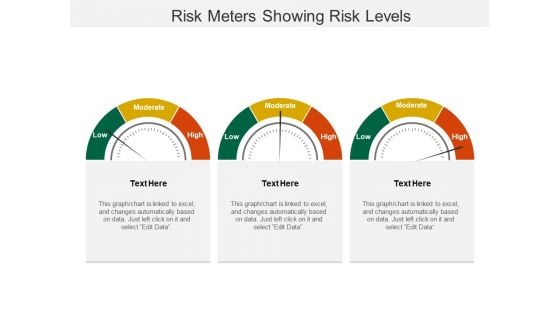
Risk Meters Showing Risk Levels Ppt PowerPoint Presentation Summary Example
This is a risk meters showing risk levels ppt powerpoint presentation summary example. This is a three stage process. The stages in this process are risk meter, risk speedometer, hazard meter.
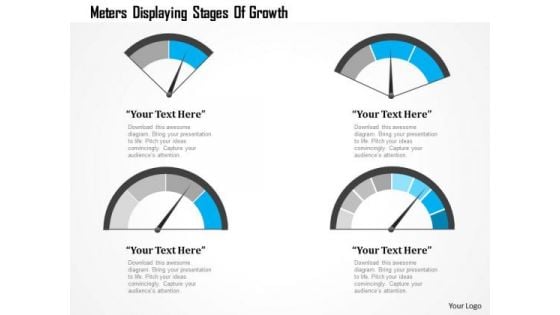
Business Diagram Meters Displaying Stages Of Growth Presentation Template
Graphic of four different meters has been used to craft this power point template. This PPT contains the concept of speed calculation. Use this PPT for your technology and mechanical topics in any presentations.

Business Diagram Three Meters For Speed Control Presentation Template
Graphic of three speedometers has been used to design this power point template. This diagram contains the concept of speed control. Amplify your thoughts via this appropriate business template.
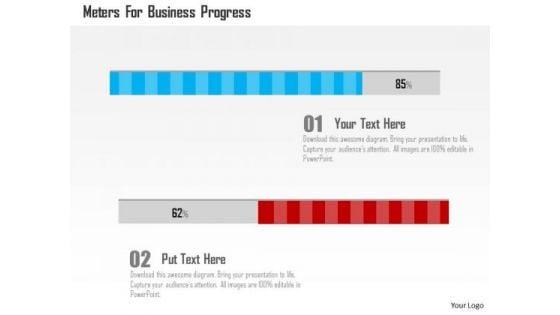
Business Diagram Meters For Business Progress Presentation Template
This business slide contains graphics of meter. You may use this slide to depict business progress. Download our above diagram to express information in a visual way.
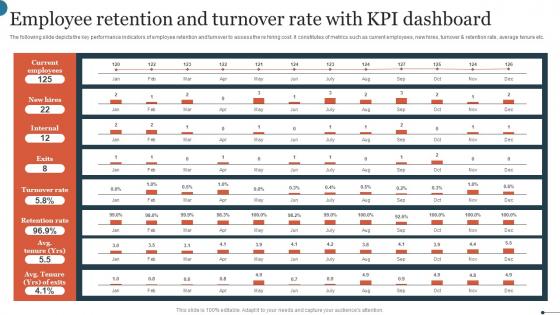
Employee Retention And Turnover Rate With KPI Dashboard Graphics Pdf
The following slide depicts the key performance indicators of employee retention and turnover to assess the re hiring cost. It constitutes of metrics such as current employees, new hires, turnover and retention rate, average tenure etc. Showcasing this set of slides titled Employee Retention And Turnover Rate With KPI Dashboard Graphics Pdf. The topics addressed in these templates are Current Employees, Turnover Rate, Retention Rate. All the content presented in this PPT design is completely editable. Download it and make adjustments in color, background, font etc. as per your unique business setting. The following slide depicts the key performance indicators of employee retention and turnover to assess the re hiring cost. It constitutes of metrics such as current employees, new hires, turnover and retention rate, average tenure etc.
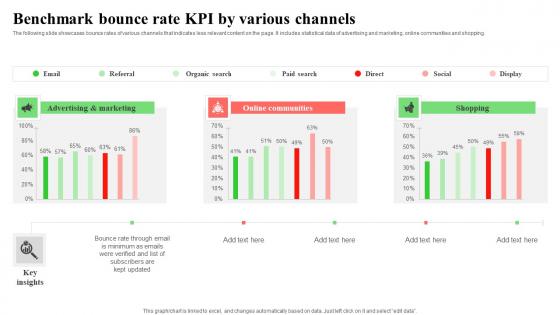
Benchmark Bounce Rate KPI By Various Channels Infographics Pdf
The following slide showcases bounce rates of various channels that indicates less relevant content on the page. It includes statistical data of advertising and marketing, online communities and shopping. Pitch your topic with ease and precision using this Benchmark Bounce Rate KPI By Various Channels Infographics Pdf. This layout presents information on Advertising,Marketing, Online Communities. It is also available for immediate download and adjustment. So, changes can be made in the color, design, graphics or any other component to create a unique layout. The following slide showcases bounce rates of various channels that indicates less relevant content on the page. It includes statistical data of advertising and marketing, online communities and shopping.
Dashboard For Tracking Employee Satisfaction Rate Detailed Personnel Slides Pdf
This slide covers KPI dashboard to measure employee satisfaction due to effective internal communication. It includes indicators such as net promoter score, retention rate, absenteeism etc. This Dashboard For Tracking Employee Satisfaction Rate Detailed Personnel Slides Pdf is perfect for any presentation, be it in front of clients or colleagues. It is a versatile and stylish solution for organizing your meetings. The Dashboard For Tracking Employee Satisfaction Rate Detailed Personnel Slides Pdf features a modern design for your presentation meetings. The adjustable and customizable slides provide unlimited possibilities for acing up your presentation. Slidegeeks has done all the homework before launching the product for you. So, do not wait, grab the presentation templates today This slide covers KPI dashboard to measure employee satisfaction due to effective internal communication. It includes indicators such as net promoter score, retention rate, absenteeism etc.
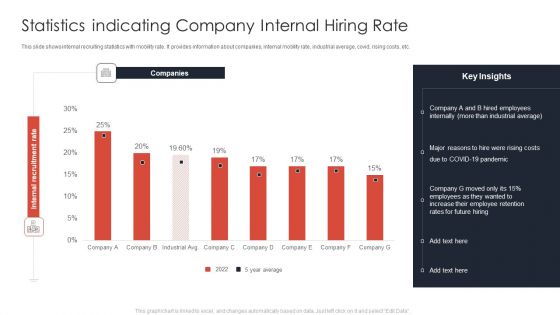
Statistics Indicating Company Internal Hiring Rate Ppt Ideas Templates PDF
This slide shows internal recruiting statistics with mobility rate. It provides information about companies, internal mobility rate, industrial average, covid, rising costs, etc. Showcasing this set of slides titled Statistics Indicating Company Internal Hiring Rate Ppt Ideas Templates PDF. The topics addressed in these templates are Companies, Employees Internally, COVID 19 Pandemic. All the content presented in this PPT design is completely editable. Download it and make adjustments in color, background, font etc. as per your unique business setting.
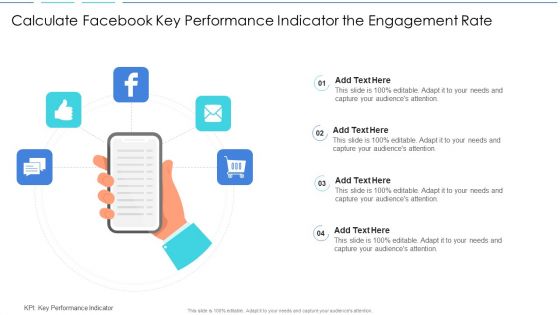
Calculate Facebook Key Performance Indicator The Engagement Rate Background PDF
Persuade your audience using this calculate facebook key performance indicator the engagement rate background pdf. This PPT design covers four stages, thus making it a great tool to use. It also caters to a variety of topics including calculate facebook key performance indicator the engagement rate. Download this PPT design now to present a convincing pitch that not only emphasizes the topic but also showcases your presentation skills.
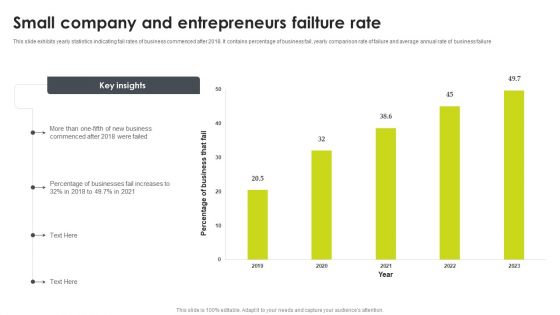
Small Company And Entrepreneurs Failture Rate Summary PDF
This slide exhibits yearly statistics indicating fail rates of business commenced after 2018. It contains percentage of business fail, yearly comparison rate of failure and average annual rate of business failure. Pitch your topic with ease and precision using this Small Company And Entrepreneurs Failture Rate Summary PDF. This layout presents information on Entrepreneurs Failture Rate, Business. It is also available for immediate download and adjustment. So, changes can be made in the color, design, graphics or any other component to create a unique layout.
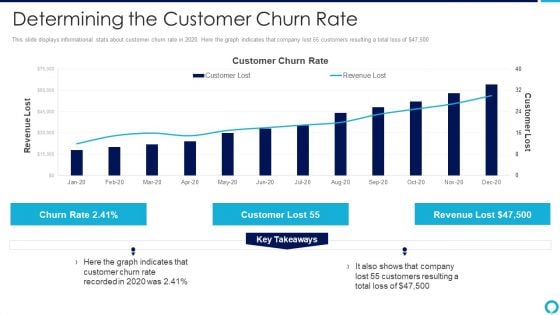
Partnership Management Strategies Determining The Customer Churn Rate Guidelines PDF
This slide displays informational stats about customer churn rate in 2020. Here the graph indicates that company lost 55 customers resulting a total loss of dollar47,500 Deliver and pitch your topic in the best possible manner with this partnership management strategies determining the customer churn rate guidelines pdf Use them to share invaluable insights on determining the customer churn rate and impress your audience. This template can be altered and modified as per your expectations. So, grab it now.
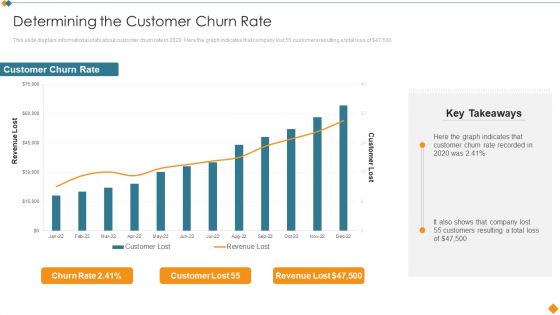
Maintaining Partner Relationships Determining The Customer Churn Rate Portrait PDF
This slide displays informational stats about customer churn rate in 2020. Here the graph indicates that company lost 55 customers resulting a total loss of dollar 47,500. Deliver and pitch your topic in the best possible manner with this Maintaining Partner Relationships Determining The Customer Churn Rate Portrait PDF. Use them to share invaluable insights on Customer Churn Rate, Revenue Lost and impress your audience. This template can be altered and modified as per your expectations. So, grab it now.
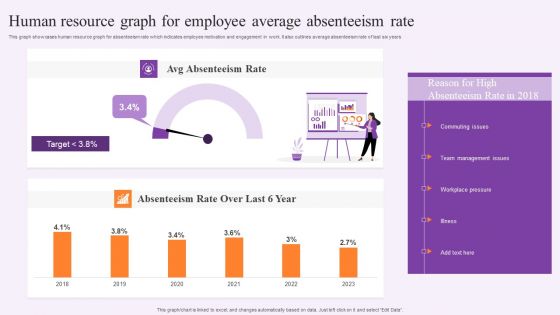
Human Resource Graph For Employee Average Absenteeism Rate Information PDF
This graph showcases human resource graph for absenteeism rate which indicates employee motivation and engagement in work. It also outlines average absenteeism rate of last six years. Showcasing this set of slides titled Human Resource Graph For Employee Average Absenteeism Rate Information PDF. The topics addressed in these templates are Team Management Issues, Workplace Pressure, Absenteeism Rate. All the content presented in this PPT design is completely editable. Download it and make adjustments in color, background, font etc. as per your unique business setting.
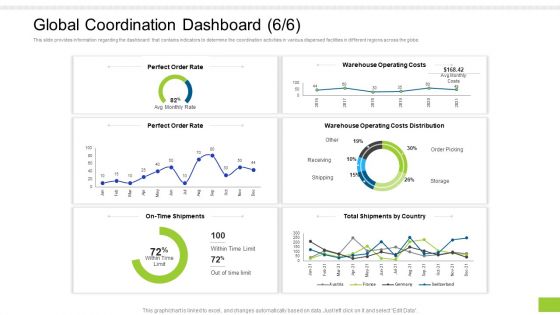
Enterprise Collaboration Global Scale Global Coordination Dashboard Rate Professional PDF
This slide provides information regarding the dashboard that contains indicators to determine the coordination activities in various dispersed facilities in different regions across the globe. Deliver and pitch your topic in the best possible manner with this enterprise collaboration global scale global coordination dashboard rate professional pdf. Use them to share invaluable insights on perfect order rate, warehouse operating costs, operating costs distribution and impress your audience. This template can be altered and modified as per your expectations. So, grab it now.
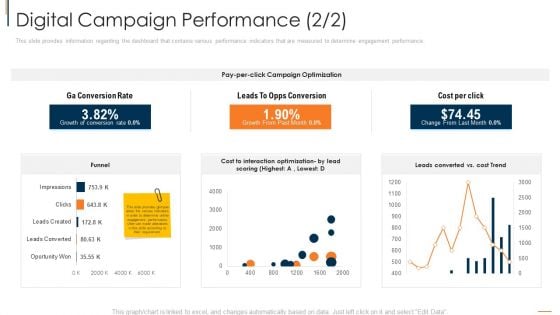
Online Consumer Engagement Digital Campaign Performance Rate Guidelines PDF
This slide provides information regarding the dashboard that contains various performance indicators that are measured to determine engagement performance. Deliver and pitch your topic in the best possible manner with this online consumer engagement digital campaign performance rate guidelines pdf. Use them to share invaluable insights on optimization, cost, rate and impress your audience. This template can be altered and modified as per your expectations. So, grab it now.
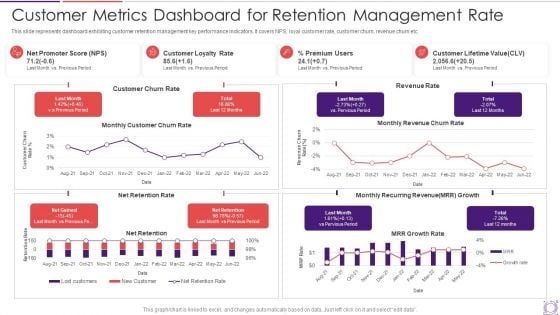
Customer Metrics Dashboard For Retention Management Rate Information PDF
This slide represents dashboard exhibiting customer retention management key performance indicators. It covers NPS, loyal customer rate, customer churn, revenue churn etc. Showcasing this set of slides titled customer metrics dashboard for retention management rate information pdf. The topics addressed in these templates are customer, premium users. All the content presented in this PPT design is completely editable. Download it and make adjustments in color, background, font etc. as per your unique business setting.
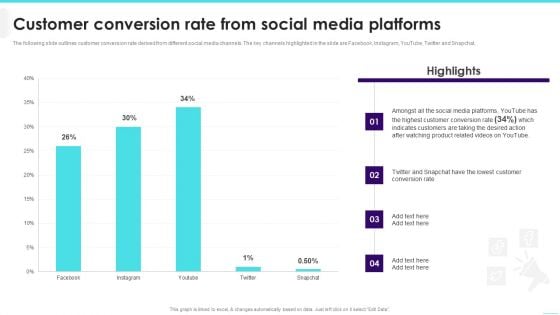
Customer Conversion Rate From Social Media Platforms Topics PDF
The following slide outlines customer conversion rate derived from different social media channels. The key channels highlighted in the slide are Facebook, Instagram, YouTube, Twitter and Snapchat. Deliver an awe inspiring pitch with this creative Customer Conversion Rate From Social Media Platforms Topics PDF bundle. Topics like Customer Conversion, Indicates Customers, Lowest Customer can be discussed with this completely editable template. It is available for immediate download depending on the needs and requirements of the user.
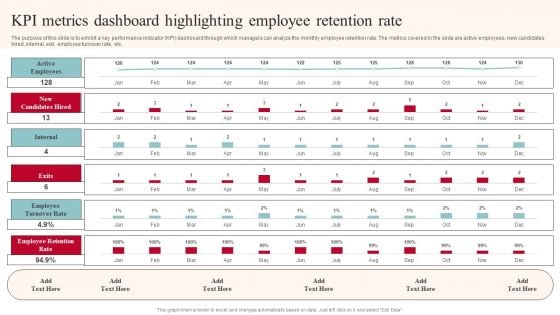
KPI Metrics Dashboard Highlighting Employee Retention Rate Structure PDF
The purpose of this slide is to exhibit a key performance indicator KPI dashboard through which managers can analyze the monthly employee retention rate. The metrics covered in the slide are active employees, new candidates hired, internal, exit, employee turnover rate, etc. Do you have to make sure that everyone on your team knows about any specific topic I yes, then you should give KPI Metrics Dashboard Highlighting Employee Retention Rate Structure PDF a try. Our experts have put a lot of knowledge and effort into creating this impeccable KPI Metrics Dashboard Highlighting Employee Retention Rate Structure PDF. You can use this template for your upcoming presentations, as the slides are perfect to represent even the tiniest detail. You can download these templates from the Slidegeeks website and these are easy to edit. So grab these today.

Employee Job Progression Matrix With Progression Rate Infographics PDF
This slide presents employee career matrix that helps to identify competencies and transformation over years, indicating professional development. It includes position, key tasks, skills, levels and progression rate that defines employee potential as beginner, advance and expert. Showcasing this set of slides titled Employee Job Progression Matrix With Progression Rate Infographics PDF. The topics addressed in these templates are Position, Skill, Level. All the content presented in this PPT design is completely editable. Download it and make adjustments in color, background, font etc. as per your unique business setting.
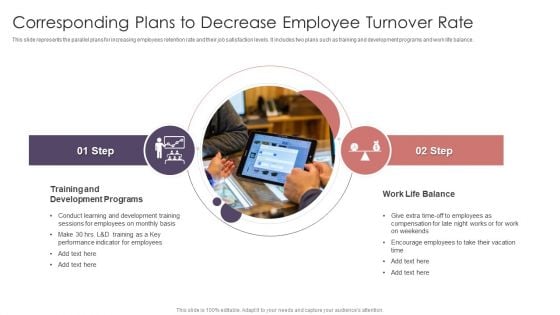
Corresponding Plans To Decrease Employee Turnover Rate Ideas PDF
This slide represents the parallel plans for increasing employees retention rate and their job satisfaction levels. It includes two plans such as training and development programs and work life balance. Persuade your audience using this Corresponding Plans To Decrease Employee Turnover Rate Ideas PDF. This PPT design covers two stages, thus making it a great tool to use. It also caters to a variety of topics including Development Programs, Encourage Employees, Performance Indicator. Download this PPT design now to present a convincing pitch that not only emphasizes the topic but also showcases your presentation skills.
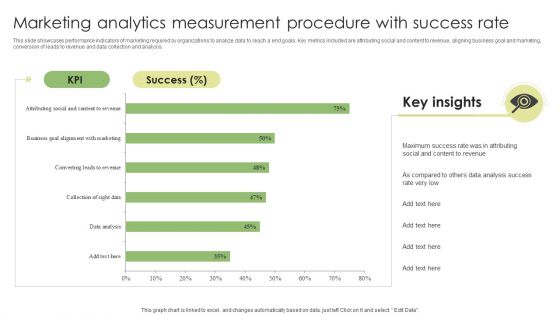
Marketing Analytics Measurement Procedure With Success Rate Guidelines PDF
This slide showcases performance indicators of marketing required by organizations to analyze data to reach a end goals. Key metrics included are attributing social and content to revenue, aligning business goal and marketing, conversion of leads to revenue and data collection and analysis. Showcasing this set of slides titled Marketing Analytics Measurement Procedure With Success Rate Guidelines PDF. The topics addressed in these templates areMarketing Analytics Measurement, Procedure With Success Rate. All the content presented in this PPT design is completely editable. Download it and make adjustments in color, background, font etc. as per your unique business setting.
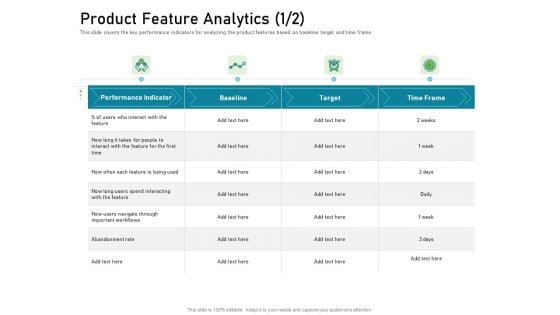
Requirements Governance Plan Product Feature Analytics Rate Microsoft PDF
This slide covers the key performance indicators for analyzing the product features based on baseline target and time frame. Deliver an awe-inspiring pitch with this creative requirements governance plan product feature analytics rate microsoft pdf bundle. Topics like performance indicator, target, time frame can be discussed with this completely editable template. It is available for immediate download depending on the needs and requirements of the user.
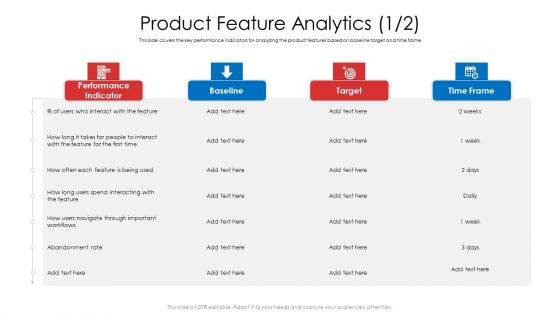
Product Demand Document Product Feature Analytics Rate Formats PDF
This slide covers the key performance indicators for analyzing the product features based on baseline target and time frame. Deliver an awe-inspiring pitch with this creative product demand document product feature analytics rate formats pdf bundle. Topics like performance indicator, baseline, target, time frame can be discussed with this completely editable template. It is available for immediate download depending on the needs and requirements of the user.
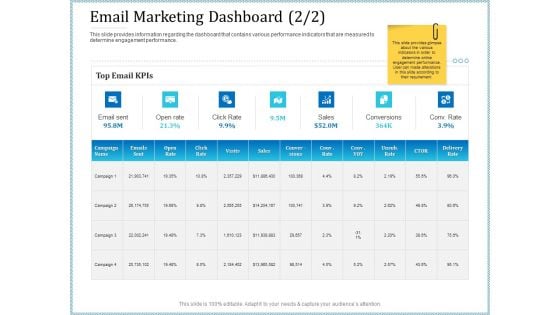
Leveraged Client Engagement Email Marketing Dashboard Rate Rules PDF
This slide provides information regarding the dashboard that contains various performance indicators that are measured to determine engagement performance. Deliver and pitch your topic in the best possible manner with this leveraged client engagement email marketing dashboard rate rules pdf. Use them to share invaluable insights on campaign, sales, conversions and impress your audience. This template can be altered and modified as per your expectations. So, grab it now.
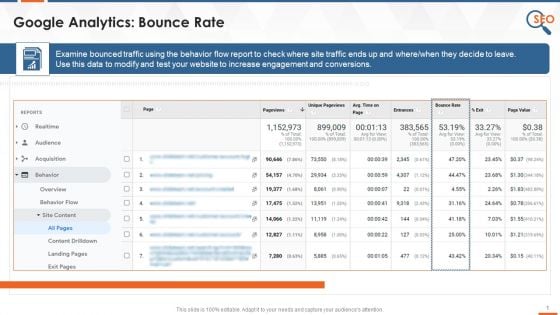
Google Analytics SEO Tool To Monitor Bounce Rate Training Ppt
This slide indicates how the Google Analytics tool is used in SEO to examine the bounced traffic to increase engagement and conversions.
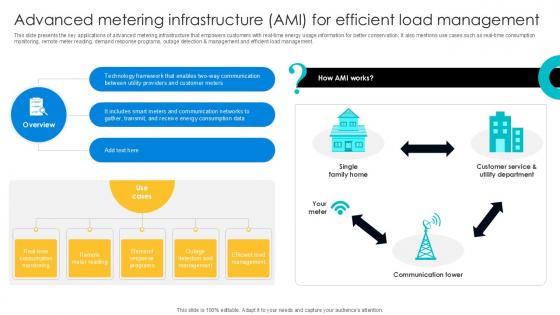
Advanced Metering Infrastructure Digital Transformation Journey PPT Slide DT SS V
This slide presents the key applications of advanced metering infrastructure that empowers customers with real-time energy usage information for better conservation. It also mentions use cases such as real-time consumption monitoring, remote meter reading, demand response programs, outage detection and management and efficient load management. Boost your pitch with our creative Advanced Metering Infrastructure Digital Transformation Journey PPT Slide DT SS V. Deliver an awe-inspiring pitch that will mesmerize everyone. Using these presentation templates you will surely catch everyones attention. You can browse the ppts collection on our website. We have researchers who are experts at creating the right content for the templates. So you do not have to invest time in any additional work. Just grab the template now and use them. This slide presents the key applications of advanced metering infrastructure that empowers customers with real-time energy usage information for better conservation. It also mentions use cases such as real-time consumption monitoring, remote meter reading, demand response programs, outage detection and management and efficient load management.

Empowering The Future Smart Meters Dashboard For Effective Energy IoT SS V
This slide exhibits a dashboard that provides real-time energy specific information from multiple smart meters. It includes elements such as voltage, energy consumption, energy meters, alarms alert, and amperage Welcome to our selection of the Empowering The Future Smart Meters Dashboard For Effective Energy IoT SS V. These are designed to help you showcase your creativity and bring your sphere to life. Planning and Innovation are essential for any business that is just starting out. This collection contains the designs that you need for your everyday presentations. All of our PowerPoints are 100Percent editable, so you can customize them to suit your needs. This multi-purpose template can be used in various situations. Grab these presentation templates today. This slide exhibits a dashboard that provides real-time energy specific information from multiple smart meters. It includes elements such as voltage, energy consumption, energy meters, alarms alert, and amperage
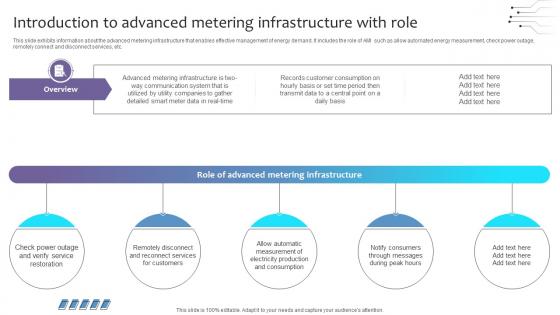
Empowering The Future Introduction To Advanced Metering Infrastructure With Role IoT SS V
This slide exhibits information about the advanced metering infrastructure that enables effective management of energy demand. It includes the role of AMI such as allow automated energy measurement, check power outage, remotely connect and disconnect services, etc. This Empowering The Future Introduction To Advanced Metering Infrastructure With Role IoT SS V is perfect for any presentation, be it in front of clients or colleagues. It is a versatile and stylish solution for organizing your meetings. The Empowering The Future Introduction To Advanced Metering Infrastructure With Role IoT SS V features a modern design for your presentation meetings. The adjustable and customizable slides provide unlimited possibilities for acing up your presentation. Slidegeeks has done all the homework before launching the product for you. So, do not wait, grab the presentation templates today This slide exhibits information about the advanced metering infrastructure that enables effective management of energy demand. It includes the role of AMI such as allow automated energy measurement, check power outage, remotely connect and disconnect services, etc.
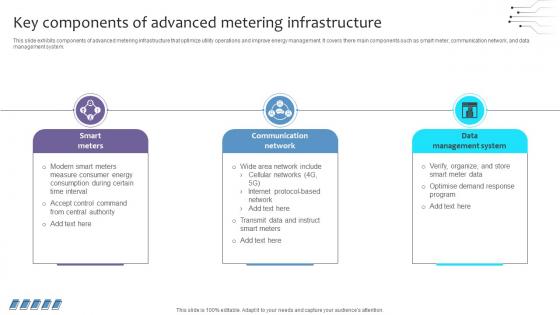
Empowering The Future Key Components Of Advanced Metering Infrastructure IoT SS V
This slide exhibits components of advanced metering infrastructure that optimize utility operations and improve energy management. It covers there main components such as smart meter, communication network, and data management system. Do you have to make sure that everyone on your team knows about any specific topic I yes, then you should give Empowering The Future Key Components Of Advanced Metering Infrastructure IoT SS V a try. Our experts have put a lot of knowledge and effort into creating this impeccable Empowering The Future Key Components Of Advanced Metering Infrastructure IoT SS V. You can use this template for your upcoming presentations, as the slides are perfect to represent even the tiniest detail. You can download these templates from the Slidegeeks website and these are easy to edit. So grab these today This slide exhibits components of advanced metering infrastructure that optimize utility operations and improve energy management. It covers there main components such as smart meter, communication network, and data management system.

Empowering The Future Introduction To Smart Meters Overview And Role IoT SS V
This slide exhibits information about smart meters that enable efficient data collection on energy utilisation. It covers benefits such as real-time monitoring, accurate billing, and remote management. Are you searching for a Empowering The Future Introduction To Smart Meters Overview And Role IoT SS V that is uncluttered, straightforward, and original Its easy to edit, and you can change the colors to suit your personal or business branding. For a presentation that expresses how much effort you have put in, this template is ideal With all of its features, including tables, diagrams, statistics, and lists, its perfect for a business plan presentation. Make your ideas more appealing with these professional slides. Download Empowering The Future Introduction To Smart Meters Overview And Role IoT SS V from Slidegeeks today. This slide exhibits information about smart meters that enable efficient data collection on energy utilisation. It covers benefits such as real-time monitoring, accurate billing, and remote management.
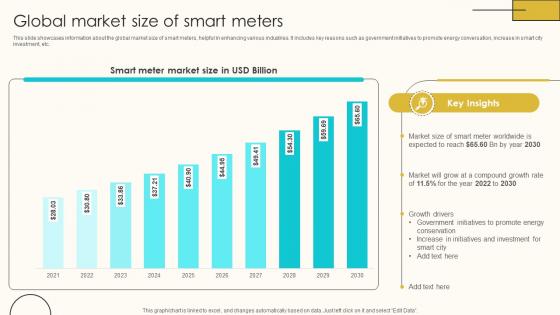
Global Market Size Of Smart Meters Internet Of Things Solutions To Enhance Energy IoT SS V
This slide showcases information about the global market size of smart meters, helpful in enhancing various industries. It includes key reasons such as government initiatives to promote energy conversation, increase in smart city investment, etc. From laying roadmaps to briefing everything in detail, our templates are perfect for you. You can set the stage with your presentation slides. All you have to do is download these easy-to-edit and customizable templates. Global Market Size Of Smart Meters Internet Of Things Solutions To Enhance Energy IoT SS V will help you deliver an outstanding performance that everyone would remember and praise you for. Do download this presentation today. This slide showcases information about the global market size of smart meters, helpful in enhancing various industries. It includes key reasons such as government initiatives to promote energy conversation, increase in smart city investment, etc.

Empowering The Future Challenges And Solutions In Advanced Metering Infrastructure IoT SS V
This slide exhibits AMI system challenges and appropriate solutions to enhance grid reliability. It includes challenges such as communication network challenges, network-based security threats, security standards, etc. Do you have an important presentation coming up Are you looking for something that will make your presentation stand out from the rest Look no further than Empowering The Future Challenges And Solutions In Advanced Metering Infrastructure IoT SS V. With our professional designs, you can trust that your presentation will pop and make delivering it a smooth process. And with Slidegeeks, you can trust that your presentation will be unique and memorable. So why wait Grab Empowering The Future Challenges And Solutions In Advanced Metering Infrastructure IoT SS V today and make your presentation stand out from the rest This slide exhibits AMI system challenges and appropriate solutions to enhance grid reliability. It includes challenges such as communication network challenges, network-based security threats, security standards, etc.
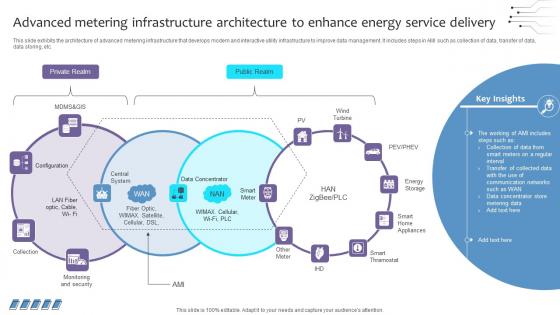
Empowering The Future Advanced Metering Infrastructure Architecture To Enhance IoT SS V
This slide exhibits the architecture of advanced metering infrastructure that develops modern and interactive utility infrastructure to improve data management. It includes steps in AMI such as collection of data, transfer of data, data storing, etc. There are so many reasons you need a Empowering The Future Advanced Metering Infrastructure Architecture To Enhance IoT SS V. The first reason is you can not spend time making everything from scratch, Thus, Slidegeeks has made presentation templates for you too. You can easily download these templates from our website easily. This slide exhibits the architecture of advanced metering infrastructure that develops modern and interactive utility infrastructure to improve data management. It includes steps in AMI such as collection of data, transfer of data, data storing, etc.
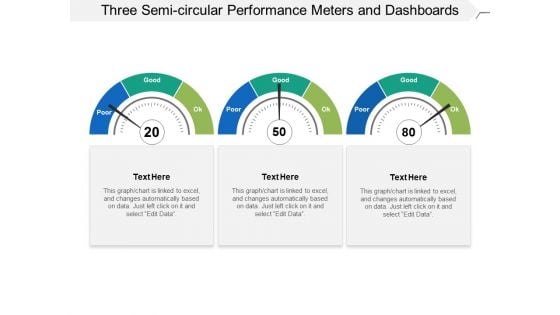
Three Semi Circular Performance Meters And Dashboards Ppt PowerPoint Presentation Slides Influencers
This is a three semi circular performance meters and dashboards ppt powerpoint presentation slides influencers. This is a three stage process. The stages in this process are fuel gauge, gas gauge, fuel containers.
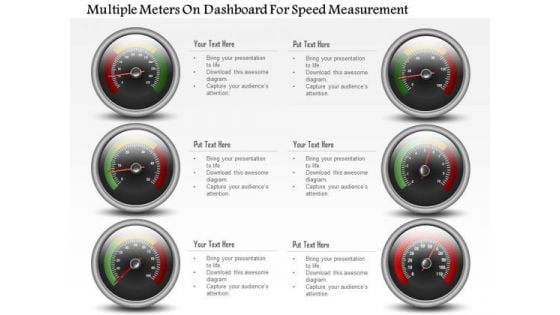
Business Diagram Multiple Meters On Dashboard For Speed Measurement PowerPoint Slide
This business diagram has been designed with multiple meters on dashboard. This slide can be used for business planning and progress. Use this diagram for your business and success milestones related presentations.

Empowering The Future Key Benefits Of Data Management In Smart Metering IoT SS V
This slide highlights data management in smart metering in order to enhance the overall efficiency of energy transmission and distribution.it covers key aspects such as data collection, data recording, data storing, data transmission, and data display. Want to ace your presentation in front of a live audience Our Empowering The Future Key Benefits Of Data Management In Smart Metering IoT SS V can help you do that by engaging all the users towards you. Slidegeeks experts have put their efforts and expertise into creating these impeccable powerpoint presentations so that you can communicate your ideas clearly. Moreover, all the templates are customizable, and easy-to-edit and downloadable. Use these for both personal and commercial use. This slide highlights data management in smart metering in order to enhance the overall efficiency of energy transmission and distribution.it covers key aspects such as data collection, data recording, data storing, data transmission, and data display.
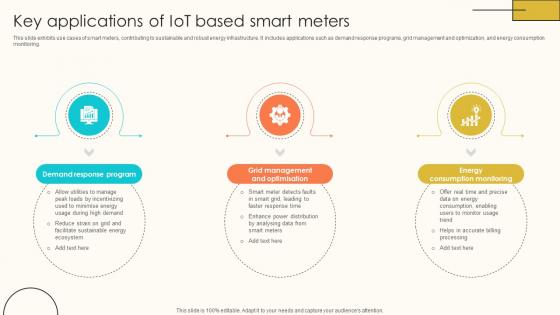
Key Applications Of IoT Based Smart Meters Internet Of Things Solutions To Enhance Energy IoT SS V
This slide exhibits use cases of smart meters, contributing to sustainable and robust energy infrastructure. It includes applications such as demand response programs, grid management and optimization, and energy consumption monitoring. The Key Applications Of IoT Based Smart Meters Internet Of Things Solutions To Enhance Energy IoT SS V is a compilation of the most recent design trends as a series of slides. It is suitable for any subject or industry presentation, containing attractive visuals and photo spots for businesses to clearly express their messages. This template contains a variety of slides for the user to input data, such as structures to contrast two elements, bullet points, and slides for written information. Slidegeeks is prepared to create an impression. This slide exhibits use cases of smart meters, contributing to sustainable and robust energy infrastructure. It includes applications such as demand response programs, grid management and optimization, and energy consumption monitoring.
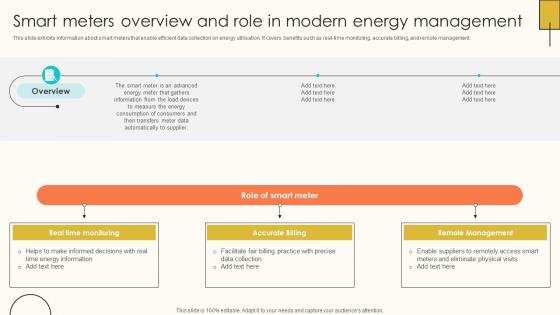
Smart Meters Overview And Role In Modern Internet Of Things Solutions To Enhance Energy IoT SS V
This slide exhibits information about smart meters that enable efficient data collection on energy utilisation. It covers benefits such as real-time monitoring, accurate billing, and remote management. Presenting this PowerPoint presentation, titled Smart Meters Overview And Role In Modern Internet Of Things Solutions To Enhance Energy IoT SS V, with topics curated by our researchers after extensive research. This editable presentation is available for immediate download and provides attractive features when used. Download now and captivate your audience. Presenting this Smart Meters Overview And Role In Modern Internet Of Things Solutions To Enhance Energy IoT SS V. Our researchers have carefully researched and created these slides with all aspects taken into consideration. This is a completely customizable Smart Meters Overview And Role In Modern Internet Of Things Solutions To Enhance Energy IoT SS V that is available for immediate downloading. Download now and make an impact on your audience. Highlight the attractive features available with our PPTs. This slide exhibits information about smart meters that enable efficient data collection on energy utilisation. It covers benefits such as real-time monitoring, accurate billing, and remote management.

Basketball Teams Playing With Each Other At Tournament Ppt PowerPoint Presentation Visual Aids Ideas PDF
Presenting this set of slides with name customer satisfaction rating meter feedback rating scale sale services excellent ppt powerpoint presentation complete deck. The topics discussed in these slide is basketball teams playing with each other at tournament. This is a completely editable PowerPoint presentation and is available for immediate download. Download now and impress your audience.
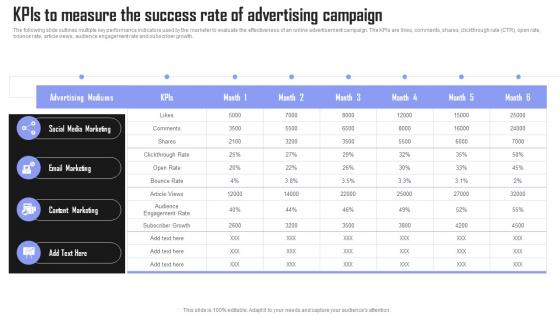
KPIs To Measure Success Rate Brand Building Techniques To Gain Competitive Edge Background Pdf
The following slide outlines multiple key performance indicators used by the marketer to evaluate the effectiveness of an online advertisement campaign. The KPIs are likes, comments, shares, clickthrough rate CTR, open rate, bounce rate, article views, audience engagement rate and subscriber growth. The best PPT templates are a great way to save time, energy, and resources. Slidegeeks have 100 percent editable powerpoint slides making them incredibly versatile. With these quality presentation templates, you can create a captivating and memorable presentation by combining visually appealing slides and effectively communicating your message. Download KPIs To Measure Success Rate Brand Building Techniques To Gain Competitive Edge Background Pdf from Slidegeeks and deliver a wonderful presentation. The following slide outlines multiple key performance indicators used by the marketer to evaluate the effectiveness of an online advertisement campaign. The KPIs are likes, comments, shares, clickthrough rate CTR, open rate, bounce rate, article views, audience engagement rate and subscriber growth.
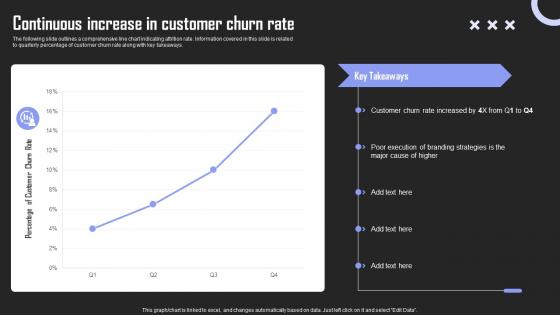
Continuous Increase Rate Brand Building Techniques To Gain Competitive Edge Summary Pdf
The following slide outlines a comprehensive line chart indicating attrition rate. Information covered in this slide is related to quarterly percentage of customer churn rate along with key takeaways. Whether you have daily or monthly meetings, a brilliant presentation is necessary. Continuous Increase Rate Brand Building Techniques To Gain Competitive Edge Summary Pdf can be your best option for delivering a presentation. Represent everything in detail using Continuous Increase Rate Brand Building Techniques To Gain Competitive Edge Summary Pdf and make yourself stand out in meetings. The template is versatile and follows a structure that will cater to your requirements. All the templates prepared by Slidegeeks are easy to download and edit. Our research experts have taken care of the corporate themes as well. So, give it a try and see the results. The following slide outlines a comprehensive line chart indicating attrition rate. Information covered in this slide is related to quarterly percentage of customer churn rate along with key takeaways.

Positive Impact Of Training On FCR Rate Customer Service Training Ppt Slide
This slide mentions the calculation of the First Contact Resolution Rate for the month of January and August indicating the pre and post-training periods respectively Presenting this PowerPoint presentation, titled Positive Impact Of Training On FCR Rate Customer Service Training Ppt Slide with topics curated by our researchers after extensive research. This editable presentation is available for immediate download and provides attractive features when used. Download now and captivate your audience. Presenting this Positive Impact Of Training On FCR Rate Customer Service Training Ppt Slide Our researchers have carefully researched and created these slides with all aspects taken into consideration. This is a completely customizable Positive Impact Of Training On FCR Rate Customer Service Training Ppt Slide that is available for immediate downloading. Download now and make an impact on your audience. Highlight the attractive features available with our PPTs. This slide mentions the calculation of the First Contact Resolution Rate for the month of January and August indicating the pre and post-training periods respectively

Popular Tools To Measure Inflation Rate Strategies For Inflation A Tactical Guide Fin SS V
This slide shows various methods which can be used to measure inflation rates in an economy or country. It includes tools such as consumer price index, producer price index, GDP deflator, asset price indices, etc. Create an editable Popular Tools To Measure Inflation Rate Strategies For Inflation A Tactical Guide Fin SS V that communicates your idea and engages your audience. Whether you are presenting a business or an educational presentation, pre-designed presentation templates help save time. Popular Tools To Measure Inflation Rate Strategies For Inflation A Tactical Guide Fin SS V is highly customizable and very easy to edit, covering many different styles from creative to business presentations. Slidegeeks has creative team members who have crafted amazing templates. So, go and get them without any delay. This slide shows various methods which can be used to measure inflation rates in an economy or country. It includes tools such as consumer price index, producer price index, GDP deflator, asset price indices, etc.
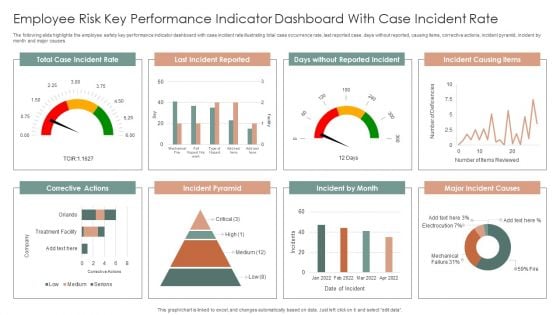
Employee Risk Key Performance Indicator Dashboard With Case Incident Rate Ppt Professional Information PDF
The following slide highlights the employee safety key performance indicator dashboard with case incident rate illustrating total case occurrence rate, last reported case, days without reported, causing items, corrective actions, incident pyramid, incident by month and major causes. Pitch your topic with ease and precision using this Employee Risk Key Performance Indicator Dashboard With Case Incident Rate Ppt Professional Information PDF. This layout presents information on Total Case, Incident Rate, Last Incident Reported, Incident Causing Items. It is also available for immediate download and adjustment. So, changes can be made in the color, design, graphics or any other component to create a unique layout.
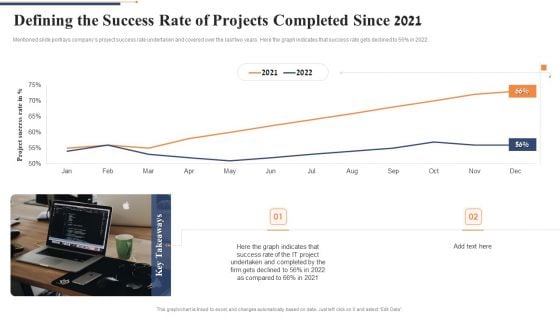
Defining The Success Rate Of Projects Completed Since 2021 Pictures PDF
Mentioned slide portrays companys project success rate undertaken and covered over the last two years. Here the graph indicates that success rate gets declined to 56percentsge in 2022. Deliver an awe inspiring pitch with this creative defining the success rate of projects completed since 2021 pictures pdf bundle. Topics like project success rate can be discussed with this completely editable template. It is available for immediate download depending on the needs and requirements of the user.
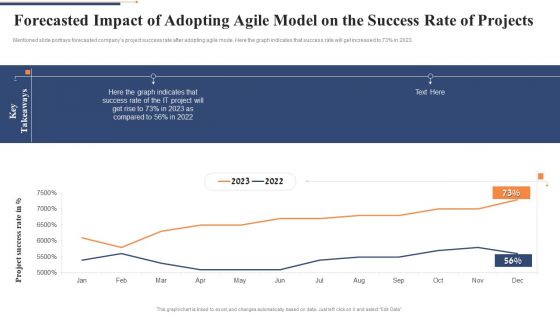
Forecasted Impact Of Adopting Agile Model On The Success Rate Of Projects Inspiration PDF
Mentioned slide portrays forecasted companys project success rate after adopting agile mode. Here the graph indicates that success rate will get increased to 73percentage in 2023. Deliver an awe inspiring pitch with this creative forecasted impact of adopting agile model on the success rate of projects inspiration pdf bundle. Topics like project success rate can be discussed with this completely editable template. It is available for immediate download depending on the needs and requirements of the user.
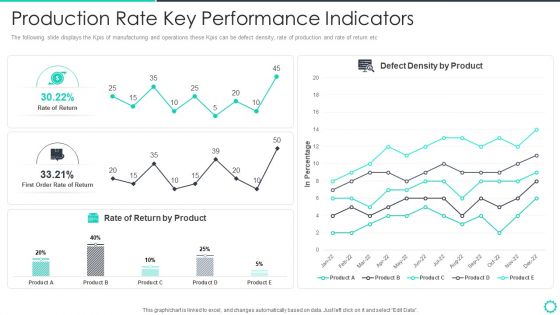
Manufacturing Operation Quality Improvement Practices Tools Templates Production Rate Key Performance Portrait PDF
The following slide displays the Kpis of manufacturing and operations these Kpis can be defect density, rate of production and rate of return etc. Deliver and pitch your topic in the best possible manner with this manufacturing operation quality improvement practices tools templates production rate key performance portrait pdf. Use them to share invaluable insights on production rate key performance indicators and impress your audience. This template can be altered and modified as per your expectations. So, grab it now.
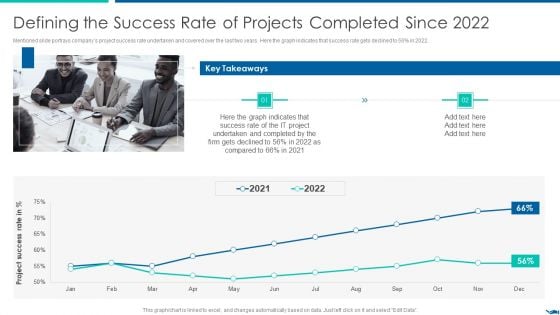
Project QA Through Agile Methodology IT Defining The Success Rate Infographics PDF
Mentioned slide portrays companys project success rate undertaken and covered over the last two years. Here the graph indicates that success rate gets declined to 56percent in 2022.Deliver an awe inspiring pitch with this creative Project QA Through Agile Methodology IT Defining The Success Rate Infographics PDF bundle. Topics like Defining The Success Rate Of Projects Completed Since 2022 can be discussed with this completely editable template. It is available for immediate download depending on the needs and requirements of the user.
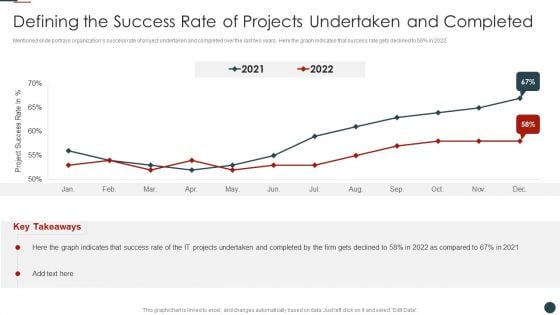
Implementing Agile Software Development Methodology For Cost Cutting IT Defining The Success Rate Introduction PDF
Mentioned slide portrays organizations success rate of project undertaken and completed over the last two years. Here the graph indicates that success rate gets declined to 58percent in 2022.Deliver an awe inspiring pitch with this creative Implementing Agile Software Development Methodology For Cost Cutting IT Defining The Success Rate Introduction PDF bundle. Topics like Defining Success, Rate Projects, Undertaken Completed can be discussed with this completely editable template. It is available for immediate download depending on the needs and requirements of the user.


 Continue with Email

 Home
Home


