Resource Plan
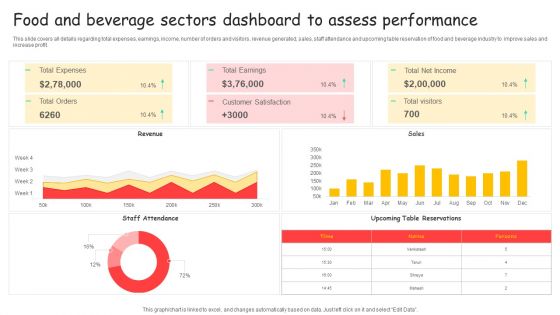
Food And Beverage Sectors Dashboard To Assess Performance Ppt Styles Elements PDF
This slide covers all details regarding total expenses, earnings, income, number of orders and visitors, revenue generated, sales, staff attendance and upcoming table reservation of food and beverage industry to improve sales and increase profit. Showcasing this set of slides titled Food And Beverage Sectors Dashboard To Assess Performance Ppt Styles Elements PDF. The topics addressed in these templates are Total Expenses, Total Earnings, Total Net Income. All the content presented in this PPT design is completely editable. Download it and make adjustments in color, background, font etc. as per your unique business setting.
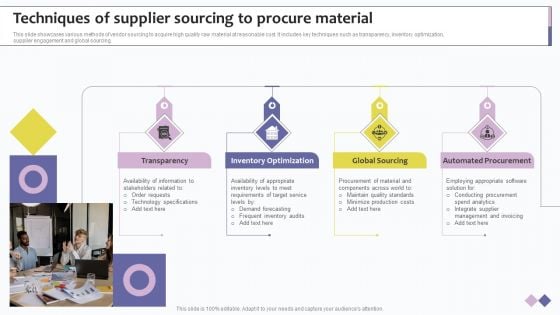
Techniques Of Supplier Sourcing To Procure Material Ppt PowerPoint Presentation Gallery Visual Aids PDF
This slide showcases various methods of vendor sourcing to acquire high quality raw material at reasonable cost. It includes key techniques such as transparency, inventory optimization, supplier engagement and global sourcing. Presenting Techniques Of Supplier Sourcing To Procure Material Ppt PowerPoint Presentation Gallery Visual Aids PDF to dispense important information. This template comprises four stages. It also presents valuable insights into the topics including Transparency, Inventory Optimization, Global Sourcing, Automated Procurement. This is a completely customizable PowerPoint theme that can be put to use immediately. So, download it and address the topic impactfully.
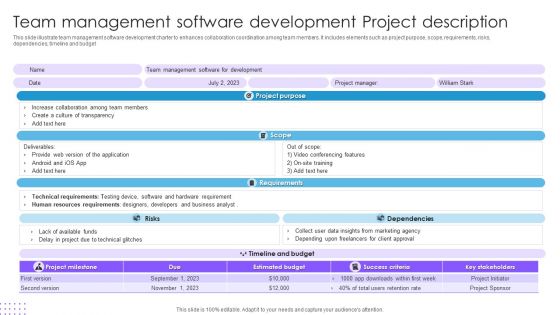
Team Management Software Development Project Description Ppt Infographic Template Topics PDF
This slide illustrate team management software development charter to enhances collaboration coordination among team members. It includes elements such as project purpose, scope, requirements, risks, dependencies, timeline and budget. Pitch your topic with ease and precision using this Team Management Software Development Project Description Ppt Infographic Template Topics PDF. This layout presents information on Team Management Software, Project Purpose, Scope, Requirements. It is also available for immediate download and adjustment. So, changes can be made in the color, design, graphics or any other component to create a unique layout.
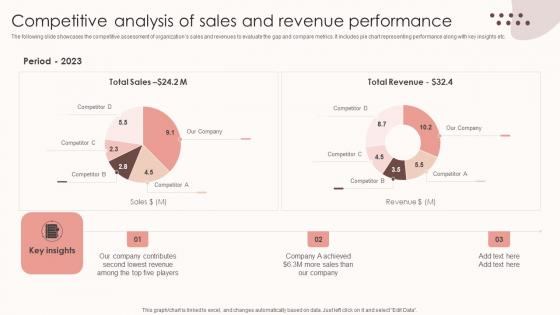
Assessing Sales Risks Competitive Analysis Of Sales And Revenue Performance Clipart PDF
The following slide showcases the competitive assessment of organizations sales and revenues to evaluate the gap and compare metrics. It includes pie chart representing performance along with key insights etc. Present like a pro with Assessing Sales Risks Competitive Analysis Of Sales And Revenue Performance Clipart PDF Create beautiful presentations together with your team, using our easy-to-use presentation slides. Share your ideas in real-time and make changes on the fly by downloading our templates. So whether you are in the office, on the go, or in a remote location, you can stay in sync with your team and present your ideas with confidence. With Slidegeeks presentation got a whole lot easier. Grab these presentations today. The following slide showcases the competitive assessment of organizations sales and revenues to evaluate the gap and compare metrics. It includes pie chart representing performance along with key insights etc.
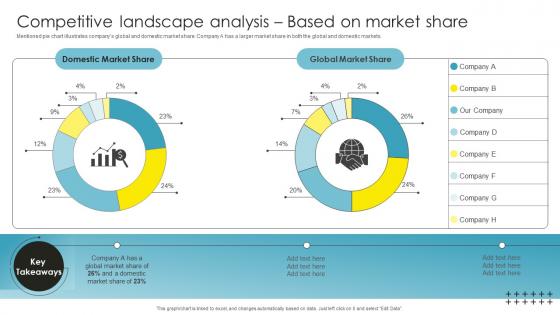
Competitive Landscape Analysis Based Strategic Brand Management Graphics Pdf
Mentioned pie chart illustrates companys global and domestic market share. Company A has a larger market share in both the global and domestic markets. Do you have an important presentation coming up Are you looking for something that will make your presentation stand out from the rest Look no further than Competitive Landscape Analysis Based Strategic Brand Management Graphics Pdf. With our professional designs, you can trust that your presentation will pop and make delivering it a smooth process. And with Slidegeeks, you can trust that your presentation will be unique and memorable. So why wait Grab Competitive Landscape Analysis Based Strategic Brand Management Graphics Pdf today and make your presentation stand out from the rest. Mentioned pie chart illustrates companys global and domestic market share. Company A has a larger market share in both the global and domestic markets.

Top Tenets Of Zero Trust Network Access Model Zero Trust Network Security Graphics Pdf
This graph chart is linked to excel, and changes automatically based on data. Just left click on it and select Edit Data. Do you have an important presentation coming up Are you looking for something that will make your presentation stand out from the rest Look no further than Top Tenets Of Zero Trust Network Access Model Zero Trust Network Security Graphics Pdf. With our professional designs, you can trust that your presentation will pop and make delivering it a smooth process. And with Slidegeeks, you can trust that your presentation will be unique and memorable. So why wait Grab Top Tenets Of Zero Trust Network Access Model Zero Trust Network Security Graphics Pdf today and make your presentation stand out from the rest This graph chart is linked to excel, and changes automatically based on data. Just left click on it and select Edit Data.

Examining Reasons For Employee Exit Interview Guidelines Pdf
This slide illustrates diagrammatic chart for employees exit interview reasons to delve and analyze what prompts employees to leave. It includes various components such as Personal Issues, Growth Pathways, Various other factors, etc. Showcasing this set of slides titled Examining Reasons For Employee Exit Interview Guidelines Pdf The topics addressed in these templates are Examining Reasons For Employee, Exit Interview All the content presented in this PPT design is completely editable. Download it and make adjustments in color, background, font etc. as per your unique business setting. This slide illustrates diagrammatic chart for employees exit interview reasons to delve and analyze what prompts employees to leave. It includes various components such as Personal Issues, Growth Pathways, Various other factors, etc.
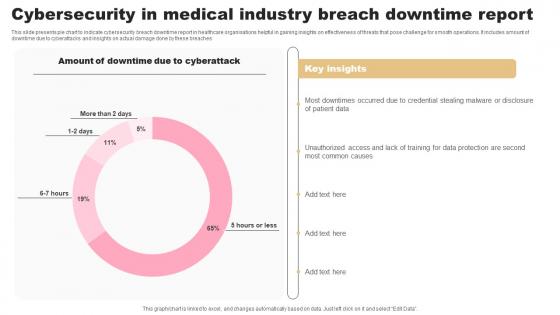
Cybersecurity In Medical Industry Breach Downtime Report Designs Pdf
This slide presents pie chart to indicate cybersecurity breach downtime report in healthcare organisations helpful in gaining insights on effectiveness of threats that pose challenge for smooth operations. It includes amount of downtime due to cyberattacks and insights on actual damage done by these breaches Pitch your topic with ease and precision using this Cybersecurity In Medical Industry Breach Downtime Report Designs Pdf. This layout presents information on Cyberattack, Insights, Report. It is also available for immediate download and adjustment. So, changes can be made in the color, design, graphics or any other component to create a unique layout. This slide presents pie chart to indicate cybersecurity breach downtime report in healthcare organisations helpful in gaining insights on effectiveness of threats that pose challenge for smooth operations. It includes amount of downtime due to cyberattacks and insights on actual damage done by these breaches
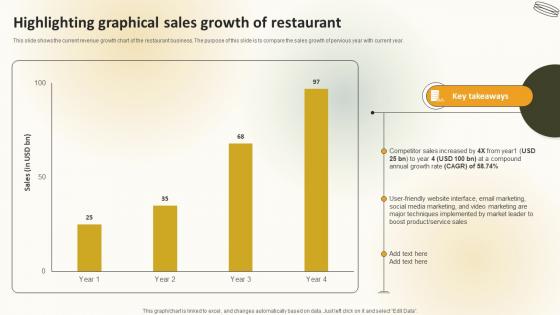
Highlighting Graphical Sales Growth Of Restaurant Create An Effective Restaurant
This slide shows the current revenue growth chart of the restaurant business. The purpose of this slide is to compare the sales growth of pervious year with current year. If your project calls for a presentation, then Slidegeeks is your go-to partner because we have professionally designed, easy-to-edit templates that are perfect for any presentation. After downloading, you can easily edit Highlighting Graphical Sales Growth Of Restaurant Create An Effective Restaurant and make the changes accordingly. You can rearrange slides or fill them with different images. Check out all the handy templates This slide shows the current revenue growth chart of the restaurant business. The purpose of this slide is to compare the sales growth of pervious year with current year.

Create A Restaurant Marketing Highlighting Graphical Sales Growth Of Restaurant
This slide shows the current revenue growth chart of the restaurant business. The purpose of this slide is to compare the sales growth of pervious year with current year. Find highly impressive Create A Restaurant Marketing Highlighting Graphical Sales Growth Of Restaurant on Slidegeeks to deliver a meaningful presentation. You can save an ample amount of time using these presentation templates. No need to worry to prepare everything from scratch because Slidegeeks experts have already done a huge research and work for you. You need to download Create A Restaurant Marketing Highlighting Graphical Sales Growth Of Restaurant for your upcoming presentation. All the presentation templates are 100 percent editable and you can change the color and personalize the content accordingly. Download now This slide shows the current revenue growth chart of the restaurant business. The purpose of this slide is to compare the sales growth of pervious year with current year.
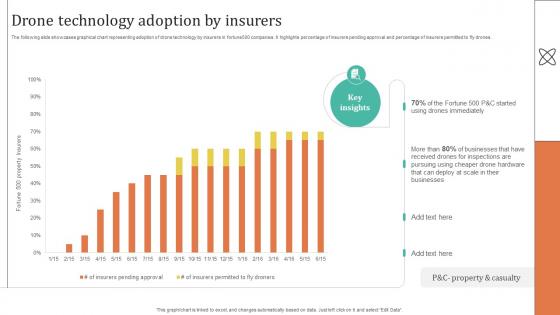
Improving Customer Satisfaction Drone Technology Adoption By Insurers
The following slide showcases graphical chart representing adoption of drone technology by insurers in fortune500 companies. It highlights percentage of insurers pending approval and percentage of insurers permitted to fly drones. Coming up with a presentation necessitates that the majority of the effort goes into the content and the message you intend to convey. The visuals of a PowerPoint presentation can only be effective if it supplements and supports the story that is being told. Keeping this in mind our experts created Improving Customer Satisfaction Drone Technology Adoption By Insurers to reduce the time that goes into designing the presentation. This way, you can concentrate on the message while our designers take care of providing you with the right template for the situation. The following slide showcases graphical chart representing adoption of drone technology by insurers in fortune500 companies. It highlights percentage of insurers pending approval and percentage of insurers permitted to fly drones.
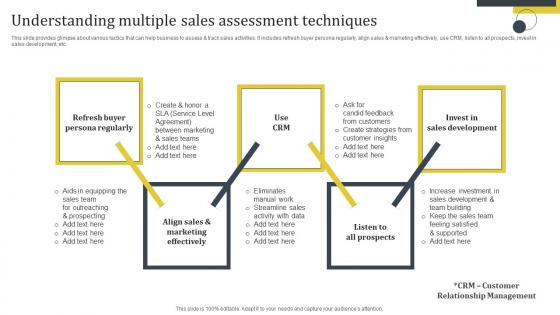
Enhance Customer Retention Understanding Multiple Sales Assessment Techniques Brochure Pdf
This slide provides glimpse about various tactics that can help business to assess and track sales activities. It includes refresh buyer persona regularly, align sales and marketing effectively, use CRM, listen to all prospects, invest in sales development, etc. Do you know about Slidesgeeks Enhance Customer Retention Understanding Multiple Sales Assessment Techniques Brochure Pdf These are perfect for delivering any kind od presentation. Using it, create PowerPoint presentations that communicate your ideas and engage audiences. Save time and effort by using our pre-designed presentation templates that are perfect for a wide range of topic. Our vast selection of designs covers a range of styles, from creative to business, and are all highly customizable and easy to edit. Download as a PowerPoint template or use them as Google Slides themes. This slide provides glimpse about various tactics that can help business to assess and track sales activities. It includes refresh buyer persona regularly, align sales and marketing effectively, use CRM, listen to all prospects, invest in sales development, etc.
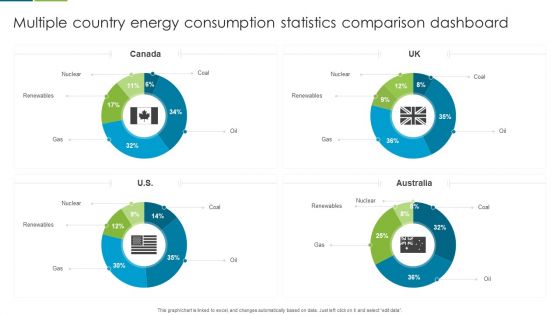
Multiple Country Energy Consumption Statistics Comparison Dashboard Formats PDF
This graph or chart is linked to excel, and changes automatically based on data. Just left click on it and select edit data. Pitch your topic with ease and precision using this Multiple Country Energy Consumption Statistics Comparison Dashboard Formats PDF. This layout presents information on Nuclear, Renewables, Gas. It is also available for immediate download and adjustment. So, changes can be made in the color, design, graphics or any other component to create a unique layout.
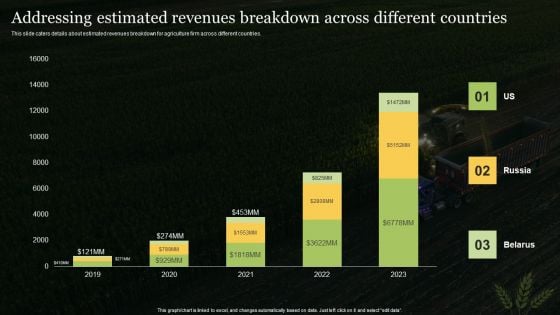
Addressing Estimated Revenues Breakdown Across Different Countries Professional PDF
This slide caters details about estimated revenues breakdown for agriculture firm across different countries. If you are looking for a format to display your unique thoughts, then the professionally designed Addressing Estimated Revenues Breakdown Across Different Countries Professional PDF is the one for you. You can use it as a Google Slides template or a PowerPoint template. Incorporate impressive visuals, symbols, images, and other charts. Modify or reorganize the text boxes as you desire. Experiment with shade schemes and font pairings. Alter, share or cooperate with other people on your work. Download Addressing Estimated Revenues Breakdown Across Different Countries Professional PDF and find out how to give a successful presentation. Present a perfect display to your team and make your presentation unforgettable.
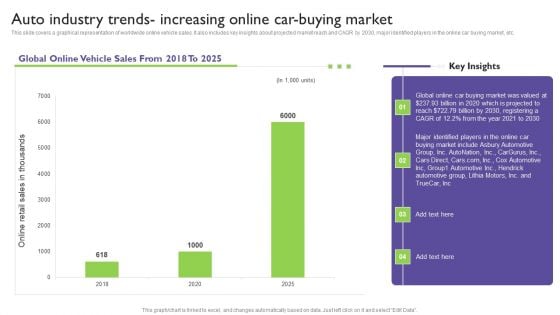
Global Automotive Industry Analysis Auto Industry Trends Increasing Online Car Buying Market Template PDF
This slide covers a graphical representation of worldwide online vehicle sales. It also includes key insights about projected market reach and CAGR by 2030, major identified players in the online car buying market, etc. If you are looking for a format to display your unique thoughts, then the professionally designed Global Automotive Industry Analysis Auto Industry Trends Increasing Online Car Buying Market Template PDF is the one for you. You can use it as a Google Slides template or a PowerPoint template. Incorporate impressive visuals, symbols, images, and other charts. Modify or reorganize the text boxes as you desire. Experiment with shade schemes and font pairings. Alter, share or cooperate with other people on your work. Download Global Automotive Industry Analysis Auto Industry Trends Increasing Online Car Buying Market Template PDF and find out how to give a successful presentation. Present a perfect display to your team and make your presentation unforgettable.
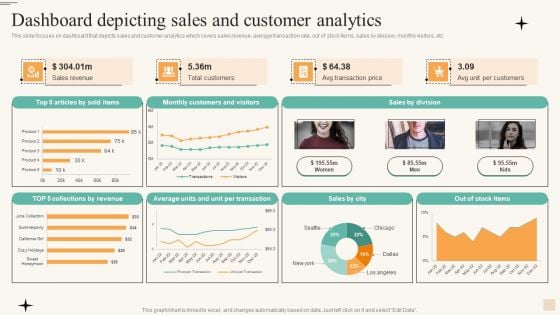
Dashboard Depicting Sales And Customer Analytics Infographics PDF
This slide focuses on dashboard that depicts sales and customer analytics which covers sales revenue, average transaction rate, out of stock items, sales by division, monthly visitors, etc. If you are looking for a format to display your unique thoughts, then the professionally designed Dashboard Depicting Sales And Customer Analytics Infographics PDF is the one for you. You can use it as a Google Slides template or a PowerPoint template. Incorporate impressive visuals, symbols, images, and other charts. Modify or reorganize the text boxes as you desire. Experiment with shade schemes and font pairings. Alter, share or cooperate with other people on your work. Download Dashboard Depicting Sales And Customer Analytics Infographics PDF and find out how to give a successful presentation. Present a perfect display to your team and make your presentation unforgettable.
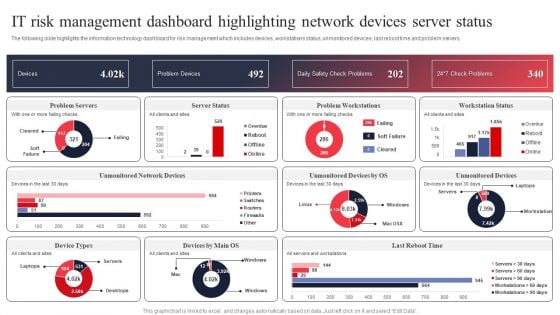
IT System Risk Management Guide IT Risk Management Dashboard Highlighting Network Devices Server Status Elements PDF
The following slide highlights the information technology dashboard for risk management which includes devices, workstations status, unmonitored devices, last reboot time and problem servers. If you are looking for a format to display your unique thoughts, then the professionally designed IT System Risk Management Guide IT Risk Management Dashboard Highlighting Network Devices Server Status Elements PDF is the one for you. You can use it as a Google Slides template or a PowerPoint template. Incorporate impressive visuals, symbols, images, and other charts. Modify or reorganize the text boxes as you desire. Experiment with shade schemes and font pairings. Alter, share or cooperate with other people on your work. Download IT System Risk Management Guide IT Risk Management Dashboard Highlighting Network Devices Server Status Elements PDF and find out how to give a successful presentation. Present a perfect display to your team and make your presentation unforgettable.

Ad And Media Agency Company Profile Operating Profit 2018 To 2022 Information PDF
This slide focuses on operating profit of advertising agency for last five years from 2018 to 2022 which represents increasing trend due to reduced operating expenses. If you are looking for a format to display your unique thoughts, then the professionally designed Ad And Media Agency Company Profile Operating Profit 2018 To 2022 Information PDF is the one for you. You can use it as a Google Slides template or a PowerPoint template. Incorporate impressive visuals, symbols, images, and other charts. Modify or reorganize the text boxes as you desire. Experiment with shade schemes and font pairings. Alter, share or cooperate with other people on your work. Download Ad And Media Agency Company Profile Operating Profit 2018 To 2022 Information PDF and find out how to give a successful presentation. Present a perfect display to your team and make your presentation unforgettable.

Analyze Customer Behavior To Reach Maximum People Topics PDF
Also go deeper into customer research to know the channels used most by them, channels used to find your brand and their general online behavior. If you are looking for a format to display your unique thoughts, then the professionally designed Analyze Customer Behavior To Reach Maximum People Topics PDF is the one for you. You can use it as a Google Slides template or a PowerPoint template. Incorporate impressive visuals, symbols, images, and other charts. Modify or reorganize the text boxes as you desire. Experiment with shade schemes and font pairings. Alter, share or cooperate with other people on your work. Download Analyze Customer Behavior To Reach Maximum People Topics PDF and find out how to give a successful presentation. Present a perfect display to your team and make your presentation unforgettable.
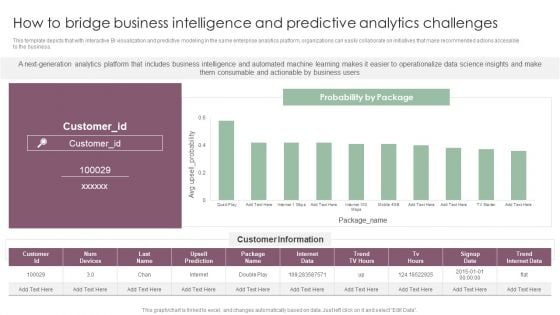
How To Bridge Business Intelligence And Predictive Analytics Challenges Mockup PDF
This template depicts that with interactive BI visualization and predictive modeling in the same enterprise analytics platform, organizations can easily collaborate on initiatives that make recommended actions accessible to the business. If you are looking for a format to display your unique thoughts, then the professionally designed How To Bridge Business Intelligence And Predictive Analytics Challenges Mockup PDF is the one for you. You can use it as a Google Slides template or a PowerPoint template. Incorporate impressive visuals, symbols, images, and other charts. Modify or reorganize the text boxes as you desire. Experiment with shade schemes and font pairings. Alter, share or cooperate with other people on your work. Download How To Bridge Business Intelligence And Predictive Analytics Challenges Mockup PDF and find out how to give a successful presentation. Present a perfect display to your team and make your presentation unforgettable.
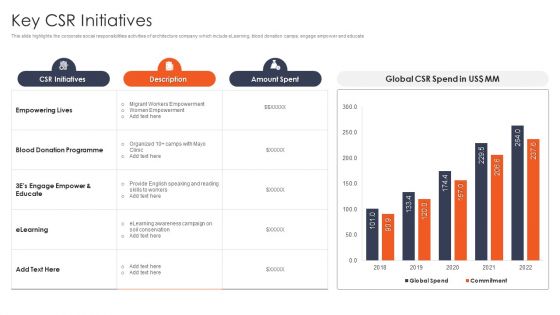
International Design And Architecture Firm Key CSR Initiatives Ppt Background Images PDF
This slide highlights the corporate social responsibilities activities of architecture company which include eLearning, blood donation camps, engage empower and educate If you are looking for a format to display your unique thoughts, then the professionally designed International Design And Architecture Firm Key CSR Initiatives Ppt Background Images PDF is the one for you. You can use it as a Google Slides template or a PowerPoint template. Incorporate impressive visuals, symbols, images, and other charts. Modify or reorganize the text boxes as you desire. Experiment with shade schemes and font pairings. Alter, share or cooperate with other people on your work. Download International Design And Architecture Firm Key CSR Initiatives Ppt Background Images PDF and find out how to give a successful presentation. Present a perfect display to your team and make your presentation unforgettable.

International Business Extension Expectations After Expanding Into Global Markets Diagrams PDF
This slide showcase graph that can help organization to estimate the impact on organizational sales after global expansion. It showcases sales in thousand dollars and forecast for a period of two years. If you are looking for a format to display your unique thoughts, then the professionally designed International Business Extension Expectations After Expanding Into Global Markets Diagrams PDF is the one for you. You can use it as a Google Slides template or a PowerPoint template. Incorporate impressive visuals, symbols, images, and other charts. Modify or reorganize the text boxes as you desire. Experiment with shade schemes and font pairings. Alter, share or cooperate with other people on your work. Download International Business Extension Expectations After Expanding Into Global Markets Diagrams PDF and find out how to give a successful presentation. Present a perfect display to your team and make your presentation unforgettable.
CRM Pipeline Administration Tracking Customer Sales Funnel Dashboard Brochure PDF
This slide covers information regarding the customer sales funnel tracking with sales volume and total market. If you are looking for a format to display your unique thoughts, then the professionally designed CRM Pipeline Administration Tracking Customer Sales Funnel Dashboard Brochure PDF is the one for you. You can use it as a Google Slides template or a PowerPoint template. Incorporate impressive visuals, symbols, images, and other charts. Modify or reorganize the text boxes as you desire. Experiment with shade schemes and font pairings. Alter, share or cooperate with other people on your work. Download CRM Pipeline Administration Tracking Customer Sales Funnel Dashboard Brochure PDF and find out how to give a successful presentation. Present a perfect display to your team and make your presentation unforgettable.
Business To Business Digital Implement Tracking And Reporting To Measure Summary PDF
This template covers dashboard to measure and analyze campaign performance. It also helps in tracking and reporting account based marketing channel and tactics. If you are looking for a format to display your unique thoughts, then the professionally designed Business To Business Digital Implement Tracking And Reporting To Measure Summary PDF is the one for you. You can use it as a Google Slides template or a PowerPoint template. Incorporate impressive visuals, symbols, images, and other charts. Modify or reorganize the text boxes as you desire. Experiment with shade schemes and font pairings. Alter, share or cooperate with other people on your work. Download Business To Business Digital Implement Tracking And Reporting To Measure Summary PDF and find out how to give a successful presentation. Present a perfect display to your team and make your presentation unforgettable.
Efficient Administration Of Product Business And Umbrella Branding Activity Tracking Dashboard For Umbrella Brand Icons PDF
This slide provides information regarding activities tracking dashboard for umbrella brand in terms of customer retention, market share, etc. If you are looking for a format to display your unique thoughts, then the professionally designed Efficient Administration Of Product Business And Umbrella Branding Activity Tracking Dashboard For Umbrella Brand Icons PDF is the one for you. You can use it as a Google Slides template or a PowerPoint template. Incorporate impressive visuals, symbols, images, and other charts. Modify or reorganize the text boxes as you desire. Experiment with shade schemes and font pairings. Alter, share or cooperate with other people on your work. Download Efficient Administration Of Product Business And Umbrella Branding Activity Tracking Dashboard For Umbrella Brand Icons PDF and find out how to give a successful presentation. Present a perfect display to your team and make your presentation unforgettable.
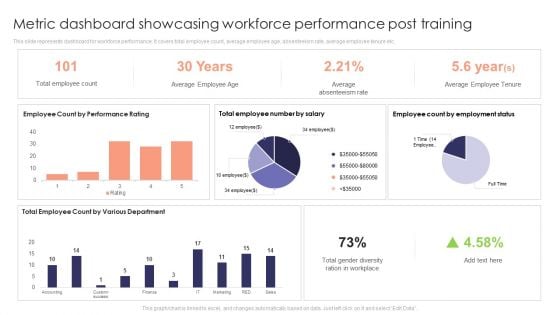
Metric Dashboard Showcasing Workforce Performance Post Training Ideas PDF
This slide represents dashboard for workforce performance. It covers total employee count, average employee age, absenteeism rate, average employee tenure etc. If you are looking for a format to display your unique thoughts, then the professionally designed Metric Dashboard Showcasing Workforce Performance Post Training Ideas PDF is the one for you. You can use it as a Google Slides template or a PowerPoint template. Incorporate impressive visuals, symbols, images, and other charts. Modify or reorganize the text boxes as you desire. Experiment with shade schemes and font pairings. Alter, share or cooperate with other people on your work. Download Metric Dashboard Showcasing Workforce Performance Post Training Ideas PDF and find out how to give a successful presentation. Present a perfect display to your team and make your presentation unforgettable.
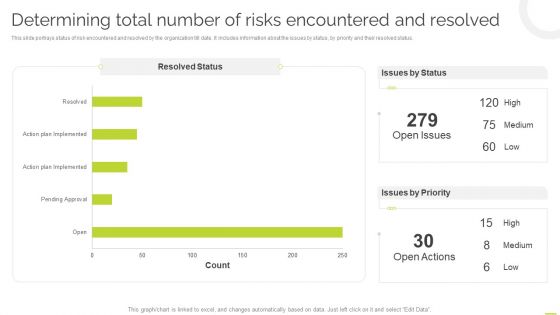
Effective BPM Tool For Business Process Management Determining Total Number Of Risks Encountered And Resolved Inspiration PDF
This slide portrays status of risk encountered and resolved by the organization till date. It includes information about the issues by status, by priority and their resolved status. If you are looking for a format to display your unique thoughts, then the professionally designed Effective BPM Tool For Business Process Management Determining Total Number Of Risks Encountered And Resolved Inspiration PDF is the one for you. You can use it as a Google Slides template or a PowerPoint template. Incorporate impressive visuals, symbols, images, and other charts. Modify or reorganize the text boxes as you desire. Experiment with shade schemes and font pairings. Alter, share or cooperate with other people on your work. Download Effective BPM Tool For Business Process Management Determining Total Number Of Risks Encountered And Resolved Inspiration PDF and find out how to give a successful presentation. Present a perfect display to your team and make your presentation unforgettable.
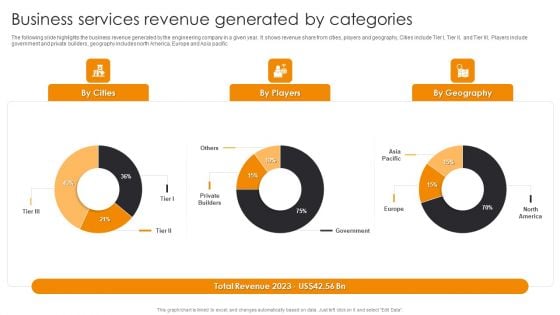
Business Services Revenue Generated By Categories Engineering Company Financial Analysis Report Graphics PDF
The following slide highlights the business revenue generated by the engineering company in a given year. It shows revenue share from cities, players and geography, Cities include Tier I, Tier II, and Tier III, Players include government and private builders, geography includes north America, Europe and Asia pacific.If you are looking for a format to display your unique thoughts, then the professionally designed Business Services Revenue Generated By Categories Engineering Company Financial Analysis Report Graphics PDF is the one for you. You can use it as a Google Slides template or a PowerPoint template. Incorporate impressive visuals, symbols, images, and other charts. Modify or reorganize the text boxes as you desire. Experiment with shade schemes and font pairings. Alter, share or cooperate with other people on your work. Download Business Services Revenue Generated By Categories Engineering Company Financial Analysis Report Graphics PDF and find out how to give a successful presentation. Present a perfect display to your team and make your presentation unforgettable.
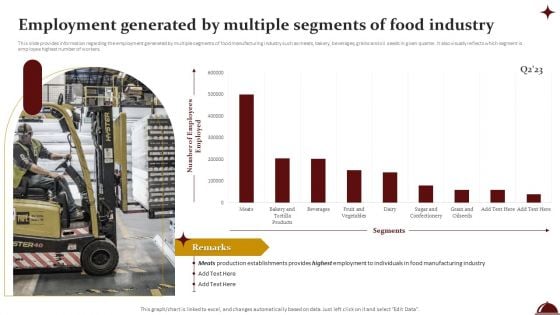
Employment Generated By Multiple Segments Of Food Industry Download PDF
This slide provides information regarding the employment generated by multiple segments of food manufacturing industry such as meats, bakery, beverages, grains and oil seeds in given quarter. It also visually reflects which segment is employee highest number of workers. If you are looking for a format to display your unique thoughts, then the professionally designed Employment Generated By Multiple Segments Of Food Industry Download PDF is the one for you. You can use it as a Google Slides template or a PowerPoint template. Incorporate impressive visuals, symbols, images, and other charts. Modify or reorganize the text boxes as you desire. Experiment with shade schemes and font pairings. Alter, share or cooperate with other people on your work. Download Employment Generated By Multiple Segments Of Food Industry Download PDF and find out how to give a successful presentation. Present a perfect display to your team and make your presentation unforgettable.
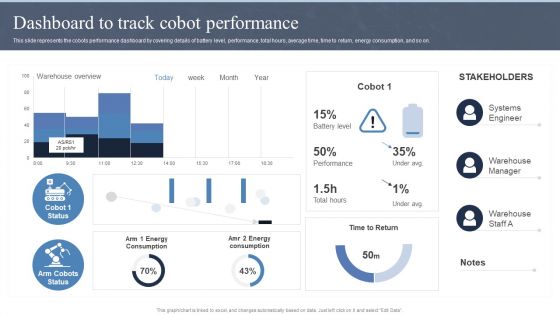
Collaborative Robots IT Dashboard To Track Cobot Performance Ppt Slides Guidelines PDF
This slide represents the cobots performance dashboard by covering details of battery level, performance, total hours, average time, time to return, energy consumption, and so on. If you are looking for a format to display your unique thoughts, then the professionally designed Collaborative Robots IT Dashboard To Track Cobot Performance Ppt Slides Guidelines PDF is the one for you. You can use it as a Google Slides template or a PowerPoint template. Incorporate impressive visuals, symbols, images, and other charts. Modify or reorganize the text boxes as you desire. Experiment with shade schemes and font pairings. Alter, share or cooperate with other people on your work. Download Collaborative Robots IT Dashboard To Track Cobot Performance Ppt Slides Guidelines PDF and find out how to give a successful presentation. Present a perfect display to your team and make your presentation unforgettable.
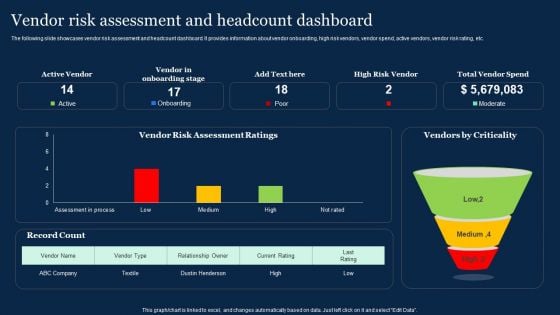
Vendor Risk Assessment And Headcount Dashboard Effective Vendor Management For Enhancing Elements PDF
The following slide showcases vendor risk assessment and headcount dashboard. It provides information about vendor onboarding, high risk vendors, vendor spend, active vendors, vendor risk rating, etc. If you are looking for a format to display your unique thoughts, then the professionally designed Vendor Risk Assessment And Headcount Dashboard Effective Vendor Management For Enhancing Elements PDF is the one for you. You can use it as a Google Slides template or a PowerPoint template. Incorporate impressive visuals, symbols, images, and other charts. Modify or reorganize the text boxes as you desire. Experiment with shade schemes and font pairings. Alter, share or cooperate with other people on your work. Download Vendor Risk Assessment And Headcount Dashboard Effective Vendor Management For Enhancing Elements PDF and find out how to give a successful presentation. Present a perfect display to your team and make your presentation unforgettable.
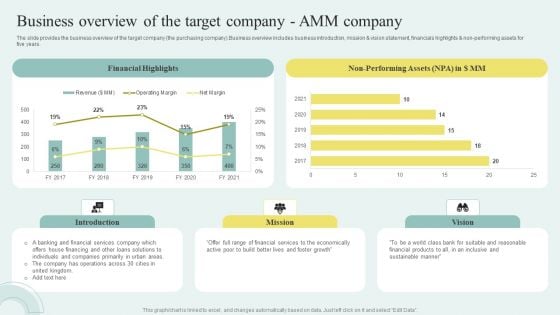
Sell Side M And A Pitchbook With Deal Overview Business Overview Of The Target Company AMM Company Graphics PDF
The slide provides the business overview of the target company the purchasing company.Business overview includes business introduction, mission and vision statement, financials highlights and non performing assets for five years. If you are looking for a format to display your unique thoughts, then the professionally designed Sell Side M And A Pitchbook With Deal Overview Business Overview Of The Target Company AMM Company Graphics PDF is the one for you. You can use it as a Google Slides template or a PowerPoint template. Incorporate impressive visuals, symbols, images, and other charts. Modify or reorganize the text boxes as you desire. Experiment with shade schemes and font pairings. Alter, share or cooperate with other people on your work. Download Sell Side M And A Pitchbook With Deal Overview Business Overview Of The Target Company AMM Company Graphics PDF and find out how to give a successful presentation. Present a perfect display to your team and make your presentation unforgettable.
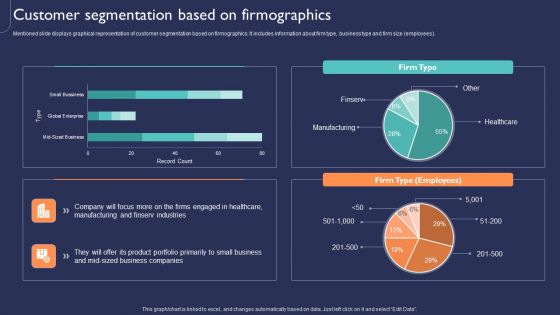
Introduction To New Product Portfolio Customer Segmentation Based On Firmographics Ppt Model Ideas PDF
Mentioned slide displays graphical representation of customer segmentation based on firmographics. It includes information about firm type, business type and firm size employees. If you are looking for a format to display your unique thoughts, then the professionally designed Introduction To New Product Portfolio Customer Segmentation Based On Firmographics Ppt Model Ideas PDF is the one for you. You can use it as a Google Slides template or a PowerPoint template. Incorporate impressive visuals, symbols, images, and other charts. Modify or reorganize the text boxes as you desire. Experiment with shade schemes and font pairings. Alter, share or cooperate with other people on your work. Download Introduction To New Product Portfolio Customer Segmentation Based On Firmographics Ppt Model Ideas PDF and find out how to give a successful presentation. Present a perfect display to your team and make your presentation unforgettable.
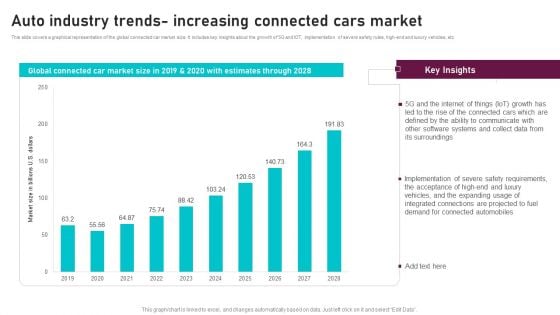
Auto Industry Trends Increasing Connected Cars Market Global Automotive Manufacturing Market Analysis Clipart PDF
This slide covers a graphical representation of the global connected car market size. It includes key insights about the growth of 5G and IOT, implementation of severe safety rules, high end and luxury vehicles, etc. If you are looking for a format to display your unique thoughts, then the professionally designed Auto Industry Trends Increasing Connected Cars Market Global Automotive Manufacturing Market Analysis Clipart PDF is the one for you. You can use it as a Google Slides template or a PowerPoint template. Incorporate impressive visuals, symbols, images, and other charts. Modify or reorganize the text boxes as you desire. Experiment with shade schemes and font pairings. Alter, share or cooperate with other people on your work. Download Auto Industry Trends Increasing Connected Cars Market Global Automotive Manufacturing Market Analysis Clipart PDF and find out how to give a successful presentation. Present a perfect display to your team and make your presentation unforgettable.
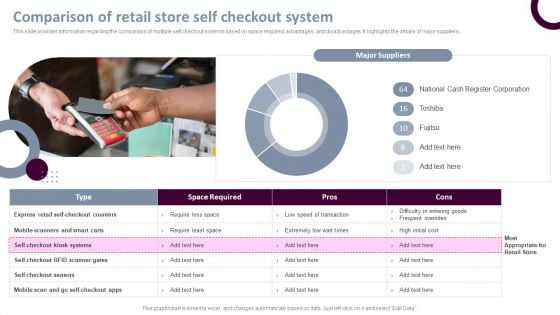
Retail Store Operations Comparison Of Retail Store Self Checkout System Template PDF
This slide provides information regarding the comparison of multiple self checkout systems based on space required, advantages, and disadvantages. It highlights the details of major suppliers. If you are looking for a format to display your unique thoughts, then the professionally designed Retail Store Operations Comparison Of Retail Store Self Checkout System Template PDF is the one for you. You can use it as a Google Slides template or a PowerPoint template. Incorporate impressive visuals, symbols, images, and other charts. Modify or reorganize the text boxes as you desire. Experiment with shade schemes and font pairings. Alter, share or cooperate with other people on your work. Download Retail Store Operations Comparison Of Retail Store Self Checkout System Template PDF and find out how to give a successful presentation. Present a perfect display to your team and make your presentation unforgettable.
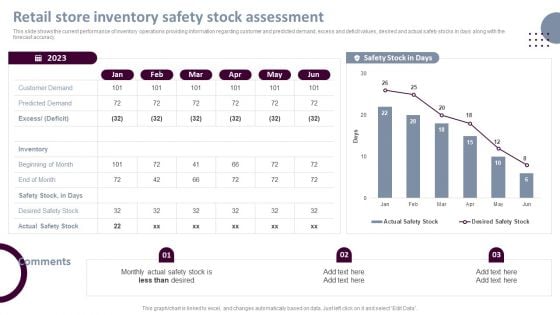
Retail Store Operations Retail Store Inventory Safety Stock Assessment Background PDF
This slide shows the current performance of inventory operations providing information regarding customer and predicted demand, excess and deficit values, desired and actual safety stocks in days along with the forecast accuracy. If you are looking for a format to display your unique thoughts, then the professionally designed Retail Store Operations Retail Store Inventory Safety Stock Assessment Background PDF is the one for you. You can use it as a Google Slides template or a PowerPoint template. Incorporate impressive visuals, symbols, images, and other charts. Modify or reorganize the text boxes as you desire. Experiment with shade schemes and font pairings. Alter, share or cooperate with other people on your work. Download Retail Store Operations Retail Store Inventory Safety Stock Assessment Background PDF and find out how to give a successful presentation. Present a perfect display to your team and make your presentation unforgettable.
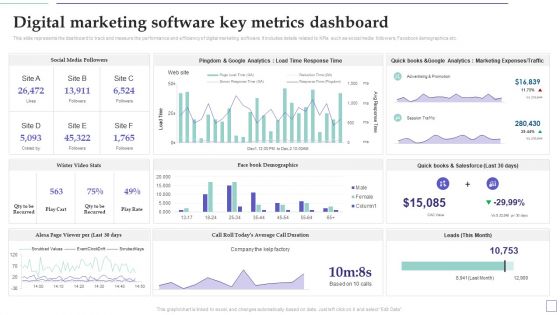
System Deployment Project Digital Marketing Software Key Metrics Dashboard Graphics PDF
This slide represents the dashboard to track and measure the performance and efficiency of digital marketing software. It includes details related to KPIs such as social media followers, Facebook demographics etc. If you are looking for a format to display your unique thoughts, then the professionally designed System Deployment Project Digital Marketing Software Key Metrics Dashboard Graphics PDF is the one for you. You can use it as a Google Slides template or a PowerPoint template. Incorporate impressive visuals, symbols, images, and other charts. Modify or reorganize the text boxes as you desire. Experiment with shade schemes and font pairings. Alter, share or cooperate with other people on your work. Download System Deployment Project Digital Marketing Software Key Metrics Dashboard Graphics PDF and find out how to give a successful presentation. Present a perfect display to your team and make your presentation unforgettable.
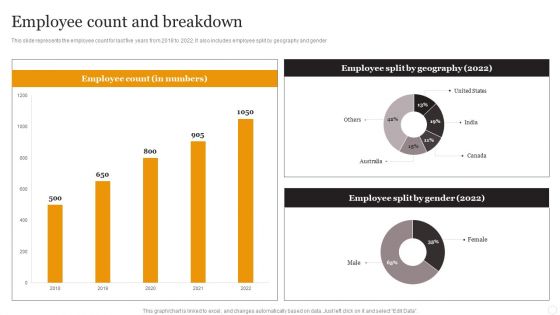
Website Designing Solutions Company Profile Employee Count And Breakdown Rules PDF
This slide represents the employee count for last five years from 2018 to 2022. It also includes employee split by geography and gender. If you are looking for a format to display your unique thoughts, then the professionally designed Website Designing Solutions Company Profile Employee Count And Breakdown Rules PDF is the one for you. You can use it as a Google Slides template or a PowerPoint template. Incorporate impressive visuals, symbols, images, and other charts. Modify or reorganize the text boxes as you desire. Experiment with shade schemes and font pairings. Alter, share or cooperate with other people on your work. Download Website Designing Solutions Company Profile Employee Count And Breakdown Rules PDF and find out how to give a successful presentation. Present a perfect display to your team and make your presentation unforgettable.
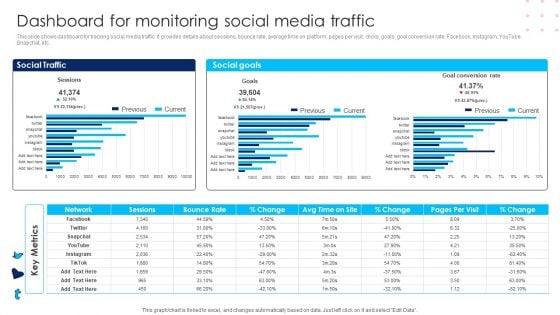
Using Social Media Platforms To Enhance Dashboard For Monitoring Social Media Traffic Structure PDF
This slide shows dashboard for tracking social media traffic. It provides details about sessions, bounce rate, average time on platform, pages per visit, clicks, goals, goal conversion rate, Facebook, Instagram, YouTube, Snapchat, etc. If you are looking for a format to display your unique thoughts, then the professionally designed Using Social Media Platforms To Enhance Dashboard For Monitoring Social Media Traffic Structure PDF is the one for you. You can use it as a Google Slides template or a PowerPoint template. Incorporate impressive visuals, symbols, images, and other charts. Modify or reorganize the text boxes as you desire. Experiment with shade schemes and font pairings. Alter, share or cooperate with other people on your work. Download Using Social Media Platforms To Enhance Dashboard For Monitoring Social Media Traffic Structure PDF and find out how to give a successful presentation. Present a perfect display to your team and make your presentation unforgettable.
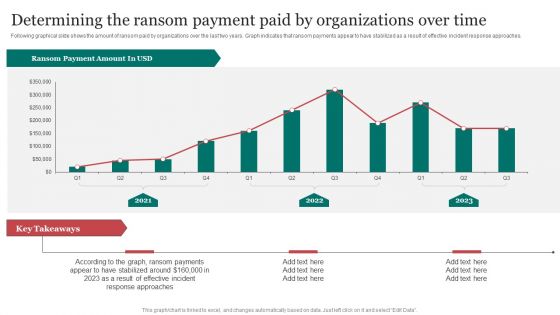
Determining The Ransom Payment Paid By Organizations Over Time Information PDF
Following graphical slide shows the amount of ransom paid by organizations over the last two years. Graph indicates that ransom payments appear to have stabilized as a result of effective incident response approaches.If you are looking for a format to display your unique thoughts, then the professionally designed Determining The Ransom Payment Paid By Organizations Over Time Information PDF is the one for you. You can use it as a Google Slides template or a PowerPoint template. Incorporate impressive visuals, symbols, images, and other charts. Modify or reorganize the text boxes as you desire. Experiment with shade schemes and font pairings. Alter, share or cooperate with other people on your work. Download Determining The Ransom Payment Paid By Organizations Over Time Information PDF and find out how to give a successful presentation. Present a perfect display to your team and make your presentation unforgettable.
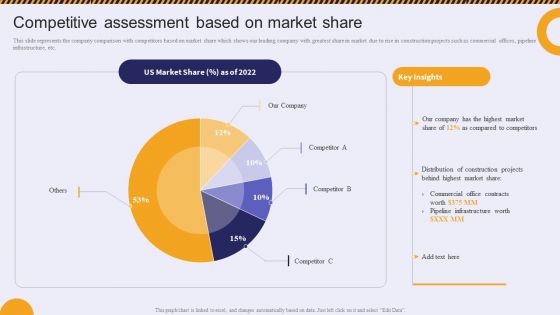
Competitive Assessment Based On Market Share Residential And Commercial Building Slides PDF
This slide represents the company comparison with competitors based on market share which shows our leading company with greatest share in market due to rise in construction projects such as commercial offices, pipeline infrastructure, etc.If you are looking for a format to display your unique thoughts, then the professionally designed Competitive Assessment Based On Market Share Residential And Commercial Building Slides PDF is the one for you. You can use it as a Google Slides template or a PowerPoint template. Incorporate impressive visuals, symbols, images, and other charts. Modify or reorganize the text boxes as you desire. Experiment with shade schemes and font pairings. Alter, share or cooperate with other people on your work. Download Competitive Assessment Based On Market Share Residential And Commercial Building Slides PDF and find out how to give a successful presentation. Present a perfect display to your team and make your presentation unforgettable.
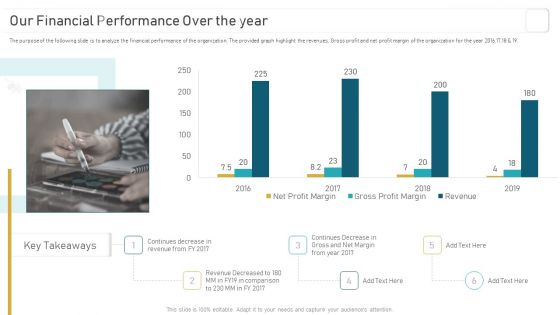
Deploying And Managing Recurring Our Financial Performance Over The Year Infographics PDF
The purpose of the following slide is to analyze the financial performance of the organization. The provided graph highlight the revenues, Gross profit and net profit margin of the organization for the year 2016,17,18 and 19. If you are looking for a format to display your unique thoughts, then the professionally designed Deploying And Managing Recurring Our Financial Performance Over The Year Infographics PDF is the one for you. You can use it as a Google Slides template or a PowerPoint template. Incorporate impressive visuals, symbols, images, and other charts. Modify or reorganize the text boxes as you desire. Experiment with shade schemes and font pairings. Alter, share or cooperate with other people on your work. Download Deploying And Managing Recurring Our Financial Performance Over The Year Infographics PDF and find out how to give a successful presentation. Present a perfect display to your team and make your presentation unforgettable.
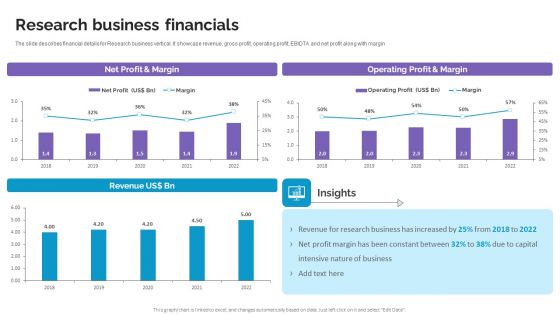
Research Business Financials Life Science And Healthcare Solutions Company Profile Information PDF
The slide describes financial details for Research business vertical. It showcase revenue, gross profit, operating profit, EBIDTA and net profit along with margin. If you are looking for a format to display your unique thoughts, then the professionally designed Research Business Financials Life Science And Healthcare Solutions Company Profile Information PDF is the one for you. You can use it as a Google Slides template or a PowerPoint template. Incorporate impressive visuals, symbols, images, and other charts. Modify or reorganize the text boxes as you desire. Experiment with shade schemes and font pairings. Alter, share or cooperate with other people on your work. Download Research Business Financials Life Science And Healthcare Solutions Company Profile Information PDF and find out how to give a successful presentation. Present a perfect display to your team and make your presentation unforgettable.
Dashboard For Cloud Storage Tracking Ppt PowerPoint Presentation File Layouts PDF
This slide represents the dashboard for cloud storage tracking by covering details of users, available workspaces, shared files, downloads, uploads, and moves. If you are looking for a format to display your unique thoughts, then the professionally designed Dashboard For Cloud Storage Tracking Ppt PowerPoint Presentation File Layouts PDF is the one for you. You can use it as a Google Slides template or a PowerPoint template. Incorporate impressive visuals, symbols, images, and other charts. Modify or reorganize the text boxes as you desire. Experiment with shade schemes and font pairings. Alter, share or cooperate with other people on your work. Download Dashboard For Cloud Storage Tracking Ppt PowerPoint Presentation File Layouts PDF and find out how to give a successful presentation. Present a perfect display to your team and make your presentation unforgettable.
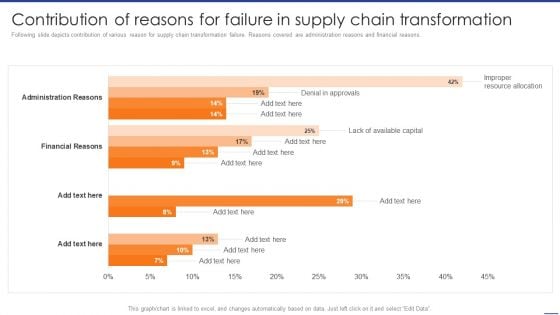
Digital Transformation Of Supply Contribution Of Reasons For Failure In Supply Chain Guidelines PDF
Following slide depicts contribution of various reason for supply chain transformation failure. Reasons covered are administration reasons and financial reasons. If you are looking for a format to display your unique thoughts, then the professionally designed Digital Transformation Of Supply Contribution Of Reasons For Failure In Supply Chain Guidelines PDF is the one for you. You can use it as a Google Slides template or a PowerPoint template. Incorporate impressive visuals, symbols, images, and other charts. Modify or reorganize the text boxes as you desire. Experiment with shade schemes and font pairings. Alter, share or cooperate with other people on your work. Download Digital Transformation Of Supply Contribution Of Reasons For Failure In Supply Chain Guidelines PDF and find out how to give a successful presentation. Present a perfect display to your team and make your presentation unforgettable.

Engineering Enterprise Competitive Competitor Comparison Topics PDF
The slide highlights the competitor comparison for top competitors. It compares companies on the basis of global market share, revenue, employee count, location served and services offered. If you are looking for a format to display your unique thoughts, then the professionally designed Engineering Enterprise Competitive Competitor Comparison Topics PDF is the one for you. You can use it as a Google Slides template or a PowerPoint template. Incorporate impressive visuals, symbols, images, and other charts. Modify or reorganize the text boxes as you desire. Experiment with shade schemes and font pairings. Alter, share or cooperate with other people on your work. Download Engineering Enterprise Competitive Competitor Comparison Topics PDF and find out how to give a successful presentation. Present a perfect display to your team and make your presentation unforgettable.
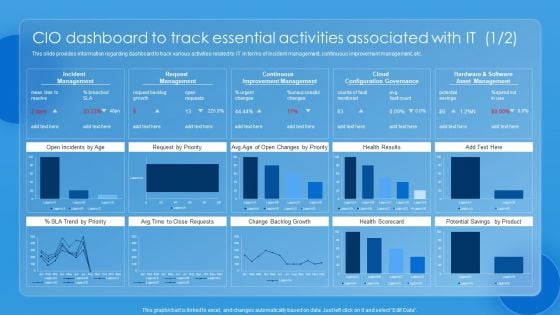
Key CIO Initiatives CIO Dashboard To Track Essential Activities Associated With IT Portrait PDF
This slide provides information regarding dashboard to track various activities related to IT in terms of incident management, continuous improvement management, etc. If you are looking for a format to display your unique thoughts, then the professionally designed Key CIO Initiatives CIO Dashboard To Track Essential Activities Associated With IT Portrait PDF is the one for you. You can use it as a Google Slides template or a PowerPoint template. Incorporate impressive visuals, symbols, images, and other charts. Modify or reorganize the text boxes as you desire. Experiment with shade schemes and font pairings. Alter, share or cooperate with other people on your work. Download Key CIO Initiatives CIO Dashboard To Track Essential Activities Associated With IT Portrait PDF and find out how to give a successful presentation. Present a perfect display to your team and make your presentation unforgettable.
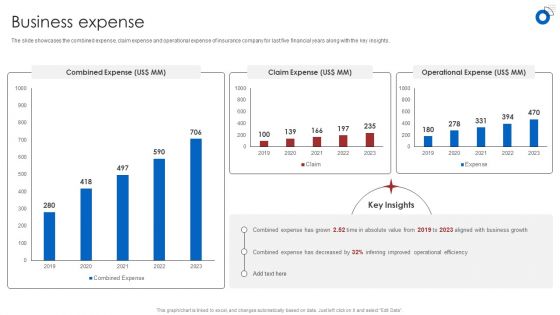
Insurance Business Financial Analysis Business Expense Ppt Show Rules PDF
The slide showcases the combined expense, claim expense and operational expense of insurance company for last five financial years along with the key insights. If you are looking for a format to display your unique thoughts, then the professionally designed Insurance Business Financial Analysis Business Expense Ppt Show Rules PDF is the one for you. You can use it as a Google Slides template or a PowerPoint template. Incorporate impressive visuals, symbols, images, and other charts. Modify or reorganize the text boxes as you desire. Experiment with shade schemes and font pairings. Alter, share or cooperate with other people on your work. Download Insurance Business Financial Analysis Business Expense Ppt Show Rules PDF and find out how to give a successful presentation. Present a perfect display to your team and make your presentation unforgettable.
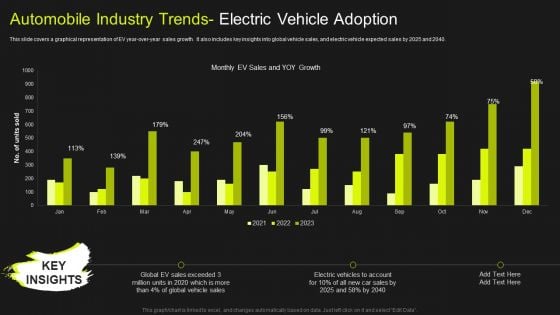
Global Automobile Market Analysis Automobile Industry Trends Electric Vehicle Adoption Mockup PDF
This slide covers a graphical representation of EV year-over-year sales growth. It also includes key insights into global vehicle sales, and electric vehicle expected sales by 2025 and 2040. If you are looking for a format to display your unique thoughts, then the professionally designed Global Automobile Market Analysis Automobile Industry Trends Electric Vehicle Adoption Mockup PDF is the one for you. You can use it as a Google Slides template or a PowerPoint template. Incorporate impressive visuals, symbols, images, and other charts. Modify or reorganize the text boxes as you desire. Experiment with shade schemes and font pairings. Alter, share or cooperate with other people on your work. Download Global Automobile Market Analysis Automobile Industry Trends Electric Vehicle Adoption Mockup PDF and find out how to give a successful presentation. Present a perfect display to your team and make your presentation unforgettable.
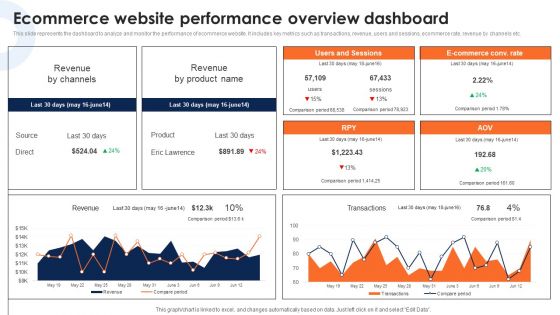
Ecommerce Website Performance Overview Dashboard Deploying Ecommerce Order Management Infographics PDF
This slide represents the dashboard to analyze and monitor the performance of ecommerce website. It includes key metrics such as transactions, revenue, users and sessions, ecommerce rate, revenue by channels etc.If you are looking for a format to display your unique thoughts, then the professionally designed Ecommerce Website Performance Overview Dashboard Deploying Ecommerce Order Management Infographics PDF is the one for you. You can use it as a Google Slides template or a PowerPoint template. Incorporate impressive visuals, symbols, images, and other charts. Modify or reorganize the text boxes as you desire. Experiment with shade schemes and font pairings. Alter, share or cooperate with other people on your work. Download Ecommerce Website Performance Overview Dashboard Deploying Ecommerce Order Management Infographics PDF and find out how to give a successful presentation. Present a perfect display to your team and make your presentation unforgettable.
Corporate Financial Performance Tracking Dashboard Diagrams PDF
This slide provides information regarding dashboard utilized by firm to monitor financial performance. The performance is tracked through revenues generated, vendors associated, profit generated, etc. If you are looking for a format to display your unique thoughts, then the professionally designed Corporate Financial Performance Tracking Dashboard Diagrams PDF is the one for you. You can use it as a Google Slides template or a PowerPoint template. Incorporate impressive visuals, symbols, images, and other charts. Modify or reorganize the text boxes as you desire. Experiment with shade schemes and font pairings. Alter, share or cooperate with other people on your work. Download Corporate Financial Performance Tracking Dashboard Diagrams PDF and find out how to give a successful presentation. Present a perfect display to your team and make your presentation unforgettable.
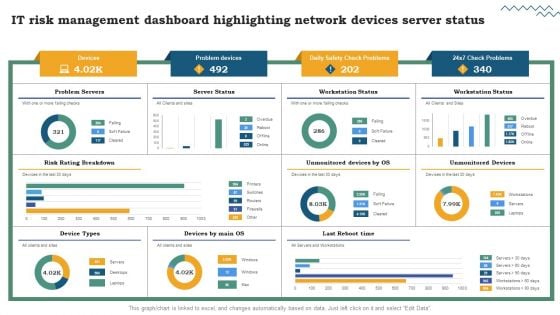
Risk Evaluation Of Information Technology Systems IT Risk Management Dashboard Highlighting Network Devices Server Status Professional PDF
If you are looking for a format to display your unique thoughts, then the professionally designed Risk Evaluation Of Information Technology Systems IT Risk Management Dashboard Highlighting Network Devices Server Status Professional PDF is the one for you. You can use it as a Google Slides template or a PowerPoint template. Incorporate impressive visuals, symbols, images, and other charts. Modify or reorganize the text boxes as you desire. Experiment with shade schemes and font pairings. Alter, share or cooperate with other people on your work. Download Risk Evaluation Of Information Technology Systems IT Risk Management Dashboard Highlighting Network Devices Server Status Professional PDF and find out how to give a successful presentation. Present a perfect display to your team and make your presentation unforgettable.
Cloud Dashboard For Tracking Project Sprints Ppt PowerPoint Presentation File Layouts PDF
The following slide depicts cloud dashboard for monitoring project sprints. It provides information about sprint blockers, resolved issues, under performers, sprint health, releases, sprint burndown, etc. If you are looking for a format to display your unique thoughts, then the professionally designed Cloud Dashboard For Tracking Project Sprints Ppt PowerPoint Presentation File Layouts PDF is the one for you. You can use it as a Google Slides template or a PowerPoint template. Incorporate impressive visuals, symbols, images, and other charts. Modify or reorganize the text boxes as you desire. Experiment with shade schemes and font pairings. Alter, share or cooperate with other people on your work. Download Cloud Dashboard For Tracking Project Sprints Ppt PowerPoint Presentation File Layouts PDF and find out how to give a successful presentation. Present a perfect display to your team and make your presentation unforgettable.
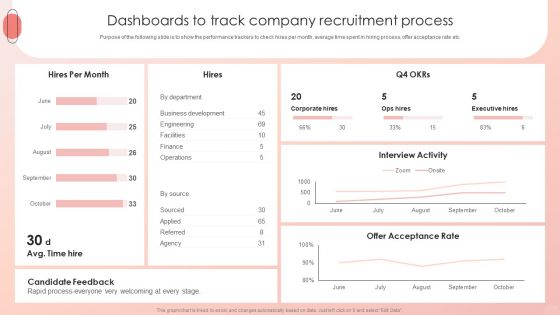
Improving HRM Process Dashboards To Track Company Recruitment Process Infographics PDF
Purpose of the following slide is to show the performance trackers to check hires per month, average time spent in hiring process, offer acceptance rate etc. If you are looking for a format to display your unique thoughts, then the professionally designed Improving HRM Process Dashboards To Track Company Recruitment Process Infographics PDF is the one for you. You can use it as a Google Slides template or a PowerPoint template. Incorporate impressive visuals, symbols, images, and other charts. Modify or reorganize the text boxes as you desire. Experiment with shade schemes and font pairings. Alter, share or cooperate with other people on your work. Download Improving HRM Process Dashboards To Track Company Recruitment Process Infographics PDF and find out how to give a successful presentation. Present a perfect display to your team and make your presentation unforgettable.
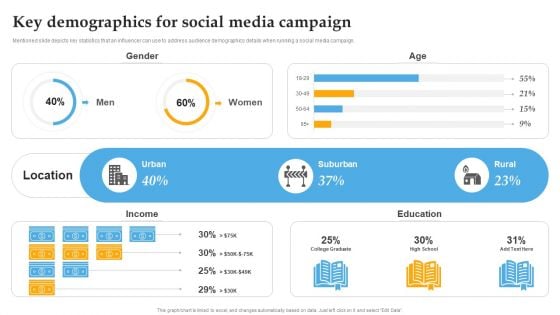
Key Demographics For Social Media Campaign Comprehensive Personal Brand Building Guide For Social Media Information PDF
Mentioned slide depicts key statistics that an influencer can use to address audience demographics details when running a social media campaign. If you are looking for a format to display your unique thoughts, then the professionally designed Key Demographics For Social Media Campaign Comprehensive Personal Brand Building Guide For Social Media Information PDF is the one for you. You can use it as a Google Slides template or a PowerPoint template. Incorporate impressive visuals, symbols, images, and other charts. Modify or reorganize the text boxes as you desire. Experiment with shade schemes and font pairings. Alter, share or cooperate with other people on your work. Download Key Demographics For Social Media Campaign Comprehensive Personal Brand Building Guide For Social Media Information PDF and find out how to give a successful presentation. Present a perfect display to your team and make your presentation unforgettable.
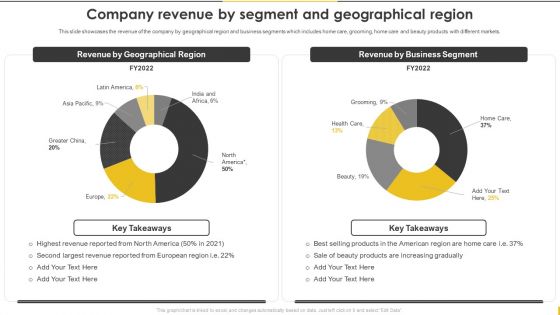
Customer Goods Production Company Revenue By Segment And Geographical Brochure PDF
This slide showcases the revenue of the company by geographical region and business segments which includes home care, grooming, home care and beauty products with different markets. If you are looking for a format to display your unique thoughts, then the professionally designed Customer Goods Production Company Revenue By Segment And Geographical Brochure PDF is the one for you. You can use it as a Google Slides template or a PowerPoint template. Incorporate impressive visuals, symbols, images, and other charts. Modify or reorganize the text boxes as you desire. Experiment with shade schemes and font pairings. Alter, share or cooperate with other people on your work. Download Customer Goods Production Company Revenue By Segment And Geographical Brochure PDF and find out how to give a successful presentation. Present a perfect display to your team and make your presentation unforgettable.
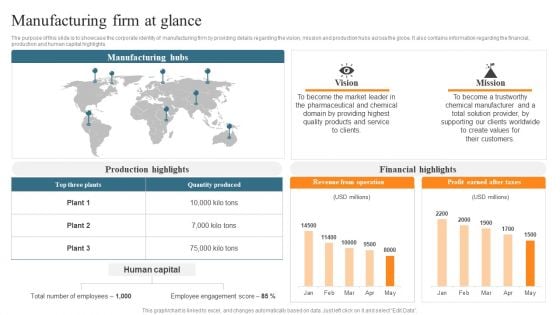
Leveraging Predictive Maintenance To Enhance Production Process Manufacturing Firm At Glance Elements PDF
The purpose of this slide is to showcase the corporate identity of manufacturing firm by providing details regarding the vision, mission and production hubs across the globe. It also contains information regarding the financial, production and human capital highlights. If you are looking for a format to display your unique thoughts, then the professionally designed Leveraging Predictive Maintenance To Enhance Production Process Manufacturing Firm At Glance Elements PDF is the one for you. You can use it as a Google Slides template or a PowerPoint template. Incorporate impressive visuals, symbols, images, and other charts. Modify or reorganize the text boxes as you desire. Experiment with shade schemes and font pairings. Alter, share or cooperate with other people on your work. Download Leveraging Predictive Maintenance To Enhance Production Process Manufacturing Firm At Glance Elements PDF and find out how to give a successful presentation. Present a perfect display to your team and make your presentation unforgettable.
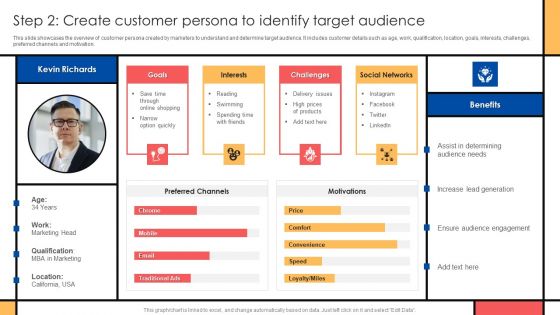
Guide To Create Advertising Campaign For Client Engagement Step 2 Create Customer Persona Background PDF
This slide showcases the overview of customer persona created by marketers to understand and determine target audience. It includes customer details such as age, work, qualification, location, goals, interests, challenges, preferred channels and motivation. If you are looking for a format to display your unique thoughts, then the professionally designed Guide To Create Advertising Campaign For Client Engagement Step 2 Create Customer Persona Background PDF is the one for you. You can use it as a Google Slides template or a PowerPoint template. Incorporate impressive visuals, symbols, images, and other charts. Modify or reorganize the text boxes as you desire. Experiment with shade schemes and font pairings. Alter, share or cooperate with other people on your work. Download Guide To Create Advertising Campaign For Client Engagement Step 2 Create Customer Persona Background PDF and find out how to give a successful presentation. Present a perfect display to your team and make your presentation unforgettable.
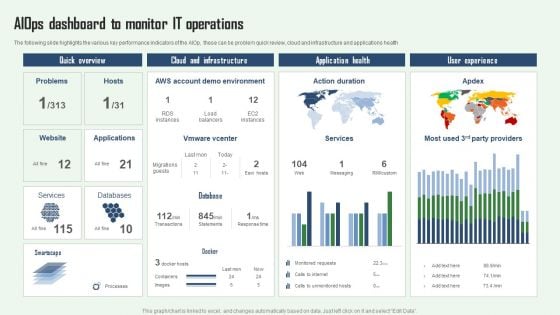
Aiops Dashboard To Monitor IT Operations Aiops Integration Summary Report Clipart PDF
The following slide highlights the various key performance indicators of the AIOp, these can be problem quick review, cloud and infrastructure and applications health. If you are looking for a format to display your unique thoughts, then the professionally designed Aiops Dashboard To Monitor IT Operations Aiops Integration Summary Report Clipart PDF is the one for you. You can use it as a Google Slides template or a PowerPoint template. Incorporate impressive visuals, symbols, images, and other charts. Modify or reorganize the text boxes as you desire. Experiment with shade schemes and font pairings. Alter, share or cooperate with other people on your work. Download Aiops Dashboard To Monitor IT Operations Aiops Integration Summary Report Clipart PDF and find out how to give a successful presentation. Present a perfect display to your team and make your presentation unforgettable.
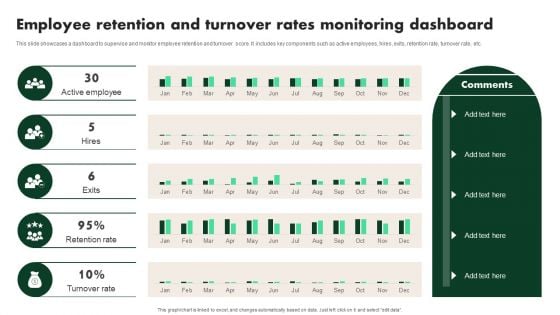
Creating Employee Value Proposition Employee Retention And Turnover Rates Monitoring Brochure PDF
This slide showcases a dashboard to supervise and monitor employee retention and turnover score. It includes key components such as active employees, hires, exits, retention rate, turnover rate, etc. If you are looking for a format to display your unique thoughts, then the professionally designed Creating Employee Value Proposition Employee Retention And Turnover Rates Monitoring Brochure PDF is the one for you. You can use it as a Google Slides template or a PowerPoint template. Incorporate impressive visuals, symbols, images, and other charts. Modify or reorganize the text boxes as you desire. Experiment with shade schemes and font pairings. Alter, share or cooperate with other people on your work. Download Creating Employee Value Proposition Employee Retention And Turnover Rates Monitoring Brochure PDF and find out how to give a successful presentation. Present a perfect display to your team and make your presentation unforgettable.


 Continue with Email

 Home
Home


