Revenue Dashboard
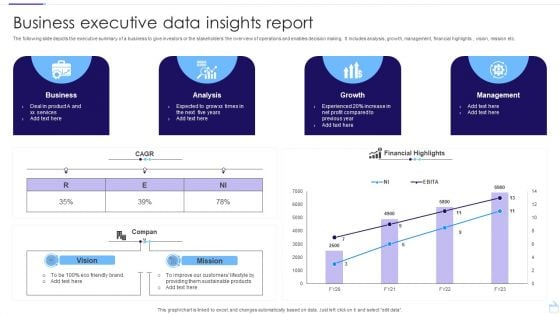
Business Executive Data Insights Report Pictures PDF
The following slide depicts the executive summary of a business to give investors or the stakeholders the overview of operations and enables decision making. It includes analysis, growth, management, financial highlights , vision, mission etc. Pitch your topic with ease and precision using this Business Executive Data Insights Report Pictures PDF. This layout presents information on Business, Analysis, Growth. It is also available for immediate download and adjustment. So, changes can be made in the color, design, graphics or any other component to create a unique layout.
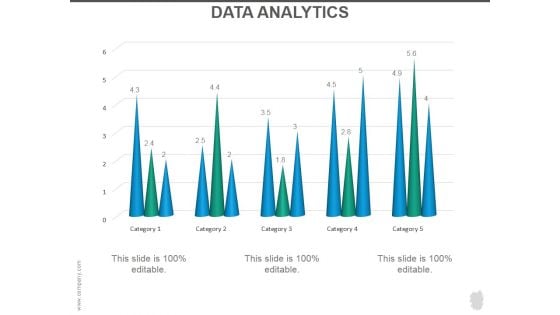
Data Analytics Ppt PowerPoint Presentation Graphics
This is a data analytics ppt powerpoint presentation graphics. This is a five stage process. The stages in this process are data analysis, business, marketing, success, graph.
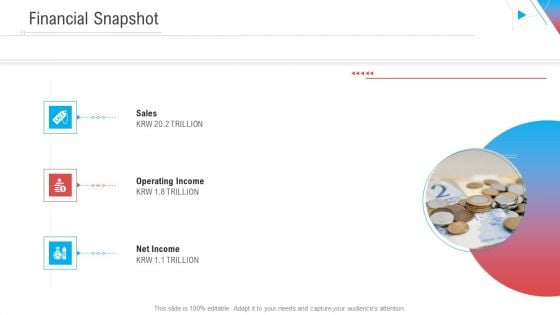
Company Outline Financial Snapshot Ppt Styles Grid PDF
This is a company outline financial snapshot ppt styles grid pdf template with various stages. Focus and dispense information on three stages using this creative set, that comes with editable features. It contains large content boxes to add your information on topics like sales, operating income, net income. You can also showcase facts, figures, and other relevant content using this PPT layout. Grab it now.
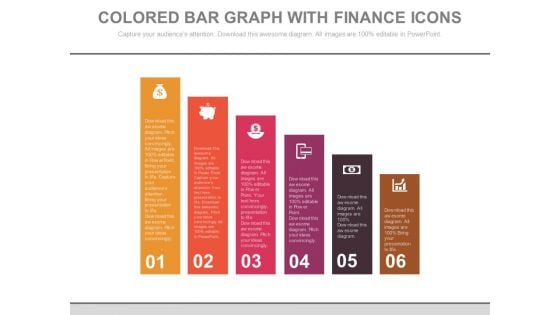
Bar Graph For Marketing Research Data Powerpoint Slides
This PowerPoint template has been designed with diagram of bar graph. This PPT slide can be used to prepare presentations for profit growth report and also for financial data analysis. You can download finance PowerPoint template to prepare awesome presentations.
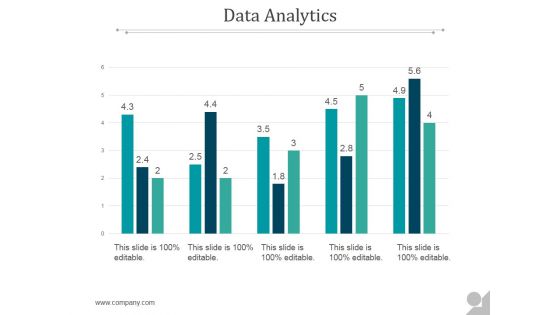
Data Analytics Ppt PowerPoint Presentation Themes
This is a data analytics ppt powerpoint presentation themes. This is a five stage process. The stages in this process are business, marketing, presentation, data analyst, management.
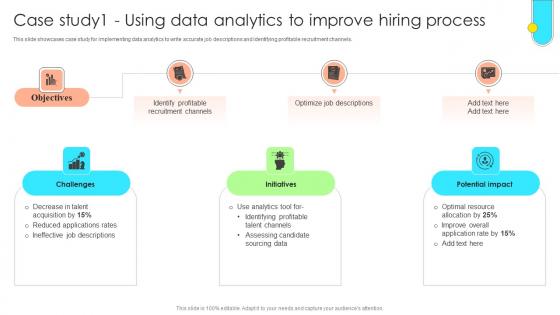
Data Driven Approach To Optimise Case Study1 Using Data Analytics To Improve CRP SS V
This slide showcases case study for implementing data analytics to write accurate job descriptions and identifying profitable recruitment channels. Whether you have daily or monthly meetings, a brilliant presentation is necessary. Data Driven Approach To Optimise Case Study1 Using Data Analytics To Improve CRP SS V can be your best option for delivering a presentation. Represent everything in detail using Data Driven Approach To Optimise Case Study1 Using Data Analytics To Improve CRP SS V and make yourself stand out in meetings. The template is versatile and follows a structure that will cater to your requirements. All the templates prepared by Slidegeeks are easy to download and edit. Our research experts have taken care of the corporate themes as well. So, give it a try and see the results. This slide showcases case study for implementing data analytics to write accurate job descriptions and identifying profitable recruitment channels.
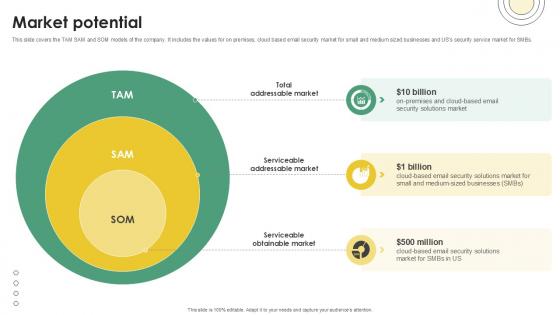
Market Potential Email And Data Protection Platform Capital Funding Pitch Deck PPT Presentation
This slide covers the TAM SAM and SOM models of the company. It includes the values for on premises, cloud based email security market for small and medium sized businesses and USs security service market for SMBs. Are you in need of a template that can accommodate all of your creative concepts This one is crafted professionally and can be altered to fit any style. Use it with Google Slides or PowerPoint. Include striking photographs, symbols, depictions, and other visuals. Fill, move around, or remove text boxes as desired. Test out color palettes and font mixtures. Edit and save your work, or work with colleagues. Download Market Potential Email And Data Protection Platform Capital Funding Pitch Deck PPT Presentation and observe how to make your presentation outstanding. Give an impeccable presentation to your group and make your presentation unforgettable. This slide covers the TAM SAM and SOM models of the company. It includes the values for on premises, cloud based email security market for small and medium sized businesses and USs security service market for SMBs.
Organization Financial Performance Report Icon Mockup PDF
Persuade your audience using this Organization Financial Performance Report Icon Mockup PDF. This PPT design covers three stages, thus making it a great tool to use. It also caters to a variety of topics including Organization Financial, Performance Report Icon. Download this PPT design now to present a convincing pitch that not only emphasizes the topic but also showcases your presentation skills.
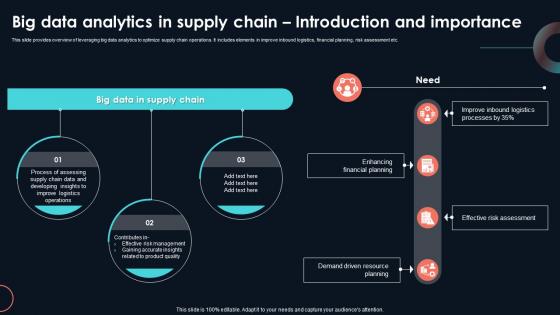
Big Data Analytics In Supply Chain Developing Strategic Insights Using Big Data Analytics SS V
This slide provides overview of leveraging big data analytics to optimize supply chain operations. It includes elements in improve inbound logistics, financial planning, risk assessment etc. Crafting an eye-catching presentation has never been more straightforward. Let your presentation shine with this tasteful yet straightforward Big Data Analytics In Supply Chain Developing Strategic Insights Using Big Data Analytics SS V template. It offers a minimalistic and classy look that is great for making a statement. The colors have been employed intelligently to add a bit of playfulness while still remaining professional. Construct the ideal Big Data Analytics In Supply Chain Developing Strategic Insights Using Big Data Analytics SS V that effortlessly grabs the attention of your audience Begin now and be certain to wow your customers This slide provides overview of leveraging big data analytics to optimize supply chain operations. It includes elements in improve inbound logistics, financial planning, risk assessment etc.
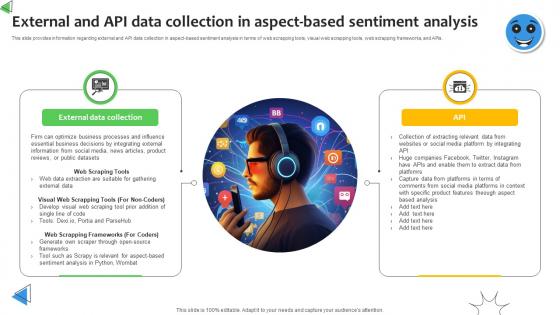
External And API Data Collection In Aspect Sentiment Analysis Demystified Understanding AI SS V
This slide provides information regarding external and API data collection in aspect-based sentiment analysis in terms of web scrapping tools, visual web scrapping tools, web scrapping frameworks, and APIs. Make sure to capture your audiences attention in your business displays with our gratis customizable External And API Data Collection In Aspect Sentiment Analysis Demystified Understanding AI SS V. These are great for business strategies, office conferences, capital raising or task suggestions. If you desire to acquire more customers for your tech business and ensure they stay satisfied, create your own sales presentation with these plain slides. This slide provides information regarding external and API data collection in aspect-based sentiment analysis in terms of web scrapping tools, visual web scrapping tools, web scrapping frameworks, and APIs.
Business Research And Analysis Ppt PowerPoint Presentation Ideas Graphics Design
This is a business research and analysis ppt powerpoint presentation ideas graphics design. This is a three stage process. The stages in this process are support, assistance, hand holding.

Emerging Trends In Venture Capital Fund Raising Raising Venture Capital A Holistic Approach Fin SS V
This slide highlights the latest trends in the field of venture capital fundraising, giving insights into potential opportunities for investors and entrepreneurs. Top trends include sustainability investment, remote workforce, healthcare, crypto, etc. Do you have an important presentation coming up Are you looking for something that will make your presentation stand out from the rest Look no further than Emerging Trends In Venture Capital Fund Raising Raising Venture Capital A Holistic Approach Fin SS V. With our professional designs, you can trust that your presentation will pop and make delivering it a smooth process. And with Slidegeeks, you can trust that your presentation will be unique and memorable. So why wait Grab Emerging Trends In Venture Capital Fund Raising Raising Venture Capital A Holistic Approach Fin SS V today and make your presentation stand out from the rest This slide highlights the latest trends in the field of venture capital fundraising, giving insights into potential opportunities for investors and entrepreneurs. Top trends include sustainability investment, remote workforce, healthcare, crypto, etc.
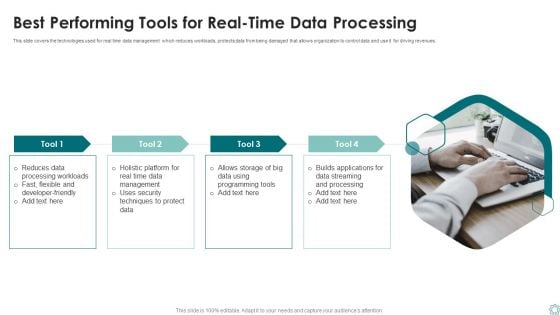
Best Performing Tools For Real Time Data Processing Ppt Inspiration Information PDF
This slide covers the technologies used for real time data management which reduces workloads, protects data from being damaged that allows organization to control data and use it for driving revenues. Persuade your audience using this Best Performing Tools For Real Time Data Processing Ppt Inspiration Information PDF. This PPT design covers four stages, thus making it a great tool to use. It also caters to a variety of topics including Reduces Data, Flexible And Developer Friendly, Programming Tools, Data Streaming. Download this PPT design now to present a convincing pitch that not only emphasizes the topic but also showcases your presentation skills.
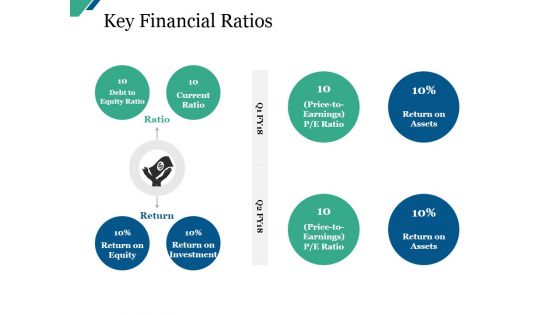
Key Financial Ratios Ppt PowerPoint Presentation Infographic Template Master Slide
This is a key financial ratios ppt powerpoint presentation infographic template master slide. This is a eight stage process. The stages in this process are debt to equity ratio, current ratio, return on equity, return on investment.
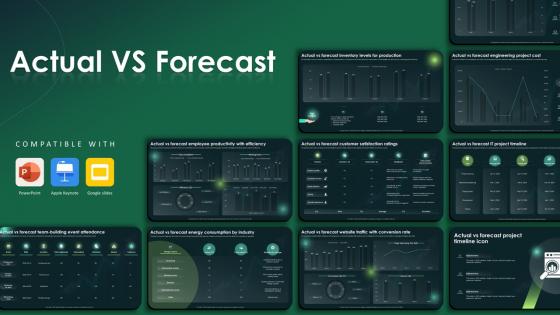
Actual Vs Forecast Powerpoint Ppt Template Bundles
This Actual Vs Forecast Powerpoint Ppt Template Bundles is designed to help you retain your audiences attention. This content-ready PowerPoint Template enables you to take your audience on a journey and share information in a way that is easier to recall. It helps you highlight the crucial parts of your work so that the audience does not get saddled with information download. This KPI Dashboard, Data Driven Marketing, Campaign Performance, Marketing Evaluation, Inventory Assessment-slide PPT Deck comes prepared with the graphs and charts you could need to showcase your information through visuals. You only need to enter your own data in them. Download this editable PowerPoint Theme and walk into that meeting with confidence. Our Actual vs. Forecast PowerPoint presentation can provide you with valuable business insights. Analyze sales figures, budgets, and financial predictions. Identify major differences, modify methods, and match projections with results to improve decision-making. Download now to accelerate your success.
Money Investment Strategy Ppt PowerPoint Presentation Summary Example Topics Cpb
This is a money investment strategy ppt powerpoint presentation summary example topics cpb. This is a five stage process. The stages in this process are money investment strategy.
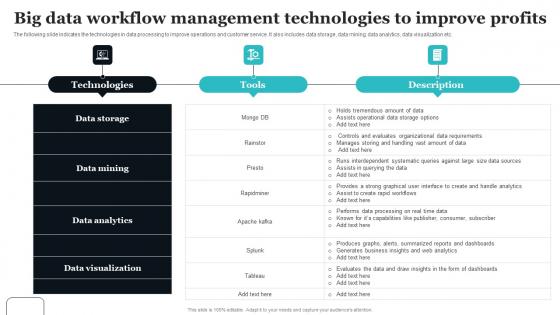
Big Data Workflow Management Technologies To Improve Profits Designs Pdf
The following slide indicates the technologies in data processing to improve operations and customer service. It also includes data storage, data mining, data analytics, data visualization etc. Pitch your topic with ease and precision using this Big Data Workflow Management Technologies To Improve Profits Designs Pdf This layout presents information on Data Storage, Data Analytics, Data Visualization It is also available for immediate download and adjustment. So, changes can be made in the color, design, graphics or any other component to create a unique layout. The following slide indicates the technologies in data processing to improve operations and customer service. It also includes data storage, data mining, data analytics, data visualization etc.
Business People Walking 3d Men Pushing Pie Marketing PowerPoint Templates
We present our business people walking 3d men pushing pie marketing PowerPoint templates.Download our People PowerPoint Templates because It will mark the footprints of your journey. Illustrate how they will lead you to your desired destination. Present our Business PowerPoint Templates because Our PowerPoint Templates and Slides will let your words and thoughts hit bullseye everytime. Download our Marketing PowerPoint Templates because Our PowerPoint Templates and Slides are created by a hardworking bunch of busybees. Always flitting around with solutions gauranteed to please. Use our Finance PowerPoint Templates because You can Inspire your team with our PowerPoint Templates and Slides. Let the force of your ideas flow into their minds. Download our Shapes PowerPoint Templates because It will Give impetus to the hopes of your colleagues. Our PowerPoint Templates and Slides will aid you in winning their trust.Use these PowerPoint slides for presentations relating to 3D,active, business, businessman, cartoon, character, chart, commerce, concept,development, diagram, earning, economy, finance, financial, gain, goal, growth,guy, human, illustration, income, investment, male, man, market, person, pie, piechart, planning, positive, presentation, profit, profitable, progress, push, render,rendering, report, research, results, revenue, sale, statement, statistics, stats,succeed, success, visual, white. The prominent colors used in the PowerPoint template are Blue , Green, White. We assure you our business people walking 3d men pushing pie marketing PowerPoint templates are topically designed to provide an attractive backdrop to any subject. You can be sure our concept PowerPoint templates and PPT Slides provide great value for your money. Be assured of finding the best projection to highlight your words. Use our business people walking 3d men pushing pie marketing PowerPoint templates are designed to make your presentations professional. We assure you our cartoon PowerPoint templates and PPT Slides are readymade to fit into any presentation structure. Use our business people walking 3d men pushing pie marketing PowerPoint templates are designed to make your presentations professional. Professionals tell us our cartoon PowerPoint templates and PPT Slides will impress their bosses and teams. Our Business People Walking 3d Men Pushing Pie Marketing PowerPoint Templates are not just a cosmetic appliance. They are an actual aid to education.
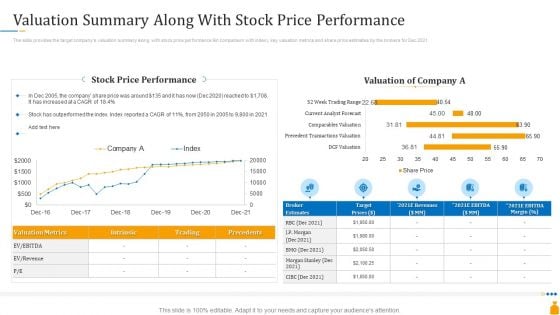
Financial Banking PPT Valuation Summary Along With Stock Price Performance Ideas PDF
The slide provides the target companys valuation summary along with stock price performance 9in comparison with index, key valuation metrics and share price estimates by the brokers for Dec 2021. Deliver and pitch your topic in the best possible manner with this financial banking ppt valuation summary along with stock price performance ideas pdf. Use them to share invaluable insights on target, revenues, valuation metrics and impress your audience. This template can be altered and modified as per your expectations. So, grab it now.

Key Evaluation Metrics Ppt Slides
This is a key evaluation metrics ppt slides. This is a five stage process. The stages in this process are business, finance, marketing, symbol.
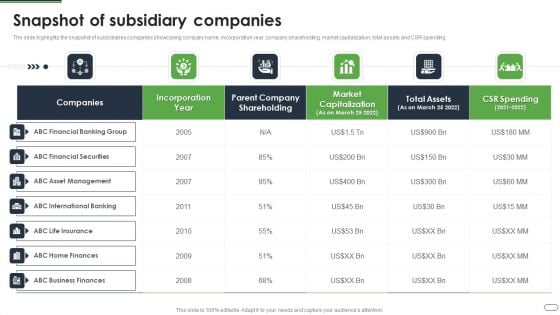
Financial Solutions Company Profile Snapshot Of Subsidiary Companies Graphics PDF
The slide highlights the snapshot of subsidiaries companies showcasing company name, incorporation year, company shareholding, market capitalization, total assets and CSR spending Deliver and pitch your topic in the best possible manner with this Financial Solutions Company Profile Snapshot Of Subsidiary Companies Graphics PDF Use them to share invaluable insights on Financial Banking, Financial Securities, Asset Management and impress your audience. This template can be altered and modified as per your expectations. So, grab it now.

Business Diagram Data Driven Bar Graph And Pie Chart For Analysis PowerPoint Slide
This PowerPoint template displays technology gadgets with various business charts. Use this diagram slide, in your presentations to make business reports for statistical analysis. You may use this diagram to impart professional appearance to your presentations.
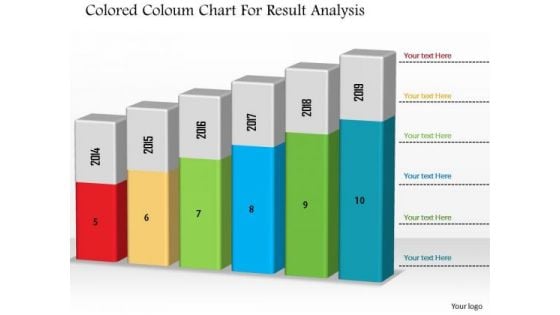
Business Diagram Colored Column Chart For Result Analysis PowerPoint Slide
This Power Point diagram has been designed with graphic of column chart. It contains diagram of bar char depicting annual business progress report. Use this diagram to build professional presentations for your viewers.
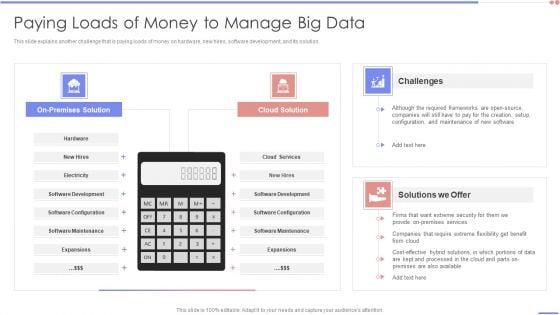
Data Analytics Management Paying Loads Of Money To Manage Big Data Guidelines PDF
This slide explains another challenge that is paying loads of money on hardware, new hires, software development, and its solution. Deliver and pitch your topic in the best possible manner with this Data Analytics Management Paying Loads Of Money To Manage Big Data Guidelines PDF. Use them to share invaluable insights on Software Development, Software Configuration, Software Maintenance and impress your audience. This template can be altered and modified as per your expectations. So, grab it now.
Financial Analysis Vector Icon Ppt PowerPoint Presentation Summary Structure PDF
Presenting this set of slides with name financial analysis vector icon ppt powerpoint presentation summary structure pdf. This is a three stage process. The stages in this process are financial analysis vector icon. This is a completely editable PowerPoint presentation and is available for immediate download. Download now and impress your audience.
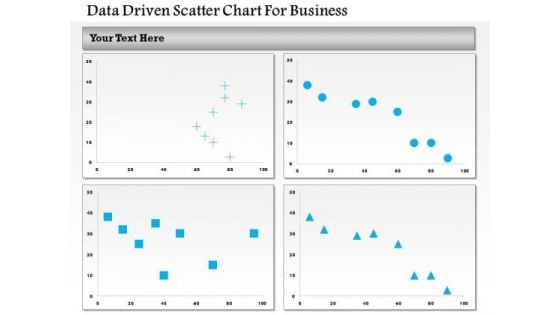
Business Diagram Data Driven Scatter Chart For Business PowerPoint Slide
This business diagram has been designed with four comparative charts. This slide suitable for data representation. You can also use this slide to present business analysis and reports. Use this diagram to present your views in a wonderful manner.
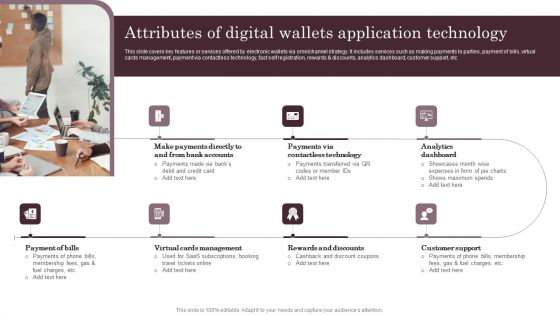
Omnichannel Services Solution In Financial Sector Attributes Of Digital Wallets Application Summary PDF
This slide covers key features or services offered by electronic wallets via omnichannel strategy. It includes services such as making payments to parties, payment of bills, virtual cards management, payment via contactless technology, fast self registration, rewards and discounts, analytics dashboard, customer support, etc. Present like a pro with Omnichannel Services Solution In Financial Sector Attributes Of Digital Wallets Application Summary PDF Create beautiful presentations together with your team, using our easy to use presentation slides. Share your ideas in real time and make changes on the fly by downloading our templates. So whether you are in the office, on the go, or in a remote location, you can stay in sync with your team and present your ideas with confidence. With Slidegeeks presentation got a whole lot easier. Grab these presentations today.

Web Marketing Analysis Diagram Ppt Slides Design
This is a web marketing analysis diagram ppt slides design. This is a five stage process. The stages in this process are communication, global reach, growth, business plan, financial.
3 Years Business Planning For Market Analysis Ppt PowerPoint Presentation Outline Icons PDF
Persuade your audience using this 3 years business planning for market analysis ppt powerpoint presentation outline icons pdf. This PPT design covers three stages, thus making it a great tool to use. It also caters to a variety of topics including analyzing market for knowing current trends, questionnaire prepared for getting, customers information, implementing strategies for improving business revenues, developing plans for achieving business objectives, identifying growth opportunities. Download this PPT design now to present a convincing pitch that not only emphasizes the topic but also showcases your presentation skills.
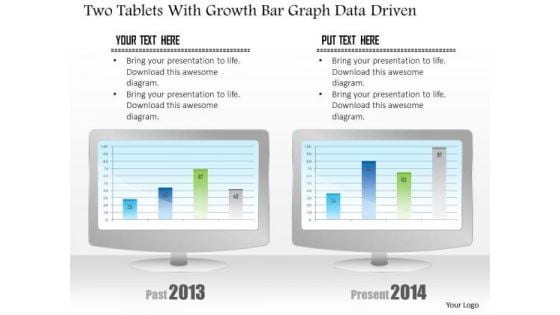
Business Diagram Two Tablets With Growth Bar Graph Data Driven PowerPoint Slide
This business diagram has been designed with comparative charts on tablets. This slide suitable for data representation. You can also use this slide to present business reports and information. Use this diagram to present your views in a wonderful manner.
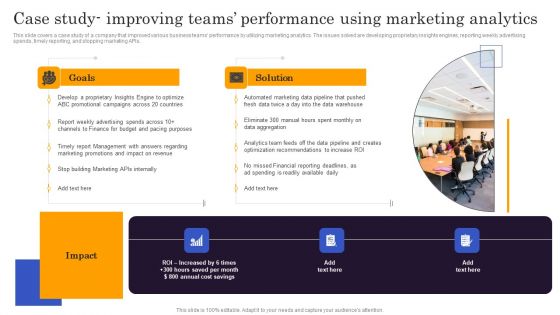
Marketers Guide To Data Analysis Optimization Case Study Improving Teams Performance Using Marketing Professional PDF
This slide covers a case study of a company that improved various business teams performance by utilizing marketing analytics. The issues solved are developing proprietary insights engines, reporting weekly advertising spends, timely reporting, and stopping marketing APIs. Make sure to capture your audiences attention in your business displays with our gratis customizable Marketers Guide To Data Analysis Optimization Case Study Improving Teams Performance Using Marketing Professional PDF. These are great for business strategies, office conferences, capital raising or task suggestions. If you desire to acquire more customers for your tech business and ensure they stay satisfied, create your own sales presentation with these plain slides.
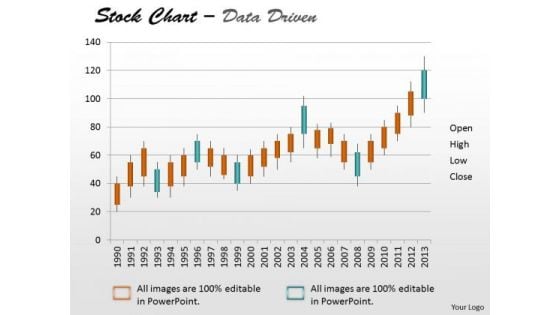
Data Analysis Template Driven Stock Chart For Market Trends PowerPoint Slides Templates
Drive Your Team Along The Road To Success. Take The Wheel With Our data analysis template driven stock chart for market trends powerpoint slides Templates .
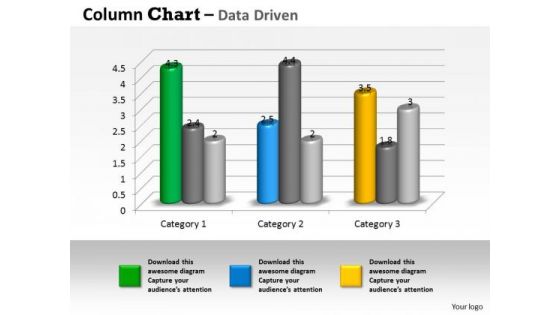
Examples Of Data Analysis Market 3d Business Trend Series Chart PowerPoint Templates
Duct It Through With Our examples of data analysis market 3d business trend series chart Powerpoint Templates . Your Ideas Will Reach Into Their Minds Intact.
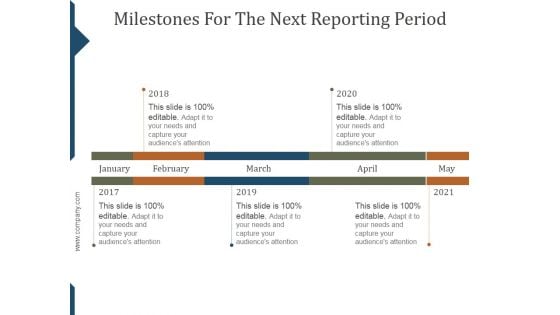
Milestones For The Next Reporting Period Template Ppt PowerPoint Presentation Background Images
This is a milestones for the next reporting period template ppt powerpoint presentation background images. This is a six stage process. The stages in this process are jan, feb, mar, apr, may, jun.
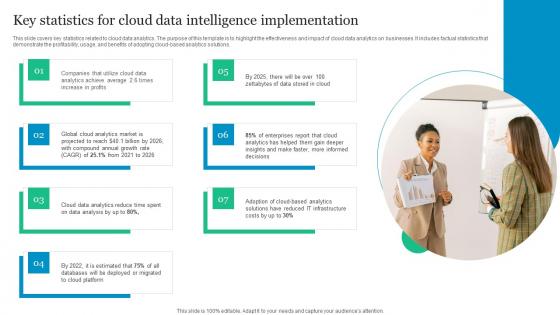
Key Statistics For Cloud Data Intelligence Implementation Download Pdf
This slide covers key statistics related to cloud data analytics. The purpose of this template is to highlight the effectiveness and impact of cloud data analytics on businesses. It includes factual statistics that demonstrate the profitability, usage, and benefits of adopting cloud based analytics solutions. Showcasing this set of slides titled Key Statistics For Cloud Data Intelligence Implementation Download Pdf. The topics addressed in these templates are Analytics Achieve Average, Growth Rate, Global Cloud Analytics. All the content presented in this PPT design is completely editable. Download it and make adjustments in color, background, font etc. as per your unique business setting. This slide covers key statistics related to cloud data analytics. The purpose of this template is to highlight the effectiveness and impact of cloud data analytics on businesses. It includes factual statistics that demonstrate the profitability, usage, and benefits of adopting cloud based analytics solutions.
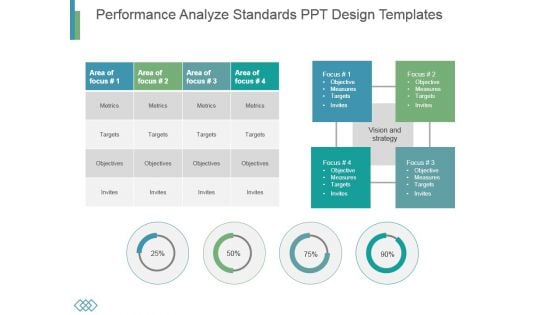
Performance Analyze Standards Ppt Design Templates
This is a performance analyze standards ppt design templates. This is a four stage process. The stages in this process are metrics, targets, objectives, invites.
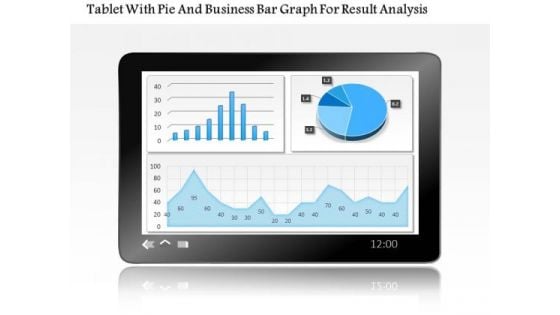
Business Diagram Tablet With Pie And Business Bar Graph For Result Analysis PowerPoint Slide
This PowerPoint template displays technology gadgets with various business charts. Use this diagram slide, in your presentations to make business reports for statistical analysis. You may use this diagram to impart professional appearance to your presentations.

Medical Care Organization Management And Statistical Analysis Summary PDF
This slide covers the details related to the healthcare company. The purpose of this template is to define the fact sheet used in the healthcare industry. It covers information about mission, vision, key metrics, revenues, etc. Showcasing this set of slides titled Medical Care Organization Management And Statistical Analysis Summary PDF. The topics addressed in these templates are Executive, Chief Medical Officer, Management. All the content presented in this PPT design is completely editable. Download it and make adjustments in color, background, font etc. as per your unique business setting.
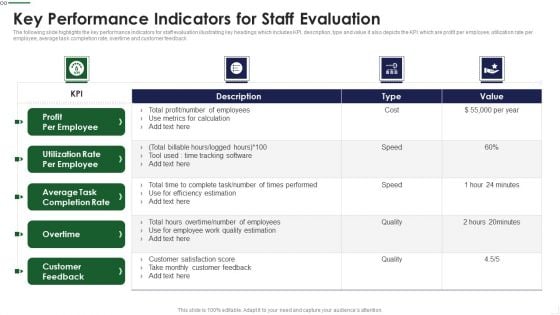
Key Performance Indicators For Staff Evaluation Infographics PDF
The following slide highlights the key performance Indicators for staff evaluation illustrating key headings which includes KPI, description, type and value it also depicts the KPI which are profit per employee, utilization rate per employee, average task completion rate, overtime and customer feedback Showcasing this set of slides titled Key Performance Indicators For Staff Evaluation Infographics PDF The topics addressed in these templates are Metrics Calculation, Times Performed, Customer Satisfaction All the content presented in this PPT design is completely editable. Download it and make adjustments in color, background, font etc. as per your unique business setting.
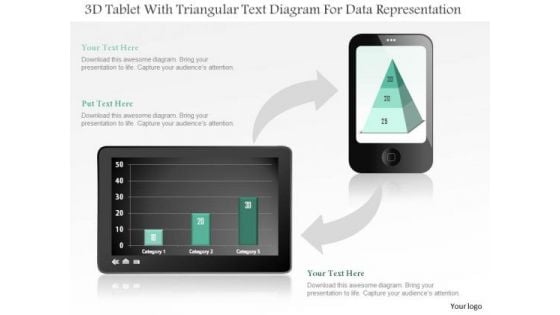
Business Diagram 3d Tablet With Triangular Text Diagram For Data Representation PowerPoint Slide
This business diagram displays bar graph on tablet and pyramid chart on mobile phone. Use this diagram, to make reports for interactive business presentations. Create professional presentations using this diagram.
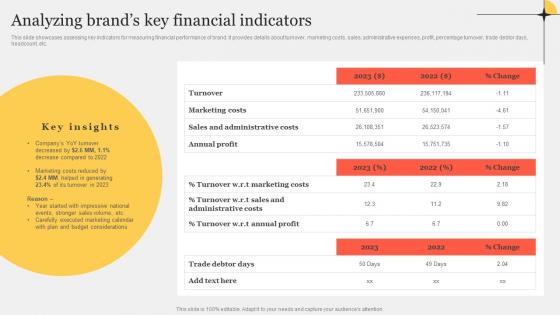
Analyzing Brands Key Financial Indicators Improving Customer Interaction Through Microsoft Pdf
This slide showcases assessing key indicators for measuring financial performance of brand. It provides details about turnover, marketing costs, sales, administrative expenses, profit, percentage turnover, trade debtor days, headcount, etc.Find highly impressive Analyzing Brands Key Financial Indicators Improving Customer Interaction Through Microsoft Pdf on Slidegeeks to deliver a meaningful presentation. You can save an ample amount of time using these presentation templates. No need to worry to prepare everything from scratch because Slidegeeks experts have already done a huge research and work for you. You need to download Analyzing Brands Key Financial Indicators Improving Customer Interaction Through Microsoft Pdf for your upcoming presentation. All the presentation templates are 100Precent editable and you can change the color and personalize the content accordingly. Download now. This slide showcases assessing key indicators for measuring financial performance of brand. It provides details about turnover, marketing costs, sales, administrative expenses, profit, percentage turnover, trade debtor days, headcount, etc.
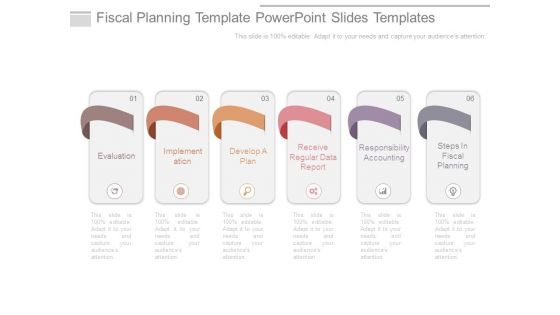
Fiscal Planning Template Powerpoint Slides Templates
This is a fiscal planning template powerpoint slides templates. This is a six stage process. The stages in this process are evaluation, implementation, develop a plan, receive regular data report, responsibility accounting, steps in fiscal planning.
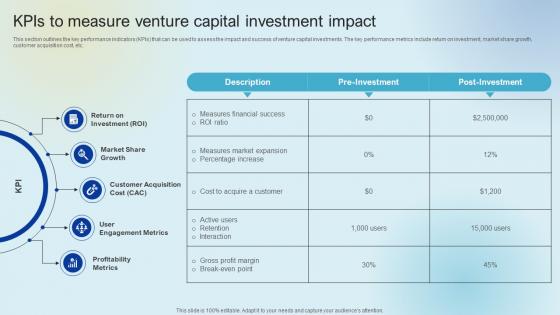
KPIs To Measure Venture Capital Investment Raising Venture Capital A Holistic Approach Fin SS V
This section outlines the key performance indicators KPIs that can be used to assess the impact and success of venture capital investments. The key performance metrics include return on investment, market share growth, customer acquisition cost, etc. This modern and well-arranged KPIs To Measure Venture Capital Investment Raising Venture Capital A Holistic Approach Fin SS V provides lots of creative possibilities. It is very simple to customize and edit with the Powerpoint Software. Just drag and drop your pictures into the shapes. All facets of this template can be edited with Powerpoint, no extra software is necessary. Add your own material, put your images in the places assigned for them, adjust the colors, and then you can show your slides to the world, with an animated slide included. This section outlines the key performance indicators KPIs that can be used to assess the impact and success of venture capital investments. The key performance metrics include return on investment, market share growth, customer acquisition cost, etc.
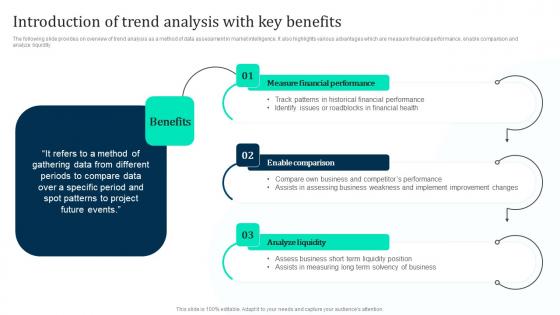
Introduction Of Trend Analysis Key Marketing Intelligence Guide Data Gathering Structure Pdf
The following slide provides on overview of trend analysis as a method of data assessment in market intelligence. It also highlights various advantages which are measure financial performance, enable comparison and analyze liquidity. Formulating a presentation can take up a lot of effort and time, so the content and message should always be the primary focus. The visuals of the PowerPoint can enhance the presenters message, so our Introduction Of Trend Analysis Key Marketing Intelligence Guide Data Gathering Structure Pdf was created to help save time. Instead of worrying about the design, the presenter can concentrate on the message while our designers work on creating the ideal templates for whatever situation is needed. Slidegeeks has experts for everything from amazing designs to valuable content, we have put everything into Introduction Of Trend Analysis Key Marketing Intelligence Guide Data Gathering Structure Pdf The following slide provides on overview of trend analysis as a method of data assessment in market intelligence. It also highlights various advantages which are measure financial performance, enable comparison and analyze liquidity.
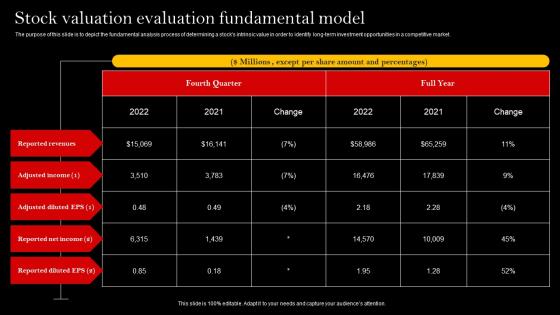
Stock Valuation Evaluation Fundamental Model Microsoft Pdf
The purpose of this slide is to depict the fundamental analysis process of determining a stocks intrinsic value in order to identify long-term investment opportunities in a competitive market. Showcasing this set of slides titled Stock Valuation Evaluation Fundamental Model Microsoft Pdf The topics addressed in these templates are Reported Revenues, Adjusted Income, Adjusted Diluted All the content presented in this PPT design is completely editable. Download it and make adjustments in color, background, font etc. as per your unique business setting. The purpose of this slide is to depict the fundamental analysis process of determining a stocks intrinsic value in order to identify long-term investment opportunities in a competitive market.
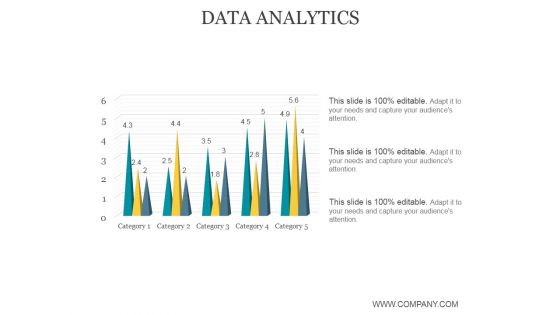
Data Analytics Ppt PowerPoint Presentation Guide
This is a data analytics ppt powerpoint presentation guide. This is a five stage process. The stages in this process are data analysis, business, marketing, success, graph.
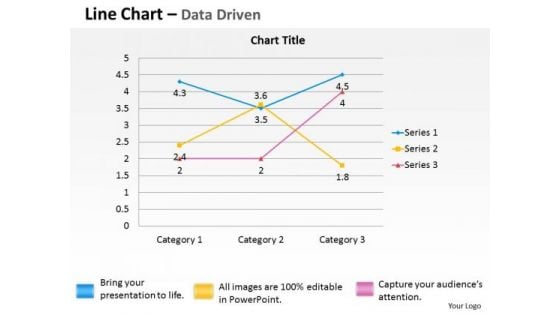
Quantitative Data Analysis Driven Economic Line Chart PowerPoint Slides Templates
Break The Deadlock With Our quantitative data analysis driven economic line chart powerpoint slides Templates . Let The Words Start To Flow.
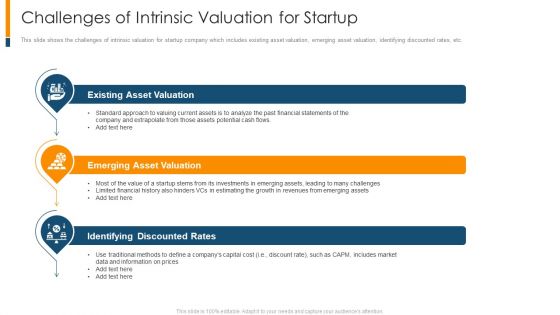
Challenges Of Intrinsic Valuation For Startup Ppt Portfolio Styles PDF
This slide shows the challenges of intrinsic valuation for startup company which includes existing asset valuation, emerging asset valuation, identifying discounted rates, etc. This is a challenges of intrinsic valuation for startup ppt portfolio styles pdf template with various stages. Focus and dispense information on three stages using this creative set, that comes with editable features. It contains large content boxes to add your information on topics like financial statements, growth in revenues, market data. You can also showcase facts, figures, and other relevant content using this PPT layout. Grab it now.

Money Exchange Electronic Transactions Powerpoint Templates
Our above slide contains illustration of money exchange. It helps to display electronic transactions. Use this diagram to impart more clarity to data and to create more sound impact on viewers.
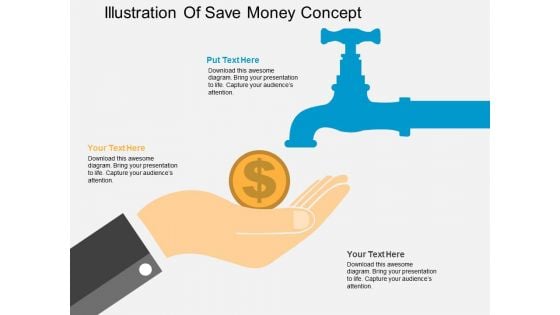
Illustration Of Save Money Concept Powerpoint Templates
This business slide has been designed with infographic square. These text boxes can be used for data representation. Use this diagram for your business presentations. Build a quality presentation for your viewers with this unique diagram.
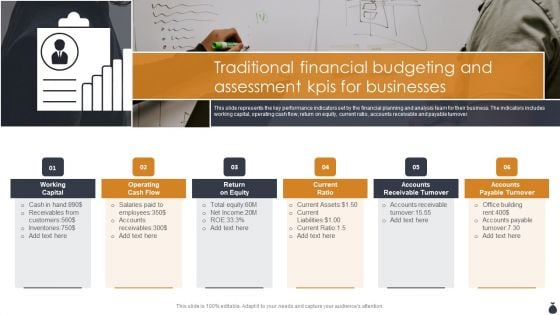
Traditional Financial Budgeting And Assessment Kpis For Businesses Infographics PDF
This slide represents the key performance indicators set by the financial planning and analysis team for their business. The indicators includes working capital, operating cash flow, return on equity, current ratio, accounts receivable and payable turnover. Presenting Traditional Financial Budgeting And Assessment Kpis For Businesses Infographics PDF to dispense important information. This template comprises six stages. It also presents valuable insights into the topics including Working Capital, Operating Cash Flow, Current Ratio. This is a completely customizable PowerPoint theme that can be put to use immediately. So, download it and address the topic impactfully.
Financial Analysis Calculator With Dollar Symbol Vector Icon Ppt PowerPoint Presentation File Example Topics PDF
Presenting this set of slides with name financial analysis calculator with dollar symbol vector icon ppt powerpoint presentation file example topics pdf. This is a three stage process. The stages in this process are financial analysis calculator with dollar symbol vector icon. This is a completely editable PowerPoint presentation and is available for immediate download. Download now and impress your audience.
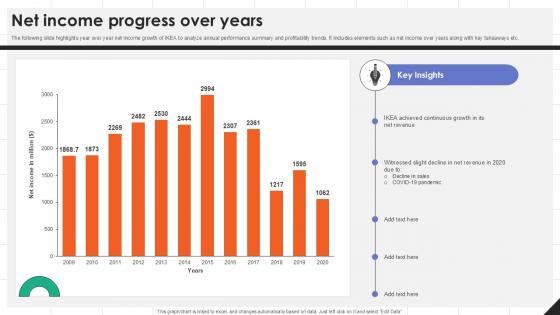
Net Income Progress Over Years IKEAs Successful Market Expansion PPT Example Strategy SS V
The following slide highlights year over year net income growth of IKEA to analyze annual performance summary and profitability trends. It includes elements such as net income over years along with key takeaways etc. Are you in need of a template that can accommodate all of your creative concepts This one is crafted professionally and can be altered to fit any style. Use it with Google Slides or PowerPoint. Include striking photographs, symbols, depictions, and other visuals. Fill, move around, or remove text boxes as desired. Test out color palettes and font mixtures. Edit and save your work, or work with colleagues. Download Net Income Progress Over Years IKEAs Successful Market Expansion PPT Example Strategy SS V and observe how to make your presentation outstanding. Give an impeccable presentation to your group and make your presentation unforgettable. The following slide highlights year over year net income growth of IKEA to analyze annual performance summary and profitability trends. It includes elements such as net income over years along with key takeaways etc.
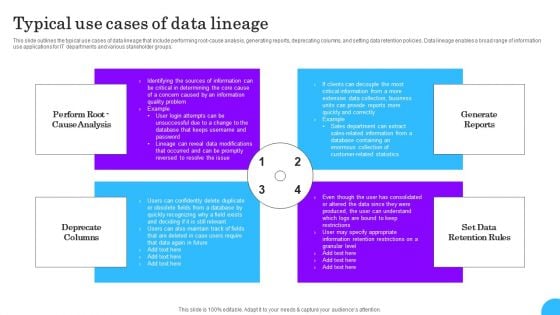
Comprehensive Analysis Of Different Data Lineage Classification Typical Use Cases Of Data Lineage Themes PDF
This slide outlines the typical use cases of data lineage that include performing root cause analysis, generating reports, deprecating columns, and setting data retention policies. Data lineage enables a broad range of information use applications for IT departments and various stakeholder groups. Make sure to capture your audiences attention in your business displays with our gratis customizable Comprehensive Analysis Of Different Data Lineage Classification Typical Use Cases Of Data Lineage Themes PDF. These are great for business strategies, office conferences, capital raising or task suggestions. If you desire to acquire more customers for your tech business and ensure they stay satisfied, create your own sales presentation with these plain slides.
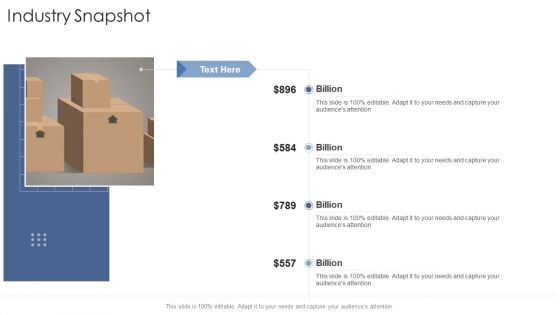
Industry Snapshot Billion Startup Business Strategy Ppt Pictures Images PDF
Presenting industry snapshot billion startup business strategy ppt pictures images pdf to provide visual cues and insights. Share and navigate important information on four stages that need your due attention. This template can be used to pitch topics like industry snapshot. In addtion, this PPT design contains high resolution images, graphics, etc, that are easily editable and available for immediate download.
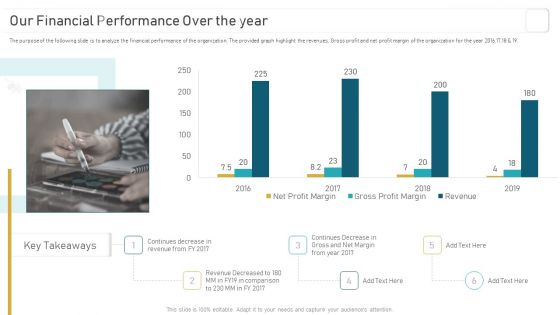
Deploying And Managing Recurring Our Financial Performance Over The Year Infographics PDF
The purpose of the following slide is to analyze the financial performance of the organization. The provided graph highlight the revenues, Gross profit and net profit margin of the organization for the year 2016,17,18 and 19. If you are looking for a format to display your unique thoughts, then the professionally designed Deploying And Managing Recurring Our Financial Performance Over The Year Infographics PDF is the one for you. You can use it as a Google Slides template or a PowerPoint template. Incorporate impressive visuals, symbols, images, and other charts. Modify or reorganize the text boxes as you desire. Experiment with shade schemes and font pairings. Alter, share or cooperate with other people on your work. Download Deploying And Managing Recurring Our Financial Performance Over The Year Infographics PDF and find out how to give a successful presentation. Present a perfect display to your team and make your presentation unforgettable.
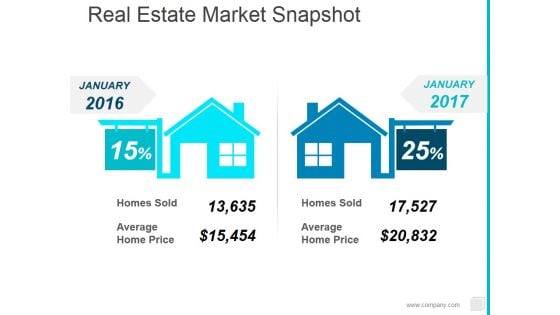
Real Estate Market Snapshot Ppt PowerPoint Presentation Outline Visuals
This is a real estate market snapshot ppt powerpoint presentation outline visuals. This is a two stage process. The stages in this process are homes sold, average home price, january.
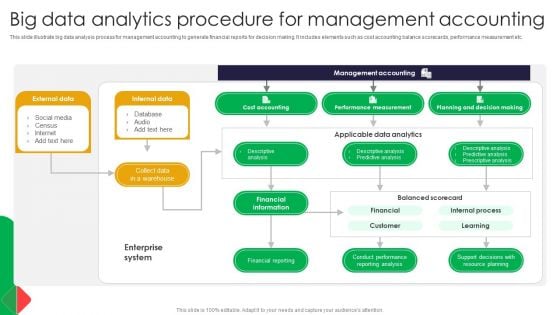
Big Data Analytics Procedure For Management Accounting Formats PDF
This slide illustrate big data analysis process for management accounting to generate financial reports for decision making. It includes elements such as cost accounting balance scorecards, performance measurement etc. Showcasing this set of slides titled Big Data Analytics Procedure For Management Accounting Formats PDF. The topics addressed in these templates are Accounting, Internal Data, Social Media. All the content presented in this PPT design is completely editable. Download it and make adjustments in color, background, font etc. as per your unique business setting.

Developing Strategic Insights Using Big Data Analytics Across Business Sectors Data Analytics CD V
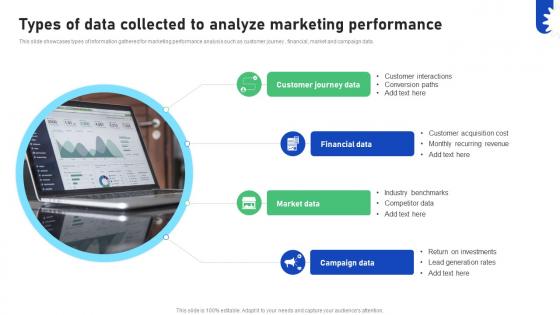
Improving Business Marketing Performance Types Of Data Collected To Analyze CRP DK SS V
This slide showcases types of information gathered for marketing performance analysis such as customer journey , financial, market and campaign data. Present like a pro with Improving Business Marketing Performance Types Of Data Collected To Analyze CRP DK SS V. Create beautiful presentations together with your team, using our easy-to-use presentation slides. Share your ideas in real-time and make changes on the fly by downloading our templates. So whether you are in the office, on the go, or in a remote location, you can stay in sync with your team and present your ideas with confidence. With Slidegeeks presentation got a whole lot easier. Grab these presentations today. This slide showcases types of information gathered for marketing performance analysis such as customer journey , financial, market and campaign data.


 Continue with Email

 Home
Home


