Revenue Dashboard
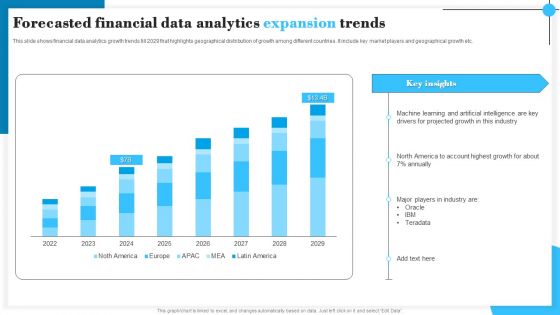
Forecasted Financial Data Analytics Expansion Trends Slides PDF
This slide shows financial data analytics growth trends till 2029 that highlights geographical distribution of growth among different countries. It include key market players and geographical growth etc. Showcasing this set of slides titled Forecasted Financial Data Analytics Expansion Trends Slides PDF. The topics addressed in these templates are Machine Learning, Projected Growth, Industry. All the content presented in this PPT design is completely editable. Download it and make adjustments in color, background, font etc. as per your unique business setting.
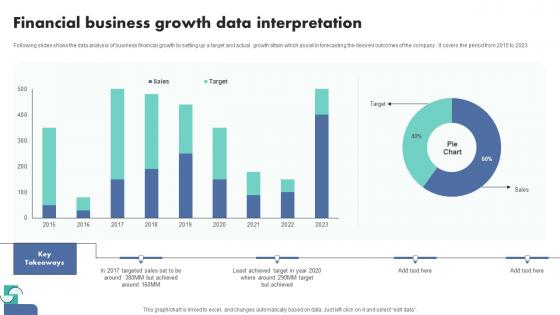
Financial Business Growth Data Interpretation Themes Pdf
Following slides shows the data analysis of business financial growth by setting up a target and actual growth attain which assist in forecasting the desired outcomes of the company . It covers the period from 2015 to 2023.Pitch your topic with ease and precision using this Financial Business Growth Data Interpretation Themes Pdf This layout presents information on Financial Business, Growth Data Interpretation It is also available for immediate download and adjustment. So, changes can be made in the color, design, graphics or any other component to create a unique layout. Following slides shows the data analysis of business financial growth by setting up a target and actual growth attain which assist in forecasting the desired outcomes of the company . It covers the period from 2015 to 2023.
Business Diagram Hour Glass With 3d Man And Icons PowerPoint Slide
This diagram displays 3d man with hour glass and icons. This diagram contains concept of communication and technology. Use this diagram to display business process workflows in any presentations.
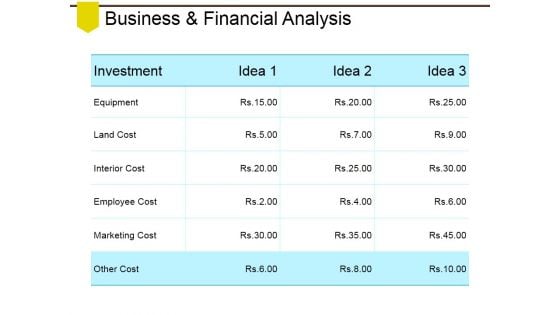
Business And Financial Analysis Ppt PowerPoint Presentation Layouts Portrait
This is a business and financial analysis ppt powerpoint presentation layouts portrait. This is a three stage process. The stages in this process are equipment, land cost, interior cost, employee cost, marketing cost.
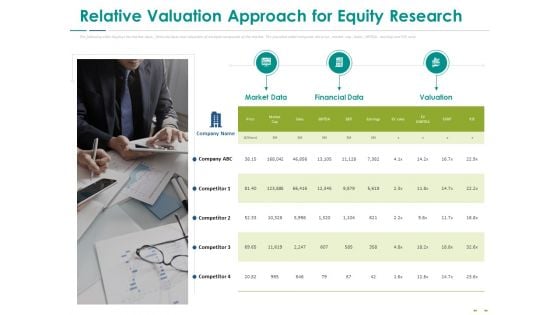
Stock Market Research Report Relative Valuation Approach For Equity Research Inspiration PDF
The following slide displays the market data, financial data and valuation of multiple companies of the market. The provided table compares the price, market cap, Sales, EBITDA, earning and P or E ratio. Presenting stock market research report relative valuation approach for equity research inspiration pdf to provide visual cues and insights. Share and navigate important information on one stages that need your due attention. This template can be used to pitch topics like market data, financial data, valuation. In addition, this PPT design contains high-resolution images, graphics, etc, that are easily editable and available for immediate download.
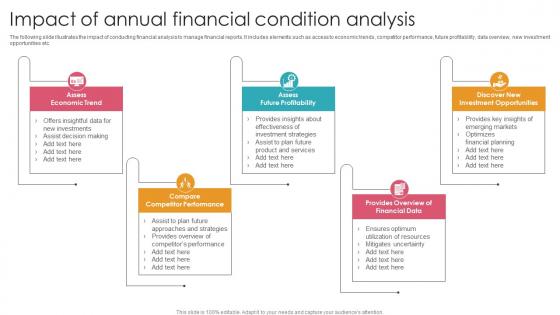
Impact Of Annual Financial Condition Analysis Template Pdf
The following slide illustrates the impact of conducting financial analysis to manage financial reports. It includes elements such as access to economic trends, competitor performance, future profitability, data overview, new investment opportunities etc. Showcasing this set of slides titled Impact Of Annual Financial Condition Analysis Template Pdf. The topics addressed in these templates are Assess Economic Trend, Assess Future Profitability, Discover Investment Opportunities. All the content presented in this PPT design is completely editable. Download it and make adjustments in color, background, font etc. as per your unique business setting. The following slide illustrates the impact of conducting financial analysis to manage financial reports. It includes elements such as access to economic trends, competitor performance, future profitability, data overview, new investment opportunities etc.
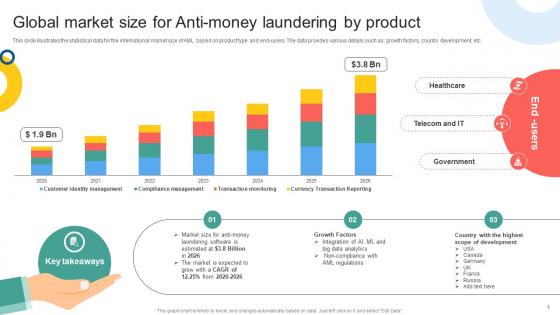
Global Market Size For Anti Money Laundering Mapping Out The Anti Money Fin SS V
This slide illustrates the statistical data for the international market size of AML based on product type and end-users. The data provides various details such as growth factors, country development, etc. Explore a selection of the finest Global Market Size For Anti Money Laundering Mapping Out The Anti Money Fin SS V here. With a plethora of professionally designed and pre-made slide templates, you can quickly and easily find the right one for your upcoming presentation. You can use our Global Market Size For Anti Money Laundering Mapping Out The Anti Money Fin SS V to effectively convey your message to a wider audience. Slidegeeks has done a lot of research before preparing these presentation templates. The content can be personalized and the slides are highly editable. Grab templates today from Slidegeeks. This slide illustrates the statistical data for the international market size of AML based on product type and end-users. The data provides various details such as growth factors, country development, etc.
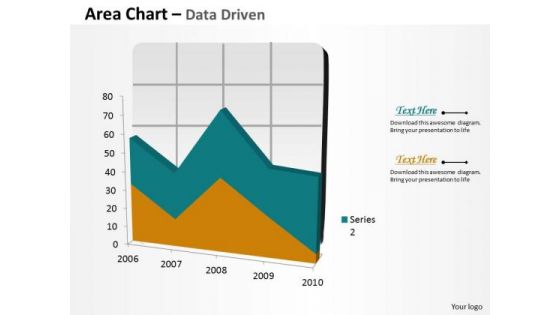
Data Analysis In Excel Area Chart For Business Process PowerPoint Templates
Your Grasp Of Economics Is Well Known. Help Your Audience Comprehend Issues With Our data analysis in excel area chart for business process Powerpoint Templates .
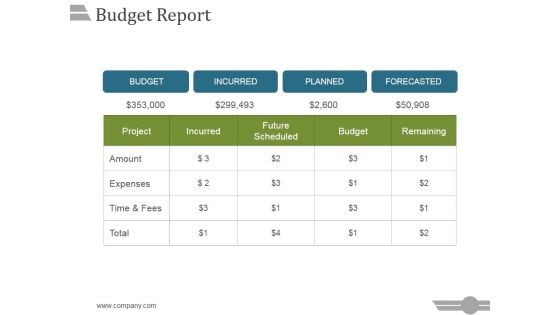
Budget Report Ppt PowerPoint Presentation Topics
This is a budget report ppt powerpoint presentation topics. This is a five stage process. The stages in this process are project, incurred, future scheduled, budget, remaining.
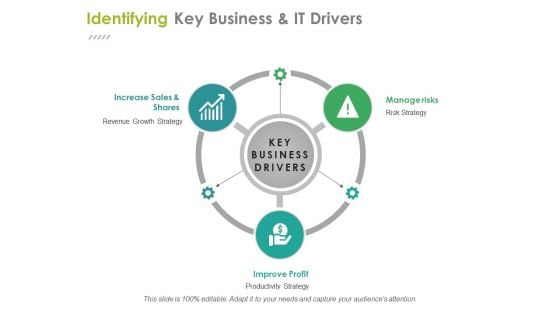
Identifying Key Business And It Drivers Ppt PowerPoint Presentation Ideas Files
This is a identifying key business and it drivers ppt powerpoint presentation ideas files. This is a three stage process. The stages in this process are increase sales and shares, improve profit, manage risks, business, management.
Managing Technical And Non Various Kpis For Tracking Business Performance
Mentioned slide provide insights into various key performance indicators to determine business performance. It includes KPIs such as business financials, website traffic, customer case, customer engagement, conversion rate, customer retention, customer bounce rate, employee turnover, etc. Make sure to capture your audiences attention in your business displays with our gratis customizable Managing Technical And Non Various Kpis For Tracking Business Performance. These are great for business strategies, office conferences, capital raising or task suggestions. If you desire to acquire more customers for your tech business and ensure they stay satisfied, create your own sales presentation with these plain slides. Mentioned slide provide insights into various key performance indicators to determine business performance. It includes KPIs such as business financials, website traffic, customer case, customer engagement, conversion rate, customer retention, customer bounce rate, employee turnover, etc.
Comprehensive Guide For Website Various Kpis For Tracking Business Performance
Mentioned slide provide insights into various key performance indicators to determine business performance. It includes KPIs such as business financials, website traffic, customer case, customer engagement, conversion rate, customer retention, customer bounce rate, employee turnover, etc. Make sure to capture your audiences attention in your business displays with our gratis customizable Comprehensive Guide For Website Various Kpis For Tracking Business Performance. These are great for business strategies, office conferences, capital raising or task suggestions. If you desire to acquire more customers for your tech business and ensure they stay satisfied, create your own sales presentation with these plain slides. Mentioned slide provide insights into various key performance indicators to determine business performance. It includes KPIs such as business financials, website traffic, customer case, customer engagement, conversion rate, customer retention, customer bounce rate, employee turnover, etc.
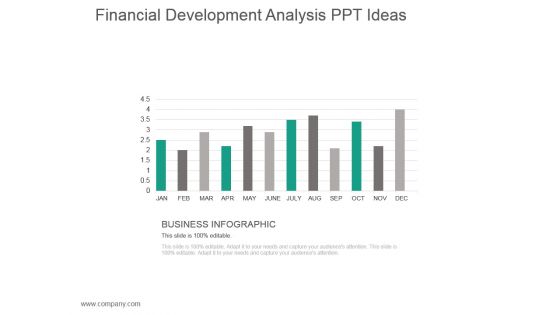
Financial Development Analysis Ppt Ideas
This is a financial development analysis ppt ideas. This is a twelve stage process. The stages in this process are business infographic.
Analytics Based Marketing Operation Model Icons Pdf
This slide shows operating model for data driven marketing strategy to gather valuable insights and implement same for increasing profit margins. It include steps such as gathering valuable insights, data management and team establishment etc.Showcasing this set of slides titled Analytics Based Marketing Operation Model Icons Pdf The topics addressed in these templates are Gathering Valuable Insights, Systematic Data Management, Team Establishment All the content presented in this PPT design is completely editable. Download it and make adjustments in color, background, font etc. as per your unique business setting. This slide shows operating model for data driven marketing strategy to gather valuable insights and implement same for increasing profit margins. It include steps such as gathering valuable insights, data management and team establishment etc.
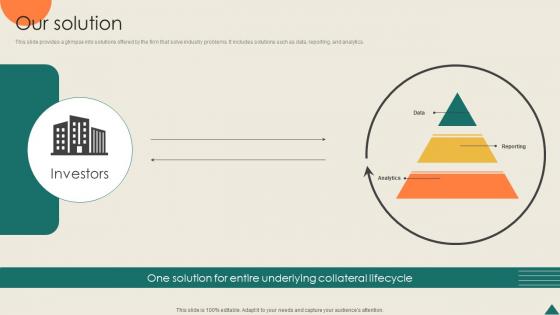
Our Solution Financial Analytics Platform Investor Elevator Pitch Deck
This slide provides a glimpse into solutions offered by the firm that solve industry problems. It includes solutions such as data, reporting, and analytics. Present like a pro with Our Solution Financial Analytics Platform Investor Elevator Pitch Deck. Create beautiful presentations together with your team, using our easy-to-use presentation slides. Share your ideas in real-time and make changes on the fly by downloading our templates. So whether you are in the office, on the go, or in a remote location, you can stay in sync with your team and present your ideas with confidence. With Slidegeeks presentation got a whole lot easier. Grab these presentations today. This slide provides a glimpse into solutions offered by the firm that solve industry problems. It includes solutions such as data, reporting, and analytics.
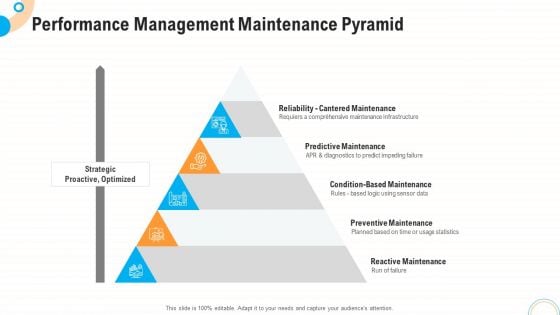
Fiscal And Operational Assessment Performance Management Maintenance Pyramid Infographics PDF
Presenting fiscal and operational assessment performance management maintenance pyramid infographics pdf to provide visual cues and insights. Share and navigate important information on five stages that need your due attention. This template can be used to pitch topics like predictive maintenance, condition based maintenance, preventive maintenance. In addtion, this PPT design contains high resolution images, graphics, etc, that are easily editable and available for immediate download.
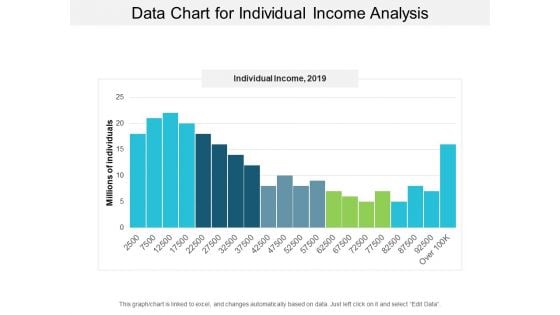
Data Chart For Individual Income Analysis Ppt PowerPoint Presentation Layouts Visual Aids
This is a data chart for individual income analysis ppt powerpoint presentation layouts visual aids. This is a five stage process. The stages in this process are financial analysis, quantitative, statistical modelling.
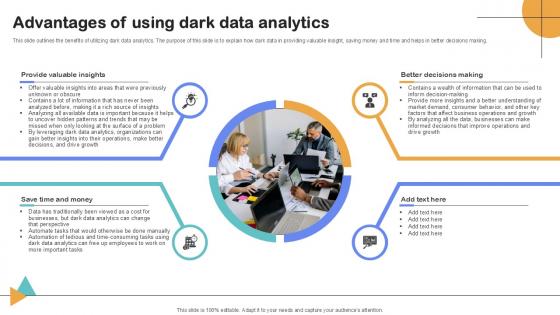
Advantages Of Using Dark Data Analytics Importance Of Unstructured Data Ppt Slide
This slide outlines the benefits of utilizing dark data analytics. The purpose of this slide is to explain how dark data in providing valuable insight, saving money and time and helps in better decisions making.Create an editable Advantages Of Using Dark Data Analytics Importance Of Unstructured Data Ppt Slide that communicates your idea and engages your audience. Whether you are presenting a business or an educational presentation, pre-designed presentation templates help save time. Advantages Of Using Dark Data Analytics Importance Of Unstructured Data Ppt Slide is highly customizable and very easy to edit, covering many different styles from creative to business presentations. Slidegeeks has creative team members who have crafted amazing templates. So, go and get them without any delay. This slide outlines the benefits of utilizing dark data analytics. The purpose of this slide is to explain how dark data in providing valuable insight, saving money and time and helps in better decisions making.
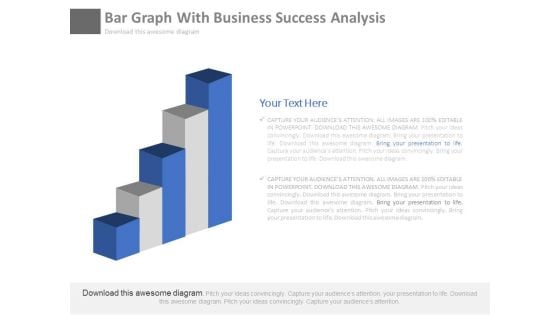
Bar Graph For Marketing Research Process Powerpoint Slides
This PowerPoint template has been designed with diagram of bar graph. This PPT slide can be used to prepare presentations for profit growth report and also for financial data analysis. You can download finance PowerPoint template to prepare awesome presentations.
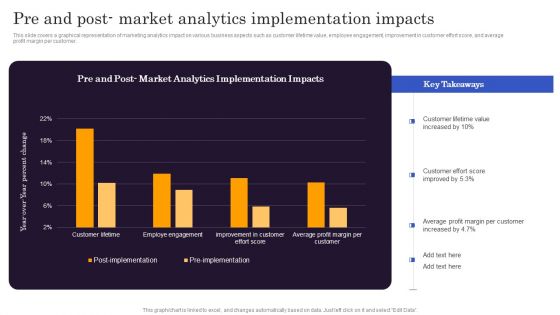
Marketers Guide To Data Analysis Optimization Pre And Post Market Analytics Implementation Impacts Formats PDF
This slide covers a graphical representation of marketing analytics impact on various business aspects such as customer lifetime value, employee engagement, improvement in customer effort score, and average profit margin per customer. Do you know about Slidesgeeks Marketers Guide To Data Analysis Optimization Pre And Post Market Analytics Implementation Impacts Formats PDF. These are perfect for delivering any kind od presentation. Using it, create PowerPoint presentations that communicate your ideas and engage audiences. Save time and effort by using our pre designed presentation templates that are perfect for a wide range of topic. Our vast selection of designs covers a range of styles, from creative to business, and are all highly customizable and easy to edit. Download as a PowerPoint template or use them as Google Slides themes.
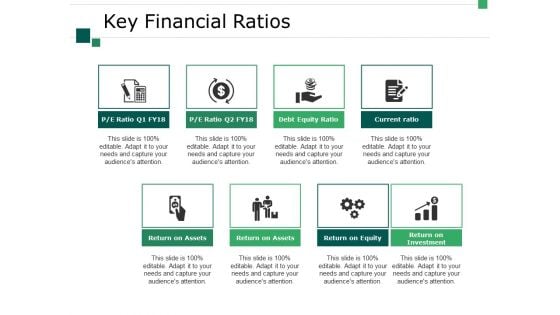
Key Financial Ratios Ppt PowerPoint Presentation Outline Slide
This is a key financial ratios ppt powerpoint presentation outline slide. This is a eight stage process. The stages in this process are return on assets, return on equity, return on investment, current ratio, debt equity ratio.

Donating Money To Charity Powerpoint Template
Our above slide contains ten staged colorful infographic. It helps to exhibit concepts of charity and donation. Use this diagram to impart more clarity to data and to create more sound impact on viewers.
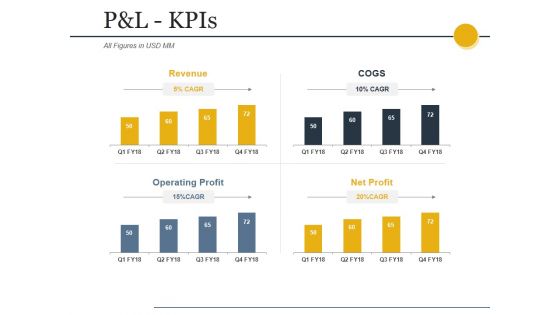
Pandl Kpis Ppt PowerPoint Presentation Infographic Template Layout
This is a pandl kpis ppt powerpoint presentation infographic template layout. This is a four stage process. The stages in this process are net sales, other income, total income, expenses, total material consumed.
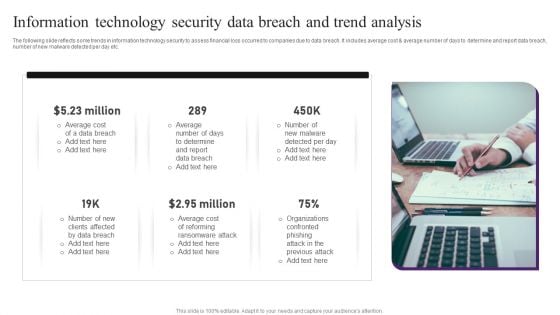
Information Technology Security Data Breach And Trend Analysis Professional PDF
The following slide reflects some trends in information technology security to assess financial loss occurred to companies due to data breach. It includes average cost and average number of days to determine and report data breach, number of new malware detected per day etc. Presenting Information Technology Security Data Breach And Trend Analysis Professional PDF to dispense important information. This template comprises six stages. It also presents valuable insights into the topics including Data Breach, Average Cost, Determine. This is a completely customizable PowerPoint theme that can be put to use immediately. So, download it and address the topic impactfully.
Expenses Report Business Income Tax Forms Ppt PowerPoint Presentation File Portfolio PDF
Pitch your topic with ease and precision using this expenses report business income tax forms ppt powerpoint presentation file portfolio pdf. This layout presents information on expenses report business income tax forms. It is also available for immediate download and adjustment. So, changes can be made in the color, design, graphics or any other component to create a unique layout.
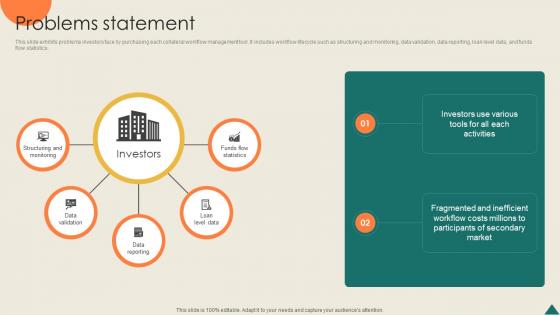
Problems Statement Financial Analytics Platform Investor Elevator Pitch Deck
This slide exhibits problems investors face by purchasing each collateral workflow management tool. It includes workflow lifecycle such as structuring and monitoring, data validation, data reporting, loan level data, and funds flow statistics. Slidegeeks is here to make your presentations a breeze with Problems Statement Financial Analytics Platform Investor Elevator Pitch Deck With our easy-to-use and customizable templates, you can focus on delivering your ideas rather than worrying about formatting. With a variety of designs to choose from, you are sure to find one that suits your needs. And with animations and unique photos, illustrations, and fonts, you can make your presentation pop. So whether you are giving a sales pitch or presenting to the board, make sure to check out Slidegeeks first This slide exhibits problems investors face by purchasing each collateral workflow management tool. It includes workflow lifecycle such as structuring and monitoring, data validation, data reporting, loan level data, and funds flow statistics.
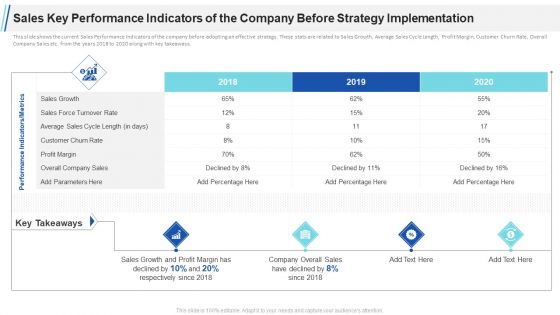
Sales Key Performance Indicators Of The Company Before Strategy Implementation Growth Ppt Infographic Template Microsoft PDF
This slide shows the current Sales Performance Indicators of the company before adopting an effective strategy. These stats are related to Sales Growth, Average Sales Cycle Length, Profit Margin, Customer Churn Rate, Overall Company Sales etc. from the years 2018 to 2020 along with key takeaways. Deliver and pitch your topic in the best possible manner with this sales key performance indicators of the company before strategy implementation growth ppt infographic template microsoft pdf. Use them to share invaluable insights on performance indicators metrics, sales growth, customer churn rate, profit margin, 2018 to 2020 and impress your audience. This template can be altered and modified as per your expectations. So, grab it now.
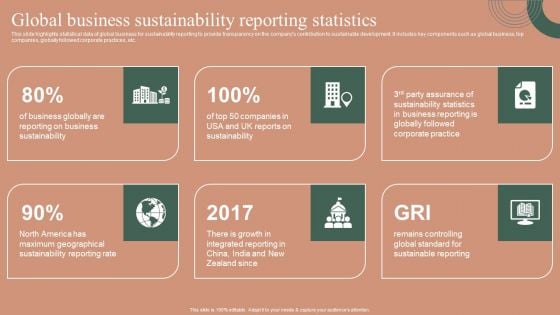
Global Business Sustainability Reporting Statistics Themes PDF
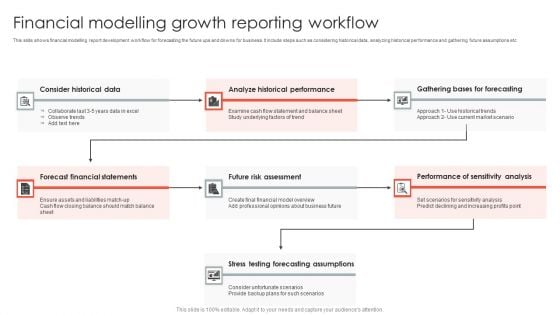
Financial Modelling Growth Reporting Workflow Formats PDF
This slide shows financial modelling report development workflow for forecasting the future ups and downs for business. It include steps such as considering historical data, analyzing historical performance and gathering future assumptions etc. Pitch your topic with ease and precision using this Financial Modelling Growth Reporting Workflow Formats PDF. This layout presents information on Forecast Financial Statements, Risk Assessment, Forecasting Assumptions. It is also available for immediate download and adjustment. So, changes can be made in the color, design, graphics or any other component to create a unique layout.
Financial Summary Ppt PowerPoint Presentation Icon Pictures
This is a financial summary ppt powerpoint presentation icon pictures. This is a seven stage process. The stages in this process are net sales, expenses, ebitda, profit after tax.
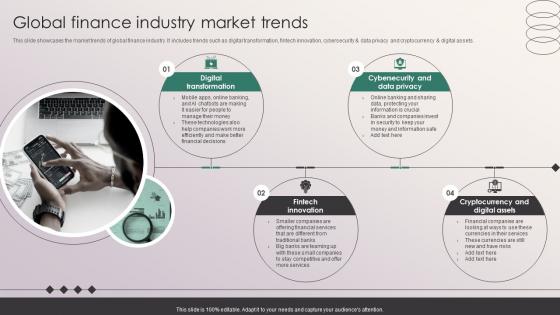
Global Finance Industry Market Trends Penetrating Markets With Financial Strategy SS V
This slide showcases the market trends of global finance industry. It includes trends such as digital transformation, fintech innovation, cybersecurity and data privacy and cryptocurrency and digital assets. If your project calls for a presentation, then Slidegeeks is your go to partner because we have professionally designed, easy to edit templates that are perfect for any presentation. After downloading, you can easily edit Global Finance Industry Market Trends Penetrating Markets With Financial Strategy SS V and make the changes accordingly. You can rearrange slides or fill them with different images. Check out all the handy templates This slide showcases the market trends of global finance industry. It includes trends such as digital transformation, fintech innovation, cybersecurity and data privacy and cryptocurrency and digital assets.
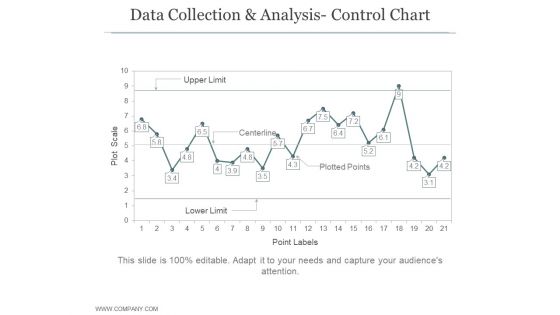
Data Collection And Analysis Control Chart Ppt PowerPoint Presentation Example File
This is a data collection and analysis control chart ppt powerpoint presentation example file. This is a four stage process. The stages in this process are business, strategy, marketing, bar graph, growth strategy.
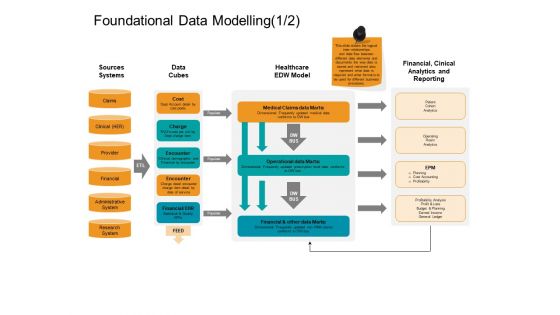
Facts Assessment Foundational Data Modelling Sources Introduction PDF
Presenting this set of slides with name facts assessment foundational data modelling sources introduction pdf. This is a one stage process. The stages in this process are sources systems, data cubes, healthcare, edw model, financial, cinical analytics and reporting, cost, charge, encounter. This is a completely editable PowerPoint presentation and is available for immediate download. Download now and impress your audience.
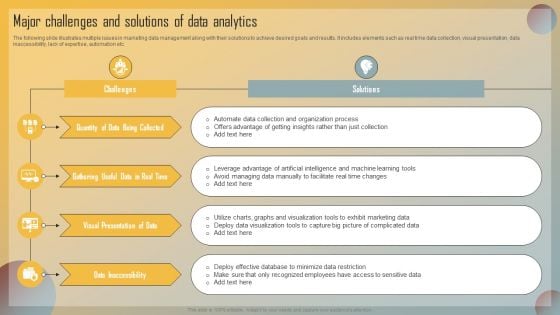
Guide For Marketing Analytics To Improve Decisions Major Challenges And Solutions Of Data Analytics Formats PDF
The following slide illustrates multiple issues in marketing data management along with their solutions to achieve desired goals and results. It includes elements such as real time data collection, visual presentation, data inaccessibility, lack of expertise, automation etc. Make sure to capture your audiences attention in your business displays with our gratis customizable Guide For Marketing Analytics To Improve Decisions Major Challenges And Solutions Of Data Analytics Formats PDF. These are great for business strategies, office conferences, capital raising or task suggestions. If you desire to acquire more customers for your tech business and ensure they stay satisfied, create your own sales presentation with these plain slides.

Business Data Analysis Inventory And Accounts Payable Days Ppt PowerPoint Presentation Layouts Professional
This is a business data analysis inventory and accounts payable days ppt powerpoint presentation layouts professional. This is a three stage process. The stages in this process are business analytics, ba, organizations data.
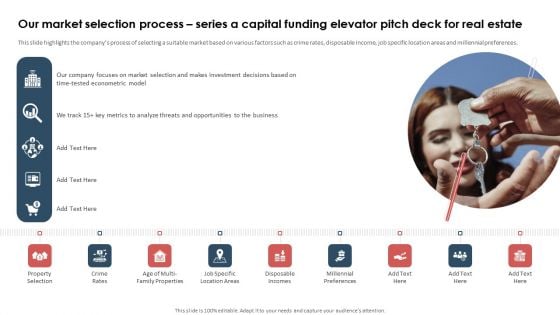
Our Market Selection Process Series A Capital Funding Elevator Pitch Deck For Real Estate Professional PDF
This slide highlights the companys process of selecting a suitable market based on various factors such as crime rates, disposable income, job specific location areas and millennial preferences. Here you can discover an assortment of the finest PowerPoint and Google Slides templates. With these templates, you can create presentations for a variety of purposes while simultaneously providing your audience with an eye-catching visual experience. Download Our Market Selection Process Series A Capital Funding Elevator Pitch Deck For Real Estate Professional PDF to deliver an impeccable presentation. These templates will make your job of preparing presentations much quicker, yet still, maintain a high level of quality. Slidegeeks has experienced researchers who prepare these templates and write high-quality content for you. Later on, you can personalize the content by editing the Our Market Selection Process Series A Capital Funding Elevator Pitch Deck For Real Estate Professional PDF.
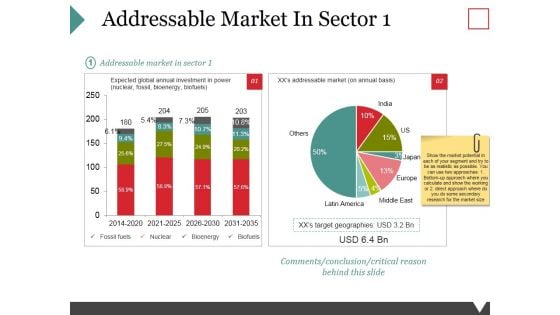
Addressable Market In Sector 1 Ppt PowerPoint Presentation Outline Shapes
This is a addressable market in sector 1 ppt powerpoint presentation outline shapes. This is a two stage process. The stages in this process are fossil fuels, nuclear, bioenergy, biofuels.
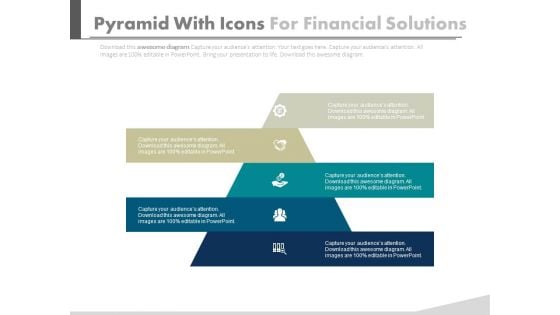
Pyramid For Financial Accounting Information Powerpoint Slides
This PowerPoint template has been designed with graphics of pyramid chart. This PPT slide can be used to prepare presentations for profit growth report and also for financial data analysis. You can download finance PowerPoint template to prepare awesome presentations.
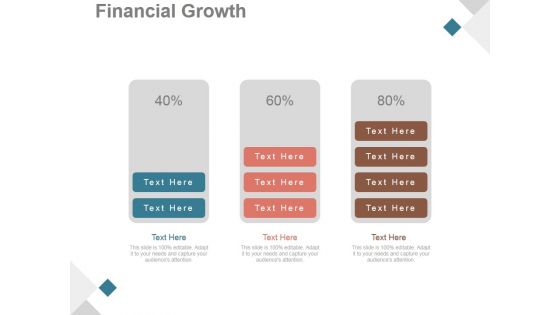
Financial Growth Ppt PowerPoint Presentation Layout
This is a financial growth ppt powerpoint presentation layout. This is a three stage process. The stages in this process are business, marketing, finance, percentage, growth.
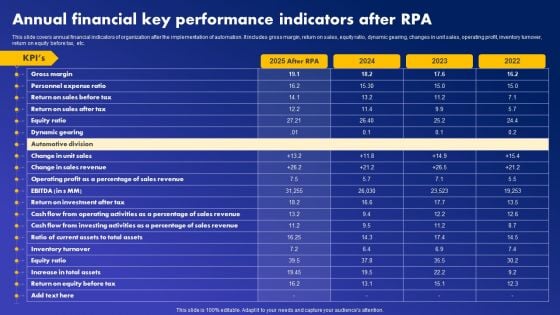
Annual Financial Key Performance Indicators After RPA Guidelines PDF
This slide covers annual financial indicators of organization after the implementation of automation. It includes gross margin, return on sales, equity ratio, dynamic gearing, changes in unit sales, operating profit, inventory turnover, return on equity before tax, etc. Create an editable Annual Financial Key Performance Indicators After RPA Guidelines PDF that communicates your idea and engages your audience. Whether you are presenting a business or an educational presentation, pre-designed presentation templates help save time. Annual Financial Key Performance Indicators After RPA Guidelines PDF is highly customizable and very easy to edit, covering many different styles from creative to business presentations. Slidegeeks has creative team members who have crafted amazing templates. So, go and get them without any delay.
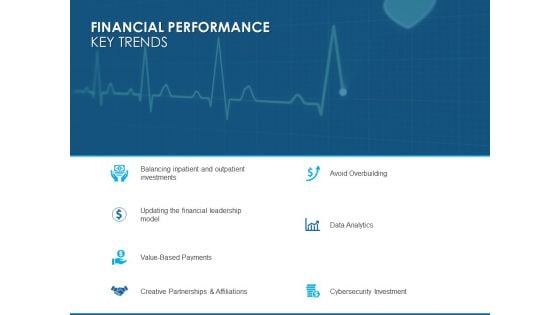
Overview Healthcare Business Management Financial Performance Key Trends Infographics PDF
Presenting this set of slides with name overview healthcare business management financial performance key trends infographics pdf. The topics discussed in these slides are data analytics, cybersecurity investment, avoid overbuilding, creative partnerships and affiliations, value based payments. This is a completely editable PowerPoint presentation and is available for immediate download. Download now and impress your audience.
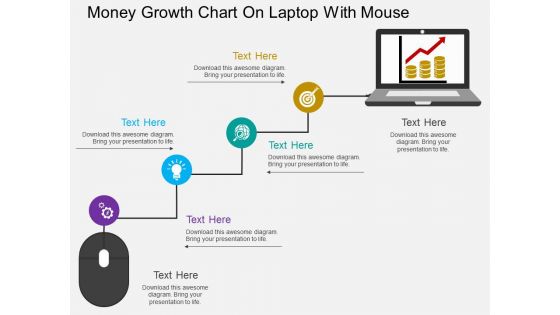
Money Growth Chart On Laptop With Mouse Powerpoint Template
This business slide displays money growth chart on laptop with mouse. This diagram is a data visualization tool that gives you a simple way to present statistical information. This slide helps your audience examine and interpret the data you present.
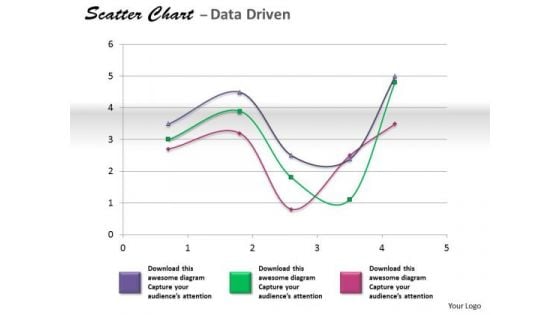
Financial Data Analysis Coordinate With Scatter Chart PowerPoint Templates
Get The Doers Into Action. Activate Them With Our financial data analysis coordinate with scatter chart Powerpoint Templates .
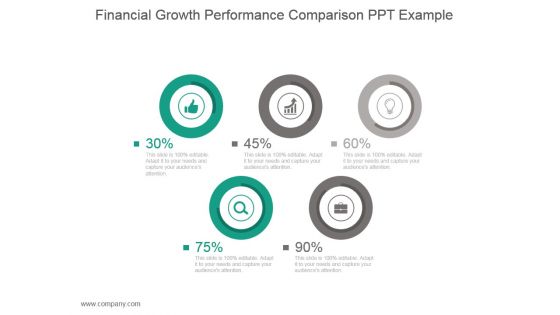
Financial Growth Performance Comparison Ppt Example
This is a financial growth performance comparison ppt example. This is a five stage process. The stages in this process are business, strategy, marketing, finance, icons.
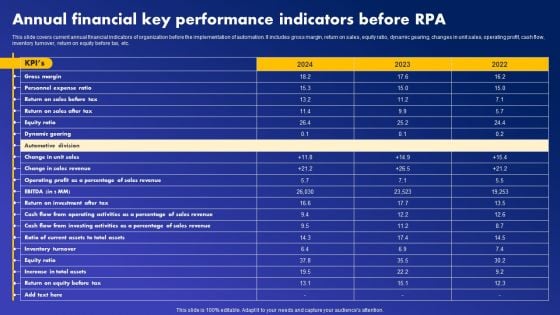
Annual Financial Key Performance Indicators Before RPA Download PDF
This slide covers current annual financial indicators of organization before the implementation of automation. It includes gross margin, return on sales, equity ratio, dynamic gearing, changes in unit sales, operating profit, cash flow, inventory turnover, return on equity before tax, etc. Slidegeeks is one of the best resources for PowerPoint templates. You can download easily and regulate Annual Financial Key Performance Indicators Before RPA Download PDF for your personal presentations from our wonderful collection. A few clicks is all it takes to discover and get the most relevant and appropriate templates. Use our Templates to add a unique zing and appeal to your presentation and meetings. All the slides are easy to edit and you can use them even for advertisement purposes.
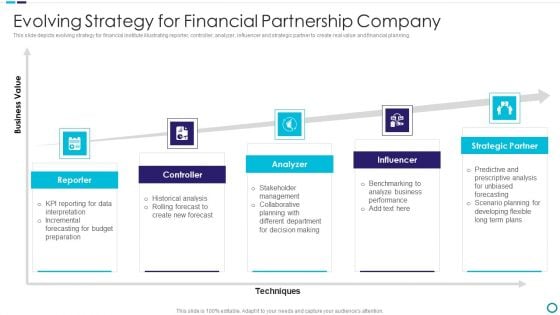
Evolving Strategy For Financial Partnership Company Rules PDF
This slide depicts evolving strategy for financial institute illustrating reporter, controller, analyzer, influencer and strategic partner to create real value and financial planning.Presenting Evolving Strategy For Financial Partnership Company Rules PDF to dispense important information. This template comprises five stages. It also presents valuable insights into the topics including Historical Analysis, Reporting For Data Interpretation, Forecasting For Budget Preparation This is a completely customizable PowerPoint theme that can be put to use immediately. So, download it and address the topic impactfully.
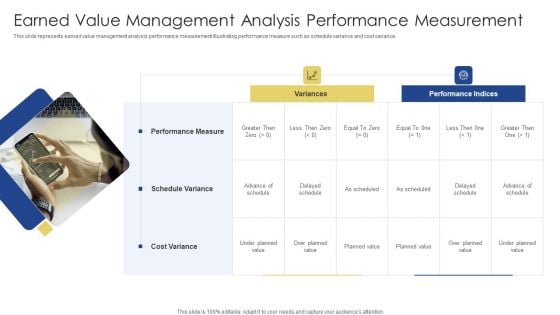
Earned Value Management Analysis Performance Measurement Ppt Infographics Portrait PDF
This slide represents earned value management analysis performance measurement illustrating performance measure such as schedule variance and cost variance. Presenting Earned Value Management Analysis Performance Measurement Ppt Infographics Portrait PDF to dispense important information. This template comprises two stages. It also presents valuable insights into the topics including Performance Measure, Schedule Variance, Cost Variance. This is a completely customizable PowerPoint theme that can be put to use immediately. So, download it and address the topic impactfully.
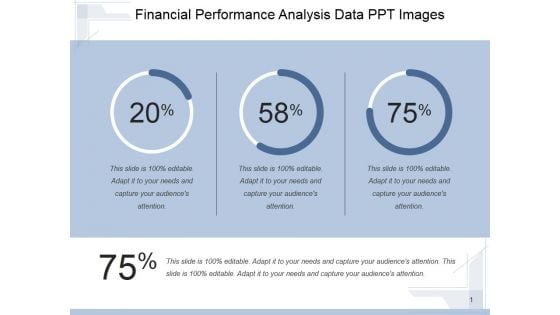
Financial Performance Analysis Data Ppt PowerPoint Presentation Topics
This is a financial performance analysis data ppt powerpoint presentation topics. This is a three stage process. The stages in this process are finance, percentage, marketing, business, growth.
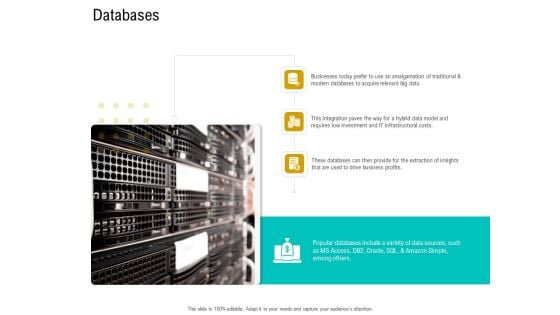
Business Data Analysis Databases Download PDF
Deliver an awe inspiring pitch with this creative business data analysis databases download pdf bundle. Topics like amalgamation of traditional, this integration paves the way for a hybrid data model and requires low investment and it infrastructural costs, these databases can then provide for the extraction of insights that are used to drive business profits. can be discussed with this completely editable template. It is available for immediate download depending on the needs and requirements of the user.
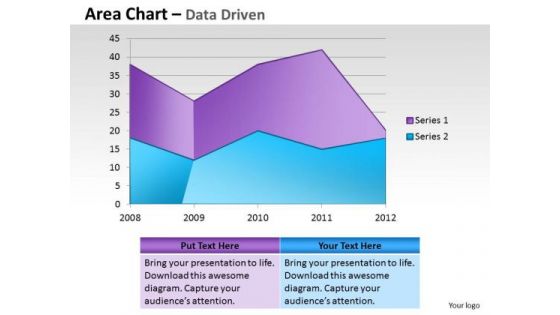
Financial Data Analysis Area Chart For Showing Trends PowerPoint Templates
Document Your Views On Our financial data analysis area chart for showing trends Powerpoint Templates . They Will Create A Strong Impression.
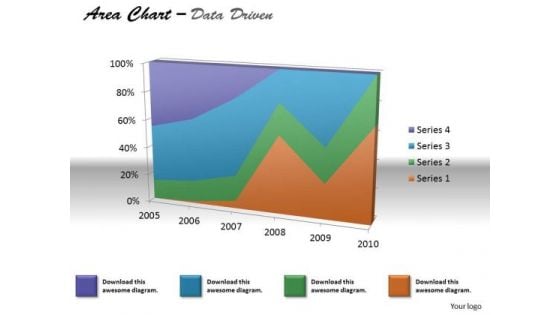
Financial Data Analysis Area Chart For Various Values PowerPoint Templates
Document The Process On Our financial data analysis area chart for various values Powerpoint Templates . Make A Record Of Every Detail.
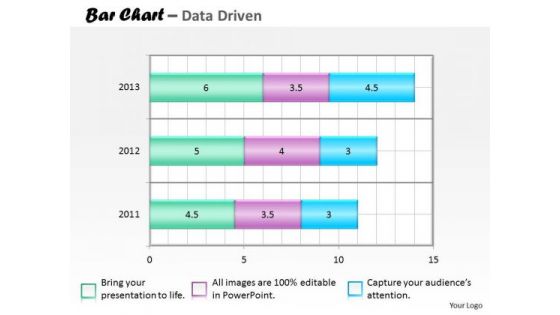
Financial Data Analysis Bar Chart For Collection Of PowerPoint Templates
Our financial data analysis bar chart for collection of Powerpoint Templates Team Are A Dogged Lot. They Keep At It Till They Get It Right.
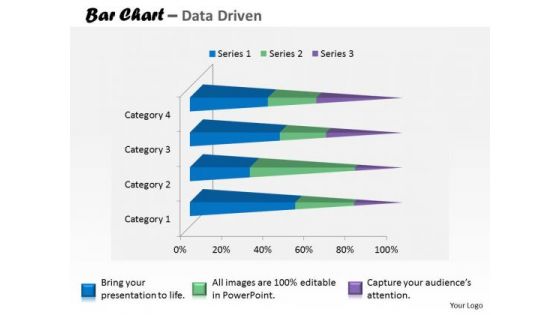
Financial Data Analysis Currency Trading Bar Chart PowerPoint Templates
Put In A Dollop Of Our financial data analysis currency trading bar chart Powerpoint Templates . Give Your Thoughts A Distinctive Flavor.
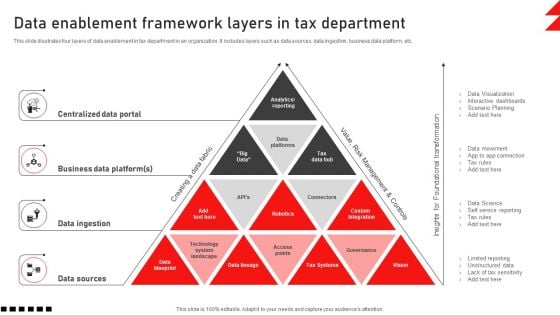
Data Enablement Framework Layers In Tax Department Elements PDF
This slide illustrates four layers of data enablement in tax department in an organization. It includes layers such as data sources, data ingestion, business data platform, etc. Presenting Data Enablement Framework Layers In Tax Department Elements PDF to dispense important information. This template comprises four stages. It also presents valuable insights into the topics including Centralized Data Portal, Business Data Platform, Data Ingestion. This is a completely customizable PowerPoint theme that can be put to use immediately. So, download it and address the topic impactfully.
Web Consulting Business Various Kpis For Tracking Business Performance
Mentioned slide provide insights into various key performance indicators to determine business performance. It includes KPIs such as business financials, website traffic, customer case, customer engagement, conversion rate, customer retention, customer bounce rate, employee turnover, etc. This modern and well-arranged Web Consulting Business Various Kpis For Tracking Business Performance provides lots of creative possibilities. It is very simple to customize and edit with the Powerpoint Software. Just drag and drop your pictures into the shapes. All facets of this template can be edited with Powerpoint, no extra software is necessary. Add your own material, put your images in the places assigned for them, adjust the colors, and then you can show your slides to the world, with an animated slide included. Mentioned slide provide insights into various key performance indicators to determine business performance. It includes KPIs such as business financials, website traffic, customer case, customer engagement, conversion rate, customer retention, customer bounce rate, employee turnover, etc.
Data Collection Tools And Techniques With Financial Reports Ppt PowerPoint Presentation Icon Example File PDF
Persuade your audience using this data collection tools and techniques with financial reports ppt powerpoint presentation icon example file pdf. This PPT design covers two stages, thus making it a great tool to use. It also caters to a variety of topics including government report, sales reports, financial reports. Download this PPT design now to present a convincing pitch that not only emphasizes the topic but also showcases your presentation skills.
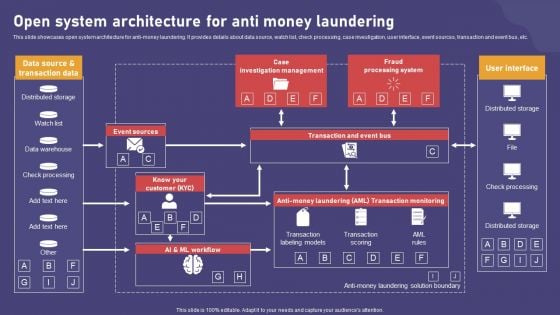
Open System Architecture For Anti Money Laundering Infographics PDF
This slide showcases open system architecture for anti-money laundering. It provides details about data source, watch list, check processing, case investigation, user interface, event sources, transaction and event bus, etc. Are you in need of a template that can accommodate all of your creative concepts This one is crafted professionally and can be altered to fit any style. Use it with Google Slides or PowerPoint. Include striking photographs, symbols, depictions, and other visuals. Fill, move around, or remove text boxes as desired. Test out color palettes and font mixtures. Edit and save your work, or work with colleagues. Download Open System Architecture For Anti Money Laundering Infographics PDF and observe how to make your presentation outstanding. Give an impeccable presentation to your group and make your presentation unforgettable.
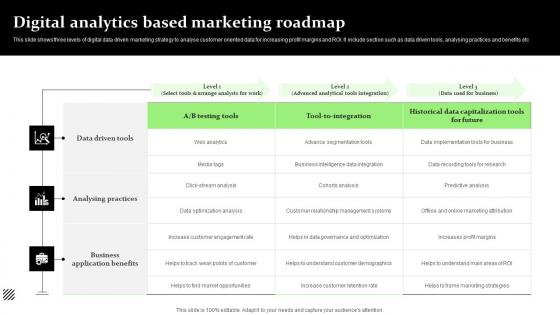
Digital Analytics Based Marketing Roadmap Elements Pdf
This slide shows three levels of digital data driven marketing strategy to analyse customer oriented data for increasing profit margins and ROI. It include section such as data driven tools, analysing practices and benefits etc.Showcasing this set of slides titled Digital Analytics Based Marketing Roadmap Elements Pdf The topics addressed in these templates are Analysing Practices, Data Driven Tools, Optimization Analysis All the content presented in this PPT design is completely editable. Download it and make adjustments in color, background, font etc. as per your unique business setting. This slide shows three levels of digital data driven marketing strategy to analyse customer oriented data for increasing profit margins and ROI. It include section such as data driven tools, analysing practices and benefits etc.
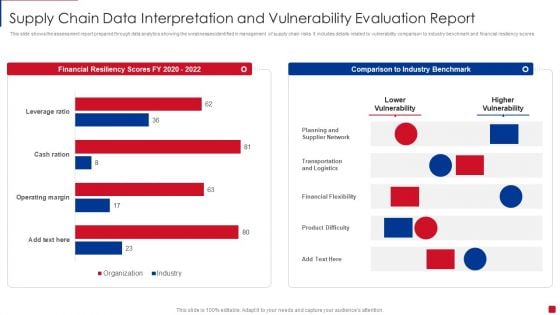
Supply Chain Data Interpretation And Vulnerability Evaluation Report Pictures PDF
This slide shows the assessment report prepared through data analytics showing the weaknesses identified in management of supply chain risks. It includes details related to vulnerability comparison to industry benchmark and financial resiliency scores Showcasing this set of slides titled Supply Chain Data Interpretation And Vulnerability Evaluation Report Pictures PDF. The topics addressed in these templates are Planning And Supplier Network, Transportation And Logistics, Financial Flexibility. All the content presented in this PPT design is completely editable. Download it and make adjustments in color, background, font etc. as per your unique business setting.
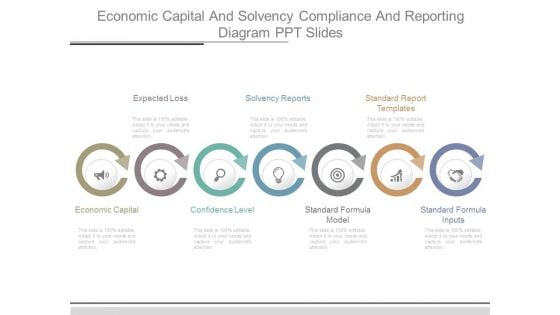
Economic Capital And Solvency Compliance And Reporting Diagram Ppt Slides
This is a economic capital and solvency compliance and reporting diagram ppt slides. This is a seven stage process. The stages in this process are expected loss, solvency reports, standard report templates, economic capital, confidence level, standard formula model, standard formula inputs.


 Continue with Email

 Home
Home


