Revenue Dashboard
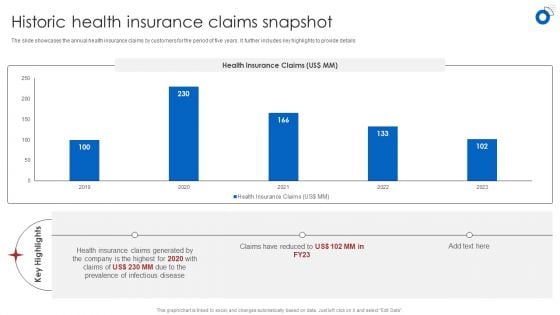
Insurance Business Financial Analysis Historic Health Insurance Claims Snapshot Diagrams PDF
The slide showcases the annual health insurance claims by customers for the period of five years. It further includes key highlights to provide details Boost your pitch with our creative Insurance Business Financial Analysis Historic Health Insurance Claims Snapshot Diagrams PDF. Deliver an awe-inspiring pitch that will mesmerize everyone. Using these presentation templates you will surely catch everyones attention. You can browse the ppts collection on our website. We have researchers who are experts at creating the right content for the templates. So you dont have to invest time in any additional work. Just grab the template now and use them.
Business Report With Financial Data Vector Icon Ppt PowerPoint Presentation File Outline PDF
Presenting business report with financial data vector icon ppt powerpoint presentation file outline pdf to dispense important information. This template comprises three stages. It also presents valuable insights into the topics including business report with financial data vector icon. This is a completely customizable PowerPoint theme that can be put to use immediately. So, download it and address the topic impactfully.
Real Estate Development Real Estate Market Snapshot Price Ppt PowerPoint Presentation Show Icon PDF
Presenting this set of slides with name real estate development real estate market snapshot price ppt powerpoint presentation show icon pdf. This is a four stage process. The stages in this process are average asking price, average sold price, average days market, homes sale, size available. This is a completely editable PowerPoint presentation and is available for immediate download. Download now and impress your audience.
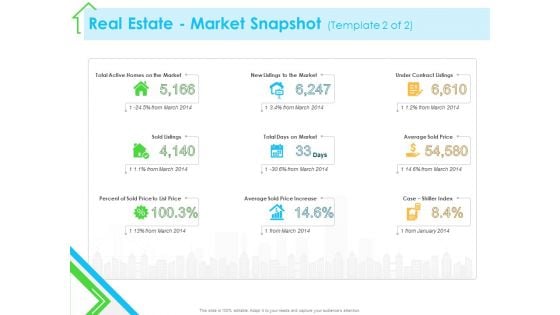
Real Estate Development Real Estate Market Snapshot Sale Ppt PowerPoint Presentation Infographics Deck PDF
Presenting this set of slides with name real estate development real estate market snapshot sale ppt powerpoint presentation infographics deck pdf. This is a nine stage process. The stages in this process are total active homes market, new listings market, under contract listings, sold listings, total days market, average sold price, percent sold price to list price, average sold price increase, case shiller index. This is a completely editable PowerPoint presentation and is available for immediate download. Download now and impress your audience.
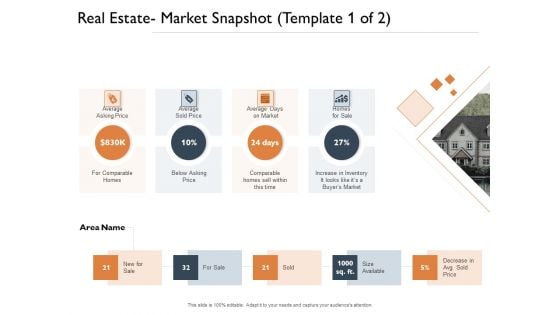
Freehold Property Business Plan Real Estate Market Snapshot Ppt PowerPoint Presentation Show Design Templates PDF
Presenting this set of slides with name freehold property business plan real estate market snapshot ppt powerpoint presentation show design templates pdf. This is a four stage process. The stages in this process are average asking price, average sold price, average days market, homes sale, size available. This is a completely editable PowerPoint presentation and is available for immediate download. Download now and impress your audience.
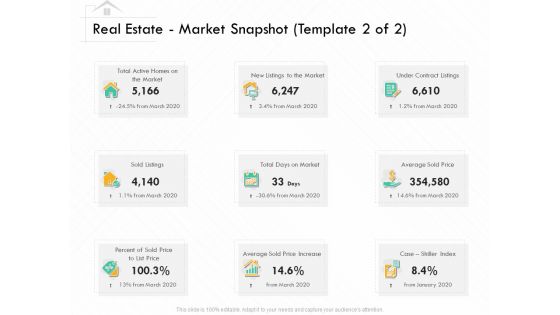
Selling Home Property Real Estate Market Snapshot Price Ppt Pictures Aids PDF
Presenting selling home property real estate market snapshot price ppt pictures aids pdf to provide visual cues and insights. Share and navigate important information on nine stages that need your due attention. This template can be used to pitch topics like market, price, case, increase. In addtion, this PPT design contains high resolution images, graphics, etc, that are easily editable and available for immediate download.
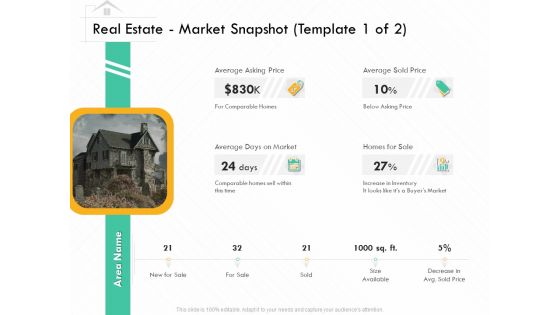
Selling Home Property Real Estate Market Snapshot Average Ppt Portfolio Good PDF
This is a selling home property real estate market snapshot average ppt portfolio good pdf template with various stages. Focus and dispense information on four stages using this creative set, that comes with editable features. It contains large content boxes to add your information on topics like price, market, sale. You can also showcase facts, figures, and other relevant content using this PPT layout. Grab it now.
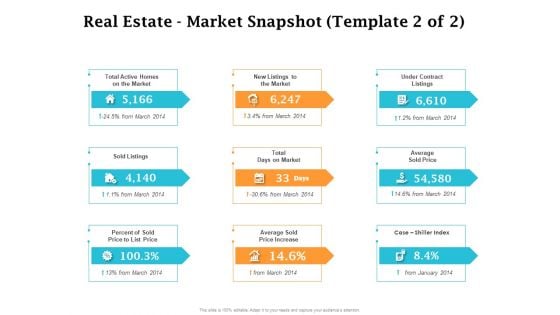
Real Estate Asset Management Real Estate Market Snapshot Price Ppt Infographic Template Templates PDF
This is a real estate asset management real estate market snapshot price ppt infographic template templates pdf template with various stages. Focus and dispense information on nine stages using this creative set, that comes with editable features. It contains large content boxes to add your information on topics like price, market, sold listings, average sold price increase. You can also showcase facts, figures, and other relevant content using this PPT layout. Grab it now.
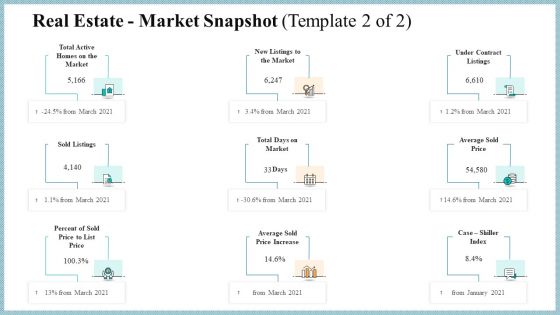
Real Property Strategic Plan Real Estate Market Snapshot Price Ppt Pictures Design Inspiration PDF
This is a real property strategic plan real estate market snapshot price ppt pictures design inspiration pdf template with various stages. Focus and dispense information on nine stages using this creative set, that comes with editable features. It contains large content boxes to add your information on topics like price, market, sold listings, average sold price increase. You can also showcase facts, figures, and other relevant content using this PPT layout. Grab it now.
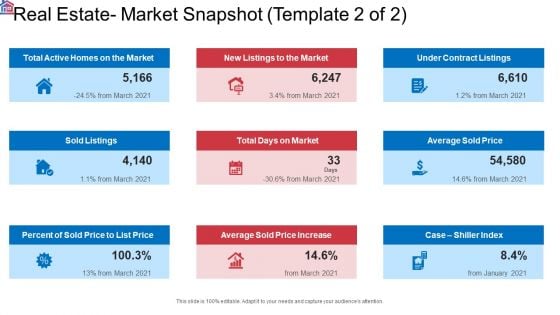
Market Research Analysis Of Housing Sector Real Estate Market Snapshot Price Formats PDF
This is a market research analysis of housing sector real estate market snapshot price formats pdf template with various stages. Focus and dispense information on nine stages using this creative set, that comes with editable features. It contains large content boxes to add your information on topics like price, market, sold listings, average sold price increase. You can also showcase facts, figures, and other relevant content using this PPT layout. Grab it now.
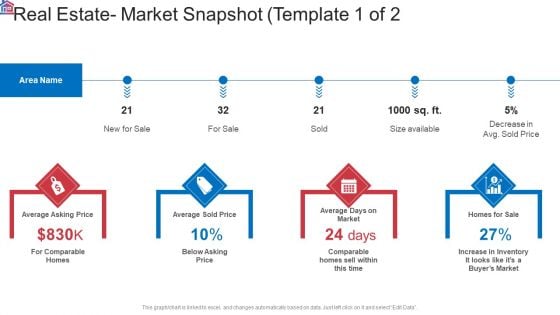
Market Research Analysis Of Housing Sector Real Estate Market Snapshot Average Ppt Outline Example File PDF
Presenting market research analysis of housing sector real estate market snapshot average ppt outline example file pdf to provide visual cues and insights. Share and navigate important information on four stages that need your due attention. This template can be used to pitch topics like sale, market, inventory, price. In addtion, this PPT design contains high resolution images, graphics, etc, that are easily editable and available for immediate download.
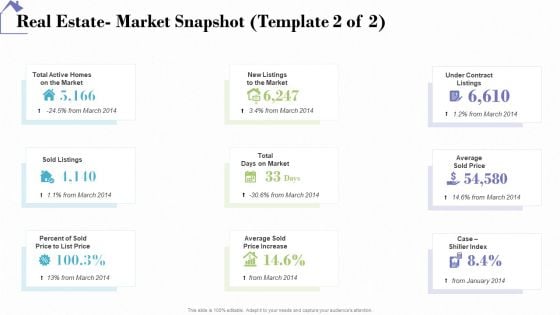
Industry Analysis Of Real Estate And Construction Sector Real Estate Market Snapshot Price Designs PDF
This is a industry analysis of real estate and construction sector real estate market snapshot price designs pdf template with various stages. Focus and dispense information on nine stages using this creative set, that comes with editable features. It contains large content boxes to add your information on topics like price, market, sold listings, average sold price increase. You can also showcase facts, figures, and other relevant content using this PPT layout. Grab it now.
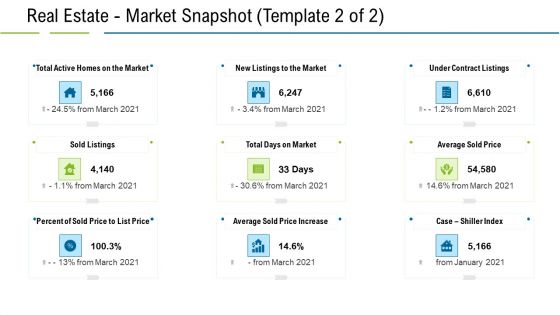
United States Real Estate Industry Real Estate Market Snapshot Price Ppt Layouts Graphics Tutorials PDF
This is a united states real estate industry real estate market snapshot price ppt layouts graphics tutorials pdf template with various stages. Focus and dispense information on nine stages using this creative set, that comes with editable features. It contains large content boxes to add your information on topics like price, market, sold listings, average sold price increase. You can also showcase facts, figures, and other relevant content using this PPT layout. Grab it now.
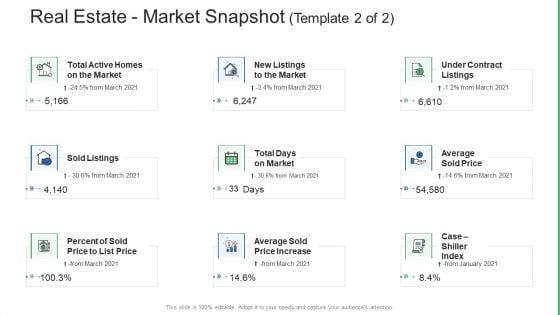
Commercial Property Administration And Advancement Real Estate Market Snapshot Price Diagrams PDF
This is a commercial property administration and advancement real estate market snapshot price diagrams pdf template with various stages. Focus and dispense information on nine stages using this creative set, that comes with editable features. It contains large content boxes to add your information on topics like price, market, sold listings, average sold price increase. You can also showcase facts, figures, and other relevant content using this PPT layout. Grab it now.
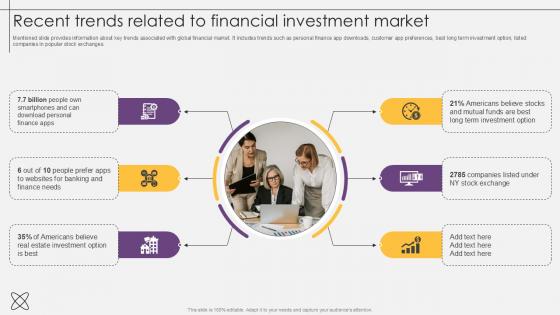
Recent Trends Related To Financial Investment Market Investment Fund PPT Template
Mentioned slide provides information about key trends associated with global financial market.It includes trends such as personal finance app downloads, customer app preferences, best long term investment option, listed companies in popular stock exchanges. Create an editable Recent Trends Related To Financial Investment Market Investment Fund PPT Template that communicates your idea and engages your audience. Whether you are presenting a business or an educational presentation, pre designed presentation templates help save time. Recent Trends Related To Financial Investment Market Investment Fund PPT Template is highly customizable and very easy to edit, covering many different styles from creative to business presentations. Slidegeeks has creative team members who have crafted amazing templates. So, go and get them without any delay. Mentioned slide provides information about key trends associated with global financial market.It includes trends such as personal finance app downloads, customer app preferences, best long term investment option, listed companies in popular stock exchanges.
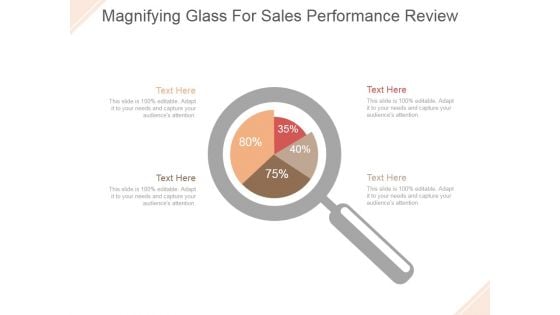
Magnifying Glass For Sales Performance Review Ppt PowerPoint Presentation Model
This is a magnifying glass for sales performance review ppt powerpoint presentation model. This is a four stage process. The stage in this process are magnifier glass, pie, finance, percentage, research.
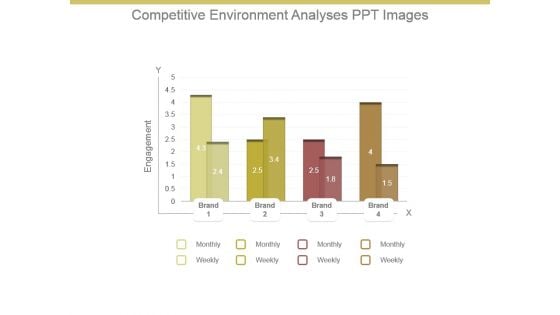
Competitive Environment Analysis Ppt Images
This is a competitive environment analysis ppt images. This is a four stage process. The stages in this process are engagement, brand, monthly, weekly, x, y.
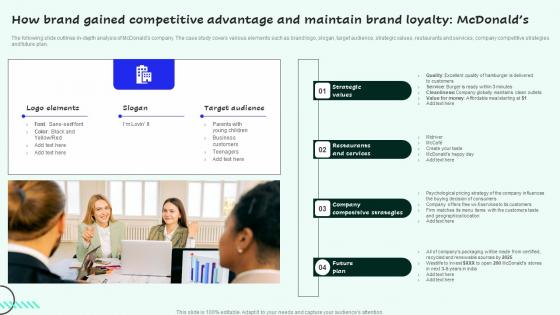
Strategies For Enhancing Sales And Profitability How Brand Gained Competitive Pictures Pdf
The following slide outlines in depth analysis of McDonalds company. The case study covers various elements such as brand logo, slogan, target audience, strategic values, restaurants and services, company competitive strategies and future plan.The Strategies For Enhancing Sales And Profitability How Brand Gained Competitive Pictures Pdf is a compilation of the most recent design trends as a series of slides. It is suitable for any subject or industry presentation, containing attractive visuals and photo spots for businesses to clearly express their messages. This template contains a variety of slides for the user to input data, such as structures to contrast two elements, bullet points, and slides for written information. Slidegeeks is prepared to create an impression. The following slide outlines in depth analysis of McDonalds company. The case study covers various elements such as brand logo, slogan, target audience, strategic values, restaurants and services, company competitive strategies and future plan.
Freehold Property Business Plan Real Estate Market Snapshot Price Ppt PowerPoint Presentation Infographic Template Topics PDF
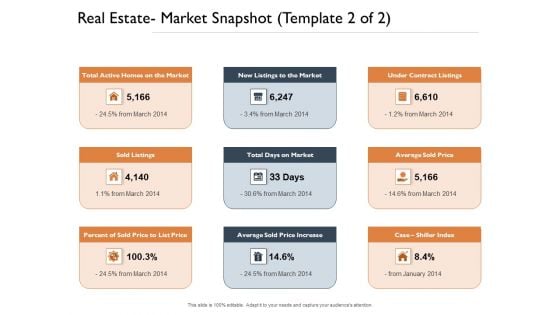
Presenting this set of slides with name freehold property business plan real estate market snapshot price ppt powerpoint presentation infographic template topics pdf. This is a nine stage process. The stages in this process are total active homes market, new listings market, under contract listings, sold listings, total days market, average sold price, percent sold price to list price, average sold price increase, case shiller index. This is a completely editable PowerPoint presentation and is available for immediate download. Download now and impress your audience.
Key Company Financial Operation Performance Metrics Ppt Infographic Template Example Introduction PDF
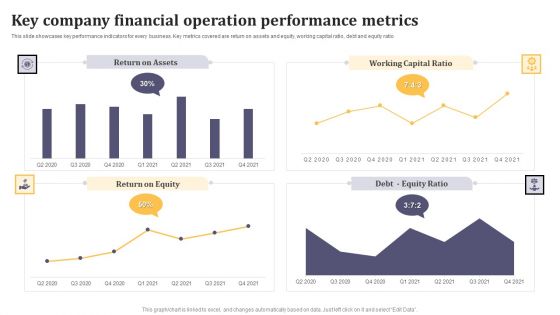
This slide showcases key performance indicators for every business. Key metrics covered are return on assets and equity, working capital ratio, debt and equity ratio. Showcasing this set of slides titled Key Company Financial Operation Performance Metrics Ppt Infographic Template Example Introduction PDF. The topics addressed in these templates are Return on Assets, Working Capital Ratio, Return on Equity. All the content presented in this PPT design is completely editable. Download it and make adjustments in color, background, font etc. as per your unique business setting.

Statistical Data Analysis Chart Of Collected Data Formats PDF
Presenting statistical data analysis chart of collected data formats pdf to dispense important information. This template comprises four stages. It also presents valuable insights into the topics including statistical data analysis chart of collected data. This is a completely customizable PowerPoint theme that can be put to use immediately. So, download it and address the topic impactfully.
Anti Money Laundering Risk Assessment Process Mapping Out The Anti Money Fin SS V
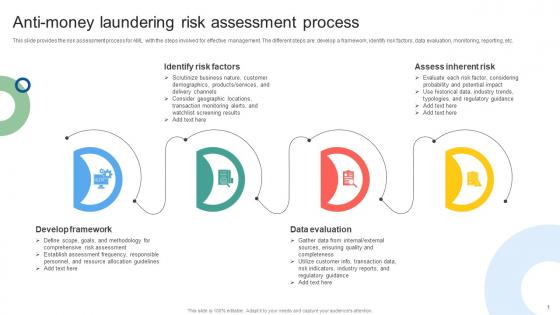
This slide provides the risk assessment process for AML with the steps involved for effective management. The different steps are develop a framework, identify risk factors, data evaluation, monitoring, reporting, etc. Slidegeeks is here to make your presentations a breeze with Anti Money Laundering Risk Assessment Process Mapping Out The Anti Money Fin SS V With our easy-to-use and customizable templates, you can focus on delivering your ideas rather than worrying about formatting. With a variety of designs to choose from, you are sure to find one that suits your needs. And with animations and unique photos, illustrations, and fonts, you can make your presentation pop. So whether you are giving a sales pitch or presenting to the board, make sure to check out Slidegeeks first This slide provides the risk assessment process for AML with the steps involved for effective management. The different steps are develop a framework, identify risk factors, data evaluation, monitoring, reporting, etc.
Mixpanel Capital Raising Pitch Deck Mixpanels Marketing Key Performance Indicators Portrait PDF
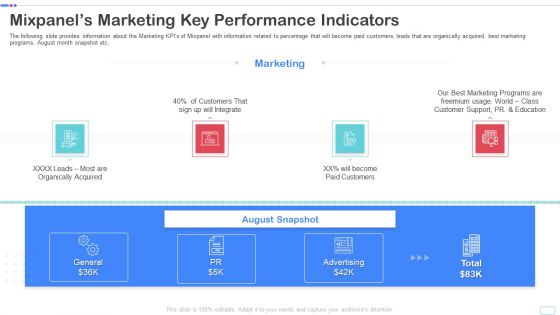
The following slide provides information about the Marketing KPIs of Mixpanel with information related to percentage that will become paid customers, leads that are organically acquired, best marketing programs, August month snapshot etc. Presenting mixpanel capital raising pitch deck mixpanels marketing key performance indicators portrait pdf to provide visual cues and insights. Share and navigate important information on four stages that need your due attention. This template can be used to pitch topics like mixpanels marketing key performance indicators. In addtion, this PPT design contains high resolution images, graphics, etc, that are easily editable and available for immediate download.

Financial Projections Income Statement Ppt PowerPoint Presentation Inspiration Vector
This is a financial projections income statement ppt powerpoint presentation inspiration vector. This is a four stage process. The stages in this process are net sales, expenses, cost of goods sold, employee benefit expense, financing cost.
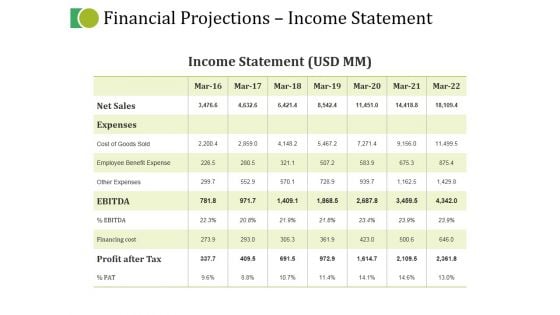
Financial Projections Income Statement Ppt PowerPoint Presentation Portfolio Infographic Template
This is a financial projections income statement ppt powerpoint presentation portfolio infographic template. This is a seven stage process. The stages in this process are trade payables, current liabilities, total liabilities, total fixed assets, inventories.
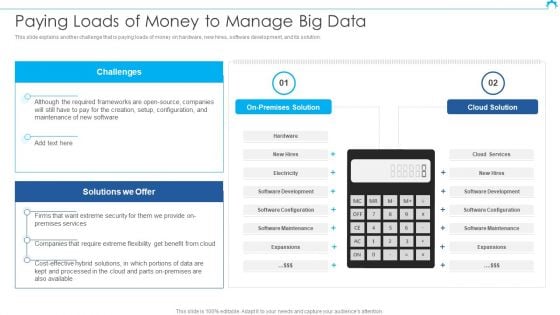
Big Data Architect Paying Loads Of Money To Manage Big Data Rules PDF
This slide explains another challenge that is paying loads of money on hardware, new hires, software development, and its solution.Deliver and pitch your topic in the best possible manner with this Big Data Architect Paying Loads Of Money To Manage Big Data Rules PDF. Use them to share invaluable insights on Required Frameworks, Maintenance Software, Extreme Flexibility and impress your audience. This template can be altered and modified as per your expectations. So, grab it now.
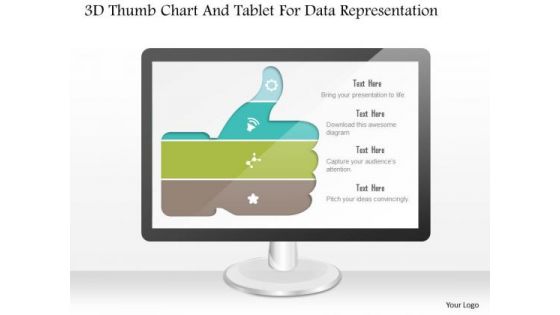
Business Diagram 3d Thumb Chart And Tablet For Data Representation PowerPoint Slide
This business diagram displays graphic of 3d thumb up chart with icons on computer screen. This business slide contains the concept of business data representation. Use this diagram to build professional presentations for your viewers.
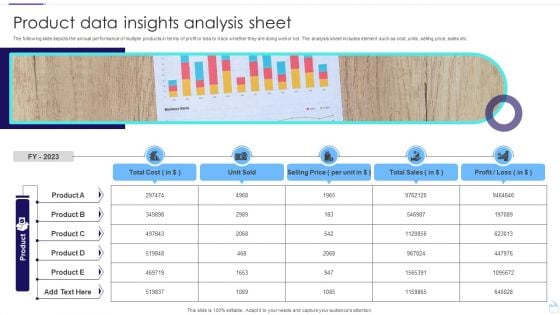
Product Data Insights Analysis Sheet Infographics PDF
The following slide depicts the annual performance of multiple products in terms of profit or loss to track whether they are doing well or not. The analysis sheet includes element such as cost, units, selling price, sales etc. Pitch your topic with ease and precision using this Product Data Insights Analysis Sheet Infographics PDF. This layout presents information on Unit Sold, Selling Price, Total Sales. It is also available for immediate download and adjustment. So, changes can be made in the color, design, graphics or any other component to create a unique layout.
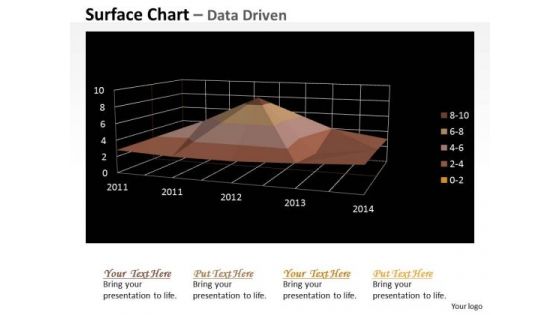
Multivariate Data Analysis Numeric Values Surface Chart PowerPoint Templates
Your Grasp Of Economics Is Well Known. Help Your Audience Comprehend Issues With Our multivariate data analysis numeric values surface chart Powerpoint Templates .

Key Considerations Assumptions Of Telemedicine Industry Report Remote Healthcare Services IR SS V
This slide showcases the considerations and assumptions of Telemedicine industry report which includes basis of data, influence factor of consumer behavior, economic assumptions, external factors, etc. Are you in need of a template that can accommodate all of your creative concepts This one is crafted professionally and can be altered to fit any style. Use it with Google Slides or PowerPoint. Include striking photographs, symbols, depictions, and other visuals. Fill, move around, or remove text boxes as desired. Test out color palettes and font mixtures. Edit and save your work, or work with colleagues. Download Key Considerations Assumptions Of Telemedicine Industry Report Remote Healthcare Services IR SS V and observe how to make your presentation outstanding. Give an impeccable presentation to your group and make your presentation unforgettable. This slide showcases the considerations and assumptions of Telemedicine industry report which includes basis of data, influence factor of consumer behavior, economic assumptions, external factors, etc.
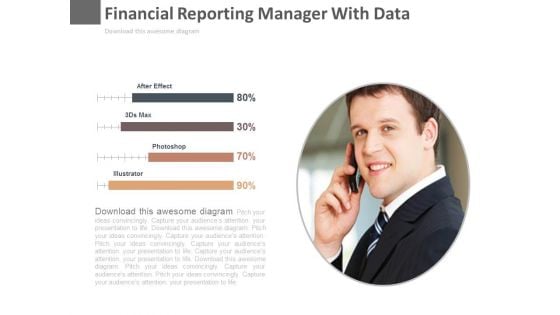
Financial Reporting Manager With Data Powerpoint Slides
This PowerPoint template has been designed with graphics of finance manager and percentage data. This diagram is useful to exhibit financial management. This diagram slide can be used to make impressive presentations.
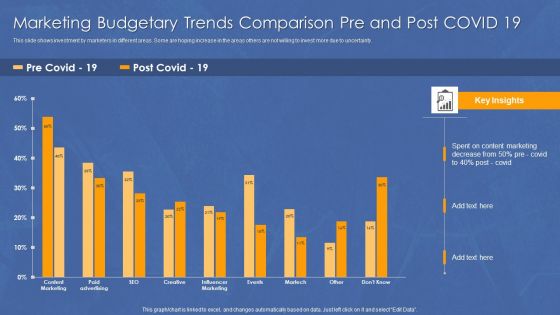
Marketing Budgetary Trends Comparison Pre And Post COVID 19 Background PDF
This slide shows investment by marketers in different areas. Some are hoping increase in the areas others are not willing to invest more due to uncertainty.Pitch your topic with ease and precision using this Marketing Budgetary Trends Comparison Pre And Post COVID 19 Background PDF. This layout presents information on Content Marketing, Influencer Marketing, Content Marketing. It is also available for immediate download and adjustment. So, changes can be made in the color, design, graphics or any other component to create a unique layout.
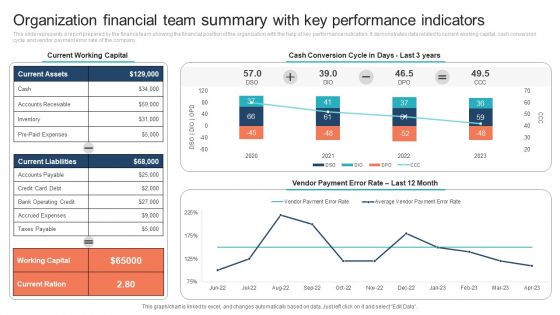
Organization Financial Team Summary With Key Performance Indicators Clipart PDF
This slide represents a report prepared by the finance team showing the financial position of the organization with the help of key performance indicators. It demonstrates data related to current working capital, cash conversion cycle and vendor payment error rate of the company. Pitch your topic with ease and precision using this Organization Financial Team Summary With Key Performance Indicators Clipart PDF. This layout presents information on Current Working Capital, Cash Conversion Cycle. It is also available for immediate download and adjustment. So, changes can be made in the color, design, graphics or any other component to create a unique layout.
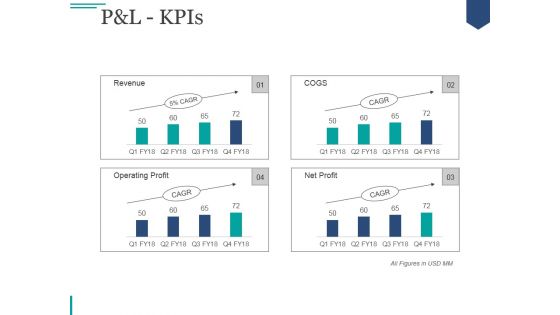
Pandl Kpis Ppt PowerPoint Presentation Deck
This is a pandl kpis ppt powerpoint presentation deck. This is a four stage process. The stages in this process are net sales, other income, total income, expenses, total material consumed.
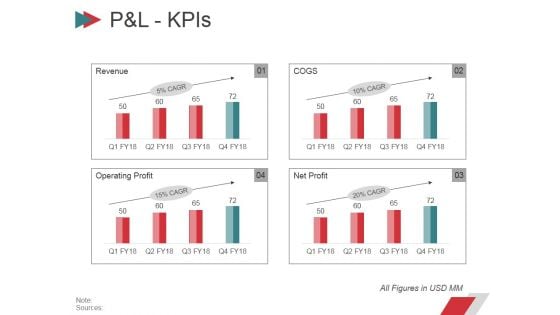
Pandl Kpis Ppt PowerPoint Presentation Gallery Slides
This is a pandl kpis ppt powerpoint presentation gallery slides. This is a four stage process. The stages in this process are net sales, other income, total income, expenses, total material consumed.
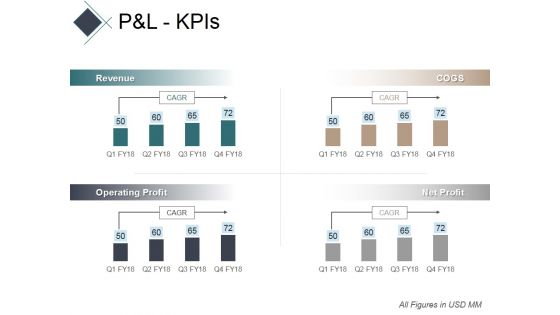
Pandl Kpis Ppt PowerPoint Presentation Professional Show
This is a pandl kpis ppt powerpoint presentation professional show. This is a four stage process. The stages in this process are other income, total income, expenses, total material consumed, employee benefit expense.
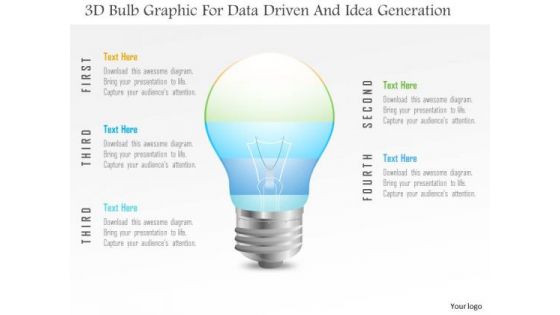
Business Diagram 3d Bulb Graphic For Data Driven And Idea Generation PowerPoint Slide
This Power Point template has been designed with 3d bulb graphic. Use this slide to represent technology idea and strategy concepts. Download this diagram for your business presentations and get exclusive comments on your efforts.
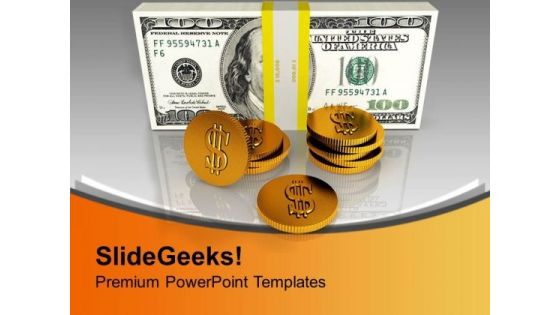
Pile Of Coins With Dollars Financial Concept PowerPoint Templates Ppt Backgrounds For Slides 0313
We present our Pile Of Coins With Dollars Financial Concept PowerPoint Templates PPT Backgrounds For Slides 0313.Use our Money PowerPoint Templates because Our PowerPoint Templates and Slides come in all colours, shades and hues. They help highlight every nuance of your views. Use our Finance PowerPoint Templates because You can Zap them with our PowerPoint Templates and Slides. See them reel under the impact. Download our Success PowerPoint Templates because Our PowerPoint Templates and Slides will effectively help you save your valuable time. They are readymade to fit into any presentation structure. Download our Marketing PowerPoint Templates because It will let you Set new benchmarks with our PowerPoint Templates and Slides. They will keep your prospects well above par. Download our Business PowerPoint Templates because Our PowerPoint Templates and Slides will bullet point your ideas. See them fall into place one by one.Use these PowerPoint slides for presentations relating to Stacks of dollars and pile of coins, money, marketing, business, success, finance. The prominent colors used in the PowerPoint template are Yellow, Gray, White. Examine data with our Pile Of Coins With Dollars Financial Concept PowerPoint Templates Ppt Backgrounds For Slides 0313. You will come out on top.
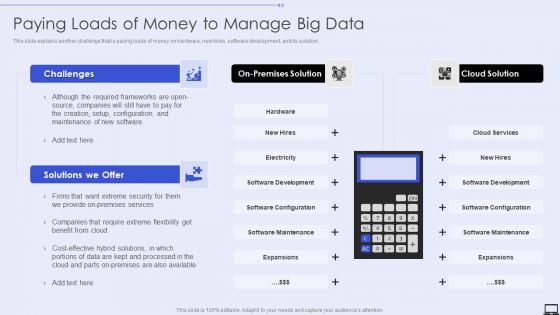
Paying Loads Of Money To Manage Big Data Ppt PowerPoint Presentation File Files PDF
Presenting Paying Loads Of Money To Manage Big Data Ppt PowerPoint Presentation File Files PDF to provide visual cues and insights. Share and navigate important information on four stages that need your due attention. This template can be used to pitch topics like Services, Extreme Security, Required Frameworks. In addtion, this PPT design contains high resolution images, graphics, etc, that are easily editable and available for immediate download.
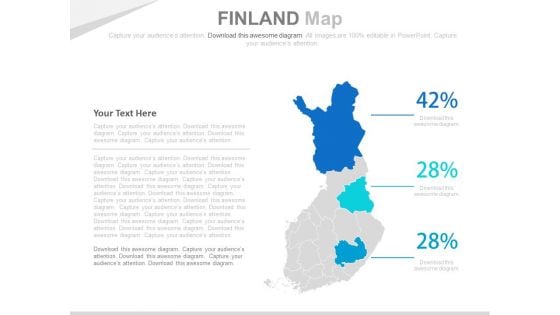
Finland Map With Economic Data Analysis Powerpoint Slides
This PowerPoint template has been designed with Finland Map and areas highlighted. You may use this slide to display financial strategy analysis. This diagram provides an effective way of displaying information you can edit text, color, shade and style as per you need.
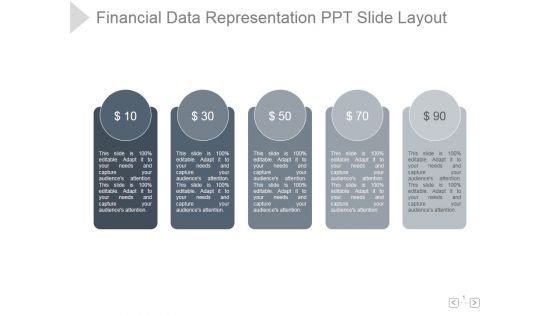
Financial Data Representation Ppt PowerPoint Presentation Rules
This is a financial data representation ppt powerpoint presentation rules. This is a five stage process. The stages in this process are financial, data, representation, marketing, management, business.
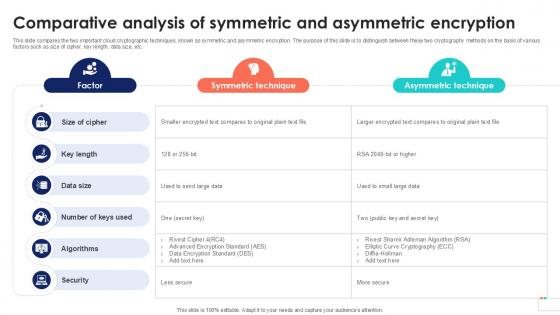
Comparative Analysis Of Symmetric Data Security In Cloud Computing Ppt Sample
This slide compares the two important cloud cryptographic techniques, known as symmetric and asymmetric encryption. The purpose of this slide is to distinguish between these two cryptography methods on the basis of various factors such as size of cipher, key length, data size, etc. Make sure to capture your audiences attention in your business displays with our gratis customizable Comparative Analysis Of Symmetric Data Security In Cloud Computing Ppt Sample. These are great for business strategies, office conferences, capital raising or task suggestions. If you desire to acquire more customers for your tech business and ensure they stay satisfied, create your own sales presentation with these plain slides. This slide compares the two important cloud cryptographic techniques, known as symmetric and asymmetric encryption. The purpose of this slide is to distinguish between these two cryptography methods on the basis of various factors such as size of cipher, key length, data size, etc.
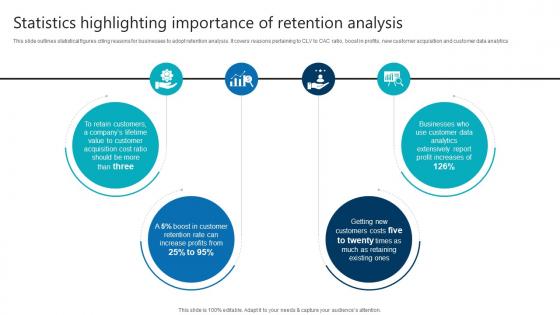
Statistics Highlighting Importance Of Retention Analysis Product Analytics Implementation Data Analytics V
This slide outlines statistical figures citing reasons for businesses to adopt retention analysis. It covers reasons pertaining to CLV to CAC ratio, boost in profits, new customer acquisition and customer data analyticsAre you in need of a template that can accommodate all of your creative concepts This one is crafted professionally and can be altered to fit any style. Use it with Google Slides or PowerPoint. Include striking photographs, symbols, depictions, and other visuals. Fill, move around, or remove text boxes as desired. Test out color palettes and font mixtures. Edit and save your work, or work with colleagues. Download Statistics Highlighting Importance Of Retention Analysis Product Analytics Implementation Data Analytics V and observe how to make your presentation outstanding. Give an impeccable presentation to your group and make your presentation unforgettable. This slide outlines statistical figures citing reasons for businesses to adopt retention analysis. It covers reasons pertaining to CLV to CAC ratio, boost in profits, new customer acquisition and customer data analytics
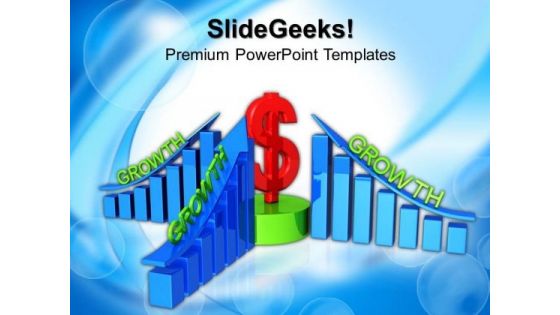
Business Profits Growth PowerPoint Templates And PowerPoint Themes 1012
Business Profits Growth PowerPoint Templates And PowerPoint Themes 1012-The above template displays a diagram of profit and growth bar graph with dollar in center. This image represents the business concept. Use this template for presentations on growth of indicators, growth of indices, rise up, business development, evaluative reports, ratings, graphs, economy, rate of exchange, market review etc. Adjust the above image in your PPT presentations to visually support your content in your Business and Marketing PPT slideshows. Deliver amazing presentations to mesmerize your audience.-Business Profits Growth PowerPoint Templates And PowerPoint Themes 1012-This PowerPoint template can be used for presentations relating to-Business profits growth, business, finance, success, money, marketing Create an engaging ambience with our Business Profits Growth PowerPoint Templates And PowerPoint Themes 1012. Their content will appeal to all the brains.
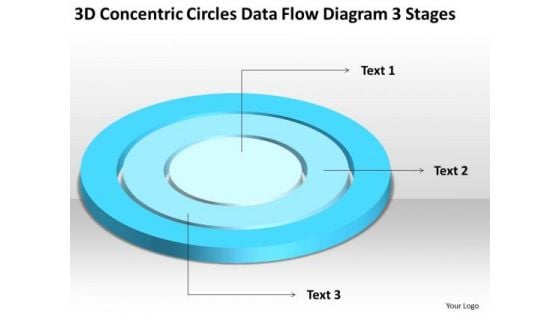
Concentric Circles Data Flow Diagram 3 Stages Business Plan For Non Profit PowerPoint Slides
We present our concentric circles data flow diagram 3 stages business plan for non profit PowerPoint Slides.Present our Circle Charts PowerPoint Templates because Our PowerPoint Templates and Slides team portray an attitude of elegance. Personify this quality by using them regularly. Download our Shapes PowerPoint Templates because You will get more than you ever bargained for. Download our Signs PowerPoint Templates because Timeline crunches are a fact of life. Meet all deadlines using our PowerPoint Templates and Slides. Use our Maketing PowerPoint Templates because you can Add colour to your speech with our PowerPoint Templates and Slides. Your presentation will leave your audience speechless. Use our Metaphors-Visual Concepts PowerPoint Templates because Our PowerPoint Templates and Slides are like the strings of a tennis racquet. Well strung to help you serve aces.Use these PowerPoint slides for presentations relating to diagram, circular, market, bar, advertise, interface, business, concept, vector, sign, success, presentation, symbol, template, circle, brochure, finance, data, description, report, marketing, title, label, abstract, management, graph, four, illustration, icon, pie, chart, strategy, catalog, research, web, design, growth, text, professional, banner, account, profit, information, background, info-graphic, analyze, financial, button, goals. The prominent colors used in the PowerPoint template are Blue, Blue light, White. Our Concentric Circles Data Flow Diagram 3 Stages Business Plan For Non Profit PowerPoint Slides are evidently advantageous. The balance will tilt in your favour.
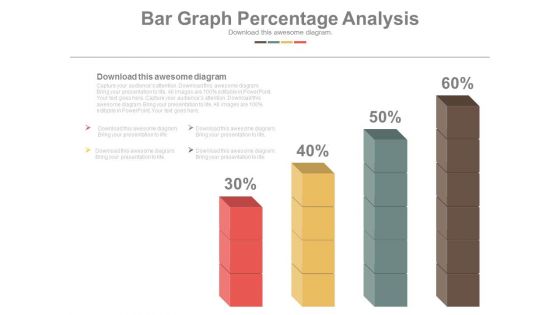
Bar Graph Displaying Profit Growth Powerpoint Slides
This PowerPoint template has been designed with six point?s bar graph with icons. This PPT slide can be used to prepare presentations for marketing reports and also for financial data analysis. You can download finance PowerPoint template to prepare awesome presentations.
Data Research And Analysis For Mobile Users Ppt PowerPoint Presentation Icon Inspiration
This is a data research and analysis for mobile users ppt powerpoint presentation icon inspiration. This is a four stage process. The stages in this process are mobile analytics, mobile tracking, mobile web analytics.
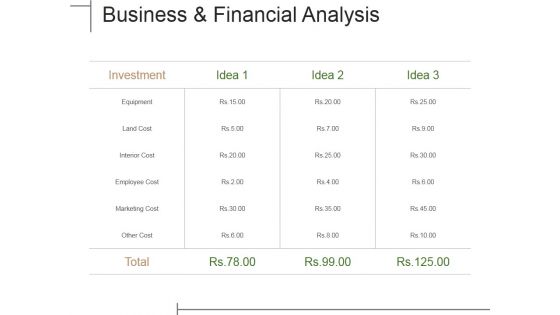
Business And Financial Analysis Ppt PowerPoint Presentation Portfolio Templates
This is a business and financial analysis ppt powerpoint presentation portfolio templates. This is a four stage process. The stages in this process are investment, tables, data analysis, marketing, equipment.
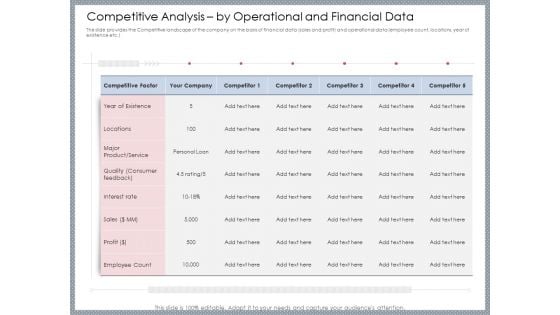
Mezzanine Venture Capital Funding Pitch Deck Competitive Analysis By Operational And Financial Data Ideas PDF
The slide provides the Competitive landscape of the company on the basis of financial data sales and profit and operational data employee count, locations, year of existence etc. Deliver and pitch your topic in the best possible manner with this mezzanine venture capital funding pitch deck competitive analysis by operational and financial data ideas pdf. Use them to share invaluable insights on financial, company, service, interest, interest and impress your audience. This template can be altered and modified as per your expectations. So, grab it now.

Toolkit For Data Science And Analytics Transition Business Requirements For Data Analytics Project Designs PDF
The slide specifies the key requirements for data analytics project covering the business, data, application and technology aspects. Do you have to make sure that everyone on your team knows about any specific topic I yes, then you should give Toolkit For Data Science And Analytics Transition Business Requirements For Data Analytics Project Designs PDF a try. Our experts have put a lot of knowledge and effort into creating this impeccable Toolkit For Data Science And Analytics Transition Business Requirements For Data Analytics Project Designs PDF. You can use this template for your upcoming presentations, as the slides are perfect to represent even the tiniest detail. You can download these templates from the Slidegeeks website and these are easy to edit. So grab these today.
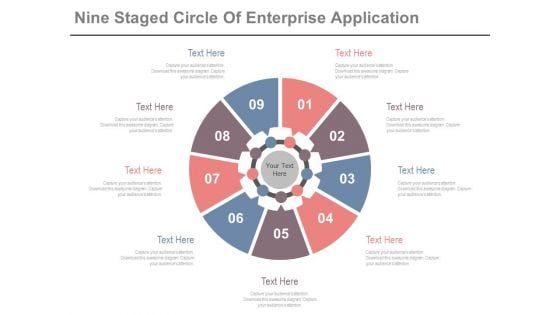
Circle Diagram For Business Marketing Mix Powerpoint Slides
This PowerPoint template has been designed with nine steps circle chart. This PPT slide can be used to prepare presentations for profit growth report and also for financial data analysis. You can download finance PowerPoint template to prepare awesome presentations.
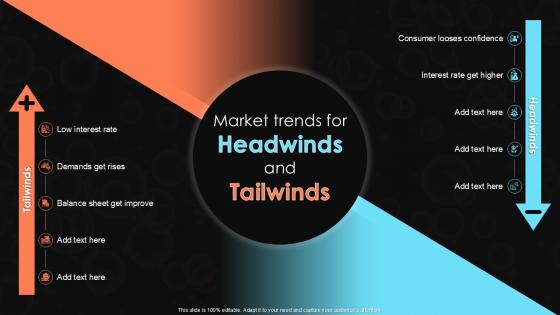
Market Trends For Headwinds And Tailwinds
Presenting this PowerPoint presentation, titled Market Trends For Headwinds And Tailwinds, with topics curated by our researchers after extensive research. This editable presentation is available for immediate download and provides attractive features when used. Download now and captivate your audience. Presenting this Market Trends For Headwinds And Tailwinds. Our researchers have carefully researched and created these slides with all aspects taken into consideration. This is a completely customizable Market Trends For Headwinds And Tailwinds that is available for immediate downloading. Download now and make an impact on your audience. Highlight the attractive features available with our PPTs. Our Headwinds and Tailwinds Market Trends for PowerPoint templates offer you an opportunity to explain and discuss the headwinds as regulatory challenges or market downturns, which create a kind of resistance in a firms efforts, while tailwinds can be related to economic growth or new technologies emerging, all presented through visual, effective, and short content. These slides are perfect for stakeholders, investors, or strategic discussions and bring clarity with efficiency to enhance your presentations while ensuring that your insights stand out.
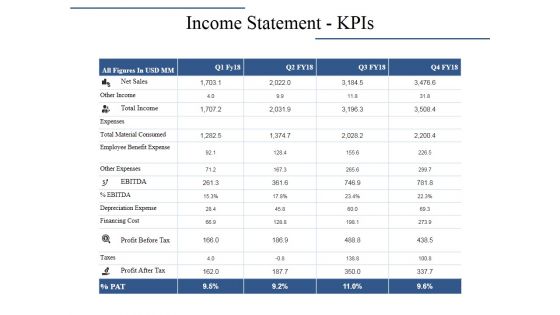
Income Statement Kpis Ppt PowerPoint Presentation Layouts Graphics Pictures
This is a income statement kpis ppt powerpoint presentation layouts graphics pictures. This is a four stage process. The stages in this process are net sales, total income, other income, profit before tax, expenses.

Marketing Plan Word Cloud With Magnifying Glass Ppt Powerpoint Presentation File Slides
This is a marketing plan word cloud with magnifying glass ppt powerpoint presentation file slides. This is a three stage process. The stages in this process are success, business, motivation, management, always, objectives, item, organizational, money, taking.

Global Finance Industry Market Trends Strategy For Launching A Financial Strategy SS V
This slide showcases the market trends of global finance industry. It includes trends such as digital transformation, fintech innovation, cybersecurity and data privacy and cryptocurrency and digital assets. If your project calls for a presentation, then Slidegeeks is your go-to partner because we have professionally designed, easy-to-edit templates that are perfect for any presentation. After downloading, you can easily edit Global Finance Industry Market Trends Strategy For Launching A Financial Strategy SS V and make the changes accordingly. You can rearrange slides or fill them with different images. Check out all the handy templates This slide showcases the market trends of global finance industry. It includes trends such as digital transformation, fintech innovation, cybersecurity and data privacy and cryptocurrency and digital assets.
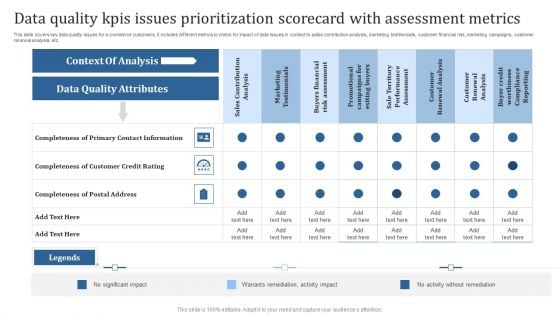
Data Quality Kpis Issues Prioritization Scorecard With Assessment Metrics Ideas PDF
This slide covers key data quality issues for e-commerce customers. It includes different metrics to check for impact of data issues in context to sales contribution analysis, marketing testimonials, customer financial risk, marketing campaigns, customer renewal analysis, etc. Showcasing this set of slides titled Data Quality Kpis Issues Prioritization Scorecard With Assessment Metrics Ideas PDF. The topics addressed in these templates are Context Of Analysis, Data Quality Attributes. All the content presented in this PPT design is completely editable. Download it and make adjustments in color, background, font etc. as per your unique business setting.
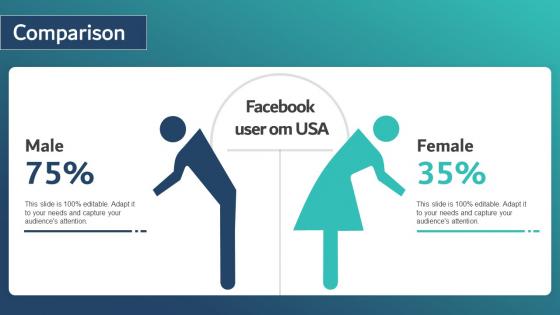
Comparison Healthcare Insurance App Capital Raising Pitch Deck Infographics Pdf
The Comparison Healthcare Insurance App Capital Raising Pitch Deck Infographics Pdf is a compilation of the most recent design trends as a series of slides. It is suitable for any subject or industry presentation, containing attractive visuals and photo spots for businesses to clearly express their messages. This template contains a variety of slides for the user to input data, such as structures to contrast two elements, bullet points, and slides for written information. Slidegeeks is prepared to create an impression. Our Comparison Healthcare Insurance App Capital Raising Pitch Deck Infographics Pdf are topically designed to provide an attractive backdrop to any subject. Use them to look like a presentation pro.
Graphical Exploratory Data Analysis Powerpoint Slides Clipart
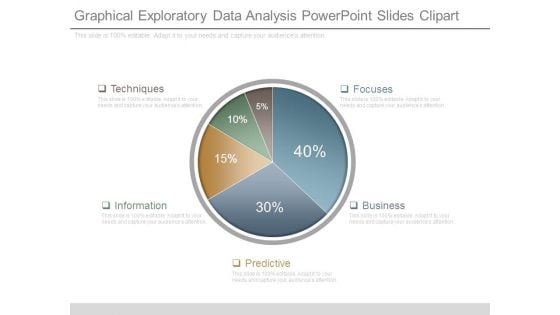
This is a graphical exploratory data analysis powerpoint slides clipart. This is a five stage process. The stages in this process are techniques, information, predictive, focuses, business.
Framework For Forensic Crime Accounting Of Mobile Money Transactions Template PDF
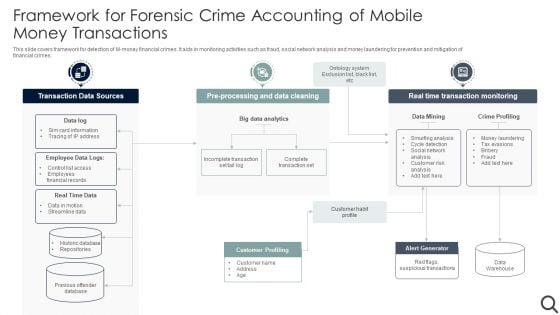
This slide covers framework for detection of M money financial crimes. It aids in monitoring activities such as fraud, social network analysis and money laundering for prevention and mitigation of financial crimes. Showcasing this set of slides titled Framework For Forensic Crime Accounting Of Mobile Money Transactions Template PDF. The topics addressed in these templates are Big Data Analytics, Transaction Data Sources, Customer Profiling. All the content presented in this PPT design is completely editable. Download it and make adjustments in color, background, font etc. as per your unique business setting.
Business Intelligence And Big Key Essential Features Of Data Analytics Tools Topics PDF
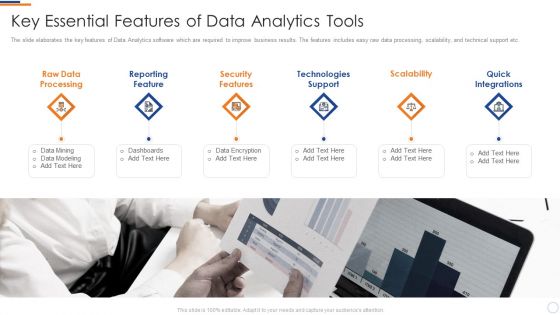
The slide elaborates the key features of Data Analytics software which are required to improve business results. The features includes easy raw data processing, scalability, and technical support etc. This is a business intelligence and big key essential features of data analytics tools topics pdf template with various stages. Focus and dispense information on six stages using this creative set, that comes with editable features. It contains large content boxes to add your information on topics like raw data processing, reporting feature, security features, technologies support, scalability quick integrations. You can also showcase facts, figures, and other relevant content using this PPT layout. Grab it now.


 Continue with Email

 Home
Home


