Revenue Graph
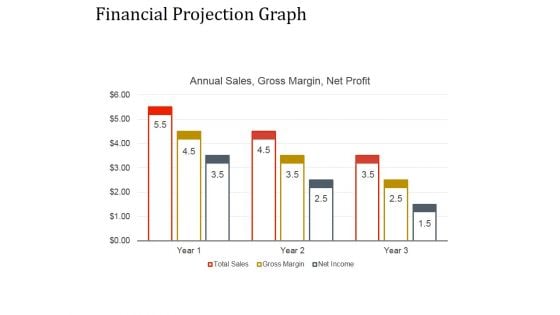
Financial Projection Graph Template 2 Ppt PowerPoint Presentation Ideas
This is a financial projection graph template 2 ppt powerpoint presentation ideas. This is a nine stage process. The stages in this process are annual sales, business, management, marketing, strategy.
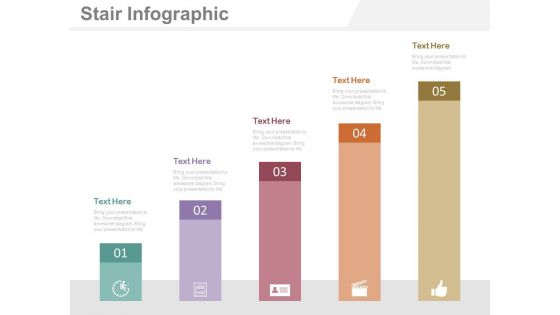
Five Steps Bar Graph For Financial Management Powerpoint Slides
This PowerPoint template has been designed with five steps bar graph and icons. This diagram is useful to exhibit financial management. This diagram slide can be used to make impressive presentations.
Bar Graph With Financial Ratio And Icons Powerpoint Template
Visually support your presentation with our above template containing bar graph with icons. This diagram slide helps to exhibit financial ratio analysis. Etch your views in the brains of your audience with this diagram slide.
Bar Graph Financial Sales Product Ppt PowerPoint Presentation Icon Vector
This is a bar graph financial sales product ppt powerpoint presentation icon vector. This is a five stage process. The stages in this process are business, management, financial, marketing, sales.
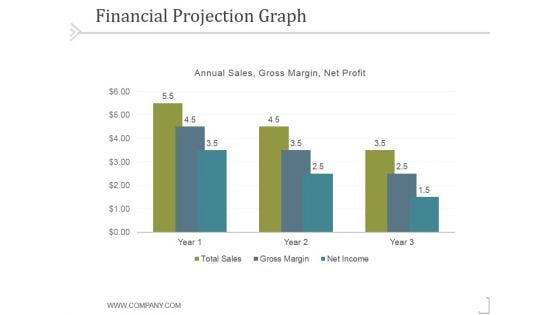
Financial Projection Graph Template 2 Ppt PowerPoint Presentation Template
This is a financial projection graph template 2 ppt powerpoint presentation template. This is a three stage process. The stages in this process are business, strategy, marketing, success, analysis.
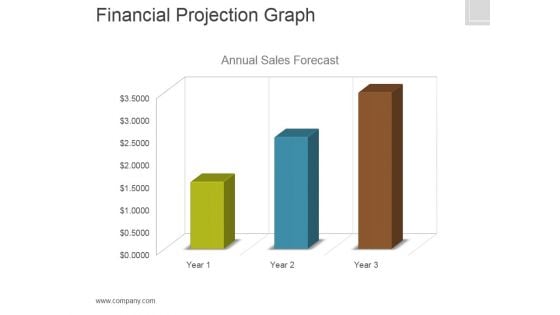
Financial Projection Graph Template 1 Ppt PowerPoint Presentation Clipart
This is a financial projection graph template 1 ppt powerpoint presentation clipart. This is a three stage process. The stages in this process are annual, sales, forecast, finance, marketing.
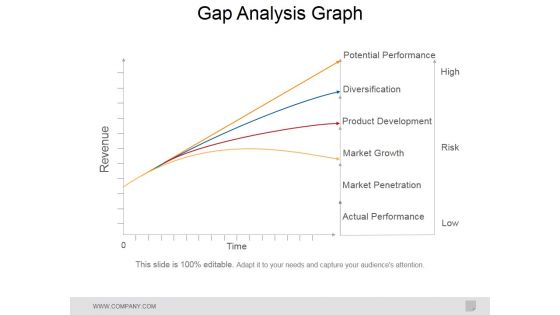
Gap Analysis Graph Ppt PowerPoint Presentation Portfolio Topics
This is a gap analysis graph ppt powerpoint presentation portfolio topics. This is a four stage process. The stages in this process are potential performance, diversification, product development, market growth, market penetration, actual performance.
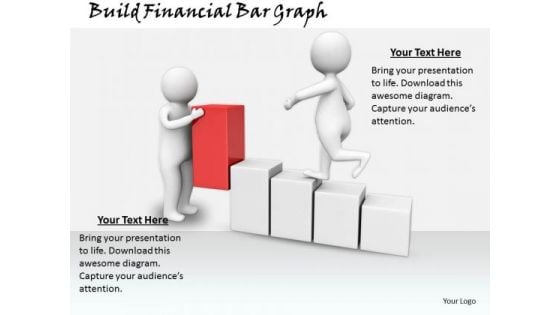
Total Marketing Concepts Build Financial Bar Graph Business Statement
Drink To The Success Of Your Campaign. Our Total Marketing Concepts Build Financial Bar Graph Business Statement Powerpoint Templates Will Raise A Toast. Pass It Around On Our People Powerpoint Templates. Your Audience Will Lap It Up.
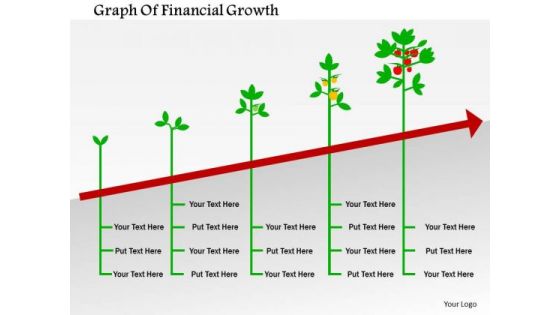
Business Diagram Graph Of Financial Growth Presentation Template
Tree design bar graph has been used to craft this power point template diagram. This PPT contains the concept of financial growth. Use this PPT diagram for finance and business related presentations.
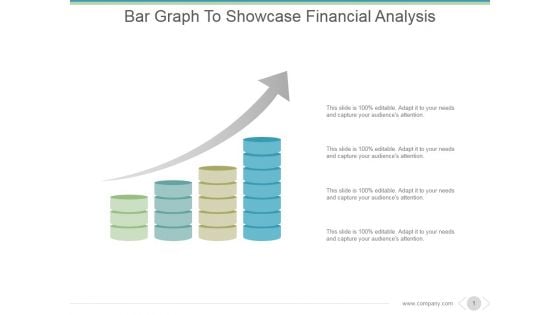
Bar Graph To Showcase Financial Analysis Ppt PowerPoint Presentation Professional
This is a bar graph to showcase financial analysis ppt powerpoint presentation professional. This is a four stage process. The stages in this process are business, marketing, growth, success, arrows.
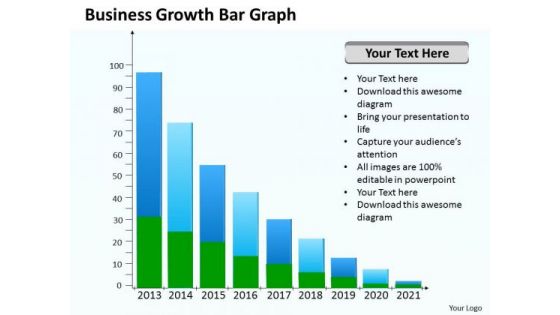
Business PowerPoint Template Growth Bar Graph Ppt Templates
Our Business powerpoint template growth bar graph ppt templates make good beasts of burden. Place all your demands on them. Deliver the right dose with our Arrows PowerPoint Templates. Your ideas will get the correct illumination. Your abilities have been lying dormant. Awaken them with our Marketing PowerPoint Templates. Promote your views with our Business PowerPoint Template Growth Bar Graph Ppt Templates. Download without worries with our money back guaranteee.
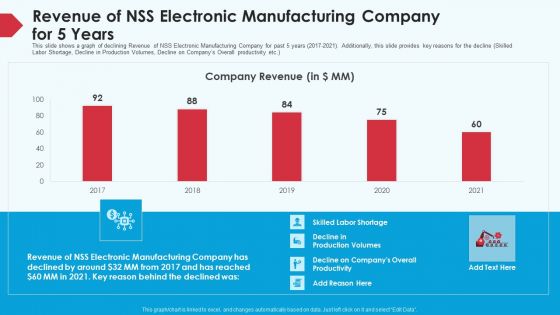
Skill Shortage In A Production Firm Case Study Solution Revenue Of NSS Electronic Manufacturing Company For 5 Years Diagrams PDF
This slide shows a graph of declining Revenue of NSS Electronic Manufacturing Company for past 5 years 2017-2021. Additionally, this slide provides key reasons for the decline Skilled Labor Shortage, Decline in Production Volumes, Decline on Companys Overall productivity etc. Deliver an awe inspiring pitch with this creative skill shortage in a production firm case study solution revenue of NSS electronic manufacturing company for 5 years diagrams pdf bundle. Topics like revenue, manufacturing, companys overall productivity, 2017 to 2021 can be discussed with this completely editable template. It is available for immediate download depending on the needs and requirements of the user.
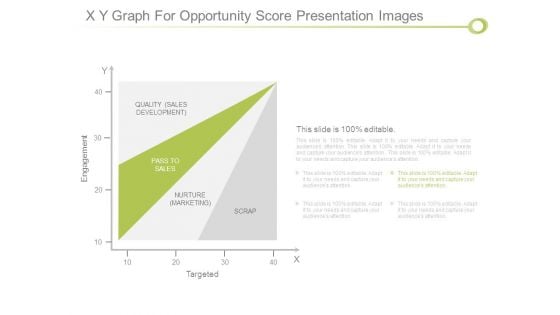
X Y Graph For Opportunity Score Presentation Images
This is a x y graph for opportunity score presentation images. This is a one stage process. The stages in this process are engagement, quality sales development, pass to sales, nurture marketing, scrap, targeted.
Clustered Column Graph Finance Investment Ppt PowerPoint Presentation Outline Icons
This is a clustered column graph finance investment ppt powerpoint presentation outline icons. This is a three stage process. The stages in this process are finance, investment, business, marketing, analysis.
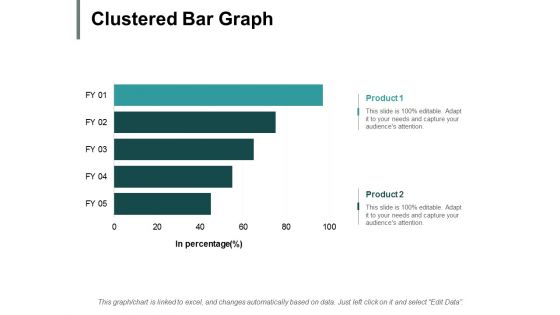
Clustered Bar Graph Ppt PowerPoint Presentation Pictures Example File
This is a clustered bar graph ppt powerpoint presentation pictures example file. This is a two stage process. The stages in this process are finance, marketing, management, investment, analysis.
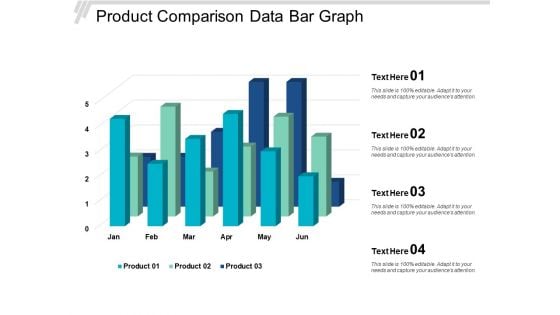
Product Comparison Data Bar Graph Ppt Powerpoint Presentation Slides Show
This is a product comparison data bar graph ppt powerpoint presentation slides show. This is a four stage process. The stages in this process are data presentation, content presentation, information presentation.
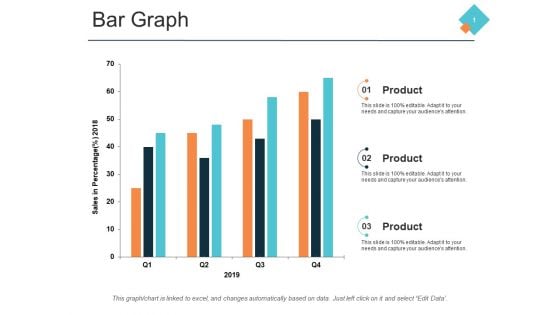
Bar Graph Marketing Process Ppt PowerPoint Presentation Ideas Example Introduction
This is a bar graph marketing process ppt powerpoint presentation ideas example introduction. This is a three stage process. The stages in this process are finance, management, strategy, analysis, marketing.
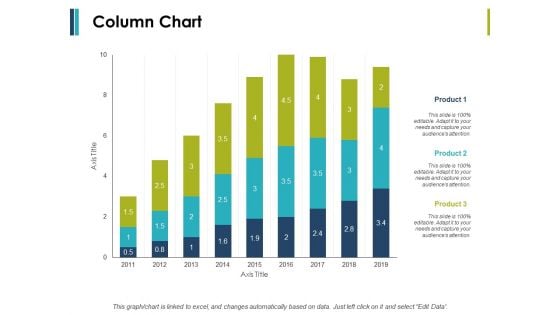
Column Chart And Graph Ppt PowerPoint Presentation File Introduction
This is a column chart and graph ppt powerpoint presentation file introduction. This is a three stage process. The stages in this process are finance, marketing, management, investment, analysis.

Stakeholders Fund And Market Analysis Bar Graph Powerpoint Slide Information
This is a stakeholders fund and market analysis bar graph powerpoint slide information. This is a five stage process. The stages in this process are shareholders funds, market capitalization, market capitalization as a percentage of cse market capitalization.
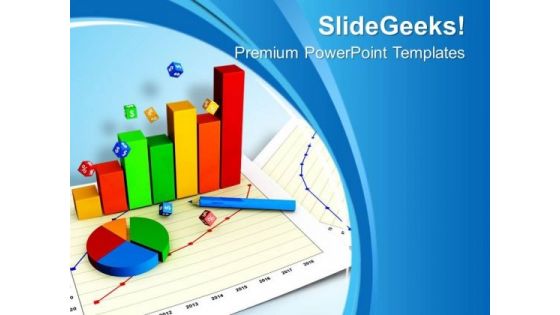
Statistical Graph Illustration PowerPoint Templates Ppt Backgrounds For Slides 0713
Draw away from doubts with our Statistical Graph Illustration PowerPoint Templates PPT Backgrounds For Slides 0713. Connect your thoughts to the positives. Attract a crowd with our Pie charts PowerPoint Templates. They will drop it all and come to hear you. They will come in droves to hear your views. Our Sales PowerPoint Templates will have them dripping excitement. Manage growth with our Statistical Graph Illustration PowerPoint Templates Ppt Backgrounds For Slides 0713. Download without worries with our money back guaranteee.
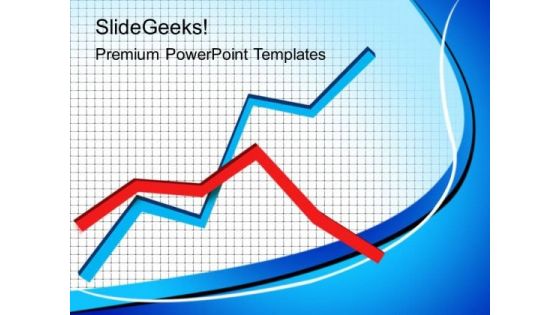
Business Graph Marketing PowerPoint Templates And PowerPoint Themes 0212
Microsoft Powerpoint Templates and Background with three dimensional diagram Our Business Graph Marketing PowerPoint Templates And PowerPoint Themes 0212 come at a comfortable cost. They are definitely an economical choice.
Map Diagram With Bar Graph And Icons Powerpoint Slides
This PowerPoint template displays graphics of map diagram with bar graph and icons. This Map template can be used in business presentations to depict economic analysis. This slide can also be used by school students for educational projects.
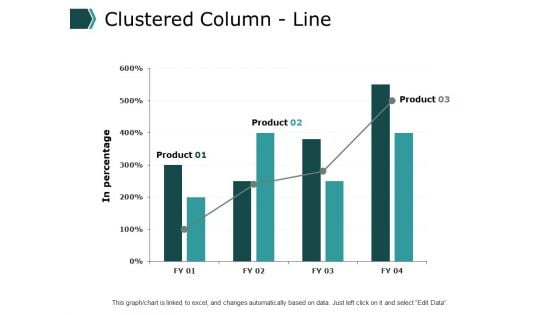
Clustered Column Line Graph Ppt PowerPoint Presentation Ideas Demonstration
This is a clustered column line graph ppt powerpoint presentation ideas demonstration. This is a three stage process. The stages in this process are financial, minimum, maximum, marketing, strategy.
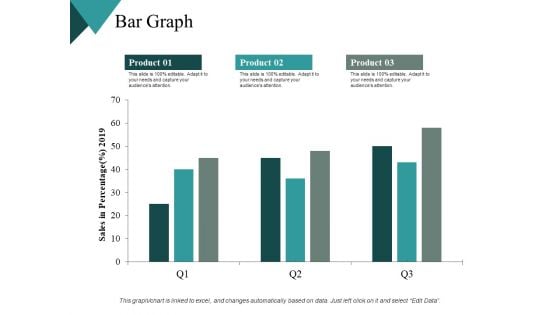
Bar Graph Finance Ppt PowerPoint Presentation Outline Background Designs
This is a bar graph finance ppt powerpoint presentation outline background designs. This is a three stage process. The stages in this process are financial, maximum, medium, minimum, marketing.
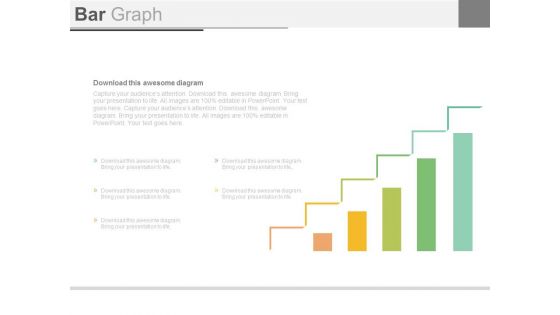
Bar Graph For Business Growth Steps Powerpoint Slides
This PowerPoint template contains design of bar graph with icons. You may download this slide to display strategy steps for business growth. You can easily customize this template to make it more unique as per your need.
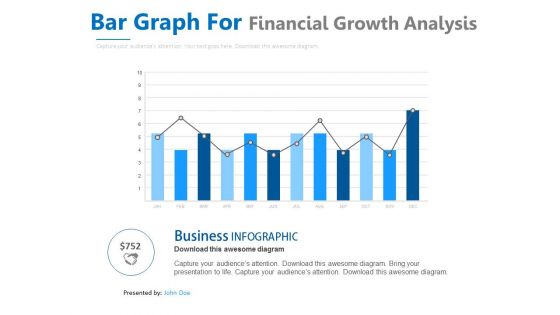
Bar Graph With Line Chart For Analysis Powerpoint Slides
This PowerPoint template contains design of bar graph with line chart. You may download this slide to display strategy steps for business growth. You can easily customize this template to make it more unique as per your need.
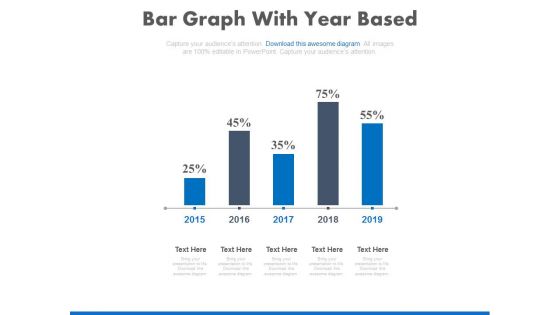
Bar Graph With Yearly Statistical Analysis Powerpoint Slides
This PowerPoint template contains diagram of bar graph with yearly percentage ratios. You may download this slide to display statistical analysis. You can easily customize this template to make it more unique as per your need.

Project Performance Bar Graph Ppt PowerPoint Presentation Outline
This is a project performance bar graph ppt powerpoint presentation outline. This is a four stage process. The stages in this process are finance, year, business, marketing, future, marketing.
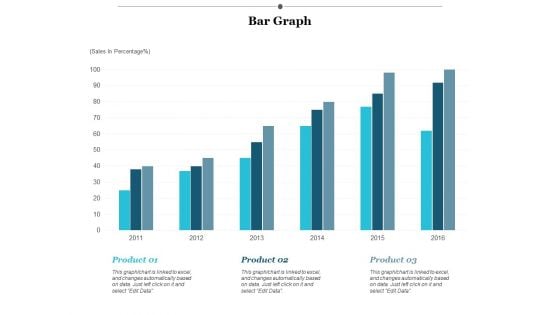
Bar Graph Finance Ppt PowerPoint Presentation Infographics Designs Download
This is a bar graph finance ppt powerpoint presentation infographics designs download. This is a three stage process. The stages in this process are finance, marketing, management, investment, analysis.
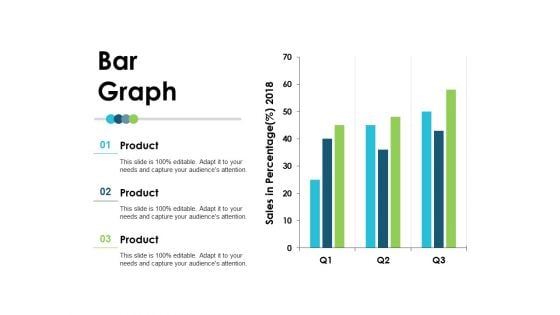
Bar Graph Employee Value Proposition Ppt PowerPoint Presentation File Layout
This is a bar graph employee value proposition ppt powerpoint presentation file layout. This is a three stage process. The stages in this process are business, management, strategy, analysis, marketing.
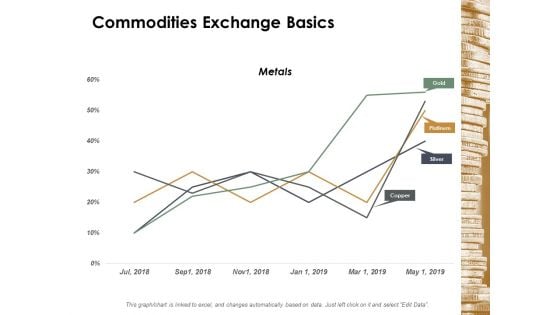
Commodities Exchange Basics Ppt Powerpoint Presentation Diagram Graph Charts
This is a commodities exchange basics ppt powerpoint presentation diagram graph charts. This is a four stage process. The stages in this process are finance, marketing, management, investment, analysis.
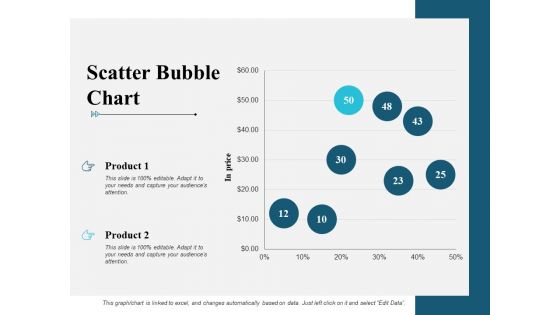
Scatter Bubble Chart Graph Ppt PowerPoint Presentation Infographic Template Maker
This is a scatter bubble chart graph ppt powerpoint presentation infographic template maker. This is a two stage process. The stages in this process are finance, marketing, management, investment, analysis.

Donut Pie Chart Graph Ppt PowerPoint Presentation File Styles
This is a donut pie chart graph ppt powerpoint presentation file styles. This is a three stage process. The stages in this process are finance, marketing, management, investment, analysis.
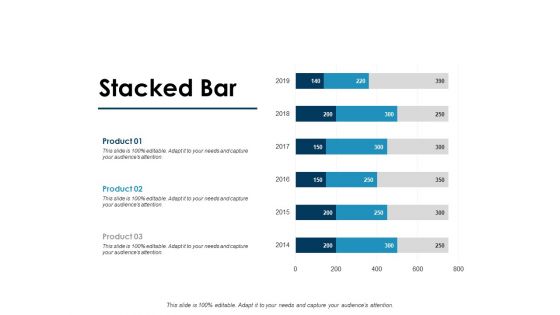
Stacked Bar Graph Ppt PowerPoint Presentation Portfolio Slide Portrait
This is a stacked bar graph ppt powerpoint presentation portfolio slide portrait. This is a three stage process. The stages in this process are finance, marketing, management, investment, analysis.
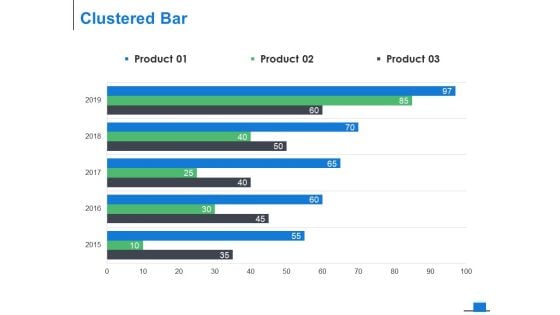
Clustered Bar Graph Ppt PowerPoint Presentation Model Background Designs
This is a clustered bar graph ppt powerpoint presentation model background designs. This is a three stage process. The stages in this process are finance, marketing, management, investment, analysis.
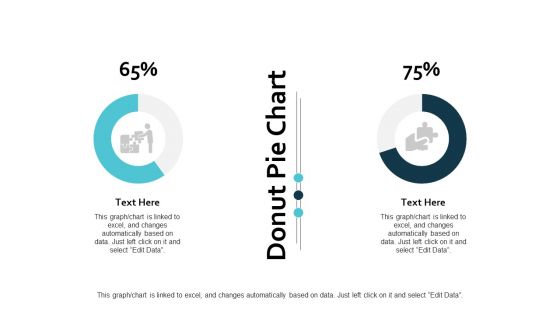
Donut Pie Chart Graph Ppt PowerPoint Presentation Ideas Guidelines
This is a donut pie chart graph ppt powerpoint presentation ideas guidelines. This is a three stage process. The stages in this process are finance, marketing, management, investment, analysis.
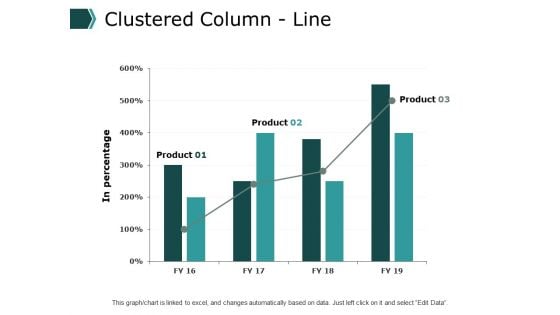
Clustered Column Line Graph Ppt PowerPoint Presentation File Clipart
This is a clustered column line graph ppt powerpoint presentation file clipart. This is a three stage process. The stages in this process are finance, marketing, management, investment, analysis.
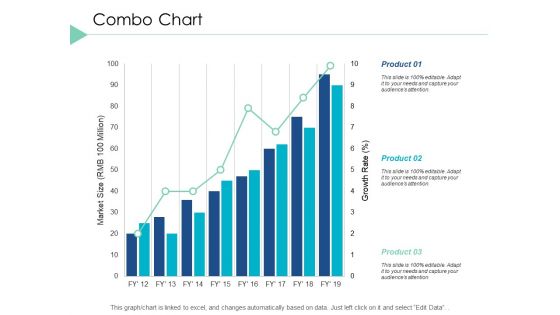
Combo Chart Graph Ppt PowerPoint Presentation Infographic Template Layout Ideas
This is a combo chart graph ppt powerpoint presentation infographic template layout ideas. This is a three stage process. The stages in this process are finance, marketing, analysis, investment, million.
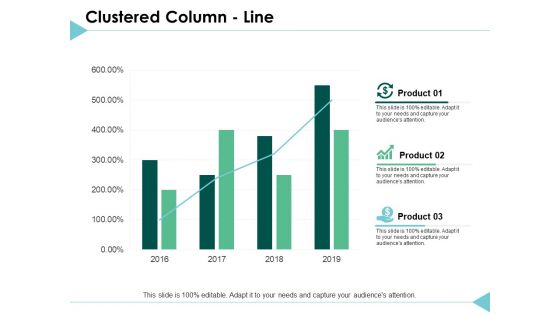
Clustered Column Line Graph Ppt PowerPoint Presentation Inspiration Deck
This is a clustered column line graph ppt powerpoint presentation inspiration deck. This is a three stage process. The stages in this process are finance, marketing, analysis, investment, million.
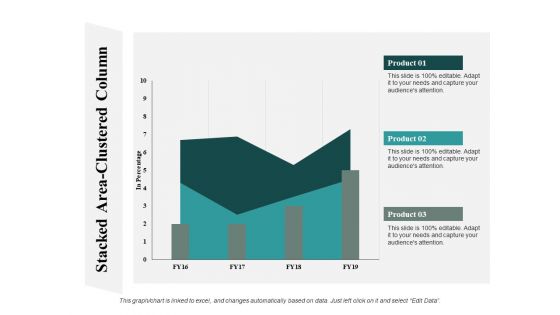
Stacked Area Clustered Column Graph Ppt PowerPoint Presentation Summary Guide
This is a stacked area clustered column graph ppt powerpoint presentation summary guide. This is a three stage process. The stages in this process are finance, marketing, analysis, investment, million.
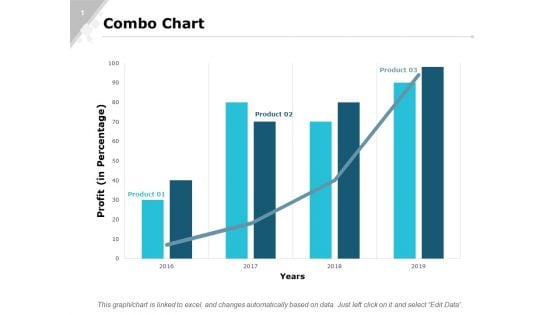
Combo Chart Graph Ppt PowerPoint Presentation Gallery Designs Download
This is a combo chart graph ppt powerpoint presentation gallery designs download. This is a three stage process. The stages in this process are finance, marketing, analysis, investment, million.
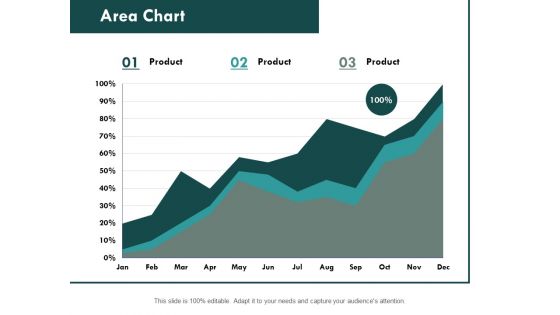
Area Chart Graph Ppt PowerPoint Presentation Professional Format Ideas
This is a column chart graph ppt powerpoint presentation slides file formats. This is a stage three process. The stages in this process are finance, marketing, analysis, investment, million.
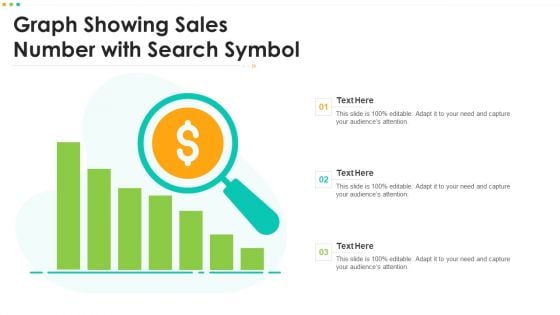
Graph Showing Sales Number With Search Symbol Professional PDF
Persuade your audience using this Graph Showing Sales Number With Search Symbol Professional PDF. This PPT design covers three stages, thus making it a great tool to use. It also caters to a variety of topics including Graph Showing Sales Number With Search Symbol. Download this PPT design now to present a convincing pitch that not only emphasizes the topic but also showcases your presentation skills.

Business Graph Success PowerPoint Themes And PowerPoint Slides 0411
Microsoft PowerPoint Theme and Slide with green arrow moving upwards rendering 2011 Motivate teams with our Business Graph Success PowerPoint Themes And PowerPoint Slides 0411. Download without worries with our money back guaranteee.
Graph With Arrows Business PowerPoint Themes And PowerPoint Slides 0411
Microsoft PowerPoint Theme and Slide with four arrows completing a circle Train your team with our Graph With Arrows Business PowerPoint Themes And PowerPoint Slides 0411. Download without worries with our money back guaranteee.

Success Graph Business PowerPoint Themes And PowerPoint Slides 0511
Microsoft PowerPoint Theme and Slide with its 3d image about is rivaly anger and superiority Lead teams with our Success Graph Business PowerPoint Themes And PowerPoint Slides 0511. Download without worries with our money back guaranteee.
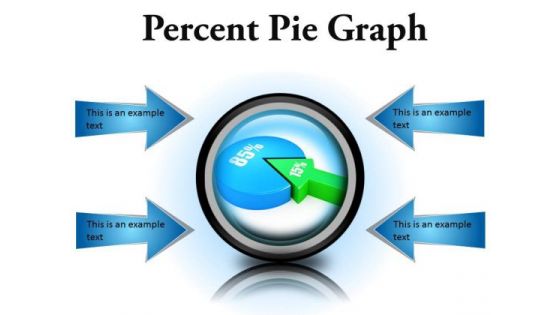
Percent Pie Graph Business PowerPoint Presentation Slides Cc
Microsoft PowerPoint Slides and Backgrounds with fifteen and eighty five percent proportion pie chart Record growth with our Percent Pie Graph Business PowerPoint Presentation Slides Cc. Download without worries with our money back guaranteee.

Money Graph Business PowerPoint Templates Ppt Backgrounds For Slides 0113
We present our Money Graph Business PowerPoint Templates PPT Backgrounds For Slides 0113.Download and present our Money PowerPoint Templates because Our PowerPoint Templates and Slides will give good value for money. They also have respect for the value of your time. Download and present our Finance PowerPoint Templates because You can Create a matrix with our PowerPoint Templates and Slides. Feel the strength of your ideas click into place. Download and present our Business PowerPoint Templates because Our PowerPoint Templates and Slides are focused like a searchlight beam. They highlight your ideas for your target audience. Download and present our Success PowerPoint Templates because Our PowerPoint Templates and Slides offer you the widest possible range of options. Download and present our Shapes PowerPoint Templates because Our PowerPoint Templates and Slides will weave a web of your great ideas. They are gauranteed to attract even the most critical of your colleagues.Use these PowerPoint slides for presentations relating to Money graph, Money, Finance, Business, Success, Shapes. The prominent colors used in the PowerPoint template are Green, White, Black. You can be sure our Money Graph Business PowerPoint Templates PPT Backgrounds For Slides 0113 will make the presenter look like a pro even if they are not computer savvy. Professionals tell us our Success PowerPoint templates and PPT Slides are specially created by a professional team with vast experience. They diligently strive to come up with the right vehicle for your brilliant Ideas. Customers tell us our Money Graph Business PowerPoint Templates PPT Backgrounds For Slides 0113 will make the presenter look like a pro even if they are not computer savvy. Presenters tell us our Money PowerPoint templates and PPT Slides are incredible easy to use. We assure you our Money Graph Business PowerPoint Templates PPT Backgrounds For Slides 0113 are visually appealing. Presenters tell us our Success PowerPoint templates and PPT Slides are topically designed to provide an attractive backdrop to any subject. Get face to face with your audience. Put your thoughts and our Money Graph Business PowerPoint Templates Ppt Backgrounds For Slides 0113 right up front.
Profit Graph Success PowerPoint Templates And PowerPoint Themes 1012
Create visually stunning and define your PPT Presentations in a unique and inspiring manner using our above template which contains a graphic of multicolored profit graph. This image has been professionally designed to emphasize the concept of profit and success. This image has been conceived to enable you to emphatically communicate your ideas in your Business and Finance PPT presentations. Go ahead and add personality to your presentations with our colorful template. Troubleshoot problems with our Profit Graph Success PowerPoint Templates And PowerPoint Themes 1012. Download without worries with our money back guaranteee.
Growth Graph Finance PowerPoint Themes And PowerPoint Slides 0511
Microsoft PowerPoint Theme and Slide with businessman adding a red bar chart to increase financial growth Our Growth Graph Finance PowerPoint Themes And PowerPoint Slides 0511 empower educators. Conveying concepts and ideas becomes easier.
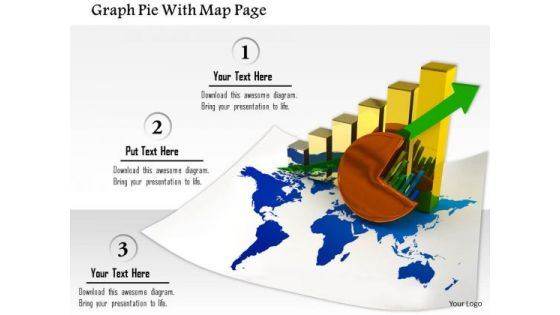
Stock Photo Graph Pie With Map Page PowerPoint Slide
This image slide contains business charts on world map. This image is designed with bar graph and pie chart on world map depicting global economy. Use this image slide to represent financial growth in any business presentation.
Bar Graph Icon Showcasing Product Earning Breakup Guidelines PDF
Persuade your audience using this Bar Graph Icon Showcasing Product Earning Breakup Guidelines PDF. This PPT design covers Three stages, thus making it a great tool to use. It also caters to a variety of topics including Icon Showcasing, Product Earning Breakup. Download this PPT design now to present a convincing pitch that not only emphasizes the topic but also showcases your presentation skills.

Business Graph Money Sales PowerPoint Templates And PowerPoint Themes 1112
We present our Business Graph Money Sales PowerPoint Templates And PowerPoint Themes 1112.Use our Marketing PowerPoint Templates because, Weak Links & Chains:- Chain reactions and the element of teamwork add value to your efforts. Use our Success PowerPoint Templates because, They pinpoint the core values of your organisation. Use our Business PowerPoint Templates because, Sales Template:- Generation of sales is the core of any business. Use our Finance PowerPoint Templates because,represent the proress in our lives. Use our Money PowerPoint Templates because, You have a great training programme in mind to upgrade the skills of your staff.Use these PowerPoint slides for presentations relating to Money growth, money, marketing, finance, business, success. The prominent colors used in the PowerPoint template are Blue, Black, Gray Our Business Graph Money Sales PowerPoint Templates And PowerPoint Themes 1112 are truly fair minded. They take all arguments into account.
Business Graph 2013 PowerPoint Templates Ppt Backgrounds For Slides 1212
We present our Business Graph 2013 PowerPoint Templates PPT Backgrounds For Slides 1212.Use our Global PowerPoint Templates because so that you can Lead the way to spread good cheer to one and all. Download our Arrows PowerPoint Templates because they highlight the depth of your thought process. Use our New year PowerPoint Templates because you can Employ the right colours for your brilliant ideas. Present our Finance PowerPoint Templates because let this slide illustrates others piggyback on you to see well over the horizon. Use our Business PowerPoint Templates because watch the excitement levels rise as they realise their worth.Use these PowerPoint slides for presentations relating to Business growth of profits in 2013, global, arrows, new year, money, finance . The prominent colors used in the PowerPoint template are Blue, Red, Green. Professionals tell us our Business Graph 2013 PowerPoint Templates PPT Backgrounds For Slides 1212 are Endearing. You can be sure our 2013 PowerPoint templates and PPT Slides are second to none. PowerPoint presentation experts tell us our Business Graph 2013 PowerPoint Templates PPT Backgrounds For Slides 1212 are Radiant. Use our in PowerPoint templates and PPT Slides will get their audience's attention. Professionals tell us our Business Graph 2013 PowerPoint Templates PPT Backgrounds For Slides 1212 will get their audience's attention. People tell us our arrows PowerPoint templates and PPT Slides are Radiant. Familiarise your team with your beliefs. Display your credo on our Business Graph 2013 PowerPoint Templates Ppt Backgrounds For Slides 1212.
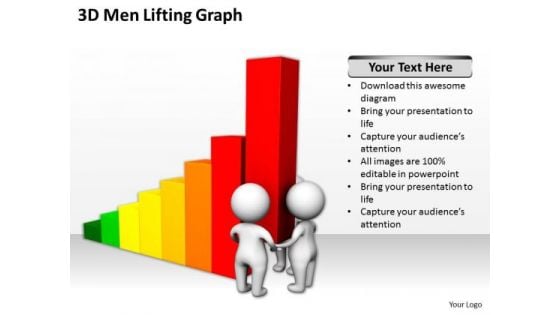
Successful Business Men 3d Lifting Graph PowerPoint Slides
We present our successful business men 3d lifting graph PowerPoint Slides.Download our Business PowerPoint Templates because Our PowerPoint Templates and Slides are aesthetically designed to attract attention. We gaurantee that they will grab all the eyeballs you need. Download and present our People PowerPoint Templates because Our PowerPoint Templates and Slides are created by a hardworking bunch of busybees. Always flitting around with solutions gauranteed to please. Present our Finance PowerPoint Templates because It is Aesthetically crafted by artistic young minds. Our PowerPoint Templates and Slides are designed to display your dexterity. Download our Success PowerPoint Templates because You can Connect the dots. Fan expectations as the whole picture emerges. Download and present our Marketing PowerPoint Templates because You are well armed with penetrative ideas. Our PowerPoint Templates and Slides will provide the gunpowder you need.Use these PowerPoint slides for presentations relating to 3d, abstract, accounting, achievement, advantage, bar, bar graph, bar-chart, bar-graph, business, cartoon, chart, company, concept, corporate, financial, graph, growth, help, icon, idiom, lifting, lifting the bar, market, meeting, men, metaphor, partnership, people, performance, presentation, progress, report, strength, team, teamwork. The prominent colors used in the PowerPoint template are Red, Yellow, Green. Position yourself with our Successful Business Men 3d Lifting Graph PowerPoint Slides. Download without worries with our money back guaranteee.

Melting Profits Bar Graph Business PowerPoint Backgrounds And Templates 1210
Microsoft PowerPoint Template and Background with 3d illustration of a glowing green and silver up arrow symbol sitting in a puddle of silver liquid on a dark gray reflective surface Your ideas will never go out of fashion. Our Melting Profits Bar Graph Business PowerPoint Backgrounds And Templates 1210 will keep them contemporary.

Up Graph Business PowerPoint Themes And PowerPoint Slides 0711
Microsoft PowerPoint Theme and Slide with concept of business on the rise with man who claims an arrow Our Up Graph Business PowerPoint Themes And PowerPoint Slides 0711 are not a figment of imagination. They actually help in day to day aspects.
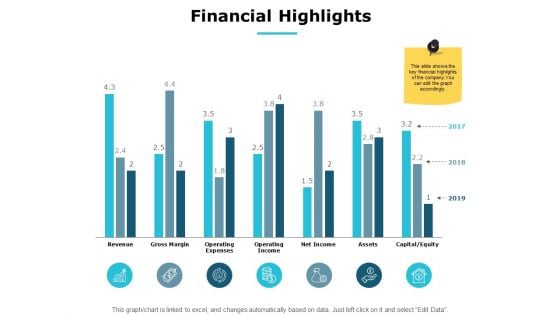
Financial Highlights Graph Ppt PowerPoint Presentation Ideas Good
Presenting this set of slides with name financial highlights graph ppt powerpoint presentation ideas good. This is a six stage process. The stages in this process are finance, marketing, management, investment, analysis. This is a completely editable PowerPoint presentation and is available for immediate download. Download now and impress your audience.
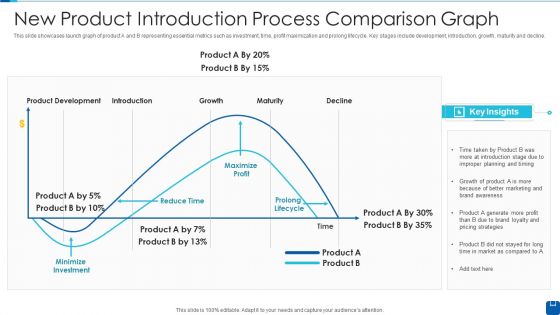
New Product Introduction Process Comparison Graph Slides PDF
This slide showcases launch graph of product A and B representing essential metrics such as investment, time, profit maximization and prolong lifecycle. Key stages include development, introduction, growth, maturity and decline.Showcasing this set of slides titled New Product Introduction Process Comparison Graph Slides PDF The topics addressed in these templates are Product Development, Improper Planning, Minimize Investment All the content presented in this PPT design is completely editable. Download it and make adjustments in color, background, font etc. as per your unique business setting.
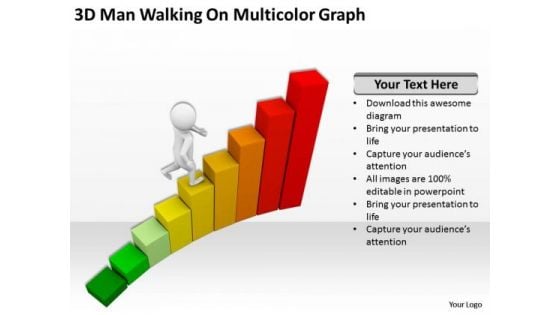
People Business 3d Man Walking On Multicolor Graph PowerPoint Slides
We present our people business 3d man walking on multicolor graph PowerPoint Slides.Use our People PowerPoint Templates because Our PowerPoint Templates and Slides will Embellish your thoughts. They will help you illustrate the brilliance of your ideas. Use our Business PowerPoint Templates because They will bring a lot to the table. Their alluring flavours will make your audience salivate. Use our Process and Flows PowerPoint Templates because You are working at that stage with an air of royalty. Let our PowerPoint Templates and Slides be the jewels in your crown. Use our Success PowerPoint Templates because Our PowerPoint Templates and Slides are the chords of your song. String them along and provide the lilt to your views. Download and present our Steps PowerPoint Templates because You can Rise to the occasion with our PowerPoint Templates and Slides. You will bring your audience on their feet in no time.Use these PowerPoint slides for presentations relating to 3d, bar, bar graph, boss, business, businessman, career, chart, colorful, data, diversity, finish, going, graph, human, ladder, male, man, manager, nobody, people, report, run, runner, shape, silhouette, staircase, stairs, start, steps, success, unrecognizable, various, walking, work, worker . The prominent colors used in the PowerPoint template are White, Red, Yellow. Eliminate doubts with our People Business 3d Man Walking On Multicolor Graph PowerPoint Slides. Download without worries with our money back guaranteee.


 Continue with Email

 Home
Home


