Revenue Graph
Graph Growth Of Dollars Finance PowerPoint Themes And PowerPoint Slides 0711
Microsoft PowerPoint Theme and Slide with graph representing growth sign of money Invite praises with our Graph Growth Of Dollars Finance PowerPoint Themes And PowerPoint Slides 0711. Make sure your presentation gets the attention it deserves.
Profit Graph With Green Arrow Business PowerPoint Templates And PowerPoint Backgrounds 0811
Microsoft PowerPoint Template and Background with profit graph with green arrows Don't let it drag with our Profit Graph With Green Arrow Business PowerPoint Templates And PowerPoint Backgrounds 0811. They help you keep it crisp and concise.
Profit Graph With Green Arrow Business PowerPoint Themes And PowerPoint Slides 0811
Microsoft PowerPoint Theme and Slide with profit graph with green arrows Our Profit Graph With Green Arrow Business PowerPoint Themes And PowerPoint Slides 0811 are fashioned for your thoughts. Your ideas will create a new fad.
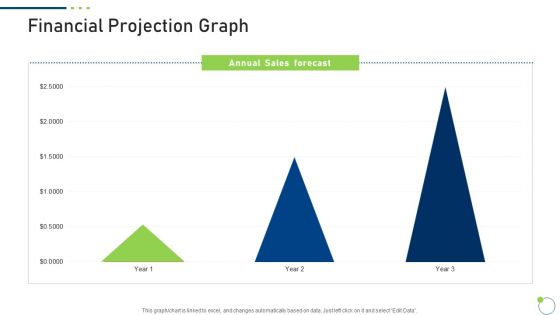
Investor Pitch Deck New Venture Capital Raising Financial Projection Graph Slide2 Portrait PDF
Deliver and pitch your topic in the best possible manner with this investor pitch deck new venture capital raising financial projection graph slide2 portrait pdf. Use them to share invaluable insights on annual sales, gross margin, net profit and impress your audience. This template can be altered and modified as per your expectations. So, grab it now.
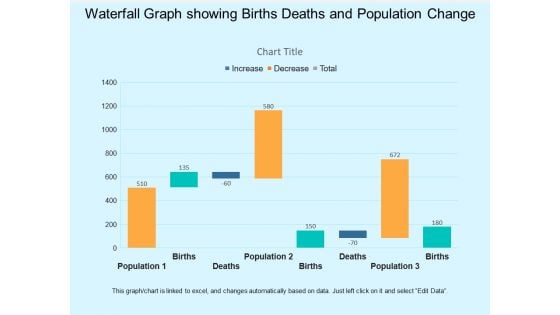
Waterfall Graph Showing Births Deaths And Population Change Ppt PowerPoint Presentation Infographic Template Visual Aids
This is a waterfall graph showing births deaths and population change ppt powerpoint presentation infographic template visual aids. This is a three stage process. The stages in this process are profit and loss, balance sheet, income statement, benefit and loss.
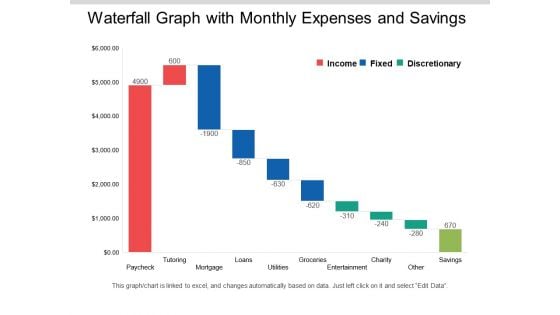
Waterfall Graph With Monthly Expenses And Savings Ppt PowerPoint Presentation Layouts Clipart Images
This is a waterfall graph with monthly expenses and savings ppt powerpoint presentation layouts clipart images. This is a three stage process. The stages in this process are profit and loss, balance sheet, income statement, benefit and loss.

Business Graph And Target Success PowerPoint Templates And PowerPoint Backgrounds 0311
Microsoft PowerPoint Template and Background with business graph and target Market your product with our Business Graph And Target Success PowerPoint Templates And PowerPoint Backgrounds 0311. Download without worries with our money back guaranteee.

Bar Graph With Arrow Success PowerPoint Templates And PowerPoint Themes 0412
Microsoft Powerpoint Templates and Background with graph of business Solve problems with our Bar Graph With Arrow Success PowerPoint Templates And PowerPoint Themes 0412. Download without worries with our money back guaranteee.
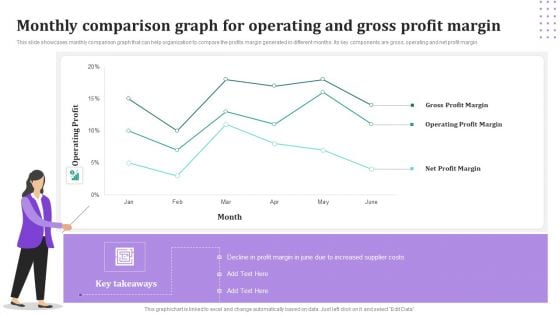
Monthly Comparison Graph For Operating And Gross Profit Margin Pictures PDF
This slide showcases monthly comparison graph that can help organization to compare the profits margin generated in different months. Its key components are gross, operating and net profit margin. Showcasing this set of slides titled Monthly Comparison Graph For Operating And Gross Profit Margin Pictures PDF. The topics addressed in these templates are Gross Profit Margin, Operating Profit Margin, Net Profit Margin. All the content presented in this PPT design is completely editable. Download it and make adjustments in color, background, font etc. as per your unique business setting.
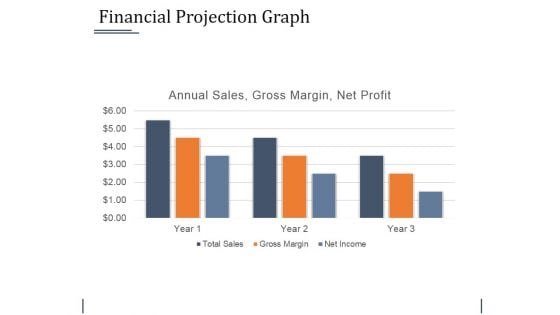
Financial Projection Graph Template 1 Ppt PowerPoint Presentation Professional Example Introduction
This is a financial projection graph template 1 ppt powerpoint presentation professional example introduction. This is a three stage process. The stages in this process are business, bar graph, finance, marketing, strategy, analysis.
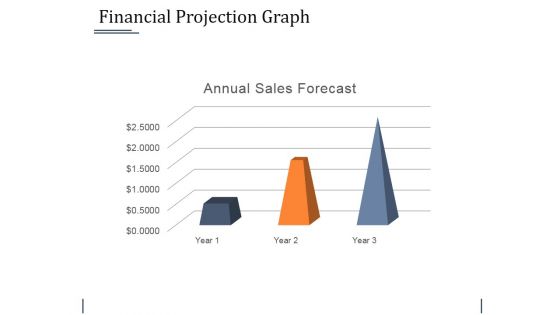
Financial Projection Graph Template 2 Ppt PowerPoint Presentation Infographic Template Gallery
This is a financial projection graph template 2 ppt powerpoint presentation infographic template gallery. This is a three stage process. The stages in this process are business, bar graph, finance, marketing, strategy, analysis.
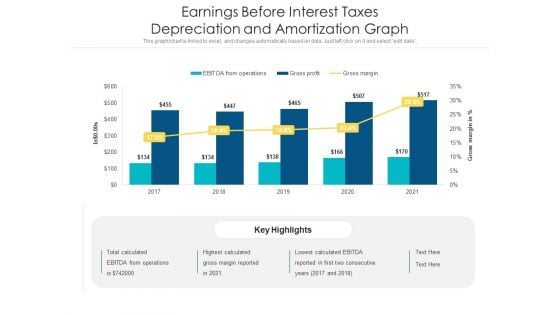
Earnings Before Interest Taxes Depreciation And Amortization Graph Ppt PowerPoint Presentation Styles Ideas PDF
Pitch your topic with ease and precision using this earnings before interest taxes depreciation and amortization graph ppt powerpoint presentation styles ideas pdf. This layout presents information on earnings before interest taxes depreciation and amortization graph. It is also available for immediate download and adjustment. So, changes can be made in the color, design, graphics or any other component to create a unique layout.
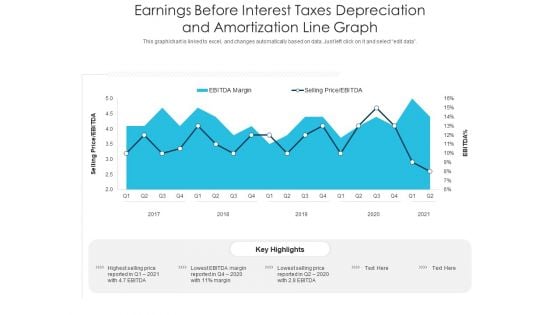
Earnings Before Interest Taxes Depreciation And Amortization Line Graph Ppt PowerPoint Presentation Layouts Aids PDF
Showcasing this set of slides titled earnings before interest taxes depreciation and amortization line graph ppt powerpoint presentation layouts aids pdf. The topics addressed in these templates are earnings before interest taxes depreciation and amortization line graph. All the content presented in this PPT design is completely editable. Download it and make adjustments in color, background, font etc. as per your unique business setting.

Bar Graph Growth With Earth PowerPoint Templates And PowerPoint Themes 0712
Bar Graph Growth With Earth PowerPoint Templates And PowerPoint Themes 0712-Microsoft Powerpoint Templates and Background with bar graph with global Encourage teams with our Bar Graph Growth With Earth PowerPoint Templates And PowerPoint Themes 0712. Download without worries with our money back guaranteee.
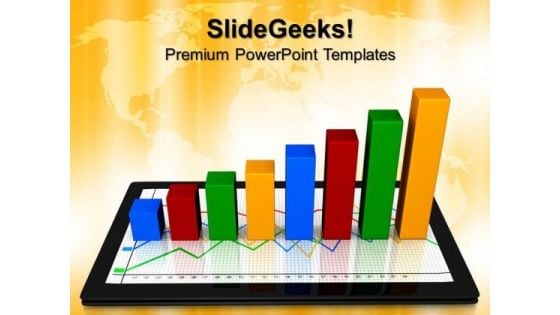
Computer Tablet With Graph Business PowerPoint Templates And PowerPoint Themes 0712
Computer Tablet With Graph Business PowerPoint Templates And PowerPoint Themes 0712-Microsoft Powerpoint Templates and Background with tablets with a business graph Command teams with our Computer Tablet With Graph Business PowerPoint Templates And PowerPoint Themes 0712. Download without worries with our money back guaranteee.
Business Graph Growth Dollar Finance PowerPoint Templates And PowerPoint Themes 0712
Business Graph Growth Dollar Finance PowerPoint Templates And PowerPoint Themes 0712-Microsoft Powerpoint Templates and Background with bar graph Reposition yourself with our Business Graph Growth Dollar Finance PowerPoint Templates And PowerPoint Themes 0712. Download without worries with our money back guaranteee.
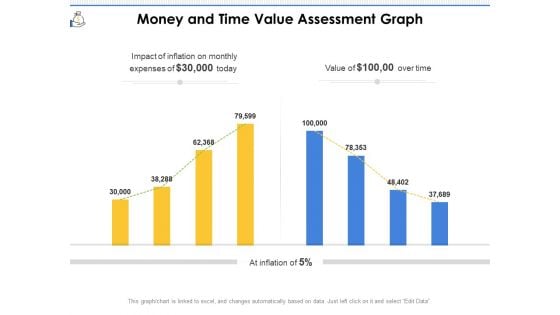
Money And Time Value Assessment Graph Ppt PowerPoint Presentation File Outline PDF
Presenting this set of slides with name money and time value assessment graph ppt powerpoint presentation file outline pdf. The topics discussed in these slides are inflation, expenses, value. This is a completely editable PowerPoint presentation and is available for immediate download. Download now and impress your audience.
Success Graph With Dollar Business PowerPoint Templates And PowerPoint Backgrounds 0511
Microsoft PowerPoint Template and Background with business graph from dollar coins with arrow showing profits Let new ideas filter in with our Success Graph With Dollar Business PowerPoint Templates And PowerPoint Backgrounds 0511. They will be acceptable to any audience.
Success Graph With Dollar Business PowerPoint Themes And PowerPoint Slides 0511
Microsoft PowerPoint Theme and Slide with business graph from dollar coins with arrow showing profits Get complimentary benefits with our Success Graph With Dollar Business PowerPoint Themes And PowerPoint Slides 0511. Recieve extra appreciation at no extra cost.
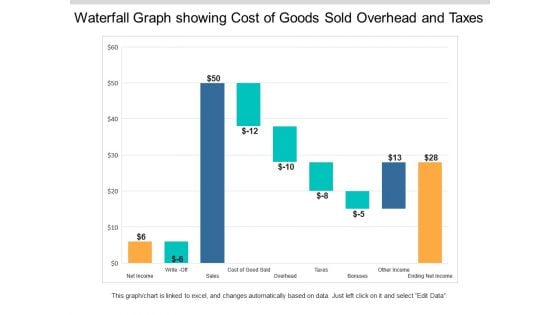
Waterfall Graph Showing Cost Of Goods Sold Overhead And Taxes Ppt PowerPoint Presentation Styles Example Topics
This is a waterfall graph showing cost of goods sold overhead and taxes ppt powerpoint presentation styles example topics. This is a three stage process. The stages in this process are profit and loss, balance sheet, income statement, benefit and loss.
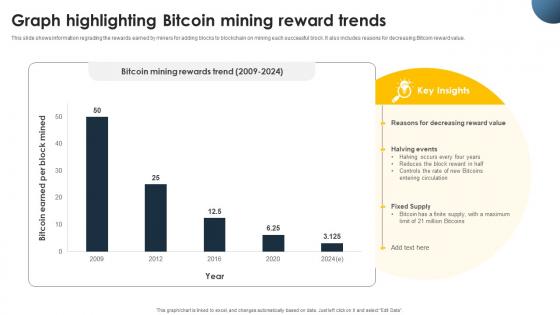
Complete Beginners Guide Graph Highlighting Bitcoin Mining Reward Trends Fin SS V
This slide shows information regrading the rewards earned by miners for adding blocks to blockchain on mining each successful block. It also includes reasons for decreasing Bitcoin reward value. Coming up with a presentation necessitates that the majority of the effort goes into the content and the message you intend to convey. The visuals of a PowerPoint presentation can only be effective if it supplements and supports the story that is being told. Keeping this in mind our experts created Complete Beginners Guide Graph Highlighting Bitcoin Mining Reward Trends Fin SS V to reduce the time that goes into designing the presentation. This way, you can concentrate on the message while our designers take care of providing you with the right template for the situation. This slide shows information regrading the rewards earned by miners for adding blocks to blockchain on mining each successful block. It also includes reasons for decreasing Bitcoin reward value.
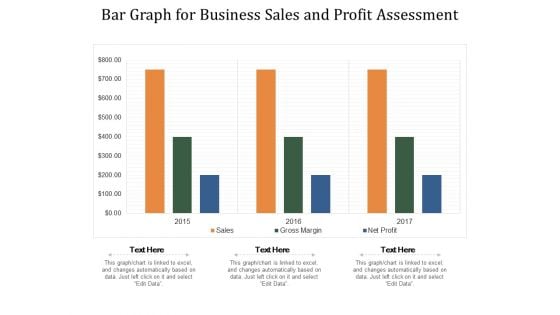
Bar Graph For Business Sales And Profit Assessment Ppt PowerPoint Presentation File Tips PDF
Presenting this set of slides with name bar graph for business sales and profit assessment ppt powerpoint presentation file tips pdf. The topics discussed in these slides are sales, gross margin, net profit. This is a completely editable PowerPoint presentation and is available for immediate download. Download now and impress your audience.
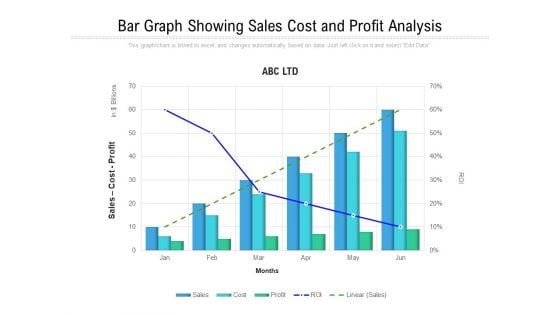
Bar Graph Showing Sales Cost And Profit Analysis Ppt PowerPoint Presentation Infographics Images PDF
Presenting this set of slides with name bar graph showing sales cost and profit analysis ppt powerpoint presentation infographics images pdf. The topics discussed in these slides are sales, cost, roi, profit. This is a completely editable PowerPoint presentation and is available for immediate download. Download now and impress your audience.
Profit Margin Growth Graph With Percentage Ratio Ppt PowerPoint Presentation Professional Icon PDF
Showcasing this set of slides titled profit margin growth graph with percentage ratio ppt powerpoint presentation professional icon pdf. The topics addressed in these templates are profit margin per sale, target per sales rep, 2017 to 2027. All the content presented in this PPT design is completely editable. Download it and make adjustments in color, background, font etc. as per your unique business setting.
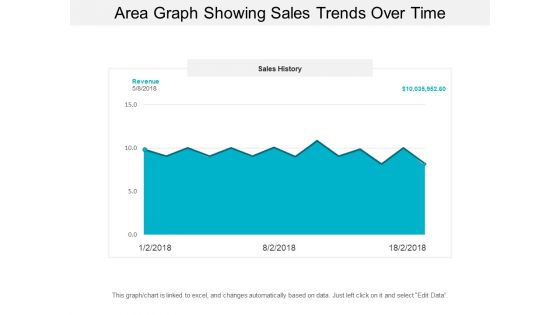
Area Graph Showing Sales Trends Over Time Ppt PowerPoint Presentation Model Background Designs
This is a area graph showing sales trends over time ppt powerpoint presentation model background designs. This is a three stage process. The stages in this process are financial analysis, quantitative, statistical modelling.
Bar Graph Showing Imported And Domestic Film Profit Ppt PowerPoint Presentation Icon Model PDF
Presenting this set of slides with name bar graph showing imported and domestic film profit ppt powerpoint presentation icon model pdf. The topics discussed in these slides are imported films, domestic films. This is a completely editable PowerPoint presentation and is available for immediate download. Download now and impress your audience.
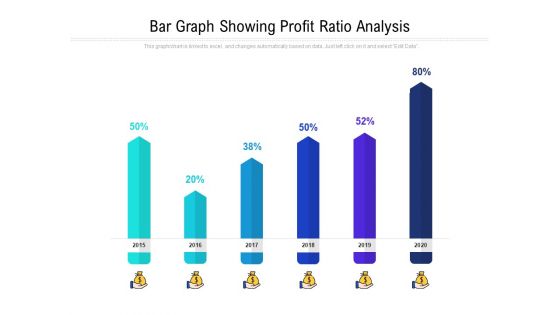
Bar Graph Showing Profit Ratio Analysis Ppt PowerPoint Presentation Styles Brochure PDF
Presenting this set of slides with name bar graph showing profit ratio analysis ppt powerpoint presentation styles brochure pdf. The topics discussed in these slides are 2015 to 2020. This is a completely editable PowerPoint presentation and is available for immediate download. Download now and impress your audience.
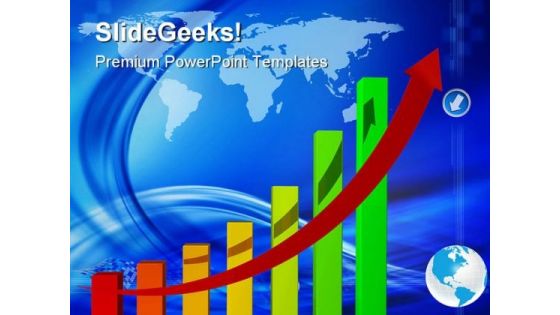
Statistique Of Business Graph Success PowerPoint Templates And PowerPoint Backgrounds 0411
Microsoft PowerPoint Template and Background with rainbow colored financial graph showing strong growth all the way up Our Statistique Of Business Graph Success PowerPoint Templates And PowerPoint Backgrounds 0411 are a complete customer delight. They deliver on every account.
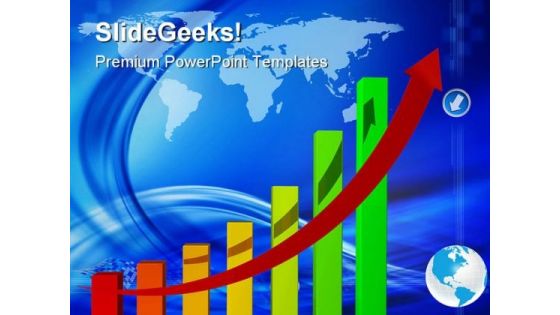
Statistique Of Business Graph Success PowerPoint Themes And PowerPoint Slides 0411
Microsoft PowerPoint Theme and Slide with rainbow colored financial graph showing strong growth all the way up Our Statistique Of Business Graph Success PowerPoint Themes And PowerPoint Slides 0411 are clear to even the farthest. They are designed for distance.
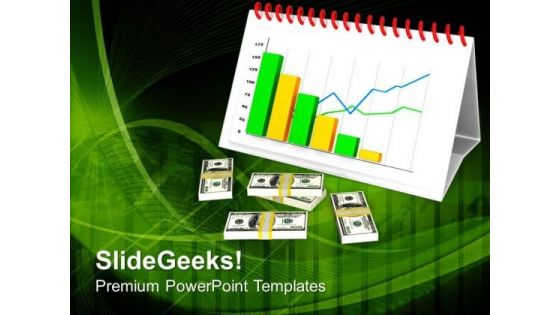
Bar Graph For Finance Growth PowerPoint Templates Ppt Backgrounds For Slides 0413
Be the doer with our Bar Graph For Finance Growth PowerPoint Templates PPT Backgrounds For Slides 0413. Put your thoughts into practice. Your ideas will do the trick. Wave the wand with our Bar Graph For Finance Growth PowerPoint Templates PPT Backgrounds For Slides 0413. Educate them on the actions required. Go through the drill with our Bar Graph For Finance Growth PowerPoint Templates Ppt Backgrounds For Slides 0413.
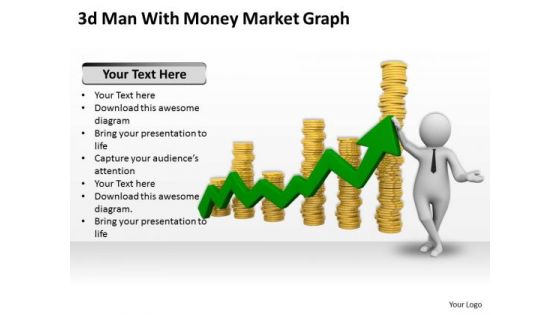
Business Strategy And Policy 3d Man With Money Market Graph Characters
Connect The Dots With Our business strategy and policy 3d man with money market graph characters Powerpoint Templates. Watch The Whole Picture Clearly Emerge.
Budgetary Trends Graph Icon With Magnifying Glass And Trend Line Introduction PDF
Presenting Budgetary Trends Graph Icon With Magnifying Glass And Trend Line Introduction PDF to dispense important information. This template comprises four stages. It also presents valuable insights into the topics including Budgetary Trends, Graph Icon, Magnifying Glass. This is a completely customizable PowerPoint theme that can be put to use immediately. So, download it and address the topic impactfully.
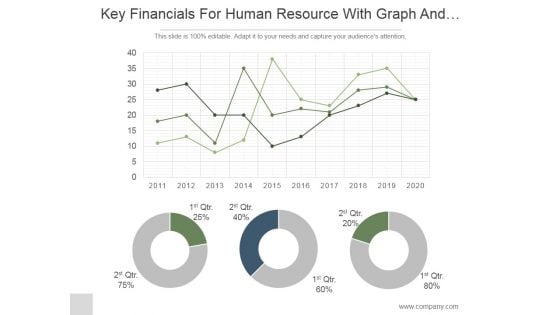
Key Financials For Human Resource With Graph And Pie Chart Ppt PowerPoint Presentation Ideas
This is a key financials for human resource with graph and pie chart ppt powerpoint presentation ideas. This is a three stage process. The stages in this process are business, strategy, marketing, analysis, donut, growth.
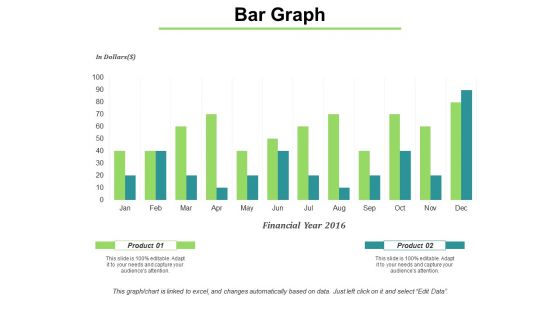
Bar Graph Shows Financial Values Ppt PowerPoint Presentation Infographic Template Gridlines
This is a bar graph shows financial values ppt powerpoint presentation infographic template gridlines. This is a two stage process. The stages in this process are bar, marketing, strategy, finance, planning.
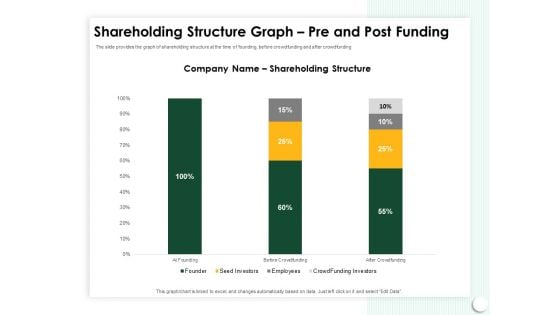
Startup Presentation For Collaborative Capital Funding Shareholding Structure Graph Pre And Post Funding Background PDF
Presenting this set of slides with name startup presentation for collaborative capital funding shareholding structure graph pre and post funding background pdf. The topics discussed in these slides are employee, shareholding structure, seed investors, crowd funding investors. This is a completely editable PowerPoint presentation and is available for immediate download. Download now and impress your audience.
Startup Pitch To Raise Capital From Crowdfunding Shareholding Structure Graph Pre And Post Funding Icons PDF
Deliver an awe-inspiring pitch with this creative startup pitch to raise capital from crowdfunding shareholding structure graph pre and post funding icons pdf bundle. Topics like founder, employee, seed investors, crowdfunding investors can be discussed with this completely editable template. It is available for immediate download depending on the needs and requirements of the user.
Bar Graph Icon For Data Analysis Ppt PowerPoint Presentation Pictures Ideas
This is a bar graph icon for data analysis ppt powerpoint presentation pictures ideas. This is a four stage process. The stages in this process are financial analysis, quantitative, statistical modelling.
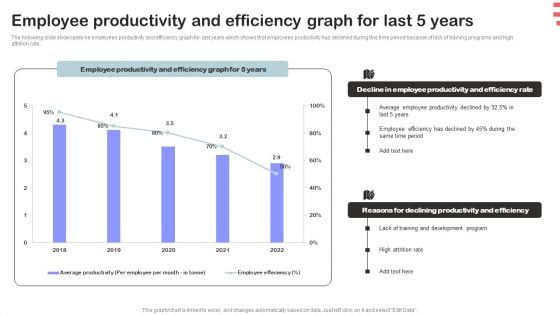
Corporate Training Program Employee Productivity And Efficiency Graph For Last 5 Years Elements PDF
The following slide showcases he employees productivity and efficiency graph for last years which shows that employees productivity has declined during this time period because of lack of training programs and high attrition rate. Make sure to capture your audiences attention in your business displays with our gratis customizable Corporate Training Program Employee Productivity And Efficiency Graph For Last 5 Years Elements PDF. These are great for business strategies, office conferences, capital raising or task suggestions. If you desire to acquire more customers for your tech business and ensure they stay satisfied, create your own sales presentation with these plain slides.
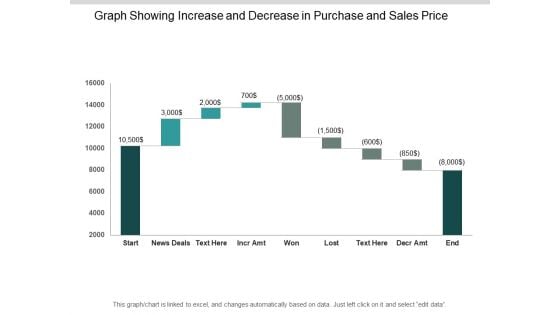
Graph Showing Increase And Decrease In Purchase And Sales Price Ppt PowerPoint Presentation Outline Gallery
This is a graph showing increase and decrease in purchase and sales price ppt powerpoint presentation outline gallery. This is a nine stage process. The stages in this process are sales waterfall, waterfall chart, business.
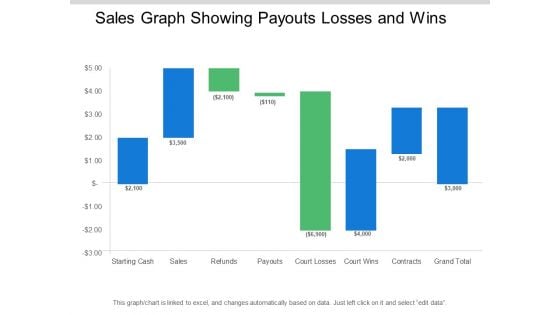
Sales Graph Showing Payouts Losses And Wins Ppt PowerPoint Presentation Pictures Designs Download
This is a sales graph showing payouts losses and wins ppt powerpoint presentation pictures designs download. This is a eight stage process. The stages in this process are sales waterfall, waterfall chart, business.
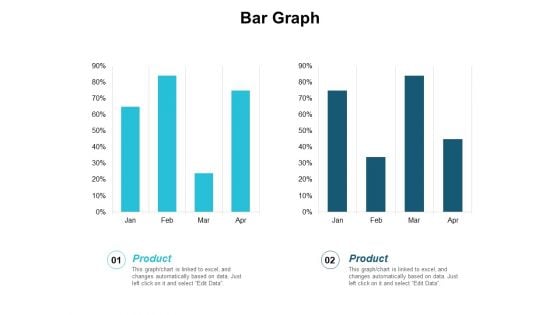
Bar Graph Finance Planning Ppt PowerPoint Presentation Infographic Template Master Slide
This is a bar graph finance planning ppt powerpoint presentation infographic template master slide. This is a two stage process. The stages in this process are finance, analysis, business, investment, marketing.
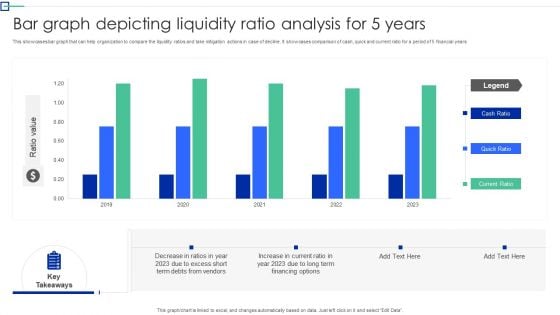
Bar Graph Depicting Liquidity Ratio Analysis For 5 Years Graphics PDF
This showcases bar graph that can help organization to compare the liquidity ratios and take mitigation actions in case of decline. It showcases comparison of cash, quick and current ratio for a period of 5 financial years. Showcasing this set of slides titled Bar Graph Depicting Liquidity Ratio Analysis For 5 Years Graphics PDF. The topics addressed in these templates are Organization To Compare, The Liquidity Ratios, Mitigation Action Decline. All the content presented in this PPT design is completely editable. Download it and make adjustments in color, background, font etc. as per your unique business setting.
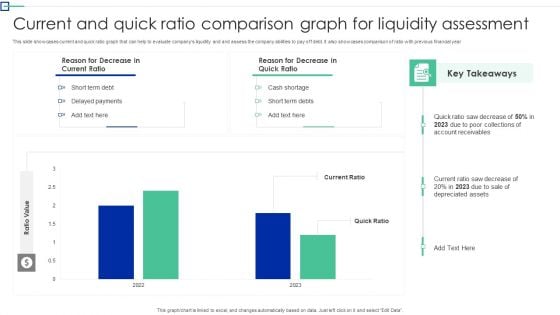
Current And Quick Ratio Comparison Graph For Liquidity Assessment Structure PDF
This slide showcases current and quick ratio graph that can help to evaluate companys liquidity and and assess the company abilities to pay off debt. It also showcases comparison of ratio with previous financial year. Showcasing this set of slides titled Current And Quick Ratio Comparison Graph For Liquidity Assessment Structure PDF. The topics addressed in these templates are Short Term Debt, Delayed Payments, Cash Shortage. All the content presented in this PPT design is completely editable. Download it and make adjustments in color, background, font etc. as per your unique business setting.
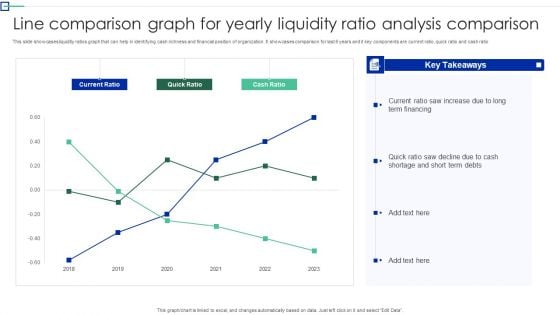
Line Comparison Graph For Yearly Liquidity Ratio Analysis Comparison Topics PDF
This slide showcases liquidity ratios graph that can help in identifying cash richness and financial position of organization. It showcases comparison for last 6 years and it key components are current ratio, quick ratio and cash ratio. Showcasing this set of slides titled Line Comparison Graph For Yearly Liquidity Ratio Analysis Comparison Topics PDF. The topics addressed in these templates are Term Financing, Cash Shortage, Cash Ratio. All the content presented in this PPT design is completely editable. Download it and make adjustments in color, background, font etc. as per your unique business setting.
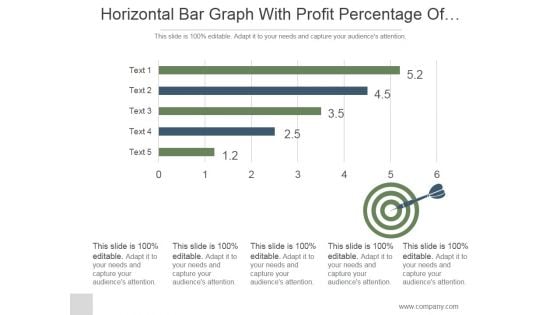
Horizontal Bar Graph With Profit Percentage Of Company Ppt PowerPoint Presentation Shapes
This is a horizontal bar graph with profit percentage of company ppt powerpoint presentation shapes. This is a five stage process. The stages in this process are business, strategy, marketing, analysis, slide bar, target.
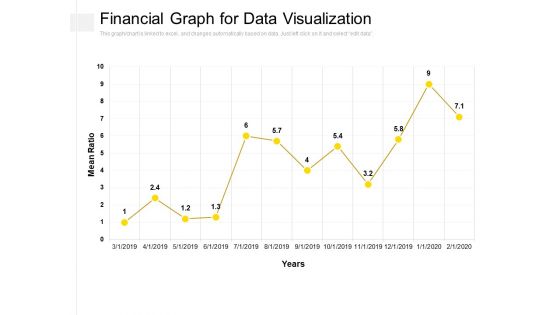
Financial Graph For Data Visualization Ppt PowerPoint Presentation Slides Picture PDF
Presenting this set of slides with name financial graph for data visualization ppt powerpoint presentation slides picture pdf. The topics discussed in these slides are mean ration, year. This is a completely editable PowerPoint presentation and is available for immediate download. Download now and impress your audience.
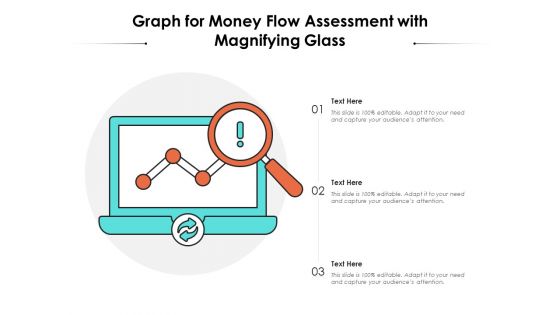
Graph For Money Flow Assessment With Magnifying Glass Ppt PowerPoint Presentation Gallery Design Templates PDF
Presenting this set of slides with name graph for money flow assessment with magnifying glass ppt powerpoint presentation gallery design templates pdf. This is a three stage process. The stages in this process are graph for money flow assessment with magnifying glass. This is a completely editable PowerPoint presentation and is available for immediate download. Download now and impress your audience.
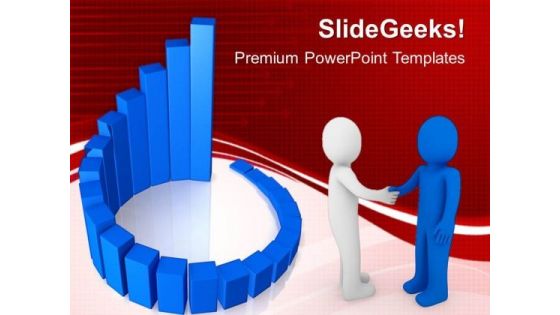
Circular Bar Graph Business Success PowerPoint Templates And PowerPoint Themes 1012
Circular Bar Graph Business Success PowerPoint Templates And PowerPoint Themes 1012-The above template displays a diagram of blue circular progress bars. This image represent the concept of business growth and success. This template imitates economy, finance, global, goal, growth, ideas, information, management, profit and statistics. This image has been conceived to enable you to emphatically communicate your ideas in your Business and Marketing PPT presentations. Use this template for financial analysis, business reviews and statistics. Go ahead and add charm to your presentations with our high quality template.-Circular Bar Graph Business Success PowerPoint Templates And PowerPoint Themes 1012-This PowerPoint template can be used for presentations relating to-Circular success graph, marketing, business, finance, success, circle charts Fashion your plans on our Circular Bar Graph Business Success PowerPoint Templates And PowerPoint Themes 1012. They will always keep you in contention.
Money Flow Liquidity Icon With Dollar Symbol And Graph Formats PDF
Presenting money flow liquidity icon with dollar symbol and graph formats pdf to dispense important information. This template comprises four stages. It also presents valuable insights into the topics including money flow liquidity icon with dollar symbol and graph. This is a completely customizable PowerPoint theme that can be put to use immediately. So, download it and address the topic impactfully.
Downturn Graph Showing Decrease In Income Over The Years Ppt PowerPoint Presentation Icon File Formats PDF
Showcasing this set of slides titled downturn graph showing decrease in income over the years ppt powerpoint presentation icon file formats pdf. The topics addressed in these templates are middle class share of total income, middle class share of income, union membership rate, 2013 to 2020. All the content presented in this PPT design is completely editable. Download it and make adjustments in color, background, font etc. as per your unique business setting.
Expenses And Income Comparison Graph With Budget Summary Ppt PowerPoint Presentation Icon Inspiration PDF
This slide illustrates budget summary of expenditure of a company. it includes income and expenditure comparative data and expenditure chart etc.Pitch your topic with ease and precision using this Expenses And Income Comparison Graph With Budget Summary Ppt PowerPoint Presentation Icon Inspiration PDF. This layout presents information on Budget Summary, Expenditure Comparative, Actual Income. It is also available for immediate download and adjustment. So, changes can be made in the color, design, graphics or any other component to create a unique layout.
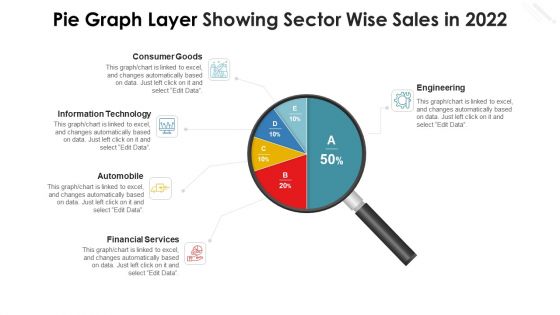
Pie Graph Layer Showing Sector Wise Sales In 2022 Microsoft PDF
Pitch your topic with ease and precision using this pie graph layer showing sector wise sales in 2022 microsoft pdf. This layout presents information on consumer goods, information technology, automobile, financial services, engineering. It is also available for immediate download and adjustment. So, changes can be made in the color, design, graphics or any other component to create a unique layout.
Stock Photo Business Strategy Review Growth Ladders On Bar Graph Icons
Our Stock Photo Business Strategy Review Growth Ladders On Bar Graph Icons Powerpoint Templates Allow You To Do It With Ease. Just Like Picking The Low Hanging Fruit.
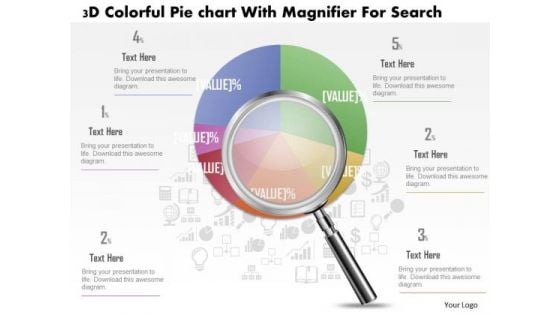
Business Diagram 3d Colorful Pie Graph With Magnifier Data Search PowerPoint Slide
This business slide displays 3d colorful pie graph with magnifier. This diagram is a data visualization tool that gives you a simple way to present statistical information. This slide helps your audience examine and interpret the data you present.
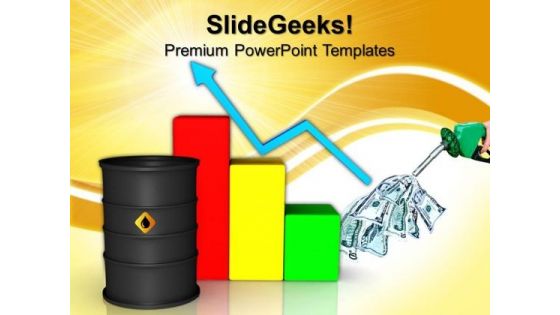
Oil Barrel With Finance Graph Business PowerPoint Templates And PowerPoint Themes 0812
Oil Barrel With Finance Graph Business PowerPoint Templates And PowerPoint Themes 0812-Microsoft Powerpoint Templates and Background with oil barrels Our Oil Barrel With Finance Graph Business PowerPoint Templates And PowerPoint Themes 0812 afford a distinct approach. Your thoughts will acquire a different character.
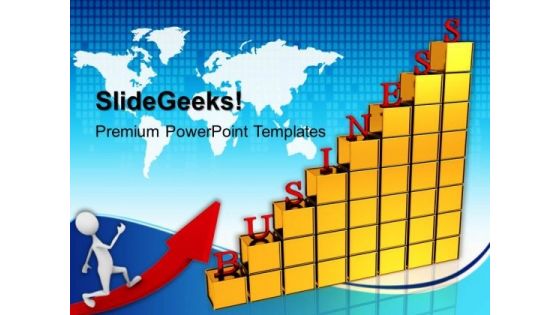
A Corporate Business Growth Graph PowerPoint Templates And PowerPoint Themes 1012
A Corporate Business Growth Graph PowerPoint Templates And PowerPoint Themes 1012-This PowerPoint Template shows the Bar Graph with increasing percentage which signifies the Financial or Business Growth. The Template signifies business concept. It signifies teamwork and team leader. Use this template for Global Business. The structure of our templates allows you to effectively highlight the key issues concerning the growth of your business.-A Corporate Business Growth Graph PowerPoint Templates And PowerPoint Themes 1012-This PowerPoint template can be used for presentations relating to-Business bar graph chart, technology, finance, arrows, business, success Our A Corporate Business Growth Graph PowerPoint Templates And PowerPoint Themes 1012 encourage an ethical approach. Exhort your team to stay above board.
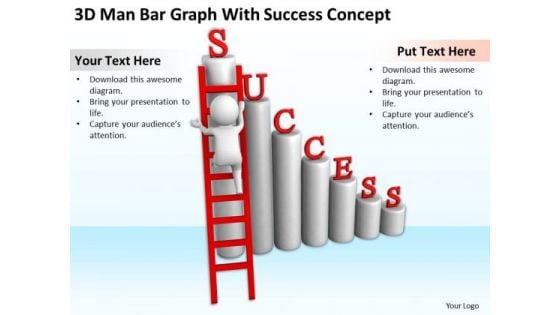
Young Business People 3d Man Bar Graph With Succes Concept PowerPoint Slides
We present our young business people 3d man bar graph with succes concept PowerPoint Slides.Use our People PowerPoint Templates because You have gained great respect for your brilliant ideas. Use our PowerPoint Templates and Slides to strengthen and enhance your reputation. Download our Stairs PowerPoint Templates because Our PowerPoint Templates and Slides have the Brilliant backdrops. Guaranteed to illuminate the minds of your audience. Download and present our Ladders PowerPoint Templates because Our PowerPoint Templates and Slides help you pinpoint your timelines. Highlight the reasons for your deadlines with their use. Download and present our Success PowerPoint Templates because Our PowerPoint Templates and Slides will bullet point your ideas. See them fall into place one by one. Download and present our Steps PowerPoint Templates because Our PowerPoint Templates and Slides will generate and maintain the level of interest you desire. They will create the impression you want to imprint on your audience.Use these PowerPoint slides for presentations relating to 3d, aim, alphabet, annual, arrow, banking, business, challenging, chart, dream,economy, finance, financial, forward, goal, graph, growth, hope, illustration,improvement, income, investment, isolated, man, market, mission, moving, point,process, progressive, revenue, rise, risk, share, solution, stair, step,strategy, succeed, success, target, up, vision, walking, way, word. The prominent colors used in the PowerPoint template are Red, White, Black. Put your attributes on display with our Young Business People 3d Man Bar Graph With Succes Concept PowerPoint Slides. They make any exhibition an excellent one.
Bar Graph For Business Growth PowerPoint Templates Ppt Backgrounds For Slides 0413
Get the doers into action. Activate them with our Bar Graph For Business Growth PowerPoint Templates PPT Backgrounds For Slides 0413. Put your money on our Bar Graph For Business Growth PowerPoint Templates PPT Backgrounds For Slides 0413. Your ideas will rake in the dollars. Integrate teams with our Bar Graph For Business Growth PowerPoint Templates Ppt Backgrounds For Slides 0413. Download without worries with our money back guaranteee.
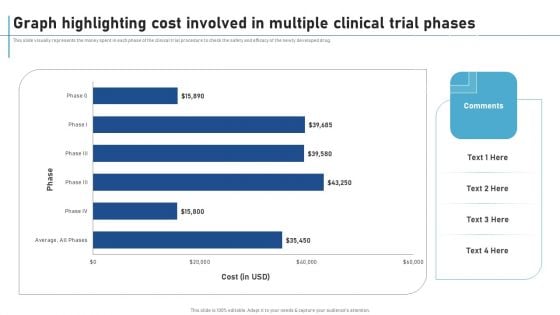
Graph Highlighting Cost Involved In Multiple Clinical Trial Phases New Clinical Drug Trial Process Mockup PDF
This slide visually represents the money spent in each phase of the clinical trial procedure to check the safety and efficacy of the newly developed drug. Find highly impressive Graph Highlighting Cost Involved In Multiple Clinical Trial Phases New Clinical Drug Trial Process Mockup PDF on Slidegeeks to deliver a meaningful presentation. You can save an ample amount of time using these presentation templates. No need to worry to prepare everything from scratch because Slidegeeks experts have already done a huge research and work for you. You need to download Graph Highlighting Cost Involved In Multiple Clinical Trial Phases New Clinical Drug Trial Process Mockup PDF for your upcoming presentation. All the presentation templates are 100 percent editable and you can change the color and personalize the content accordingly. Download now.
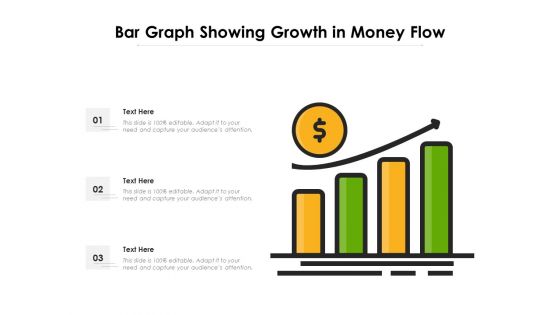
Bar Graph Showing Growth In Money Flow Ppt PowerPoint Presentation File Show PDF
Presenting this set of slides with name bar graph showing growth in money flow ppt powerpoint presentation file show pdf. This is a three stage process. The stages in this process are bar graph showing growth in money flow. This is a completely editable PowerPoint presentation and is available for immediate download. Download now and impress your audience.


 Continue with Email

 Home
Home


