Revenue Graph
Bar Graph Showing Profit Analysis Ppt PowerPoint Presentation Icon Deck PDF
Presenting this set of slides with name bar graph showing profit analysis ppt powerpoint presentation icon deck pdf. The topics discussed in these slides are gross revenue, income. This is a completely editable PowerPoint presentation and is available for immediate download. Download now and impress your audience.
Bar Graph Showing Of Business Income And Expenditure Ppt PowerPoint Presentation Icon Show PDF
Presenting this set of slides with name bar graph showing of business income and expenditure ppt powerpoint presentation icon show pdf. The topics discussed in these slides are expenses, revenue. This is a completely editable PowerPoint presentation and is available for immediate download. Download now and impress your audience.
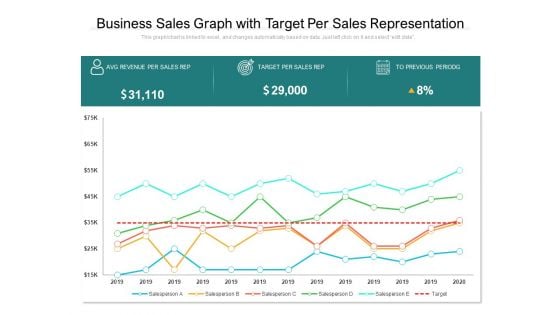
Business Sales Graph With Target Per Sales Representation Ppt PowerPoint Presentation Gallery Templates PDF
Presenting this set of slides with name business sales graph with target per sales representation ppt powerpoint presentation gallery templates pdf. The topics discussed in these slides are revenue, sales, target. This is a completely editable PowerPoint presentation and is available for immediate download. Download now and impress your audience.
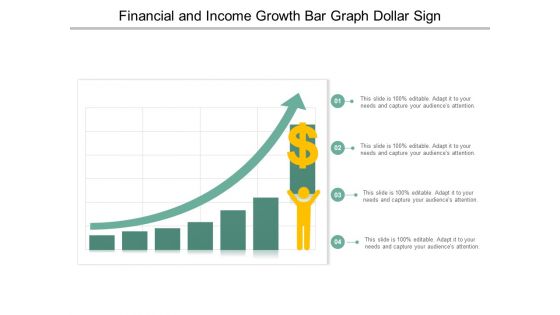
Financial And Income Growth Bar Graph Dollar Sign Ppt PowerPoint Presentation Professional Shapes
This is a financial and income growth bar graph dollar sign ppt powerpoint presentation professional shapes. This is a four stage process. The stages in this process are growth, increase sales, increase revenue.
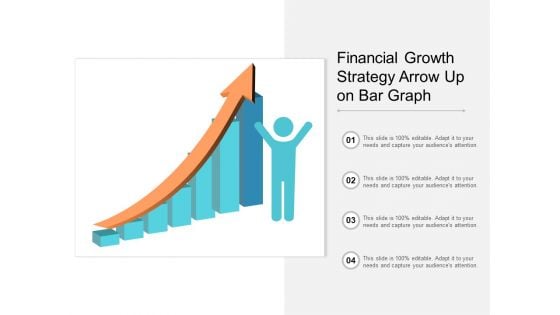
Financial Growth Strategy Arrow Up On Bar Graph Ppt PowerPoint Presentation Gallery Example
This is a financial growth strategy arrow up on bar graph ppt powerpoint presentation gallery example. This is a four stage process. The stages in this process are growth, increase sales, increase revenue.
Profit Growth Bar Graph With Rising Arrow And Dollar Sign Ppt PowerPoint Presentation Icon Designs
This is a profit growth bar graph with rising arrow and dollar sign ppt powerpoint presentation icon designs. This is a five stage process. The stages in this process are growth, increase sales, increase revenue.
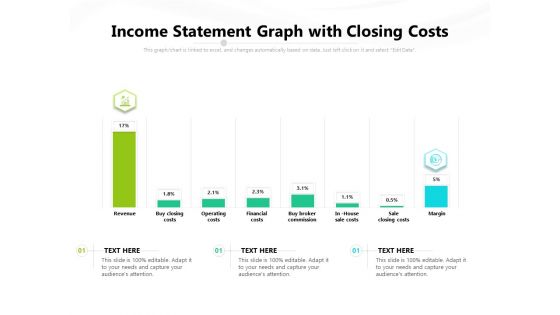
Income Statement Graph With Closing Costs Ppt PowerPoint Presentation Gallery Example Topics PDF
Presenting this set of slides with name income statement graph with closing costs ppt powerpoint presentation gallery example topics pdf. The topics discussed in these slides are revenue, buy closing costs, operating costs, financial costs, buy broker commission, in house sale costs, sale closing costs, margin. This is a completely editable PowerPoint presentation and is available for immediate download. Download now and impress your audience.
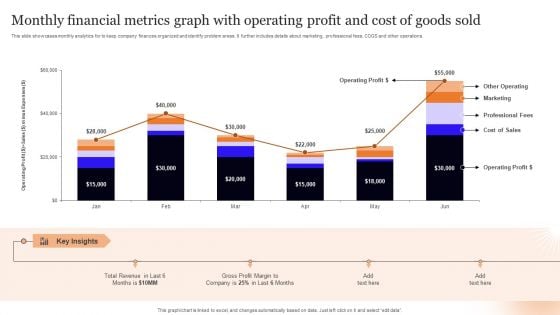
Monthly Financial Metrics Graph With Operating Profit And Cost Of Goods Sold Pictures PDF
This slide showcases monthly analytics for to keep company finances organized and identify problem areas. It further includes details about marketing, professional fees, COGS and other operations. Pitch your topic with ease and precision using this Monthly Financial Metrics Graph With Operating Profit And Cost Of Goods Sold Pictures PDF. This layout presents information on Key Insights, Operating Profit, Total Revenue. It is also available for immediate download and adjustment. So, changes can be made in the color, design, graphics or any other component to create a unique layout.
Financial Graph Economic Growth Vector Icon Ppt PowerPoint Presentation Infographics Graphic Images Cpb
This is a financial graph economic growth vector icon ppt powerpoint presentation infographics graphic images cpb. This is a three stage process. The stages in this process are bar chart icon, bar graph icon, data chart icon.
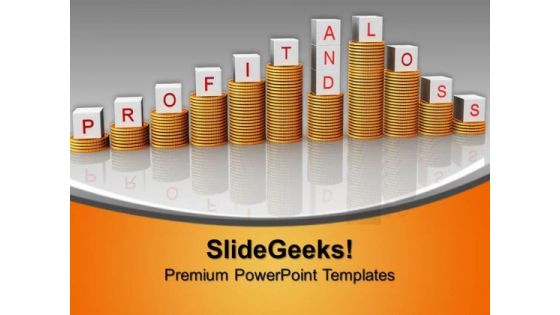
Profit And Loss Graph Concept Finance PowerPoint Templates And PowerPoint Themes 0912
Profit And Loss Graph Concept Finance PowerPoint Templates And PowerPoint Themes 0912-Microsoft Powerpoint Templates and Background with profit and loss graph-Profit and loss graph, business, finance, money, sales, marketing Father them through testing times. Bear the burden with our Profit And Loss Graph Concept Finance PowerPoint Templates And PowerPoint Themes 0912.
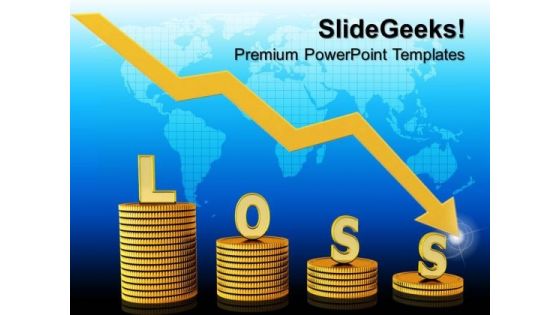
Loss In Money Graph Finance PowerPoint Templates And PowerPoint Themes 0812
Loss In Money Graph Finance PowerPoint Templates And PowerPoint Themes 0812-Microsoft Powerpoint Templates and Background with graph moving down and showing money loss Load up with our Loss In Money Graph Finance PowerPoint Templates And PowerPoint Themes 0812 with our Loss In Money Graph Finance PowerPoint Templates And PowerPoint Themes 0812. You will be at the top of your game.
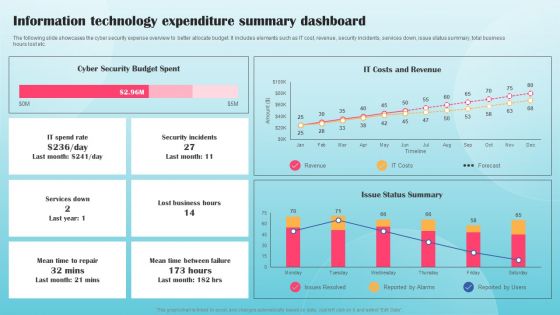
Information Technology Expenditure Summary Dashboard Ppt PowerPoint Presentation Diagram Graph Charts PDF
The following slide showcases the cyber security expense overview to better allocate budget. It includes elements such as IT cost, revenue, security incidents, services down, issue status summary, total business hours lost etc. This Information Technology Expenditure Summary Dashboard Ppt PowerPoint Presentation Diagram Graph Charts PDF from Slidegeeks makes it easy to present information on your topic with precision. It provides customization options, so you can make changes to the colors, design, graphics, or any other component to create a unique layout. It is also available for immediate download, so you can begin using it right away. Slidegeeks has done good research to ensure that you have everything you need to make your presentation stand out. Make a name out there for a brilliant performance.
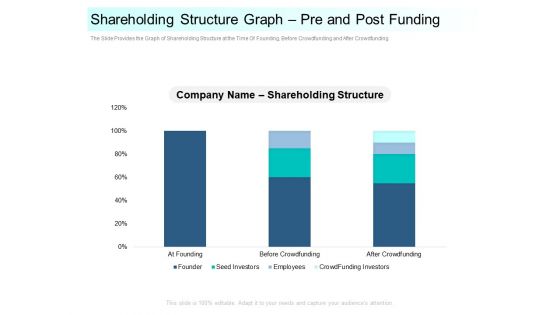
Community Capitalization Pitch Deck Shareholding Structure Graph Pre And Post Funding Template Pdf
The Slide Provides the Graph of Shareholding Structure at the Time Of Founding, Before Crowdfunding and After Crowdfunding. Deliver an awe inspiring pitch with this creative community capitalization pitch deck shareholding structure graph pre and post funding template pdf bundle. Topics like shareholding structure graph pre and post funding can be discussed with this completely editable template. It is available for immediate download depending on the needs and requirements of the user.
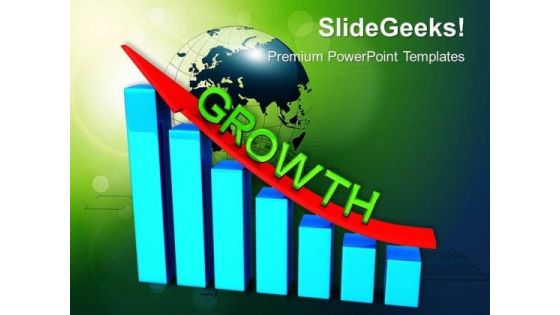
Business Bar Graph Upward Arrow Success PowerPoint Templates And PowerPoint Themes 0912
Business Bar Graph Upward Arrow Success PowerPoint Templates And PowerPoint Themes 0912-Microsoft Powerpoint Templates and Background with bar graph with upwards arrows-Bar graph with upwards arrows, success, money, arrows, finance, business Question doubts with our Business Bar Graph Upward Arrow Success PowerPoint Templates And PowerPoint Themes 0912. Download without worries with our money back guaranteee.
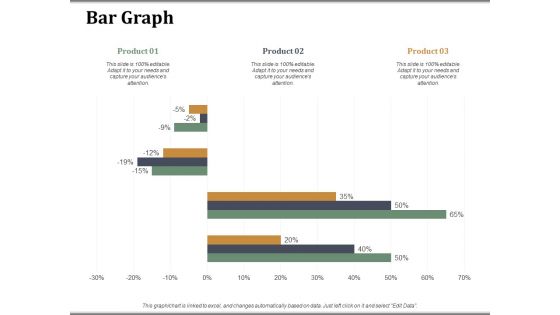
Bar Graph Companys Business Model Canvas Ppt PowerPoint Presentation Visual Aids Model
This is a bar graph companys business model canvas ppt powerpoint presentation visual aids model. This is a three stage process. The stages in this process are bar graph, finance, marketing, strategy, analysis, business.
3d Pie Chart Graph And Dollar PowerPoint Templates And PowerPoint Themes 0912
3d Pie Chart Graph And Dollar PowerPoint Templates And PowerPoint Themes 0912-Microsoft Powerpoint Templates and Background with pie chart graph and dollar-Pie chart graph and dollar, business, signs, marketing, money, finance Connect the dots differently. Be daring with our 3d Pie Chart Graph And Dollar PowerPoint Templates And PowerPoint Themes 0912.

Pie Chart Graph Dollar Business PowerPoint Templates And PowerPoint Themes 0912
Pie Chart Graph Dollar Business PowerPoint Templates And PowerPoint Themes 0912-Microsoft Powerpoint Templates and Background with pie chart graph and dollar-Pie chart graph and dollar, business, signs, marketing, money, finance Fashion your plans on our Pie Chart Graph Dollar Business PowerPoint Templates And PowerPoint Themes 0912. They will always keep you in contention.
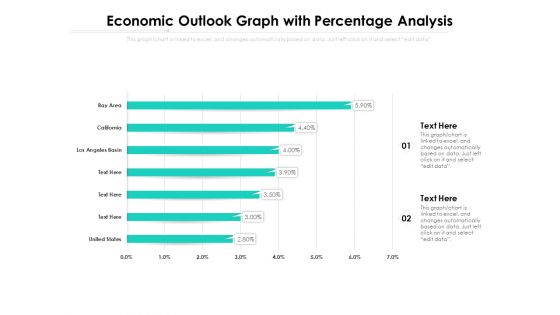
Economic Outlook Graph With Percentage Analysis Ppt PowerPoint Presentation Show Demonstration PDF
Presenting this set of slides with name economic outlook graph with percentage analysis ppt powerpoint presentation show demonstration pdf. The topics discussed in these slide is economic outlook graph with percentage analysis. This is a completely editable PowerPoint presentation and is available for immediate download. Download now and impress your audience.
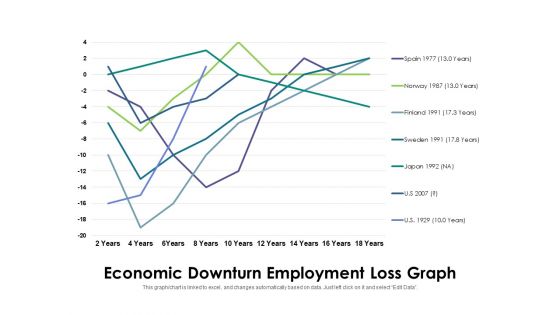
Economic Downturn Employment Loss Graph Ppt PowerPoint Presentation Outline Example File PDF
Pitch your topic with ease and precision using this economic downturn employment loss graph ppt powerpoint presentation outline example file pdf. This layout presents information on economic downturn employment loss graph. It is also available for immediate download and adjustment. So, changes can be made in the color, design, graphics or any other component to create a unique layout.
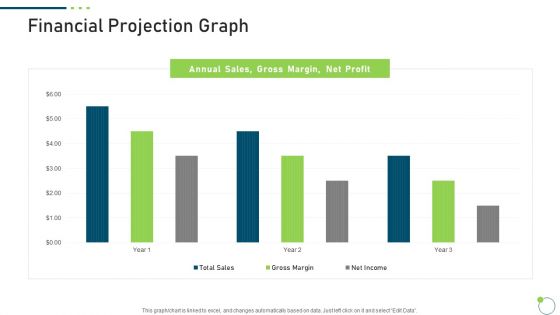
Investor Pitch Deck New Venture Capital Raising Financial Projection Graph Demonstration PDF
Deliver an awe inspiring pitch with this creative investor pitch deck new venture capital raising financial projection graph demonstration pdf bundle. Topics like financial projection graph can be discussed with this completely editable template. It is available for immediate download depending on the needs and requirements of the user.
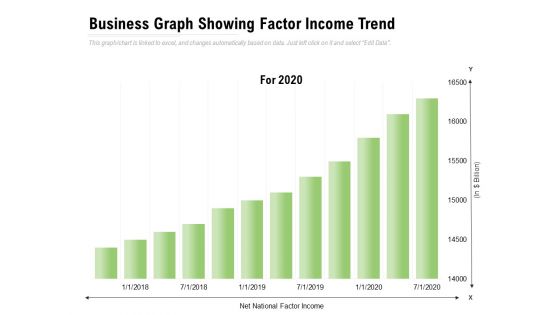
Business Graph Showing Factor Income Trend Ppt PowerPoint Presentation Slides Mockup
Presenting this set of slides with name business graph showing factor income trend ppt powerpoint presentation slides mockup. The topics discussed in these slide is business graph showing factor income trend. This is a completely editable PowerPoint presentation and is available for immediate download. Download now and impress your audience.
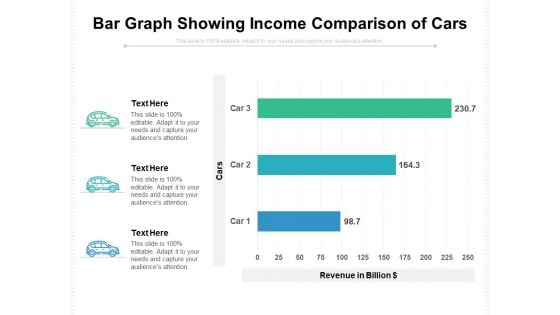
Bar Graph Showing Income Comparison Of Cars Ppt PowerPoint Presentation Gallery Brochure PDF
Presenting this set of slides with name bar graph showing income comparison of cars ppt powerpoint presentation gallery brochure pdf. The topics discussed in these slide is bar graph showing income comparison of cars. This is a completely editable PowerPoint presentation and is available for immediate download. Download now and impress your audience.
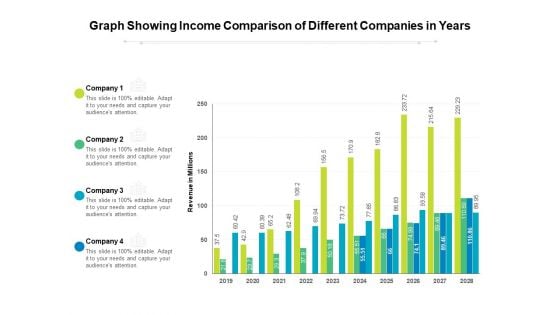
Graph Showing Income Comparison Of Different Companies In Years Ppt PowerPoint Presentation Gallery Clipart PDF
Presenting this set of slides with name graph showing income comparison of different companies in years ppt powerpoint presentation gallery clipart pdf. The topics discussed in these slide is graph showing income comparison of different companies in years. This is a completely editable PowerPoint presentation and is available for immediate download. Download now and impress your audience.
Bar Graph Showing Income Of Business Segments Ppt PowerPoint Presentation Icon Example PDF
Pitch your topic with ease and precision using this bar graph showing income of business segments ppt powerpoint presentation icon example pdf. This layout presents information on bar graph showing income of business segments. It is also available for immediate download and adjustment. So, changes can be made in the color, design, graphics or any other component to create a unique layout.

Dollar And Bar Graph Metaphor PowerPoint Templates And PowerPoint Themes 1012
Dollar And Bar Graph Metaphor PowerPoint Templates And PowerPoint Themes 1012-Microsoft Powerpoint Templates and Background with dollar and bar graph-Dollar And Bar Graph Metaphor PowerPoint Templates And PowerPoint Themes 1012-This PowerPoint template can be used for presentations relating to-Dollar and bar graph, money, signs, finance, business, success Drum up a fervour with our Dollar And Bar Graph Metaphor PowerPoint Templates And PowerPoint Themes 1012. You will come out on top.

Business Graph With Dollar Sign Marketing PowerPoint Templates And PowerPoint Themes 1012
Business Graph With Dollar Sign Marketing PowerPoint Templates And PowerPoint Themes 1012-Microsoft Powerpoint Templates and Background with bussiness graph with dollar sign-Business Graph With Dollar Sign Marketing PowerPoint Templates And PowerPoint Themes 1012-This PowerPoint template can be used for presentations relating to-Business graph with dollar sign, finance, business, success, signs, money Even out things with our Business Graph With Dollar Sign Marketing PowerPoint Templates And PowerPoint Themes 1012. Get your team on the same level.
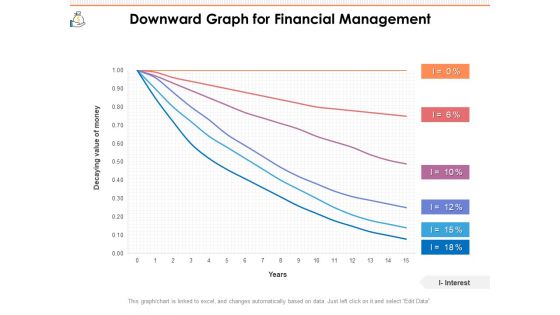
Downward Graph For Financial Management Ppt PowerPoint Presentation File Picture PDF
Presenting this set of slides with name downward graph for financial management ppt powerpoint presentation file picture pdf. The topics discussed in these slide is downward graph for financial management. This is a completely editable PowerPoint presentation and is available for immediate download. Download now and impress your audience.
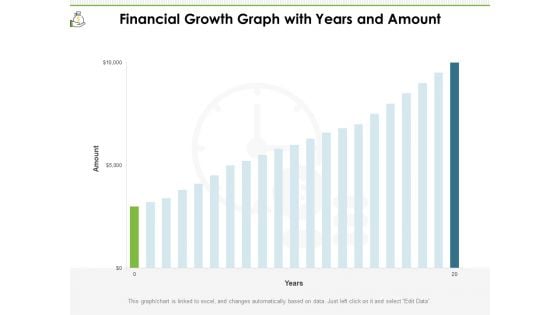
Financial Growth Graph With Years And Amount Ppt PowerPoint Presentation File Microsoft PDF
Presenting this set of slides with name financial growth graph with years and amount ppt powerpoint presentation file microsoft pdf. The topics discussed in these slide is financial growth graph with years and amount. This is a completely editable PowerPoint presentation and is available for immediate download. Download now and impress your audience.
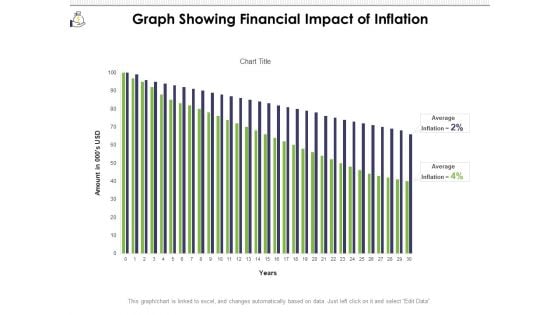
Graph Showing Financial Impact Of Inflation Ppt PowerPoint Presentation File Graphics Tutorials PDF
Presenting this set of slides with name graph showing financial impact of inflation ppt powerpoint presentation file graphics tutorials pdf. The topics discussed in these slide is graph showing financial impact of inflation. This is a completely editable PowerPoint presentation and is available for immediate download. Download now and impress your audience.
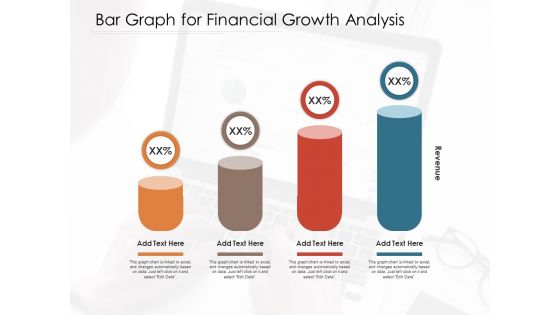
Bar Graph For Financial Growth Analysis Ppt PowerPoint Presentation Gallery Background Images PDF
Presenting this set of slides with name bar graph for financial growth analysis ppt powerpoint presentation gallery background images pdf. The topics discussed in these slide is bar graph for financial growth analysis. This is a completely editable PowerPoint presentation and is available for immediate download. Download now and impress your audience.
Financial Graph For Urban Population Growth With Prediction Figures Icons PDF
Showcasing this set of slides titled financial graph for urban population growth with prediction figures icons pdf. The topics addressed in these templates are financial graph for urban population growth with prediction figures. All the content presented in this PPT design is completely editable. Download it and make adjustments in color, background, font etc. as per your unique business setting.
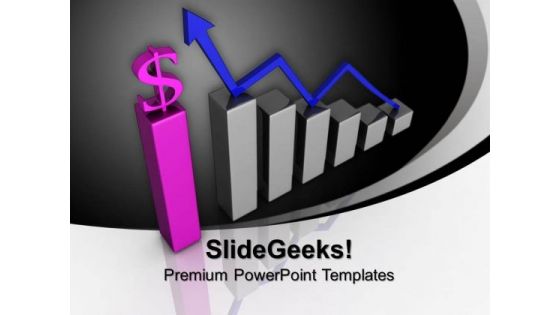
Increase In Dollar Graph Finance PowerPoint Templates And PowerPoint Themes 0912
Increase In Dollar Graph Finance PowerPoint Templates And PowerPoint Themes 0912-Microsoft Powerpoint Templates and Background with business graph with arrow showing profits-Business graph with arrow showing profits, signs, success, finance, business, arrows Encourage teams with our Increase In Dollar Graph Finance PowerPoint Templates And PowerPoint Themes 0912. Download without worries with our money back guaranteee.

Dices On Financial Graph Business PowerPoint Templates And PowerPoint Backgrounds 0511
Microsoft PowerPoint Template and Background with dices on financial graph Enliven the discussion with our Dices On Financial Graph Business PowerPoint Templates And PowerPoint Backgrounds 0511. The audience will get all animated.
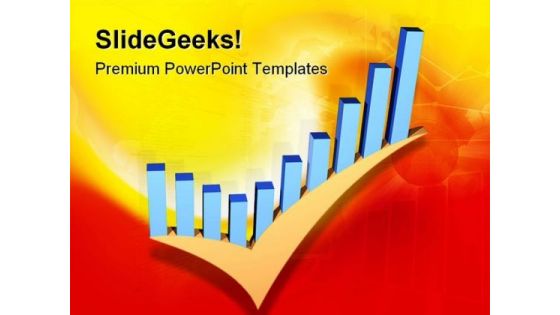
Business Graph With Check Metaphor PowerPoint Templates And PowerPoint Backgrounds 0511
Microsoft PowerPoint Template and Background with a combination of a check mark and financial graph Our Business Graph With Check Metaphor PowerPoint Templates And PowerPoint Backgrounds 0511 are very falcon like. They keep a sharp eye on the target.
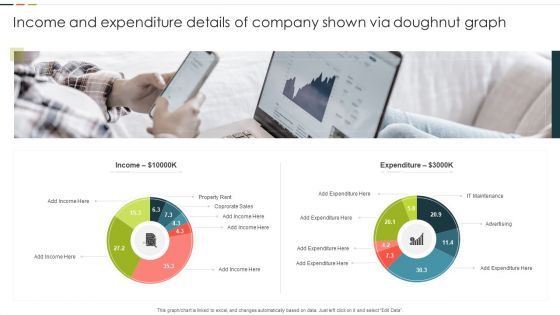
Income And Expenditure Details Of Company Shown Via Doughnut Graph Graphics PDF
This graph or chart is linked to excel, and changes automatically based on data. Just left click on it and select Edit Data. Pitch your topic with ease and precision using this Income And Expenditure Details Of Company Shown Via Doughnut Graph Graphics PDF. This layout presents information on Property Rent, Corporate Sales, Expenditure. It is also available for immediate download and adjustment. So, changes can be made in the color, design, graphics or any other component to create a unique layout.
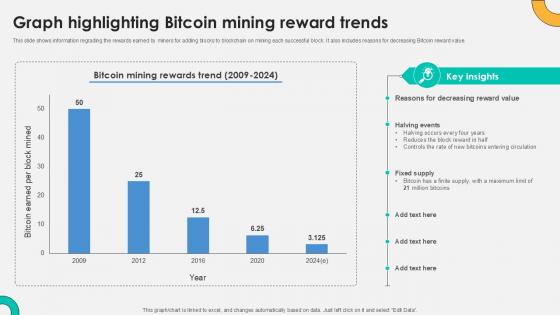
Graph Highlighting Bitcoin Mining Everything About Bitcoin PPT Example Fin SS V
This slide shows information regrading the rewards earned by miners for adding blocks to blockchain on mining each successful block. It also includes reasons for decreasing Bitcoin reward value. Explore a selection of the finest Graph Highlighting Bitcoin Mining Everything About Bitcoin PPT Example Fin SS V here. With a plethora of professionally designed and pre-made slide templates, you can quickly and easily find the right one for your upcoming presentation. You can use our Graph Highlighting Bitcoin Mining Everything About Bitcoin PPT Example Fin SS V to effectively convey your message to a wider audience. Slidegeeks has done a lot of research before preparing these presentation templates. The content can be personalized and the slides are highly editable. Grab templates today from Slidegeeks. This slide shows information regrading the rewards earned by miners for adding blocks to blockchain on mining each successful block. It also includes reasons for decreasing Bitcoin reward value.
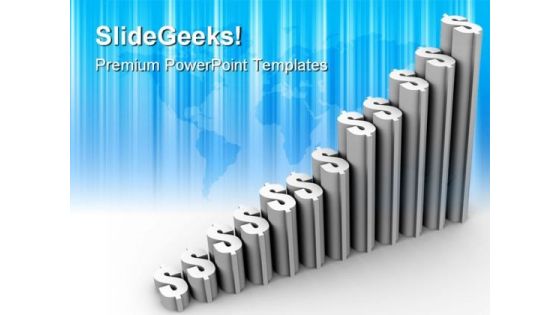
Graph Growth Of Dollars Finance PowerPoint Templates And PowerPoint Backgrounds 0711
Microsoft PowerPoint Template and Background with graph representing growth sign of money Have nothing to fear with our Graph Growth Of Dollars Finance PowerPoint Templates And PowerPoint Backgrounds 0711. Just download, type and present.

Bar Graph And Dollars Money PowerPoint Templates And PowerPoint Themes 0912
Bar Graph And Dollars Money PowerPoint Templates And PowerPoint Themes 0912-Microsoft Powerpoint Templates and Background with bar graph and dollar money Encourage creativity with our Bar Graph And Dollars Money PowerPoint Templates And PowerPoint Themes 0912. You will come out on top.
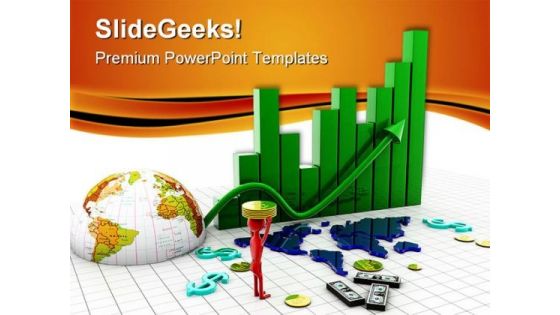
Business Graph With Dollars Globe PowerPoint Templates And PowerPoint Backgrounds 0311
Microsoft PowerPoint Template and Background with bar graphs dollar sign and diagram Convincing an audience is no mean feat. Do it with ease with our Business Graph With Dollars Globe PowerPoint Templates And PowerPoint Backgrounds 0311.
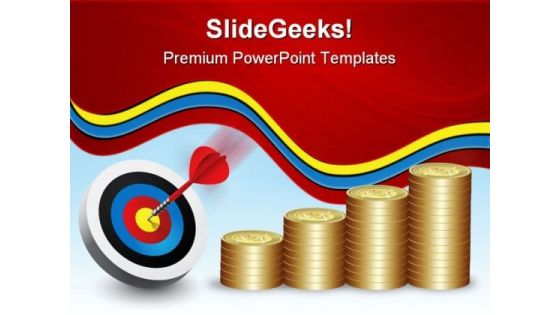
Dollar Graph With Target Finance PowerPoint Templates And PowerPoint Backgrounds 1211
Microsoft PowerPoint Template and Background with dollar graph and target represents success Be accredited by the connoisseurs. Our Dollar Graph With Target Finance PowerPoint Templates And PowerPoint Backgrounds 1211 certify their approval.
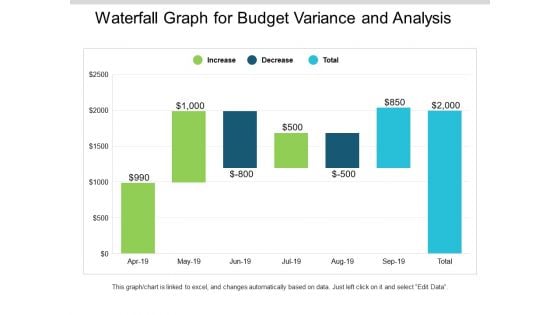
Waterfall Graph For Budget Variance And Analysis Ppt PowerPoint Presentation Slides Mockup
This is a waterfall graph for budget variance and analysis ppt powerpoint presentation slides mockup. This is a three stage process. The stages in this process are profit and loss, balance sheet, income statement, benefit and loss.
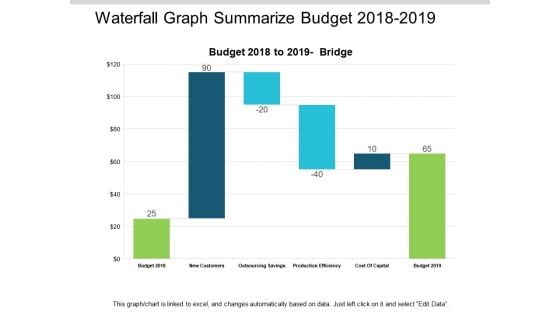
Waterfall Graph Summarize Budget 2018 To 2019 Ppt PowerPoint Presentation Summary Slides
This is a waterfall graph summarize budget 2018 to 2019 ppt powerpoint presentation summary slides. This is a three stage process. The stages in this process are profit and loss, balance sheet, income statement, benefit and loss.
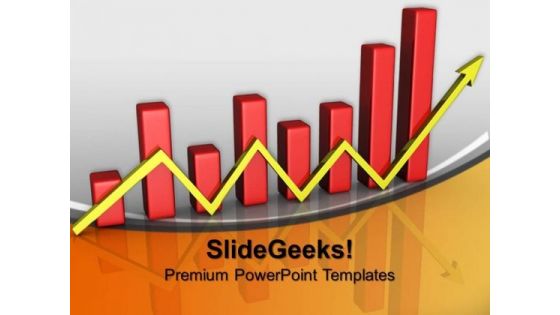
Finance Bar Graph With Arrow Business PowerPoint Templates And PowerPoint Themes 0912
Finance Bar Graph With Arrow Business PowerPoint Templates And PowerPoint Themes 0912-Microsoft Powerpoint Templates and Background with financial bar graph chart-Financial bar graph chart, business, arrows, marketing, finance, success End doubts with our Finance Bar Graph With Arrow Business PowerPoint Templates And PowerPoint Themes 0912. You will come out on top.
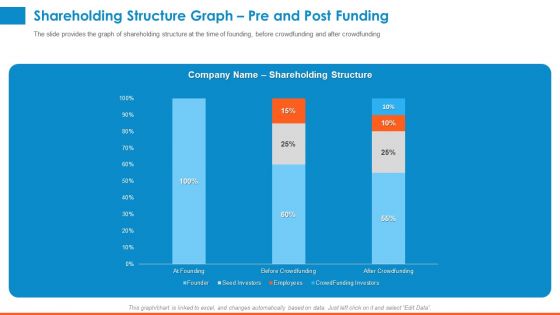
Raising Company Capital From Public Funding Sources Shareholding Structure Graph Pre And Post Funding Diagrams PDF
The slide provides the graph of shareholding structure at the time of founding, before crowdfunding and after crowdfunding. Deliver an awe-inspiring pitch with this creative raising company capital from public funding sources shareholding structure graph pre and post funding diagrams pdf bundle. Topics like founder, seed investors, employees, crowdfunding investors, before crowdfunding, after crowdfunding can be discussed with this completely editable template. It is available for immediate download depending on the needs and requirements of the user.
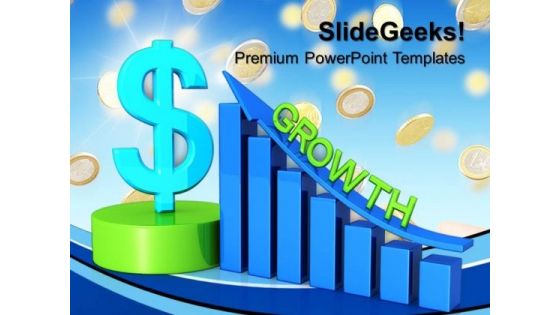
Business Dollar Graph Growth Success PowerPoint Templates And PowerPoint Themes 0712
Business Dollar Graph Growth Success PowerPoint Templates And PowerPoint Themes Business Power Points-Microsoft Powerpoint Templates and Background with dollars graph Consumer connect with our Business Dollar Graph Growth Success PowerPoint Templates And PowerPoint Themes 0712. Enhance customer connectivity of your thoughts.
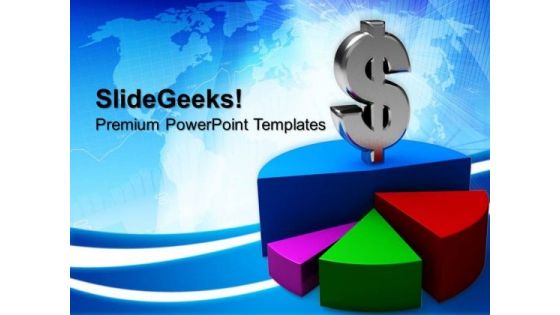
Pie Chart Graph Dollar Finance PowerPoint Templates And PowerPoint Themes 0812
Pie Chart Graph Dollar Finance PowerPoint Templates And PowerPoint Themes 0812-Microsoft Powerpoint Templates and Background with pie chart graph and dollar Dosen't matter what the topic. Make it interesting with our Pie Chart Graph Dollar Finance PowerPoint Templates And PowerPoint Themes 0812. You will be at the top of your game.
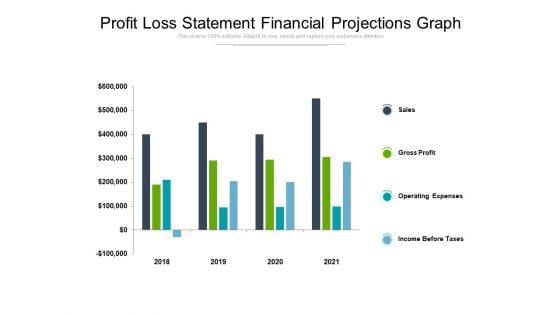
Profit Loss Statement Financial Projections Graph Ppt PowerPoint Presentation Summary Slides
Presenting this set of slides with name profit loss statement financial projections graph ppt powerpoint presentation summary slides. The topics discussed in these slides are sales, gross profit, operating expenses, income before taxes. This is a completely editable PowerPoint presentation and is available for immediate download. Download now and impress your audience.
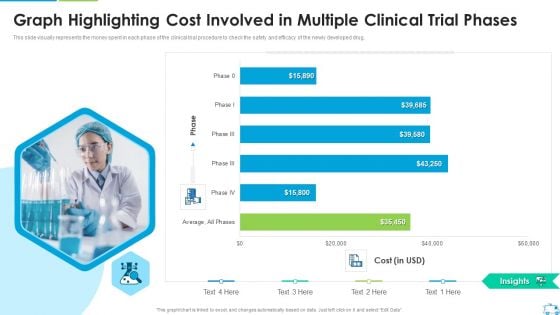
Graph Highlighting Cost Involved In Multiple Clinical Trial Phases Microsoft PDF
This slide visually represents the money spent in each phase of the clinical trial procedure to check the safety and efficacy of the newly developed drug.Deliver an awe inspiring pitch with this creative Graph Highlighting Cost Involved In Multiple Clinical Trial Phases Microsoft PDF bundle. Topics like Graph Highlighting Cost Involved In Multiple Clinical Trial Phases can be discussed with this completely editable template. It is available for immediate download depending on the needs and requirements of the user.
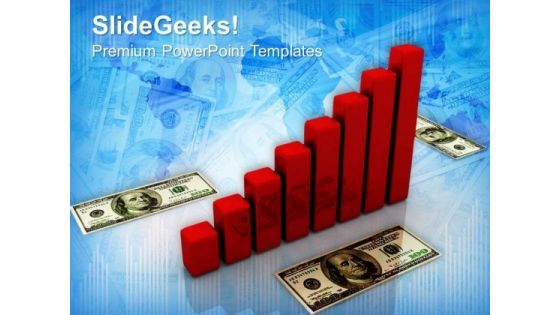
Bar Graph With Dollar Marketing PowerPoint Templates And PowerPoint Themes 1012
Bar Graph with Dollar Marketing PowerPoint Templates And PowerPoint Themes 1012-Emphatically define your message with our above template which contains a graphic of bar graph with dollar notes. This image clearly defines the concept of business statistics and financial reviews. Our stunning image makes your presentations professional showing that you care about even the smallest details. Create captivating presentations to deliver comparative and weighted arguments.-Bar Graph with Dollar Marketing PowerPoint Templates And PowerPoint Themes 1012-This PowerPoint template can be used for presentations relating to-Business graph and dollar, money, finance, success, business, marketing Your career will soar away. Our Bar Graph With Dollar Marketing PowerPoint Templates And PowerPoint Themes 1012 will give it wings.
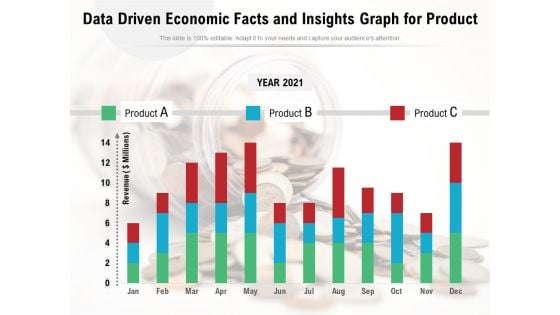
Data Driven Economic Facts And Insights Graph For Product Ppt PowerPoint Presentation Pictures Slide Download PDF
Pitch your topic with ease and precision using this data driven economic facts and insights graph for product ppt powerpoint presentation pictures slide download pdf. This layout presents information on year 2021, product, data driven economic. It is also available for immediate download and adjustment. So, changes can be made in the color, design, graphics or any other component to create a unique layout.
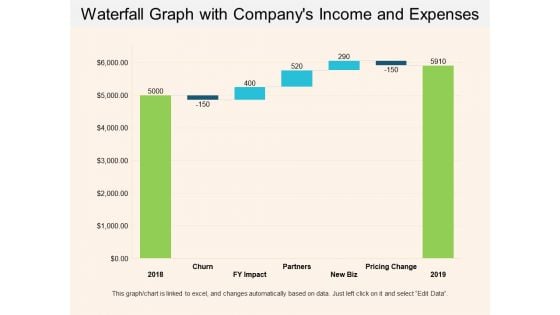
Waterfall Graph With Companys Income And Expenses Ppt PowerPoint Presentation Show Example Introduction
This is a waterfall graph with companys income and expenses ppt powerpoint presentation show example introduction. This is a three stage process. The stages in this process are profit and loss, balance sheet, income statement, benefit and loss.

Dices On Financial Graph Business PowerPoint Themes And PowerPoint Slides 0511
Microsoft PowerPoint Theme and Slide with dices on financial graph Our Dices On Financial Graph Business PowerPoint Themes And PowerPoint Slides 0511 will entice the audience. They will make a beeline for you.
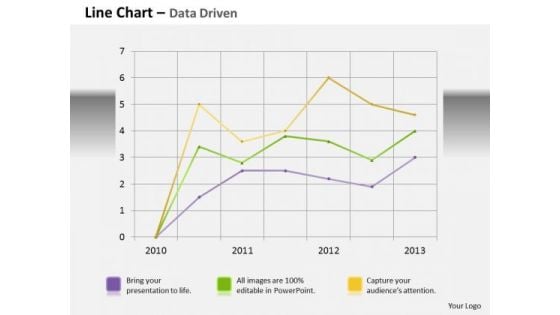
Data Analysis Template Driven Line Chart Business Graph PowerPoint Slides Templates
Bottle Your Thoughts In Our data analysis template driven line chart business graph powerpoint slides Templates . Pass It Around For Your Audience To Sip.
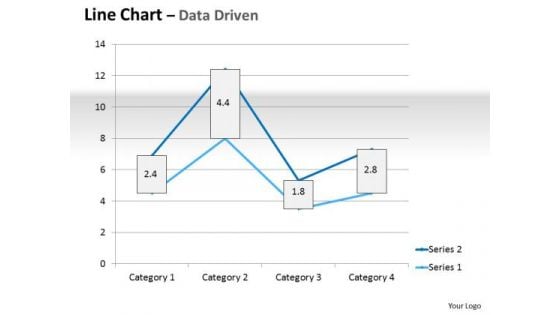
Multivariate Data Analysis Driven Line Chart Market Graph PowerPoint Slides Templates
Plan For All Contingencies With Our multivariate data analysis driven line chart market graph powerpoint slides Templates . Douse The Fire Before It Catches.
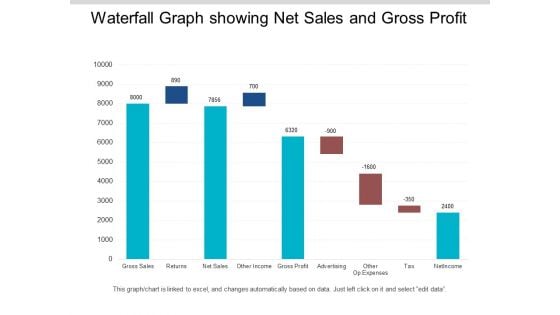
Waterfall Graph Showing Net Sales And Gross Profit Ppt PowerPoint Presentation Infographics Format
This is a waterfall graph showing net sales and gross profit ppt powerpoint presentation infographics format. This is a three stage process. The stages in this process are profit and loss, balance sheet, income statement, benefit and loss.
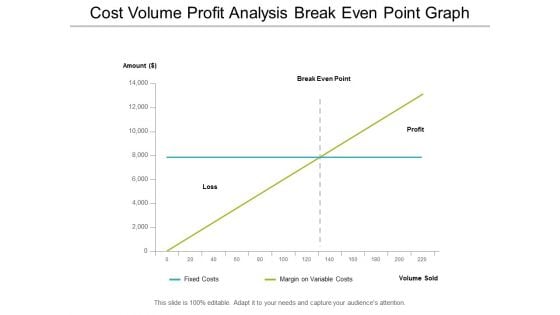
cost volume profit analysis break even point graph ppt powerpoint presentation professional shapes
This is a cost volume profit analysis break even point graph ppt powerpoint presentation professional shapes. This is a four stage process. The stages in this process are break even point,break even analysis,break even level.
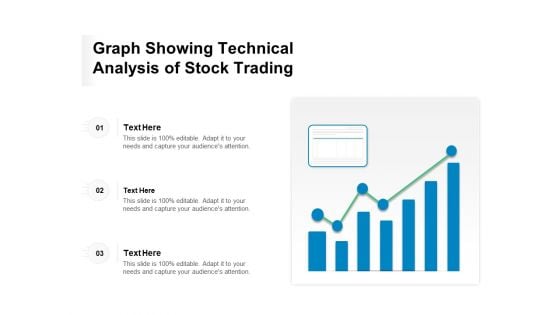
Graph Showing Technical Analysis Of Stock Trading Ppt PowerPoint Presentation Infographic Template Portrait PDF
Presenting this set of slides with name graph showing technical analysis of stock trading ppt powerpoint presentation infographic template portrait pdf. This is a three stage process. The stages in this process are graph showing technical analysis of stock trading. This is a completely editable PowerPoint presentation and is available for immediate download. Download now and impress your audience.
Business Graph With Check Metaphor PowerPoint Themes And PowerPoint Slides 0511
Microsoft PowerPoint Theme and Slide with a combination of a check mark and financial graph Bake the cake with our Business Graph With Check Metaphor PowerPoint Themes And PowerPoint Slides 0511. Give them all a big slab of it.
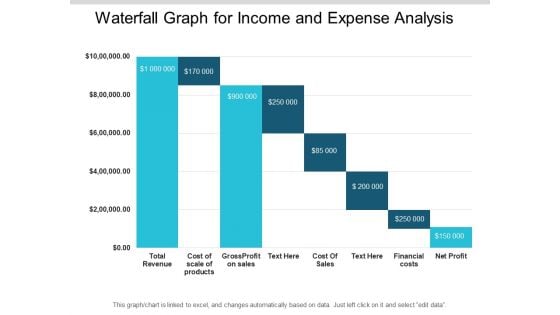
Waterfall Graph For Income And Expense Analysis Ppt PowerPoint Presentation File Deck
This is a waterfall graph for income and expense analysis ppt powerpoint presentation file deck. This is a eight stage process. The stages in this process are sales waterfall, waterfall chart, business.
Business Bar Graph Arrow Success PowerPoint Templates And PowerPoint Backgrounds 0511
Microsoft PowerPoint Template and Background with a business chart/graph showing the decline of the financial money market Make the event with our Business Bar Graph Arrow Success PowerPoint Templates And PowerPoint Backgrounds 0511. Your thoughts will be really happening.


 Continue with Email

 Home
Home


