Revenue Graph
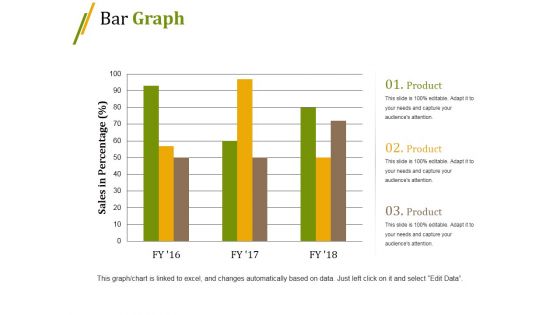
Bar Graph Ppt PowerPoint Presentation Professional Gridlines
This is a bar graph ppt powerpoint presentation professional gridlines. This is a three stage process. The stages in this process are bar, marketing, strategy, planning, growth.
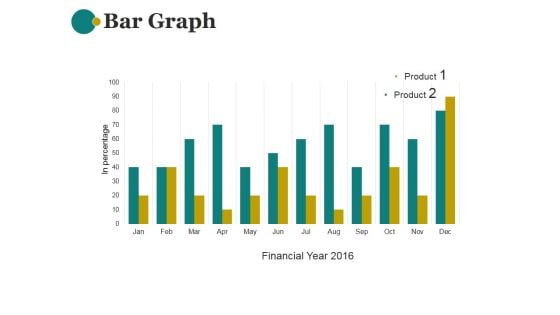
Bar Graph Ppt PowerPoint Presentation File Portfolio
This is a bar graph ppt powerpoint presentation file portfolio. This is a twelve stage process. The stages in this process are financial, marketing, management, business, strategy.
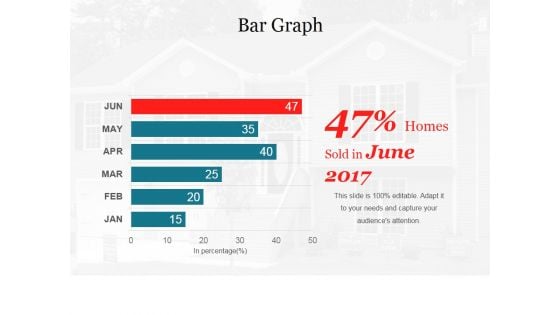
Bar Graph Ppt PowerPoint Presentation File Picture
This is a bar graph ppt powerpoint presentation file picture. This is a six stage process. The stages in this process are management, planning, marketing, business, strategy.
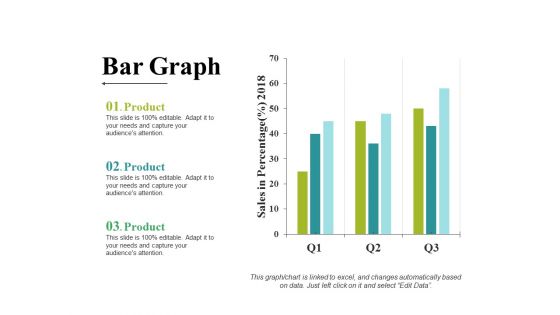
Bar Graph Ppt PowerPoint Presentation Pictures Picture
This is a bar graph ppt powerpoint presentation pictures picture. This is a three stage process. The stages in this process are business, marketing, strategy, planning, finance.
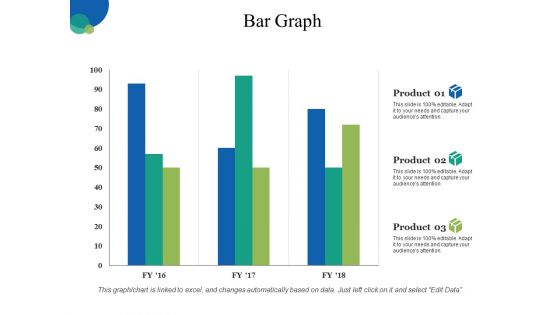
Bar Graph Ppt PowerPoint Presentation Slides Slideshow
This is a bar graph ppt powerpoint presentation slides slideshow. This is a three stage process. The stages in this process are business, finance, marketing, strategy, planning.
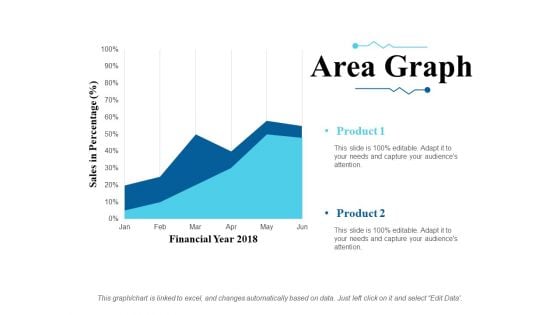
Area Graph Ppt PowerPoint Presentation Slides Ideas
This is a area graph ppt powerpoint presentation slides ideas. This is a two stage process. The stages in this process are sales in percentage, financial year, product.
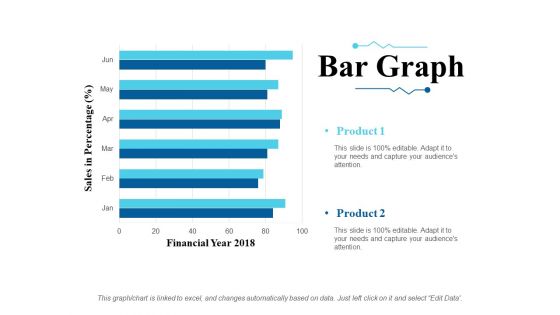
Bar Graph Ppt PowerPoint Presentation Inspiration Slides
This is a bar graph ppt powerpoint presentation inspiration slides. This is a six stage process. The stages in this process are sales in percentage, financial year, product.
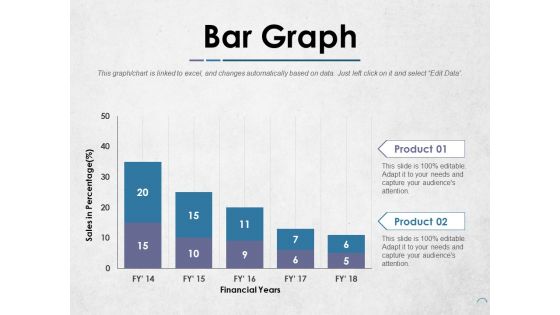
Bar Graph Ppt PowerPoint Presentation Infographics Templates
This is a bar graph ppt powerpoint presentation infographics templates. This is a two stage process. The stages in this process are product, financial years, sales in percentage.
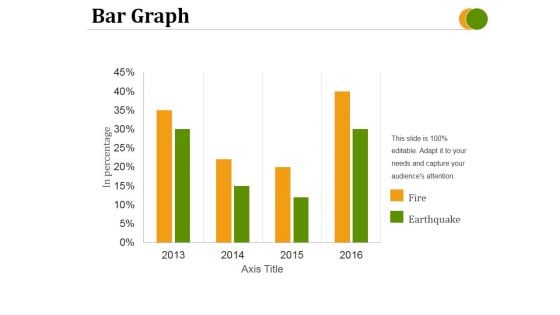
Bar Graph Ppt PowerPoint Presentation Layouts Pictures
This is a bar graph ppt powerpoint presentation layouts pictures. This is a four stage process. The stages in this process are fire, earthquake, axis title, in percentage.
Dices On Financial Graph PowerPoint Icon C
Microsoft PowerPoint Template and Background with dices on financial graph Prescribe changes with our Dices On Financial Graph PowerPoint Icon C. Download without worries with our money back guaranteee.

Financial Graph PowerPoint Backgrounds And Templates 0111
Microsoft PowerPoint Template and Background with 3d rendered rainbow colored financial graph showing strong growth Be the architect of your own destiny. Design it with our Financial Graph PowerPoint Backgrounds And Templates 0111.
Dices On Financial Graph PowerPoint Icon Cc
Microsoft PowerPoint Template and Background with dices on financial graph Give your presentations a great look with our Dices On Financial Graph PowerPoint Icon Cc. You will be at the top of your game.
Dices On Financial Graph PowerPoint Icon R
Microsoft PowerPoint Template and Background with dices on financial graph Demonstrate your work ethic with our Dices On Financial Graph PowerPoint Icon R. Give credence to your impeccable reputation.
Dices On Financial Graph PowerPoint Icon S
Microsoft PowerPoint Template and Background with dices on financial graph Our Dices On Financial Graph PowerPoint Icon S project your erudite nature. They bring your depth of knowledge to the surface.
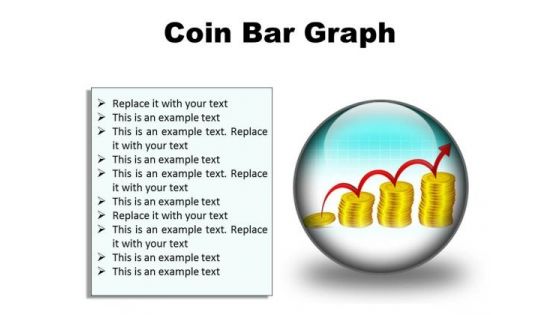
Coin Graph Finance PowerPoint Presentation Slides C
Microsoft PowerPoint Slides and Backgrounds with bar graph made of gold coins Deliver education with our Coin Graph Finance PowerPoint Presentation Slides C. Cover the course in a systematic manner.
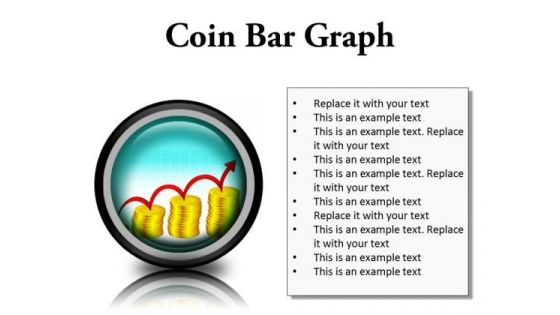
Coin Graph Finance PowerPoint Presentation Slides Cc
Microsoft PowerPoint Slides and Backgrounds with bar graph made of gold coins Let your ideas grow in their minds. Our Coin Graph Finance PowerPoint Presentation Slides Cc will act like a fertilizer.
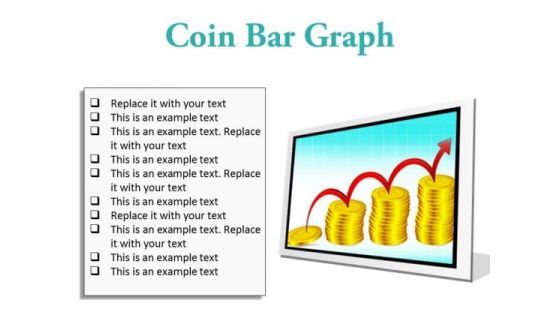
Coin Graph Finance PowerPoint Presentation Slides F
Microsoft PowerPoint Slides and Backgrounds with bar graph made of gold coins Be a cross-functional expertise with our Coin Graph Finance PowerPoint Presentation Slides F. They will make you look good.
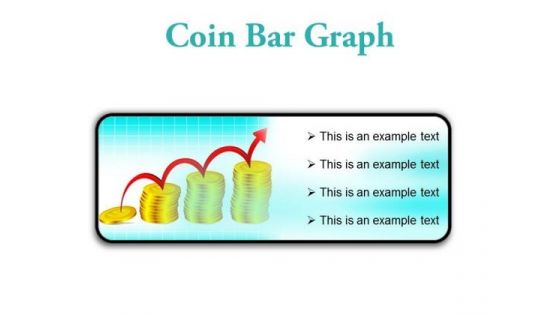
Coin Graph Finance PowerPoint Presentation Slides R
Microsoft PowerPoint Slides and Backgrounds with bar graph made of gold coins Distill your thoughts with our Coin Graph Finance PowerPoint Presentation Slides R. They will draw outthe essence of it all.
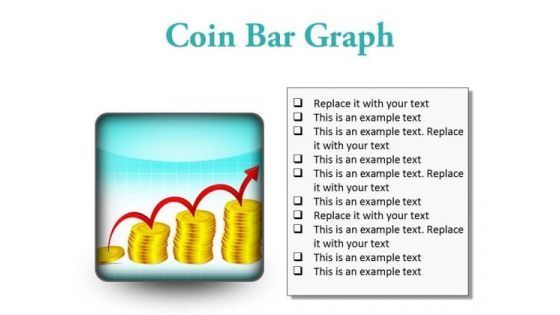
Coin Graph Finance PowerPoint Presentation Slides S
Microsoft PowerPoint Slides and Backgrounds with bar graph made of gold coins Become an orator with our Coin Graph Finance PowerPoint Presentation Slides S. You will come out on top.
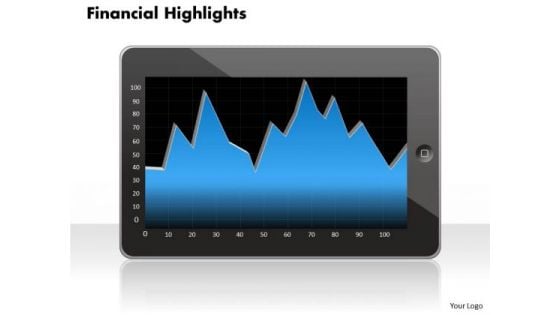
Business Framework Model Financial Graph Consulting Diagram
Document Your Views On Our Business Framework Model Financial Graph Consulting Diagram Powerpoint Templates. They Will Create A Strong Impression.
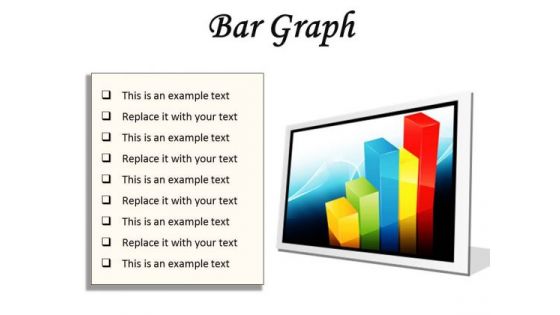
Bar Graph Business PowerPoint Presentation Slides F
Microsoft PowerPoint Slides and Backgrounds with style of a vector bar graph Earn accolades with our Bar Graph Business PowerPoint Presentation Slides F. You will come out on top.
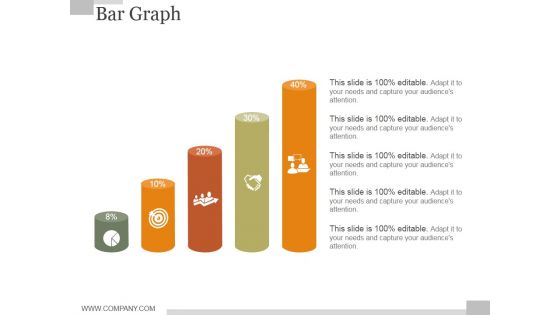
Bar Graph Ppt PowerPoint Presentation Inspiration
This is a bar graph ppt powerpoint presentation inspiration. This is a five stage process. The stages in this process are bar graph, finance, marketing, strategy, investment, analysis, business, success.
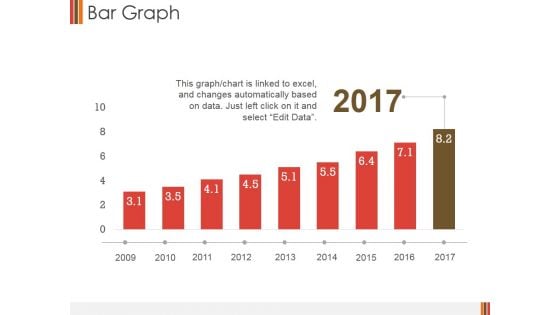
Bar Graph Ppt PowerPoint Presentation Show Topics
This is a bar graph ppt powerpoint presentation show topics. This is a nine stage process. The stages in this process are business, finance, marketing, strategy, bar graph, growth.
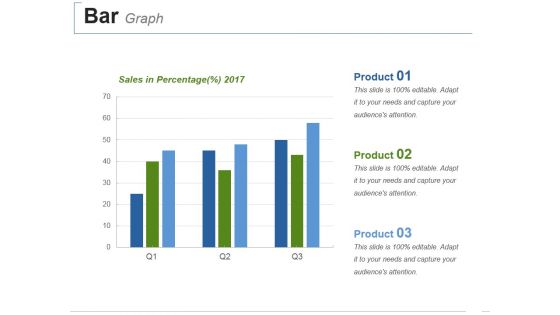
Bar Graph Ppt PowerPoint Presentation Portfolio Outline
This is a bar graph ppt powerpoint presentation portfolio outline. This is a three stage process. The stages in this process are bar graph, finance, marketing, strategy, investment, business.
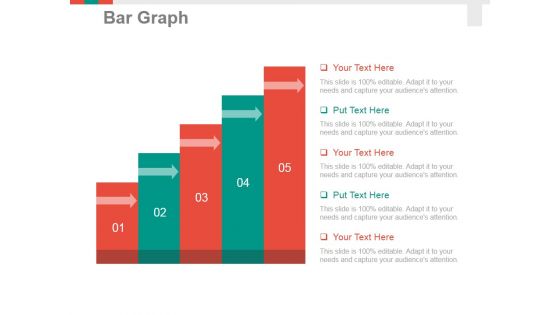
Bar Graph Ppt PowerPoint Presentation Pictures Tips
This is a bar graph ppt powerpoint presentation pictures tips. This is a five stage process. The stages in this process are bar graph, finance, marketing, strategy, analysis, business.
Business Graph Finance PowerPoint Presentation Slides C
Microsoft Powerpoint Slides and Backgrounds with graph with arrow showing profits and gains Our Business Graph Finance PowerPoint Presentation Slides C will transmit your commitment. Your audience will repose their faith in you.

Business Graph Finance PowerPoint Presentation Slides Cc
Microsoft Powerpoint Slides and Backgrounds with graph with arrow showing profits and gains Your thoughts and our Business Graph Finance PowerPoint Presentation Slides Cc will get along famously. They will create an acclaimed team.
Business Graph Finance PowerPoint Presentation Slides F
Microsoft Powerpoint Slides and Backgrounds with graph with arrow showing profits and gains Our Business Graph Finance PowerPoint Presentation Slides F are maintenance free. All they require is a dash of your thoughts.

Business Graph Finance PowerPoint Presentation Slides R
Microsoft Powerpoint Slides and Backgrounds with graph with arrow showing profits and gains Improve the apprearance of your slides with our Business Graph Finance PowerPoint Presentation Slides R. Dont waste time struggling with PowerPoint. Let us do it for you.
Business Graph Finance PowerPoint Presentation Slides S
Microsoft Powerpoint Slides and Backgrounds with graph with arrow showing profits and gains Create a business with our Business Graph Finance PowerPoint Presentation Slides S. Just download, type and present.
Bar Graph Business PowerPoint Presentation Slides R
Microsoft PowerPoint Slides and Backgrounds with style of a vector bar graph Examine plans with our Bar Graph Business PowerPoint Presentation Slides R. Download without worries with our money back guaranteee.
Success Graph Business PowerPoint Presentation Slides F
Microsoft Powerpoint Slides and Backgrounds with three dimensional shape of bussiness graph on a white background Mastermind plans with our Success Graph Business PowerPoint Presentation Slides F. Download without worries with our money back guaranteee.
Success Graph Business PowerPoint Presentation Slides S
Microsoft Powerpoint Slides and Backgrounds with three dimensional shape of bussiness graph on a white background Test boundaries of presenting with our Success Graph Business PowerPoint Presentation Slides S. Download without worries with our money back guaranteee.

Dollar Graph Business PowerPoint Template 0610
Business Diagram it is isolated on a white background Recruit leaders with our Dollar Graph Business PowerPoint Template 0610. Download without worries with our money back guaranteee.
Abstract Business Graph PowerPoint Icon Cc
Microsoft PowerPoint Template and Background with business graph with profits rising off the chart. Graph on a white reflective backgroun Level the playing field with our Abstract Business Graph PowerPoint Icon Cc. Make sure your presentation gets the attention it deserves.
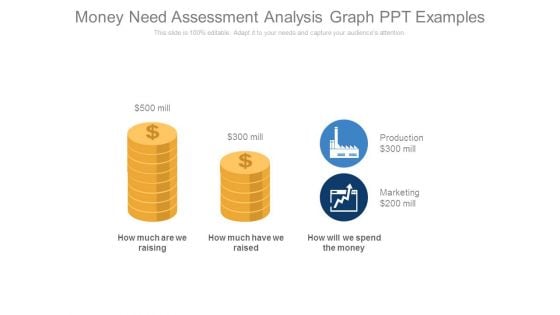
Money Need Assessment Analysis Graph Ppt Examples
This is a money need assessment analysis graph ppt examples. This is a two stage process. The stages in this process are production, marketing, need, money, finance.
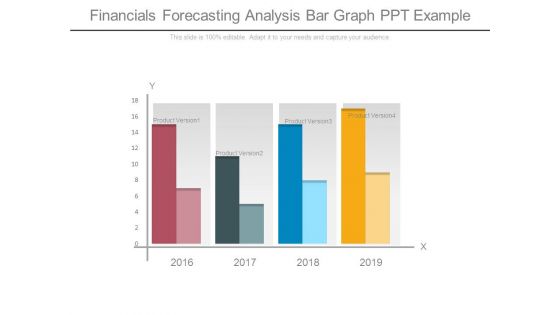
Financials Forecasting Analysis Bar Graph Ppt Example
This is a financials forecasting analysis bar graph ppt example. This is a four stage process. The stages in this process are product version.

Financial Graph Ppt PowerPoint Presentation Visuals
This is a financial graph ppt powerpoint presentation visuals. This is a three stage process. The stages in this process are finance, marketing, analysis, investment, million.
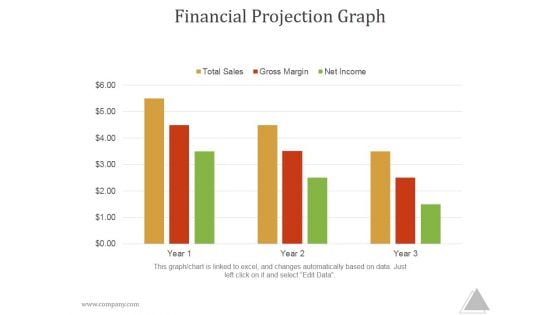
Financial Projection Graph Ppt PowerPoint Presentation Introduction
This is a financial projection graph ppt powerpoint presentation introduction. This is a five stage process. The stages in this process are jan, feb ,mar, apr, may, jun.
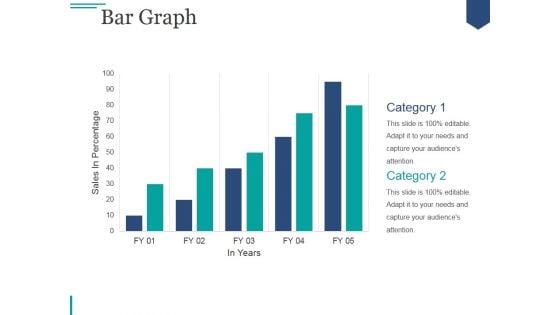
Bar Graph Ppt PowerPoint Presentation Slides Format
This is a bar graph ppt powerpoint presentation slides format. This is a two stage process. The stages in this process are business, marketing, growth, planning, sales plan.
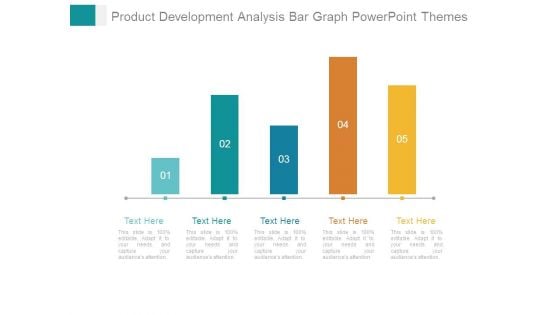
Product Development Analysis Bar Graph Powerpoint Themes
This is a product development analysis bar graph powerpoint themes. This is a five stage process. The stages in this process are business, growth, strategy, management, pretention.
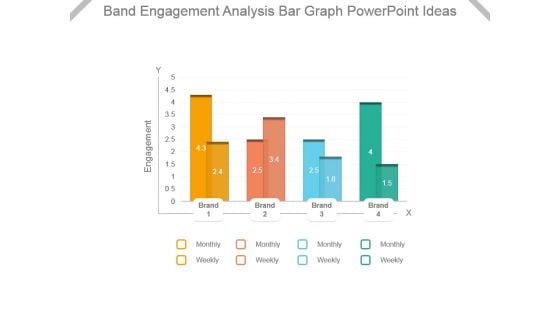
Band Engagement Analysis Bar Graph Powerpoint Ideas
This is a band engagement analysis bar graph powerpoint ideas. This is a four stage process. The stages in this process are engagement, brand, monthly, weekly.
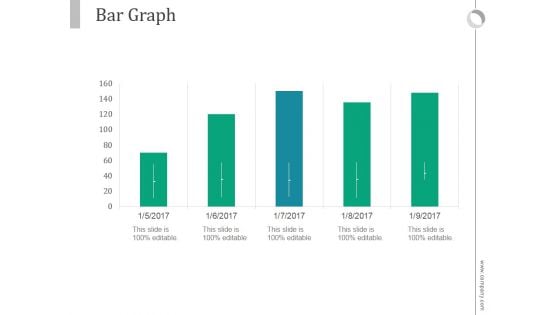
Bar Graph Ppt PowerPoint Presentation Model
This is a bar graph ppt powerpoint presentation model. This is a five stage process. The stages in this process are business, marketing, bar slides, management, finance.
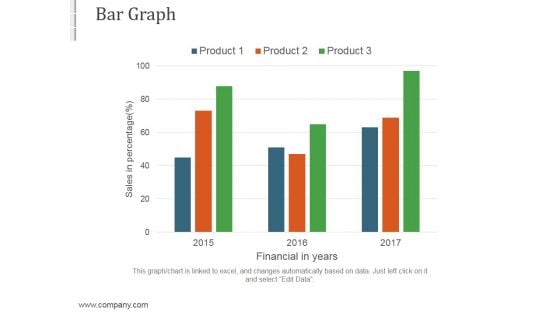
Bar Graph Ppt PowerPoint Presentation Themes
This is a bar graph ppt powerpoint presentation themes. This is a three stage process. The stages in this process are business, marketing, strategy, success, management.
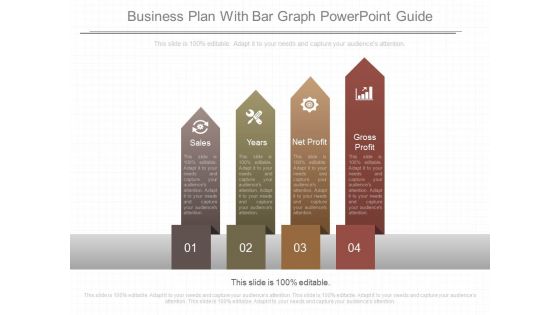
Business Plan With Bar Graph Powerpoint Guide
This is a business plan with bar graph powerpoint guide. This is a four stage process. The stages in this process are sales, years, net profit, gross profit.
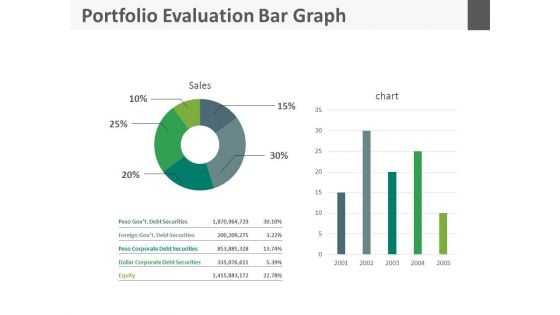
Portfolio Evaluation Bar Graph Ppt Slides
This is a portfolio evaluation bar graph ppt slides. This is a five stage process. The stages in this process are business, finance, marketing.
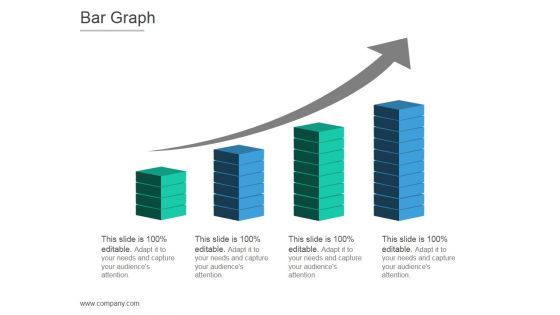
Bar Graph Ppt PowerPoint Presentation Templates
This is a bar graph ppt powerpoint presentation templates. This is a four stage process. The stages in this process are arrows, business, marketing, strategy, growth, graphic.
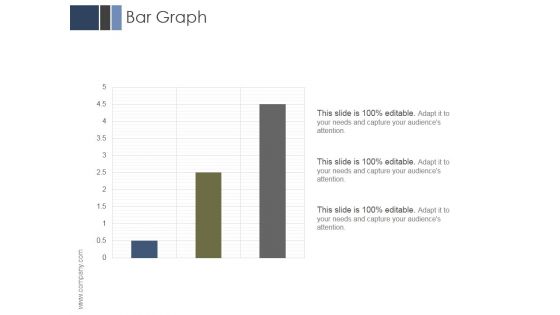
Bar Graph Ppt PowerPoint Presentation Layout
This is a bar graph ppt powerpoint presentation layout. This is a three stage process. The stages in this process are business, marketing, management, analysis, growth.
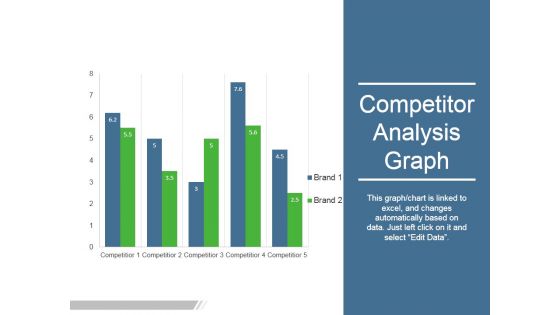
Competitor Analysis Graph Ppt PowerPoint Presentation Graphics
This is a competitor analysis graph ppt powerpoint presentation graphics. This is a five stage process. The stages in this process are competitor, business, marketing.
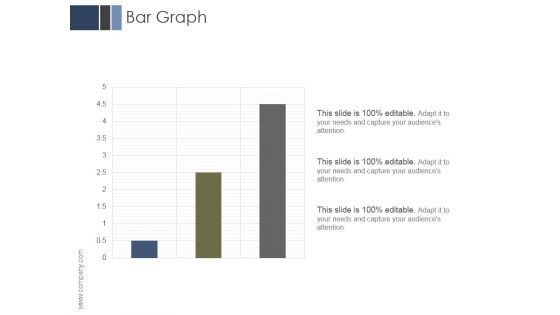
Bar Graph Ppt PowerPoint Presentation Outline Slides
This is a bar graph ppt powerpoint presentation outline slides. This is a three stage process. The stages in this process are business, marketing, management, analysis, growth.
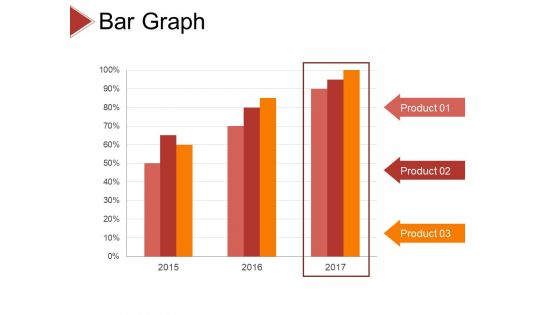
Bar Graph Ppt PowerPoint Presentation Layouts Gridlines
This is a bar graph ppt powerpoint presentation layouts gridlines. this is a three stage process. The stages in this process are product, percentage, business, marketing, management.

Bar Graph Ppt PowerPoint Presentation Gallery Inspiration
This is a bar graph ppt powerpoint presentation gallery inspiration. This is a three stage process. The stages in this process are product, sales in percentage, finance, success.
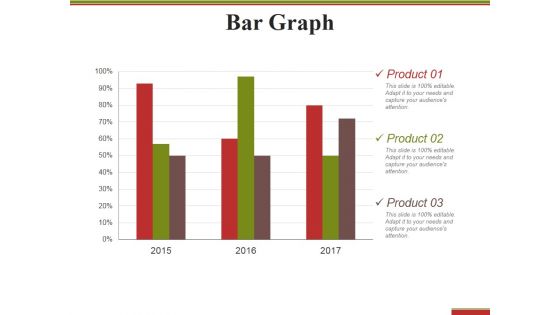
Bar Graph Ppt PowerPoint Presentation Outline Structure
This is a bar graph ppt powerpoint presentation outline structure. This is a three stage process. The stages in this process are product, percentage, finance, business.
Bar Graph Ppt PowerPoint Presentation Icon
This is a bar graph ppt powerpoint presentation icon. This is a three stage process. The stages in this process are business, finance, marketing, strategy, analysis.
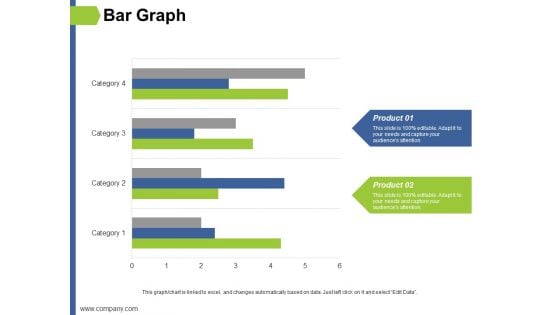
Bar Graph Ppt PowerPoint Presentation Show Slides
This is a bar graph ppt powerpoint presentation show slides. This is a two stage process. The stages in this process are finance, marketing, management, investment, analysis.
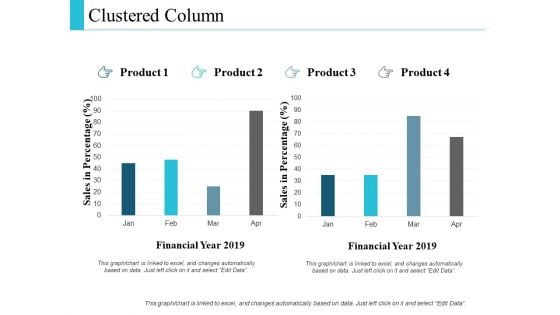
Clustered Column Graph Ppt PowerPoint Presentation Layouts
This is a clustered column graph ppt powerpoint presentation layouts. This is a two stage process. The stages in this process are finance, marketing, management, investment, analysis.
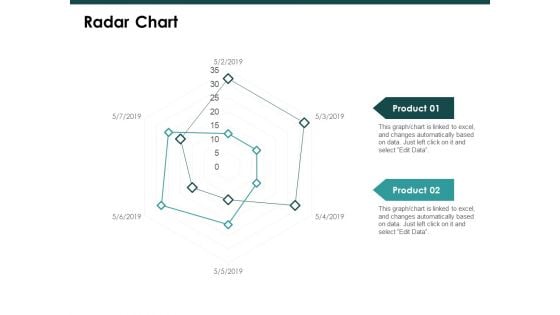
Radar Chart Graph Ppt PowerPoint Presentation Slide
This is a radar chart graph ppt powerpoint presentation slide. This is a two stage process. The stages in this process are finance, marketing, management, investment, analysis.
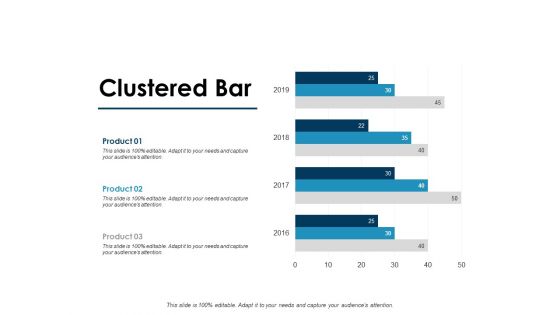
Clustered Bar Graph Ppt PowerPoint Presentation Templates
This is a clustered bar graph ppt powerpoint presentation templates. This is a three stage process. The stages in this process are finance, marketing, management, investment, analysis.
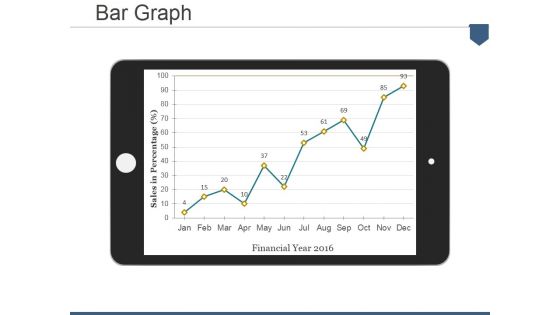
Bar Graph Ppt PowerPoint Presentation Pictures Display
This is a bar graph ppt powerpoint presentation pictures display. This is a one stage process. The stages in this process are sales in percentage, financial year.
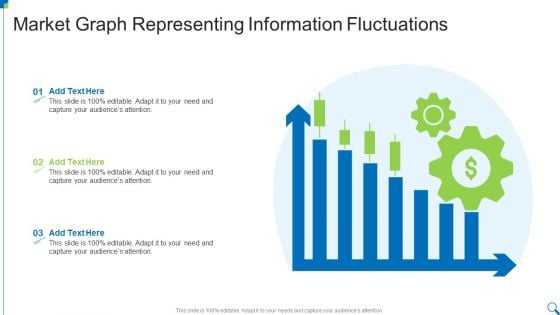
Market Graph Representing Information Fluctuations Diagrams PDF
Presenting Market Graph Representing Information Fluctuations Diagrams PDF to dispense important information. This template comprises three stages. It also presents valuable insights into the topics including Market Graph, Representing, Information Fluctuations This is a completely customizable PowerPoint theme that can be put to use immediately. So, download it and address the topic impactfully.


 Continue with Email

 Home
Home


