Revenue Graph
Revenue Split By Regions Automobile Development Company Profile CP SS V
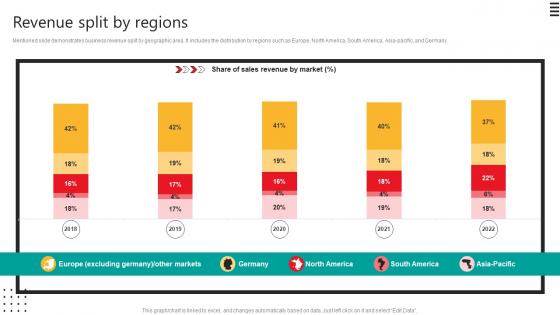
Mentioned slide demonstrates business revenue split by geographic area. It includes the distribution by regions such as Europe. North America, South America, Asia-pacific, and Germany. Do you know about Slidesgeeks Revenue Split By Regions Automobile Development Company Profile CP SS V These are perfect for delivering any kind od presentation. Using it, create PowerPoint presentations that communicate your ideas and engage audiences. Save time and effort by using our pre-designed presentation templates that are perfect for a wide range of topic. Our vast selection of designs covers a range of styles, from creative to business, and are all highly customizable and easy to edit. Download as a PowerPoint template or use them as Google Slides themes. Mentioned slide demonstrates business revenue split by geographic area. It includes the distribution by regions such as Europe. North America, South America, Asia-pacific, and Germany.
Revenue Distribution By Product And Services Consumer Electronics Company Profile CP SS V
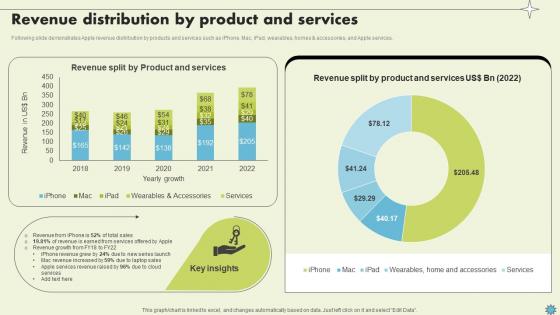
Following slide demonstrates Apple revenue distribution by products and services such as iPhone, Mac, iPad, wearables, homes and accessories, and Apple services.Coming up with a presentation necessitates that the majority of the effort goes into the content and the message you intend to convey. The visuals of a PowerPoint presentation can only be effective if it supplements and supports the story that is being told. Keeping this in mind our experts created Revenue Distribution By Product And Services Consumer Electronics Company Profile CP SS V to reduce the time that goes into designing the presentation. This way, you can concentrate on the message while our designers take care of providing you with the right template for the situation. Following slide demonstrates Apple revenue distribution by products and services such as iPhone, Mac, iPad, wearables, homes and accessories, and Apple services.
Revenue Distribution By Reporting Segments Consumer Electronics Company Profile CP SS V
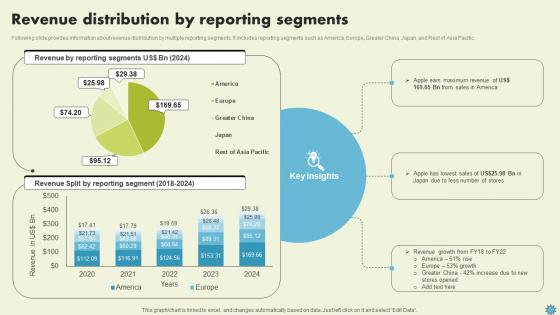
Following slide provides information about revenue distribution by multiple reporting segments. It includes reporting segments such as America, Europe, Greater China, Japan, and Rest of Asia Pacific.This modern and well-arranged Revenue Distribution By Reporting Segments Consumer Electronics Company Profile CP SS V provides lots of creative possibilities. It is very simple to customize and edit with the Powerpoint Software. Just drag and drop your pictures into the shapes. All facets of this template can be edited with Powerpoint, no extra software is necessary. Add your own material, put your images in the places assigned for them, adjust the colors, and then you can show your slides to the world, with an animated slide included. Following slide provides information about revenue distribution by multiple reporting segments. It includes reporting segments such as America, Europe, Greater China, Japan, and Rest of Asia Pacific.
Revenue By Geographical Markets Global Consulting And Technology Services Company Profile CP SS V
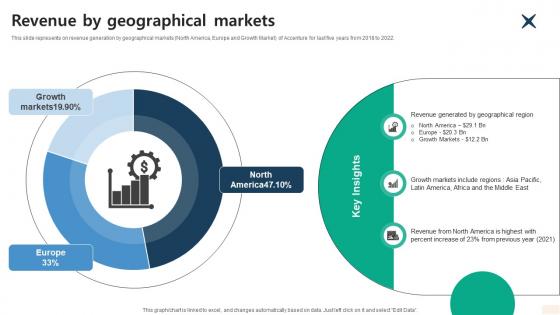
This slide represents on revenue generation by geographical markets North America, Europe and Growth Market of Accenture for last five years from 2018 to 2022.The best PPT templates are a great way to save time, energy, and resources. Slidegeeks have 100 percent editable powerpoint slides making them incredibly versatile. With these quality presentation templates, you can create a captivating and memorable presentation by combining visually appealing slides and effectively communicating your message. Download Revenue By Geographical Markets Global Consulting And Technology Services Company Profile CP SS V from Slidegeeks and deliver a wonderful presentation. This slide represents on revenue generation by geographical markets North America, Europe and Growth Market of Accenture for last five years from 2018 to 2022.
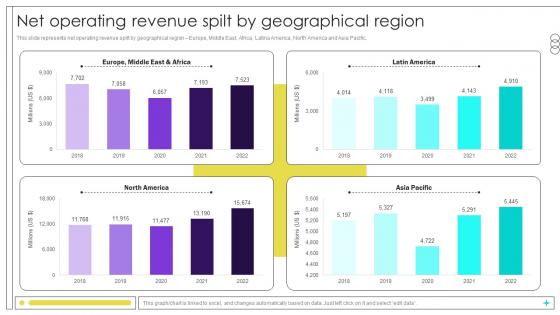
Net Operating Revenue Spilt By Geographical Region Beverage Manufacturer Company Profile Ppt Template CP SS V
This slide represents net operating revenue spilt by geographical region Europe, Middle East, Africa, Latina America, North America and Asia Pacific. Are you in need of a template that can accommodate all of your creative concepts This one is crafted professionally and can be altered to fit any style. Use it with Google Slides or PowerPoint. Include striking photographs, symbols, depictions, and other visuals. Fill, move around, or remove text boxes as desired. Test out color palettes and font mixtures. Edit and save your work, or work with colleagues. Download Net Operating Revenue Spilt By Geographical Region Beverage Manufacturer Company Profile Ppt Template CP SS V and observe how to make your presentation outstanding. Give an impeccable presentation to your group and make your presentation unforgettable. This slide represents net operating revenue spilt by geographical region Europe, Middle East, Africa, Latina America, North America and Asia Pacific.
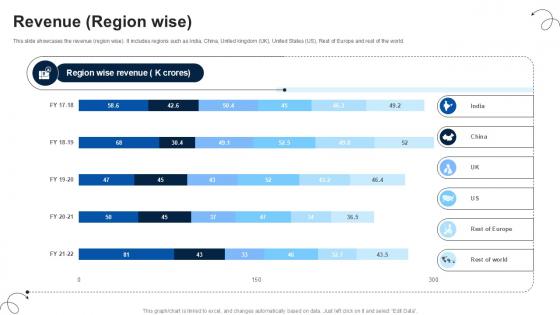
Revenue Region Wise Luxury Automobile Vehicles PPT Example CP SS V
This slide showcases the revenue region wise. It includes regions such as India, China, United kingdom UK, United States US, Rest of Europe and rest of the world. Slidegeeks is one of the best resources for PowerPoint templates. You can download easily and regulate Revenue Region Wise Luxury Automobile Vehicles PPT Example CP SS V for your personal presentations from our wonderful collection. A few clicks is all it takes to discover and get the most relevant and appropriate templates. Use our Templates to add a unique zing and appeal to your presentation and meetings. All the slides are easy to edit and you can use them even for advertisement purposes. This slide showcases the revenue region wise. It includes regions such as India, China, United kingdom UK, United States US, Rest of Europe and rest of the world.
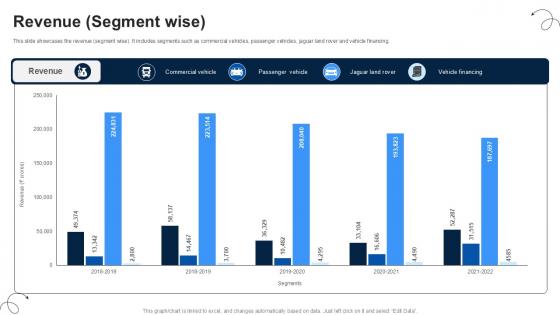
Revenue Segment Wise Luxury Automobile Vehicles PPT Sample CP SS V
This slide showcases the revenue segment wise. It includes segments such as commercial vehicles, passenger vehicles, jaguar land rover and vehicle financing. Want to ace your presentation in front of a live audience Our Revenue Segment Wise Luxury Automobile Vehicles PPT Sample CP SS V can help you do that by engaging all the users towards you. Slidegeeks experts have put their efforts and expertise into creating these impeccable powerpoint presentations so that you can communicate your ideas clearly. Moreover, all the templates are customizable, and easy-to-edit and downloadable. Use these for both personal and commercial use. This slide showcases the revenue segment wise. It includes segments such as commercial vehicles, passenger vehicles, jaguar land rover and vehicle financing.
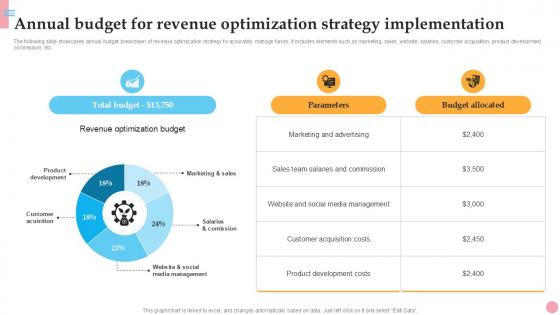
Annual Budget For Revenue Optimization How To Improve Company PPT Template Strategy SS V
The following slide showcases annual budget breakdown of revenue optimization strategy to accurately manage funds. It includes elements such as marketing, sales, website, salaries, customer acquisition, product development, commission, etc. There are so many reasons you need a Annual Budget For Revenue Optimization How To Improve Company PPT Template Strategy SS V. The first reason is you can not spend time making everything from scratch, Thus, Slidegeeks has made presentation templates for you too. You can easily download these templates from our website easily. The following slide showcases annual budget breakdown of revenue optimization strategy to accurately manage funds. It includes elements such as marketing, sales, website, salaries, customer acquisition, product development, commission, etc.
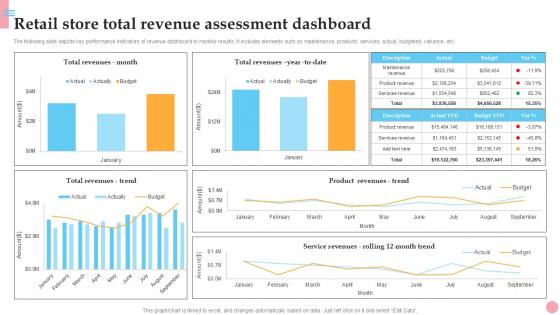
Retail Store Total Revenue Assessment How To Improve Company PPT Presentation Strategy SS V
The following slide depicts key performance indicators of revenue dashboard to monitor results. It includes elements such as maintenance, products, services, actual, budgeted, variance, etc. Take your projects to the next level with our ultimate collection of Retail Store Total Revenue Assessment How To Improve Company PPT Presentation Strategy SS V. Slidegeeks has designed a range of layouts that are perfect for representing task or activity duration, keeping track of all your deadlines at a glance. Tailor these designs to your exact needs and give them a truly corporate look with your own brand colors they will make your projects stand out from the rest The following slide depicts key performance indicators of revenue dashboard to monitor results. It includes elements such as maintenance, products, services, actual, budgeted, variance, etc.
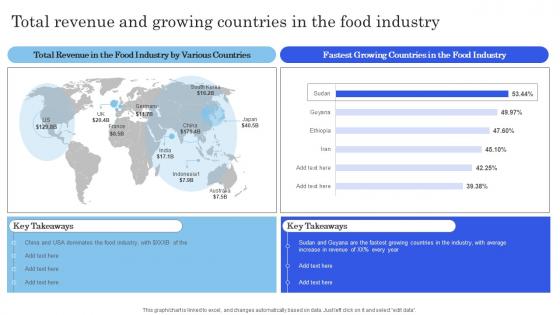
Launching New Commodity Total Revenue And Growing Countries In The Food Industry Professional Pdf
Find a pre-designed and impeccable Launching New Commodity Total Revenue And Growing Countries In The Food Industry Professional Pdf The templates can ace your presentation without additional effort. You can download these easy-to-edit presentation templates to make your presentation stand out from others. So, what are you waiting for Download the template from Slidegeeks today and give a unique touch to your presentation. Our Launching New Commodity Total Revenue And Growing Countries In The Food Industry Professional Pdf are topically designed to provide an attractive backdrop to any subject. Use them to look like a presentation pro.

Profit And Loss Account Statement Summary Of Revenue Childcare Business Plan Professional Pdf
The slides provide a glimpse of the projected profit and loss statement to visualize the platforms financial performance for the next five years. The key components are total revenue from operations, gross profit, EBITDA, etc. Are you searching for a Profit And Loss Account Statement Summary Of Revenue Childcare Business Plan Professional Pdf that is uncluttered, straightforward, and original Its easy to edit, and you can change the colors to suit your personal or business branding. For a presentation that expresses how much effort you have put in, this template is ideal With all of its features, including tables, diagrams, statistics, and lists, its perfect for a business plan presentation. Make your ideas more appealing with these professional slides. Download Profit And Loss Account Statement Summary Of Revenue Childcare Business Plan Professional Pdf from Slidegeeks today. The slides provide a glimpse of the projected profit and loss statement to visualize the platforms financial performance for the next five years. The key components are total revenue from operations, gross profit, EBITDA, etc.
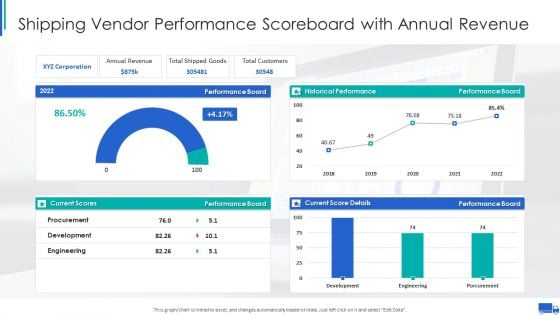
Shipping Vendor Performance Scoreboard With Annual Revenue Ppt Infographics Graphics PDF
This graph or chart is linked to excel, and changes automatically based on data. Just left click on it and select Edit Data. Deliver an awe inspiring pitch with this creative Shipping Vendor Performance Scoreboard With Annual Revenue Ppt Infographics Graphics PDF bundle. Topics like Annual Revenue Board, Total Shipped Goods, Total Customers Performance can be discussed with this completely editable template. It is available for immediate download depending on the needs and requirements of the user.

Revenue Streams Private School Investor Funding Elevator Pitch Deck PPT Template
This slide explores how our private school generates income, including tuition fees and additional services. It includes revenue sources such as, tuition fees after school programs, summer camps, and corporate training contracts. Formulating a presentation can take up a lot of effort and time, so the content and message should always be the primary focus. The visuals of the PowerPoint can enhance the presenters message, so our Revenue Streams Private School Investor Funding Elevator Pitch Deck PPT Template was created to help save time. Instead of worrying about the design, the presenter can concentrate on the message while our designers work on creating the ideal templates for whatever situation is needed. Slidegeeks has experts for everything from amazing designs to valuable content, we have put everything into Revenue Streams Private School Investor Funding Elevator Pitch Deck PPT Template This slide explores how our private school generates income, including tuition fees and additional services. It includes revenue sources such as, tuition fees after school programs, summer camps, and corporate training contracts.
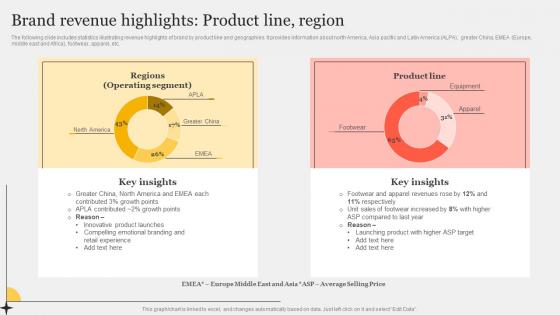
Brand Revenue Highlights Product Line Region Improving Customer Interaction Through Rules Pdf
The following slide includes statistics illustrating revenue highlights of brand by product line and geographies. It provides information about north America, Asia pacific and Latin America ALPA, greater China, EMEA Europe, middle east and Africa, footwear, apparel, etc.If you are looking for a format to display your unique thoughts, then the professionally designed Brand Revenue Highlights Product Line Region Improving Customer Interaction Through Rules Pdf is the one for you. You can use it as a Google Slides template or a PowerPoint template. Incorporate impressive visuals, symbols, images, and other charts. Modify or reorganize the text boxes as you desire. Experiment with shade schemes and font pairings. Alter, share or cooperate with other people on your work. Download Brand Revenue Highlights Product Line Region Improving Customer Interaction Through Rules Pdf and find out how to give a successful presentation. Present a perfect display to your team and make your presentation unforgettable. The following slide includes statistics illustrating revenue highlights of brand by product line and geographies. It provides information about north America, Asia pacific and Latin America ALPA, greater China, EMEA Europe, middle east and Africa, footwear, apparel, etc.
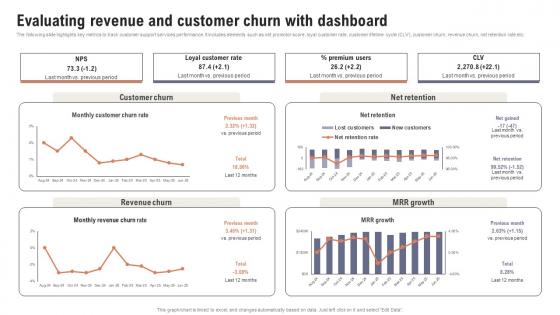
Evaluating Revenue And Customer Churn Boosting Customer Retention Rate With Live Chat
The following slide highlights key metrics to track customer support services performance. It includes elements such as net promotor score, loyal customer rate, customer lifetime cycle CLV, customer churn, revenue churn, net retention rate etc. Find highly impressive Evaluating Revenue And Customer Churn Boosting Customer Retention Rate With Live Chat on Slidegeeks to deliver a meaningful presentation. You can save an ample amount of time using these presentation templates. No need to worry to prepare everything from scratch because Slidegeeks experts have already done a huge research and work for you. You need to download Evaluating Revenue And Customer Churn Boosting Customer Retention Rate With Live Chat for your upcoming presentation. All the presentation templates are 100 percent editable and you can change the color and personalize the content accordingly. Download now The following slide highlights key metrics to track customer support services performance. It includes elements such as net promotor score, loyal customer rate, customer lifetime cycle CLV, customer churn, revenue churn, net retention rate etc.
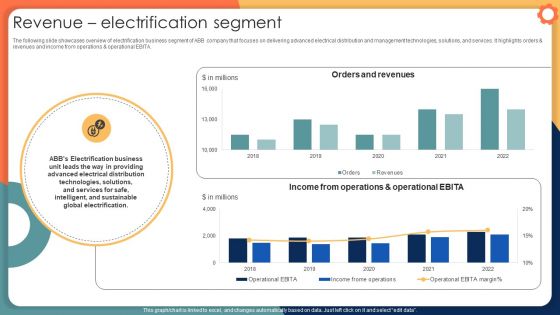
Revenue Electrification Segment Engineering Solution Provider Company Profile CP SS V
The following slide showcases overview of electrification business segment of ABB company that focuses on delivering advanced electrical distribution and management technologies, solutions, and services. It highlights orders and revenues and income from operations and operational EBITA. Presenting this PowerPoint presentation, titled Revenue Electrification Segment Engineering Solution Provider Company Profile CP SS V, with topics curated by our researchers after extensive research. This editable presentation is available for immediate download and provides attractive features when used. Download now and captivate your audience. Presenting this Revenue Electrification Segment Engineering Solution Provider Company Profile CP SS V. Our researchers have carefully researched and created these slides with all aspects taken into consideration. This is a completely customizable Revenue Electrification Segment Engineering Solution Provider Company Profile CP SS V that is available for immediate downloading. Download now and make an impact on your audience. Highlight the attractive features available with our PPTs. The following slide showcases overview of electrification business segment of ABB company that focuses on delivering advanced electrical distribution and management technologies, solutions, and services. It highlights orders and revenues and income from operations and operational EBITA.
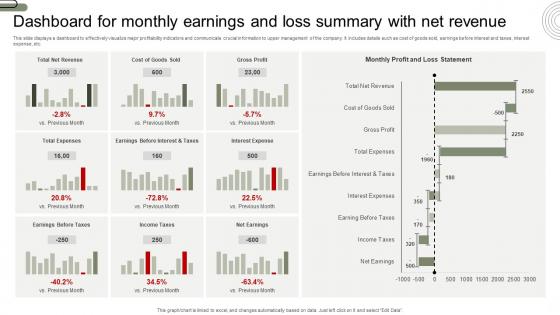
Dashboard For Monthly Earnings And Loss Summary With Net Revenue Background Pdf
This slide displays a dashboard to effectively visualize major profitability indicators and communicate crucial information to upper management of the company. It includes details such as cost of goods sold, earnings before interest and taxes, interest expense, etc. Pitch your topic with ease and precision using this Dashboard For Monthly Earnings And Loss Summary With Net Revenue Background Pdf. This layout presents information on Dashboard For Monthly Earnings, Loss Summary, Net Revenue. It is also available for immediate download and adjustment. So, changes can be made in the color, design, graphics or any other component to create a unique layout. This slide displays a dashboard to effectively visualize major profitability indicators and communicate crucial information to upper management of the company. It includes details such as cost of goods sold, earnings before interest and taxes, interest expense, etc.
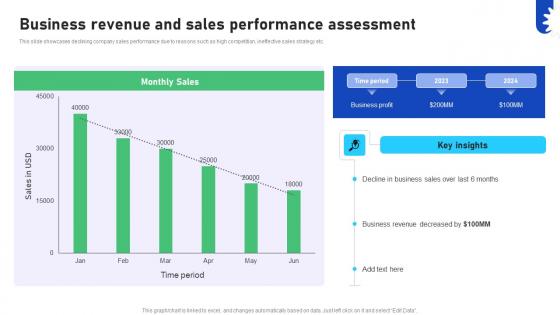
Improving Business Marketing Performance Business Revenue And Sales Performance CRP DK SS V
This slide showcases declining company sales performance due to reasons such as high competition, ineffective sales strategy etc. Do you have an important presentation coming up Are you looking for something that will make your presentation stand out from the rest Look no further than Improving Business Marketing Performance Business Revenue And Sales Performance CRP DK SS V. With our professional designs, you can trust that your presentation will pop and make delivering it a smooth process. And with Slidegeeks, you can trust that your presentation will be unique and memorable. So why wait Grab Improving Business Marketing Performance Business Revenue And Sales Performance CRP DK SS V today and make your presentation stand out from the rest This slide showcases declining company sales performance due to reasons such as high competition, ineffective sales strategy etc.
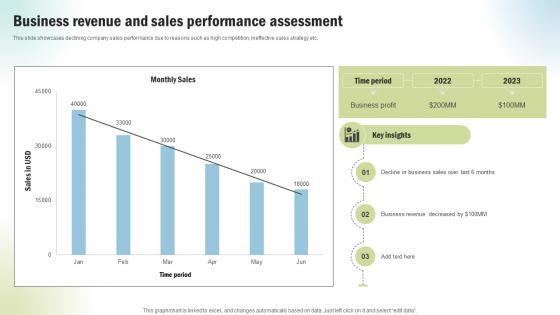
Marketing Project Performance Benchmarking Business Revenue And Sales CRP SS V
This slide showcases declining company sales performance due to reasons such as high competition, ineffective sales strategy etc. Get a simple yet stunning designed Marketing Project Performance Benchmarking Business Revenue And Sales CRP SS V. It is the best one to establish the tone in your meetings. It is an excellent way to make your presentations highly effective. So, download this PPT today from Slidegeeks and see the positive impacts. Our easy-to-edit Marketing Project Performance Benchmarking Business Revenue And Sales CRP SS V can be your go-to option for all upcoming conferences and meetings. So, what are you waiting for Grab this template today. This slide showcases declining company sales performance due to reasons such as high competition, ineffective sales strategy etc.
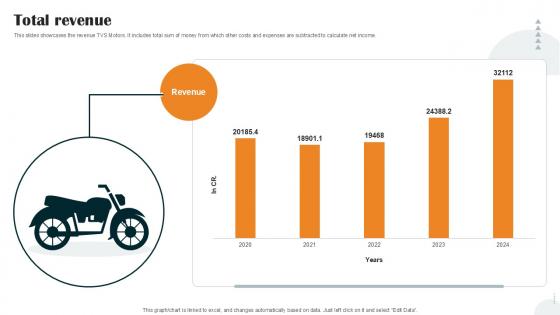
Total Revenue Vehicle Manufacturer Company Profile PPT Presentation CP SS V
Do you know about Slidesgeeks Total Revenue Vehicle Manufacturer Company Profile PPT Presentation CP SS V These are perfect for delivering any kind od presentation. Using it, create PowerPoint presentations that communicate your ideas and engage audiences. Save time and effort by using our pre-designed presentation templates that are perfect for a wide range of topic. Our vast selection of designs covers a range of styles, from creative to business, and are all highly customizable and easy to edit. Download as a PowerPoint template or use them as Google Slides themes. Our Total Revenue Vehicle Manufacturer Company Profile PPT Presentation CP SS V are topically designed to provide an attractive backdrop to any subject. Use them to look like a presentation pro.
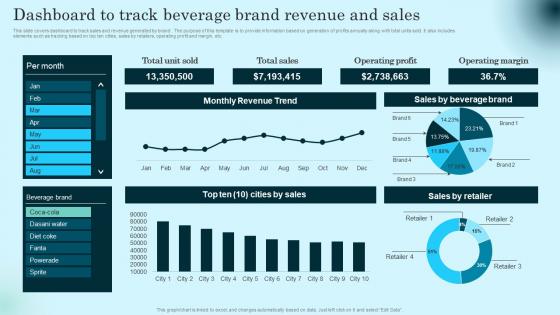
Dashboard To Track Beverage Brand Revenue Comprehensive Guide To Product Lifecycle Graphics Pdf
This slide covers dashboard to track sales and revenue generated by brand . The purpose of this template is to provide information based on generation of profits annually along with total units sold. It also includes elements such as tracking based on top ten cities, sales by retailers, operating profit and margin, etc. Present like a pro with Dashboard To Track Beverage Brand Revenue Comprehensive Guide To Product Lifecycle Graphics Pdf Create beautiful presentations together with your team, using our easy to use presentation slides. Share your ideas in real time and make changes on the fly by downloading our templates. So whether you are in the office, on the go, or in a remote location, you can stay in sync with your team and present your ideas with confidence. With Slidegeeks presentation got a whole lot easier. Grab these presentations today. This slide covers dashboard to track sales and revenue generated by brand . The purpose of this template is to provide information based on generation of profits annually along with total units sold. It also includes elements such as tracking based on top ten cities, sales by retailers, operating profit and margin, etc.
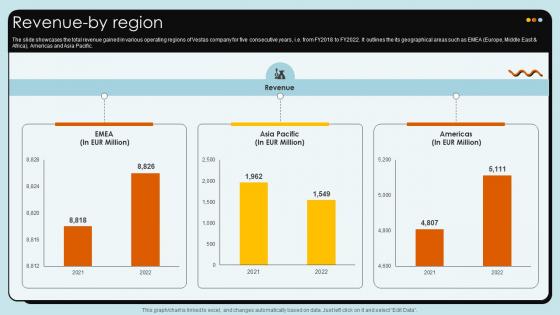
Revenue By Region Wind Turbines Manufacturer Company Profile CP SS V
The slide showcases the total revenue gained in various operating regions of Vestas company for five consecutive years, i.e. from FY2018 to FY2022. It outlines the its geographical areas such as EMEA Europe, Middle East and Africa, Americas and Asia Pacific.Retrieve professionally designed Revenue By Region Wind Turbines Manufacturer Company Profile CP SS V to effectively convey your message and captivate your listeners. Save time by selecting pre-made slideshows that are appropriate for various topics, from business to educational purposes. These themes come in many different styles, from creative to corporate, and all of them are easily adjustable and can be edited quickly. Access them as PowerPoint templates or as Google Slides themes. You do not have to go on a hunt for the perfect presentation because Slidegeeks got you covered from everywhere. The slide showcases the total revenue gained in various operating regions of Vestas company for five consecutive years, i.e. from FY2018 to FY2022. It outlines the its geographical areas such as EMEA Europe, Middle East and Africa, Americas and Asia Pacific.
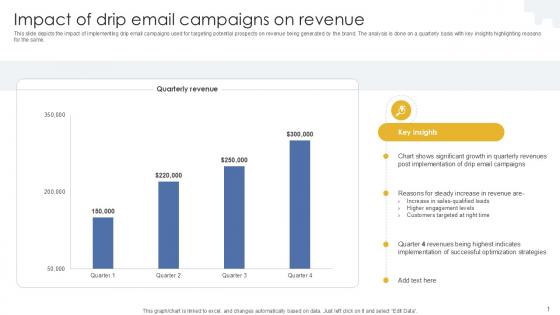
Impact Of Drip Email Campaigns On Revenue PPT Slide MKT SS V
This slide depicts the impact of implementing drip email campaigns used for targeting potential prospects on revenue being generated by the brand. The analysis is done on a quarterly basis with key insights highlighting reasons for the same. Welcome to our selection of the Impact Of Drip Email Campaigns On Revenue PPT Slide MKT SS V. These are designed to help you showcase your creativity and bring your sphere to life. Planning and Innovation are essential for any business that is just starting out. This collection contains the designs that you need for your everyday presentations. All of our PowerPoints are 100Percent editable, so you can customize them to suit your needs. This multi-purpose template can be used in various situations. Grab these presentation templates today. This slide depicts the impact of implementing drip email campaigns used for targeting potential prospects on revenue being generated by the brand. The analysis is done on a quarterly basis with key insights highlighting reasons for the same.
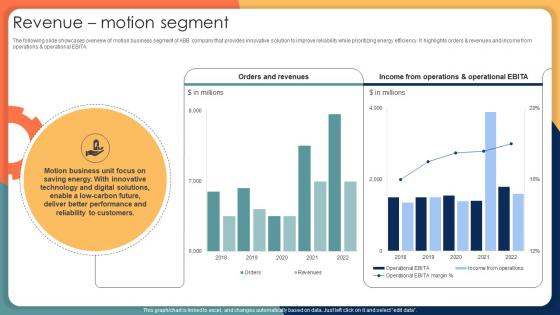
Revenue Motion Segment Engineering Solution Provider Company Profile CP SS V
The following slide showcases overview of motion business segment of ABB company that provides innovative solution to improve reliability while prioritizing energy efficiency. It highlights orders and revenues and income from operations and operational EBITA. Here you can discover an assortment of the finest PowerPoint and Google Slides templates. With these templates, you can create presentations for a variety of purposes while simultaneously providing your audience with an eye-catching visual experience. Download Revenue Motion Segment Engineering Solution Provider Company Profile CP SS V to deliver an impeccable presentation. These templates will make your job of preparing presentations much quicker, yet still, maintain a high level of quality. Slidegeeks has experienced researchers who prepare these templates and write high-quality content for you. Later on, you can personalize the content by editing the Revenue Motion Segment Engineering Solution Provider Company Profile CP SS V. The following slide showcases overview of motion business segment of ABB company that provides innovative solution to improve reliability while prioritizing energy efficiency. It highlights orders and revenues and income from operations and operational EBITA.
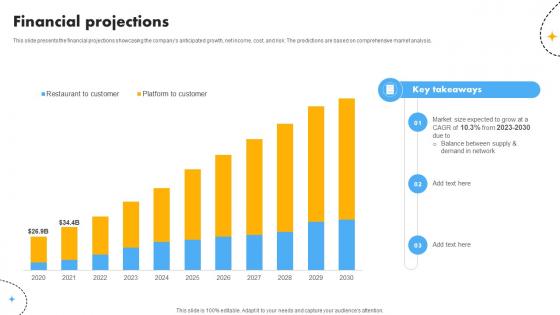
Financial Projections Cost Optimization And Revenue Innovation With Deliveroo Business Model BMC SS V
This slide presents the financial projections showcasing the companys anticipated growth, net income, cost, and risk. The predictions are based on comprehensive market analysis. There are so many reasons you need a Financial Projections Cost Optimization And Revenue Innovation With Deliveroo Business Model BMC SS V. The first reason is you can not spend time making everything from scratch, Thus, Slidegeeks has made presentation templates for you too. You can easily download these templates from our website easily. This slide presents the financial projections showcasing the companys anticipated growth, net income, cost, and risk. The predictions are based on comprehensive market analysis.
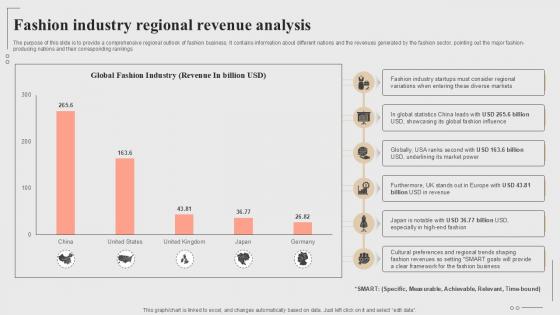
Fashion Industry Regional Revenue Analysis Fashion Startup Roadmap Plan Ppt Template BP SS V
The purpose of this slide is to provide a comprehensive regional outlook of fashion business. It contains information about different nations and the revenues generated by the fashion sector, pointing out the major fashion-producing nations and their corresponding rankings Make sure to capture your audiences attention in your business displays with our gratis customizable Fashion Industry Regional Revenue Analysis Fashion Startup Roadmap Plan Ppt Template BP SS V These are great for business strategies, office conferences, capital raising or task suggestions. If you desire to acquire more customers for your tech business and ensure they stay satisfied, create your own sales presentation with these plain slides. The purpose of this slide is to provide a comprehensive regional outlook of fashion business. It contains information about different nations and the revenues generated by the fashion sector, pointing out the major fashion-producing nations and their corresponding rankings
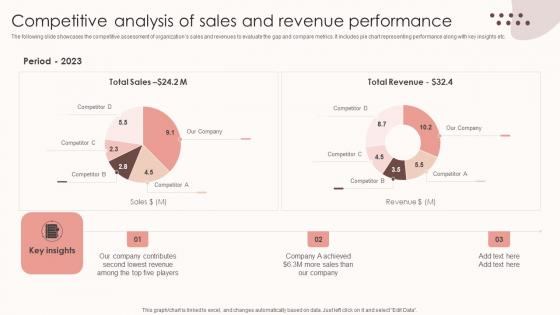
Assessing Sales Risks Competitive Analysis Of Sales And Revenue Performance Clipart PDF
The following slide showcases the competitive assessment of organizations sales and revenues to evaluate the gap and compare metrics. It includes pie chart representing performance along with key insights etc. Present like a pro with Assessing Sales Risks Competitive Analysis Of Sales And Revenue Performance Clipart PDF Create beautiful presentations together with your team, using our easy-to-use presentation slides. Share your ideas in real-time and make changes on the fly by downloading our templates. So whether you are in the office, on the go, or in a remote location, you can stay in sync with your team and present your ideas with confidence. With Slidegeeks presentation got a whole lot easier. Grab these presentations today. The following slide showcases the competitive assessment of organizations sales and revenues to evaluate the gap and compare metrics. It includes pie chart representing performance along with key insights etc.
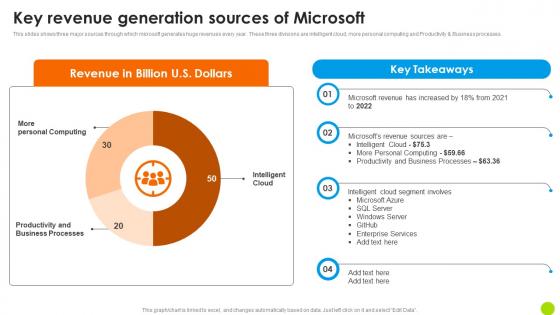
Key Revenue Generation Sources Of Microsoft Microsoft Long Term Business Pictures PDF
This slides shows three major sources through which microsoft generates huge revenues every year. These three divisions are intelligent cloud, more personal computing and Productivity and Business processes. This modern and well-arranged Key Revenue Generation Sources Of Microsoft Microsoft Long Term Business Pictures PDF provides lots of creative possibilities. It is very simple to customize and edit with the Powerpoint Software. Just drag and drop your pictures into the shapes. All facets of this template can be edited with Powerpoint, no extra software is necessary. Add your own material, put your images in the places assigned for them, adjust the colors, and then you can show your slides to the world, with an animated slide included. This slides shows three major sources through which microsoft generates huge revenues every year. These three divisions are intelligent cloud, more personal computing and Productivity and Business processes.
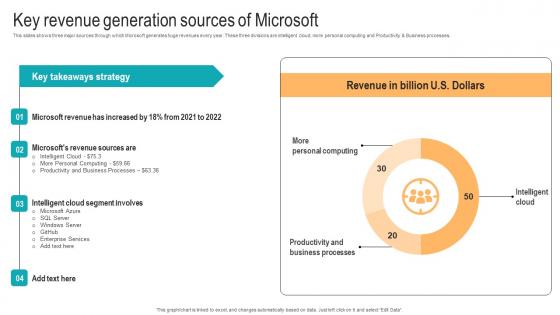
Key Revenue Generation Sources Of Microsoft Strategic Advancements By Microsofts Pictures Pdf
This slides shows three major sources through which Microsoft generates huge revenues every year. These three divisions are intelligent cloud, more personal computing and Productivity and Business processes. This modern and well-arranged Key Revenue Generation Sources Of Microsoft Strategic Advancements By Microsofts Pictures Pdf provides lots of creative possibilities. It is very simple to customize and edit with the Powerpoint Software. Just drag and drop your pictures into the shapes. All facets of this template can be edited with Powerpoint, no extra software is necessary. Add your own material, put your images in the places assigned for them, adjust the colors, and then you can show your slides to the world, with an animated slide included. This slides shows three major sources through which Microsoft generates huge revenues every year. These three divisions are intelligent cloud, more personal computing and Productivity and Business processes.
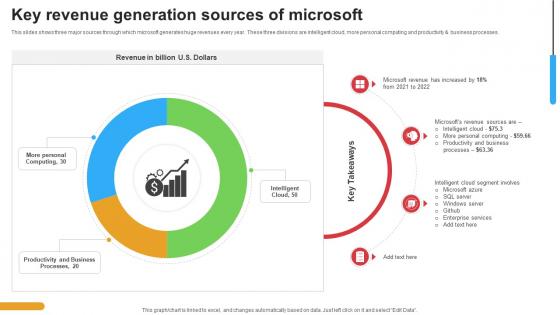
Micosoft Intensive Growth Key Revenue Generation Sources Of Microsoft Strategy SS V
This slides shows three major sources through which microsoft generates huge revenues every year. These three divisions are intelligent cloud, more personal computing and productivity and business processes. Coming up with a presentation necessitates that the majority of the effort goes into the content and the message you intend to convey. The visuals of a PowerPoint presentation can only be effective if it supplements and supports the story that is being told. Keeping this in mind our experts created Micosoft Intensive Growth Key Revenue Generation Sources Of Microsoft Strategy SS V to reduce the time that goes into designing the presentation. This way, you can concentrate on the message while our designers take care of providing you with the right template for the situation. This slides shows three major sources through which microsoft generates huge revenues every year. These three divisions are intelligent cloud, more personal computing and productivity and business processes.
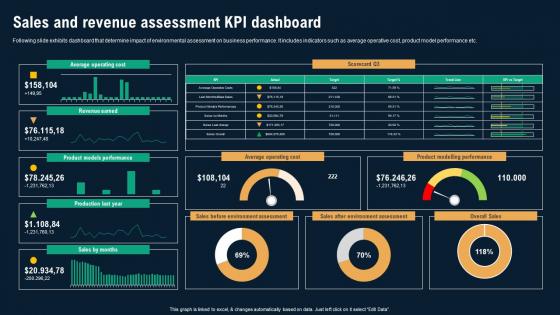
Sales And Revenue Assessment KPI Dashboard Business Environmental Analysis Ideas Pdf
Following slide exhibits dashboard that determine impact of environmental assessment on business performance. It includes indicators such as average operative cost, product model performance etc. There are so many reasons you need a Sales And Revenue Assessment KPI Dashboard Business Environmental Analysis Ideas Pdf The first reason is you can not spend time making everything from scratch, Thus, Slidegeeks has made presentation templates for you too. You can easily download these templates from our website easily. Following slide exhibits dashboard that determine impact of environmental assessment on business performance. It includes indicators such as average operative cost, product model performance etc.
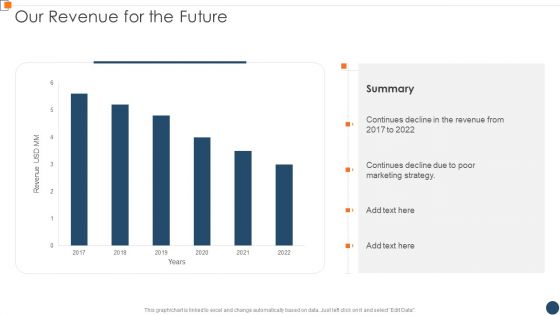
BANT Sales Lead Qualification Model Our Revenue For The Future Mockup PDF
This graph or chart is linked to excel and change automatically based on data. Just left click on it and select Edit Data. Deliver an awe inspiring pitch with this creative BANT Sales Lead Qualification Model Our Revenue For The Future Mockup PDF bundle. Topics like Continues Decline, Marketing Strategy, 2017 To 2022 can be discussed with this completely editable template. It is available for immediate download depending on the needs and requirements of the user.
Sales Growth Graph Vector Icon Ppt PowerPoint Presentation Ideas Information
Presenting this set of slides with name sales growth graph vector icon ppt powerpoint presentation ideas information. This is a three stage process. The stages in this process are revenue generation, business, strategies. This is a completely editable PowerPoint presentation and is available for immediate download. Download now and impress your audience.
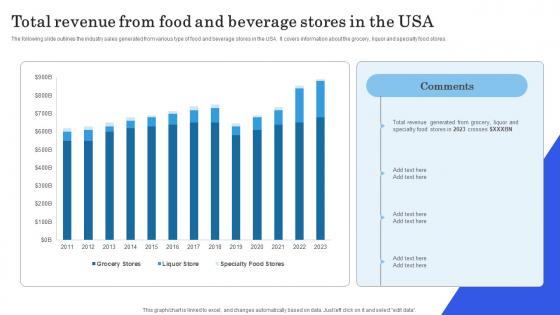
Launching New Commodity Total Revenue From Food And Beverage Stores In The Usa Brochure Pdf
The following slide outlines the industry sales generated from various type of food and beverage stores in the USA. It covers information about the grocery, liquor and specialty food stores. Boost your pitch with our creative Launching New Commodity Total Revenue From Food And Beverage Stores In The Usa Brochure Pdf Deliver an awe-inspiring pitch that will mesmerize everyone. Using these presentation templates you will surely catch everyones attention. You can browse the ppts collection on our website. We have researchers who are experts at creating the right content for the templates. So you do not have to invest time in any additional work. Just grab the template now and use them. The following slide outlines the industry sales generated from various type of food and beverage stores in the USA. It covers information about the grocery, liquor and specialty food stores.
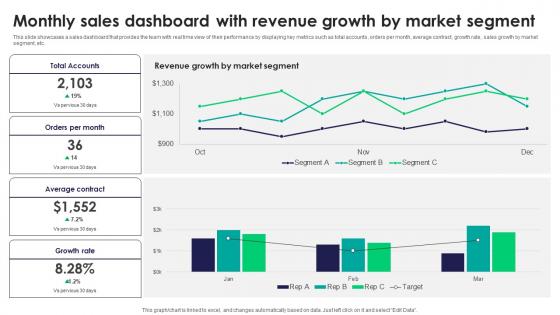
Monthly Sales Dashboard With Revenue Growth By Tactics For Improving Field Sales Team SA SS V
This slide showcases a sales dashboard that provides the team with real time view of their performance by displaying key metrics such as total accounts, orders per month, average contract, growth rate, sales growth by market segment, etc. The Monthly Sales Dashboard With Revenue Growth By Tactics For Improving Field Sales Team SA SS V is a compilation of the most recent design trends as a series of slides. It is suitable for any subject or industry presentation, containing attractive visuals and photo spots for businesses to clearly express their messages. This template contains a variety of slides for the user to input data, such as structures to contrast two elements, bullet points, and slides for written information. Slidegeeks is prepared to create an impression. This slide showcases a sales dashboard that provides the team with real time view of their performance by displaying key metrics such as total accounts, orders per month, average contract, growth rate, sales growth by market segment, etc.

Monthly Sales Dashboard With Revenue Efficient Sales Territory Management To Build SA SS V
This slide showcases a sales dashboard that provides the team with real time view of their performance by displaying key metrics such as total accounts, orders per month, average contract, growth rate, sales growth by market segment, etc. The Monthly Sales Dashboard With Revenue Efficient Sales Territory Management To Build SA SS V is a compilation of the most recent design trends as a series of slides. It is suitable for any subject or industry presentation, containing attractive visuals and photo spots for businesses to clearly express their messages. This template contains a variety of slides for the user to input data, such as structures to contrast two elements, bullet points, and slides for written information. Slidegeeks is prepared to create an impression. This slide showcases a sales dashboard that provides the team with real time view of their performance by displaying key metrics such as total accounts, orders per month, average contract, growth rate, sales growth by market segment, etc.
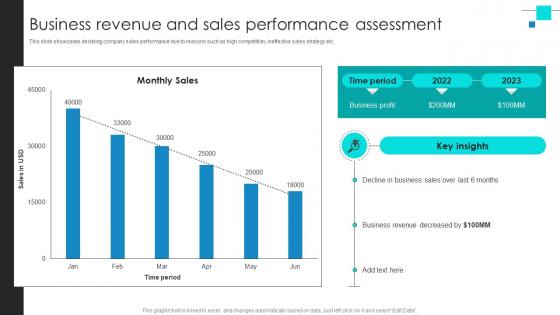
Project Benchmarking Process Business Revenue And Sales Performance Assessment CRP DK SS V
This slide showcases declining company sales performance due to reasons such as high competition, ineffective sales strategy etc. Present like a pro with Project Benchmarking Process Business Revenue And Sales Performance Assessment CRP DK SS V. Create beautiful presentations together with your team, using our easy-to-use presentation slides. Share your ideas in real-time and make changes on the fly by downloading our templates. So whether you are in the office, on the go, or in a remote location, you can stay in sync with your team and present your ideas with confidence. With Slidegeeks presentation got a whole lot easier. Grab these presentations today. This slide showcases declining company sales performance due to reasons such as high competition, ineffective sales strategy etc.
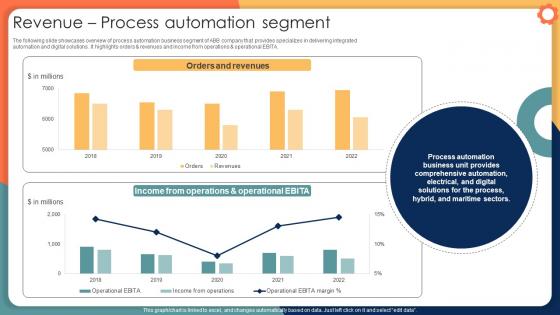
Revenue Process Automation Segment Engineering Solution Provider Company Profile CP SS V
The following slide showcases overview of process automation business segment of ABB company that provides specializes in delivering integrated automation and digital solutions . It highlights orders and revenues and income from operations and operational EBITA. This Revenue Process Automation Segment Engineering Solution Provider Company Profile CP SS V from Slidegeeks makes it easy to present information on your topic with precision. It provides customization options, so you can make changes to the colors, design, graphics, or any other component to create a unique layout. It is also available for immediate download, so you can begin using it right away. Slidegeeks has done good research to ensure that you have everything you need to make your presentation stand out. Make a name out there for a brilliant performance. The following slide showcases overview of process automation business segment of ABB company that provides specializes in delivering integrated automation and digital solutions . It highlights orders and revenues and income from operations and operational EBITA.
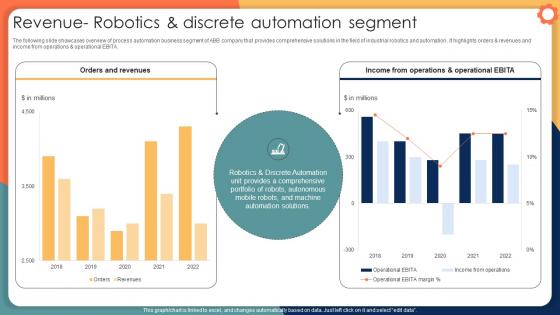
Revenue Robotics And Discrete Automation Segment Engineering Solution Provider Company Profile CP SS V
The following slide showcases overview of process automation business segment of ABB company that provides comprehensive solutions in the field of industrial robotics and automation . It highlights orders and revenues and income from operations and operational EBITA. Do you know about Slidesgeeks Revenue Robotics And Discrete Automation Segment Engineering Solution Provider Company Profile CP SS V These are perfect for delivering any kind od presentation. Using it, create PowerPoint presentations that communicate your ideas and engage audiences. Save time and effort by using our pre-designed presentation templates that are perfect for a wide range of topic. Our vast selection of designs covers a range of styles, from creative to business, and are all highly customizable and easy to edit. Download as a PowerPoint template or use them as Google Slides themes. The following slide showcases overview of process automation business segment of ABB company that provides comprehensive solutions in the field of industrial robotics and automation . It highlights orders and revenues and income from operations and operational EBITA.
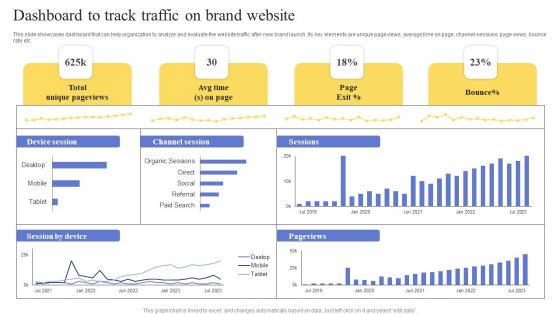
Dashboard To Track Traffic On Brand Website Maximizing Revenue Using Professional Pdf
This slide showcases dashboard that can help organization to analyze and evaluate the website traffic after new brand launch. Its key elements are unique page views, average time on page, channel sessions, page views, bounce rate etc. Are you in need of a template that can accommodate all of your creative concepts This one is crafted professionally and can be altered to fit any style. Use it with Google Slides or PowerPoint. Include striking photographs, symbols, depictions, and other visuals. Fill, move around, or remove text boxes as desired. Test out color palettes and font mixtures. Edit and save your work, or work with colleagues. Download Dashboard To Track Traffic On Brand Website Maximizing Revenue Using Professional Pdf and observe how to make your presentation outstanding. Give an impeccable presentation to your group and make your presentation unforgettable. This slide showcases dashboard that can help organization to analyze and evaluate the website traffic after new brand launch. Its key elements are unique page views, average time on page, channel sessions, page views, bounce rate etc.
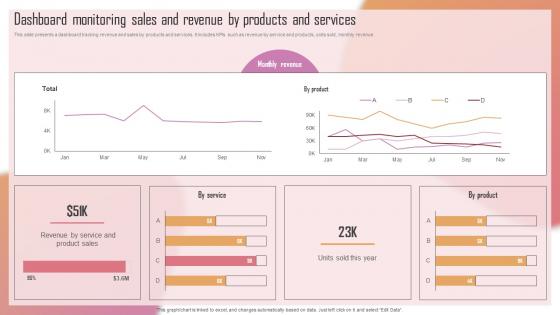
Customizing The Salon Experience Dashboard Monitoring Sales And Revenue By Products Strategy SS V
This slide presents a dashboard tracking revenue and sales by products and services. It includes KPIs such as revenue by service and products, units sold, monthly revenue. If your project calls for a presentation, then Slidegeeks is your go-to partner because we have professionally designed, easy-to-edit templates that are perfect for any presentation. After downloading, you can easily edit Customizing The Salon Experience Dashboard Monitoring Sales And Revenue By Products Strategy SS V and make the changes accordingly. You can rearrange slides or fill them with different images. Check out all the handy templates This slide presents a dashboard tracking revenue and sales by products and services. It includes KPIs such as revenue by service and products, units sold, monthly revenue.
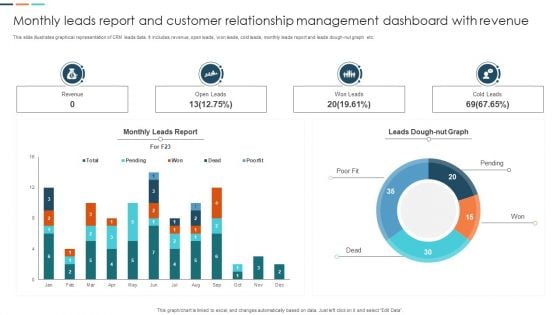
Monthly Leads Report And Customer Relationship Management Dashboard With Revenue Information PDF
This slide illustrates graphical representation of CRM leads data. It includes revenue, open leads, won leads, cold leads, monthly leads report and leads dough nut graph etc. Pitch your topic with ease and precision using this Monthly Leads Report And Customer Relationship Management Dashboard With Revenue Information PDF. This layout presents information on Monthly Leads Report, Customer Relationship Management, Dashboard With Revenue. It is also available for immediate download and adjustment. So, changes can be made in the color, design, graphics or any other component to create a unique layout.

Salon Marketing Plan To Optimize Dashboard Monitoring Sales And Revenue Strategy SS V
This slide presents a dashboard tracking revenue and sales by products and services. It includes KPIs such as revenue by service and products, units sold, monthly revenue. Formulating a presentation can take up a lot of effort and time, so the content and message should always be the primary focus. The visuals of the PowerPoint can enhance the presenters message, so our Salon Marketing Plan To Optimize Dashboard Monitoring Sales And Revenue Strategy SS V was created to help save time. Instead of worrying about the design, the presenter can concentrate on the message while our designers work on creating the ideal templates for whatever situation is needed. Slidegeeks has experts for everything from amazing designs to valuable content, we have put everything into Salon Marketing Plan To Optimize Dashboard Monitoring Sales And Revenue Strategy SS V. This slide presents a dashboard tracking revenue and sales by products and services. It includes KPIs such as revenue by service and products, units sold, monthly revenue.
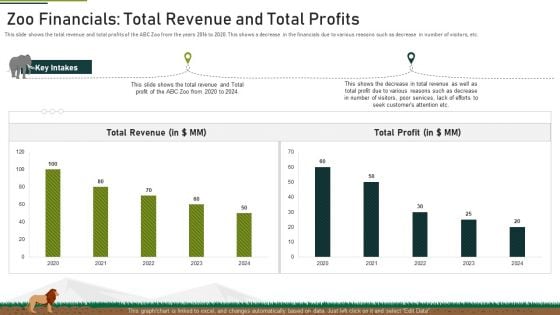
Zoo Financials Total Revenue And Total Profits Ppt Pictures Outline PDF
This slide shows the total revenue and total profits of the ABC Zoo from the years 2016 to 2020. This shows a decrease in the financials due to various reasons such as decrease in number of visitors, etc. Deliver an awe-inspiring pitch with this creative zoo financials total revenue and total profits ppt pictures outline pdf. bundle. Topics like total revenue, total profit can be discussed with this completely editable template. It is available for immediate download depending on the needs and requirements of the user.
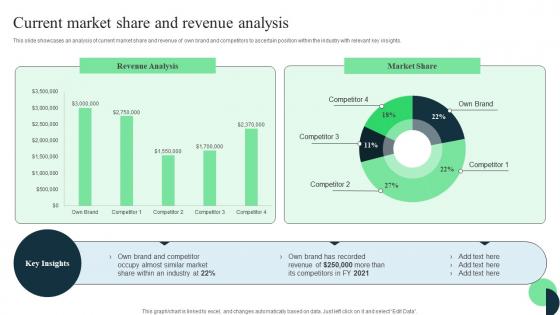
Market Leaders Guide To Influence Current Market Share And Revenue Analysis Graphics Pdf
This slide showcases an analysis of current market share and revenue of own brand and competitors to ascertain position within the industry with relevant key insights. Do you have an important presentation coming up Are you looking for something that will make your presentation stand out from the rest Look no further than Market Leaders Guide To Influence Current Market Share And Revenue Analysis Graphics Pdf. With our professional designs, you can trust that your presentation will pop and make delivering it a smooth process. And with Slidegeeks, you can trust that your presentation will be unique and memorable. So why wait Grab Market Leaders Guide To Influence Current Market Share And Revenue Analysis Graphics Pdf today and make your presentation stand out from the rest. This slide showcases an analysis of current market share and revenue of own brand and competitors to ascertain position within the industry with relevant key insights.

Trade Event Tactics To Boost Impact 1 Increase In Annual Sales Revenue SA SS V
This slide showcases an increase in business sales revenue compared to the previous year due to effective sales networking strategy implementation. Explore a selection of the finest Trade Event Tactics To Boost Impact 1 Increase In Annual Sales Revenue SA SS V here. With a plethora of professionally designed and pre-made slide templates, you can quickly and easily find the right one for your upcoming presentation. You can use our Trade Event Tactics To Boost Impact 1 Increase In Annual Sales Revenue SA SS V to effectively convey your message to a wider audience. Slidegeeks has done a lot of research before preparing these presentation templates. The content can be personalized and the slides are highly editable. Grab templates today from Slidegeeks. This slide showcases an increase in business sales revenue compared to the previous year due to effective sales networking strategy implementation.

Workforce Competency Enhancement Effect Of Poor Cloud Knowledge On Organizational Revenue DTE SS V
This slide showcase decreasing trend of revenue due to lack of skillsets and cloud knowledge to cater project coming in organization. If you are looking for a format to display your unique thoughts, then the professionally designed Workforce Competency Enhancement Effect Of Poor Cloud Knowledge On Organizational Revenue DTE SS V is the one for you. You can use it as a Google Slides template or a PowerPoint template. Incorporate impressive visuals, symbols, images, and other charts. Modify or reorganize the text boxes as you desire. Experiment with shade schemes and font pairings. Alter, share or cooperate with other people on your work. Download Workforce Competency Enhancement Effect Of Poor Cloud Knowledge On Organizational Revenue DTE SS V and find out how to give a successful presentation. Present a perfect display to your team and make your presentation unforgettable. This slide showcase decreasing trend of revenue due to lack of skillsets and cloud knowledge to cater project coming in organization.
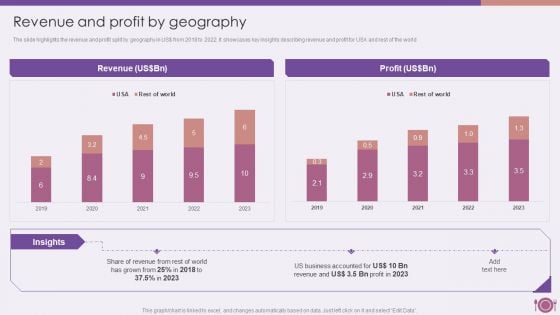
Packaged Food Firm Description Revenue And Profit By Geography Portrait PDF
The slide highlights the revenue and profit split by geography in US from 2018 to 2022. It showcases key insights describing revenue and profit for USA and rest of the world.Deliver an awe inspiring pitch with this creative Packaged Food Firm Description Revenue And Profit By Geography Portrait PDF bundle. Topics like Products Revenue, Beverages Revenue, Products Revenue can be discussed with this completely editable template. It is available for immediate download depending on the needs and requirements of the user.
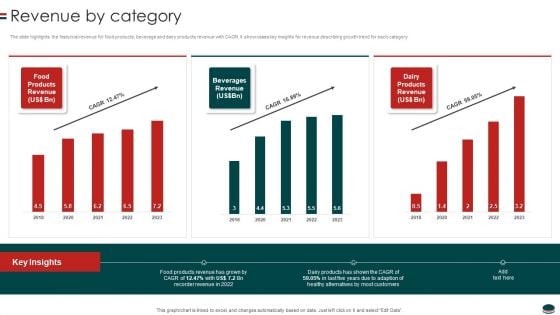
Instant Snacks And Food Firm Details Revenue By Category Clipart PDF
The slide highlights the historical revenue for food products, beverage and dairy products revenue with CAGR. It showcases key insights for revenue describing growth trend for each category.Deliver an awe inspiring pitch with this creative Instant Snacks And Food Firm Details Revenue By Category Clipart PDF bundle. Topics like Products Revenue, Beverages Revenue, Dairy Products can be discussed with this completely editable template. It is available for immediate download depending on the needs and requirements of the user.
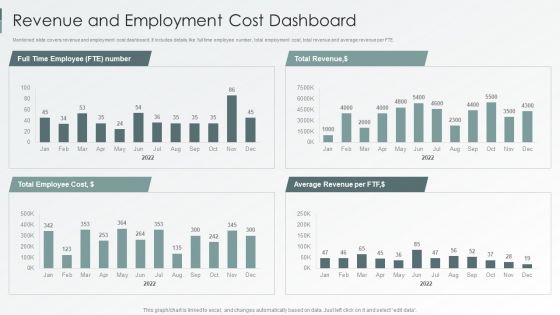
Enterprise Sustainability Performance Metrics Revenue And Employment Cost Dashboard Elements PDF
Mentioned slide covers revenue and employment cost dashboard. It includes details like full time employee number, total employment cost, total revenue and average revenue per FTE. Deliver an awe inspiring pitch with this creative Enterprise Sustainability Performance Metrics Revenue And Employment Cost Dashboard Elements PDF bundle. Topics like Total Revenue, Average Revenue, Total Employee can be discussed with this completely editable template. It is available for immediate download depending on the needs and requirements of the user.
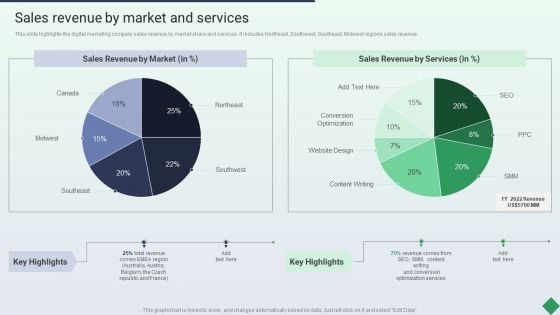
Website Marketing Enterprise Profile Sales Revenue By Market And Services Ppt PowerPoint Presentation Inspiration PDF
This slide highlights the digital marketing company sales revenue by market share and services. It includes Northeast, Southwest, Southeast, Midwest regions sales revenue.Deliver and pitch your topic in the best possible manner with this Website Marketing Enterprise Profile Sales Revenue By Market And Services Ppt PowerPoint Presentation Inspiration PDF. Use them to share invaluable insights on Sales Revenue, Revenue Services, Revenue Comes and impress your audience. This template can be altered and modified as per your expectations. So, grab it now.
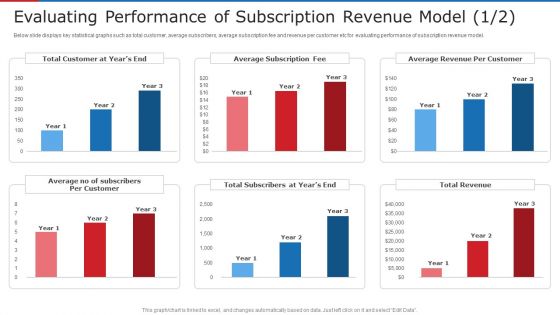
Evaluating Performance Of Subscription Revenue Model Average Ppt Portfolio Elements PDF
Below slide displays key statistical graphs such as total customer, average subscribers, average subscription fee and revenue per customer etc for evaluating performance of subscription revenue model. Deliver an awe inspiring pitch with this creative evaluating performance of subscription revenue model average ppt portfolio elements pdf bundle. Topics like customer, average, revenue can be discussed with this completely editable template. It is available for immediate download depending on the needs and requirements of the user.
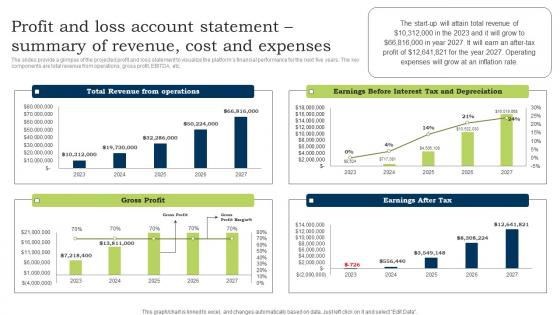
Go To Market Strategy Profit And Loss Account Statement Summary Of Revenue Cost Template Pdf
The slides provide a glimpse of the projected profit and loss statement to visualize the platforms financial performance for the next five years. The key components are total revenue from operations, gross profit, EBITDA, etc. The Go To Market Strategy Profit And Loss Account Statement Summary Of Revenue Cost Template Pdf is a compilation of the most recent design trends as a series of slides. It is suitable for any subject or industry presentation, containing attractive visuals and photo spots for businesses to clearly express their messages. This template contains a variety of slides for the user to input data, such as structures to contrast two elements, bullet points, and slides for written information. Slidegeeks is prepared to create an impression. The slides provide a glimpse of the projected profit and loss statement to visualize the platforms financial performance for the next five years. The key components are total revenue from operations, gross profit, EBITDA, etc.

Sample Trugreen Business Plan Profit And Loss Account Statement Summary Of Revenue BP SS V
The slides provide a glimpse of the projected profit and loss statement to visualize the platforms financial performance for the next five years. The key components are total revenue from operations, gross profit, EBITDA, etc. The Sample Trugreen Business Plan Profit And Loss Account Statement Summary Of Revenue BP SS V is a compilation of the most recent design trends as a series of slides. It is suitable for any subject or industry presentation, containing attractive visuals and photo spots for businesses to clearly express their messages. This template contains a variety of slides for the user to input data, such as structures to contrast two elements, bullet points, and slides for written information. Slidegeeks is prepared to create an impression. The slides provide a glimpse of the projected profit and loss statement to visualize the platforms financial performance for the next five years. The key components are total revenue from operations, gross profit, EBITDA, etc.
Food Processing Business Profile Company Product Analysis With Revenue Growth Icons Pdf
This slide highlights the Company Products Analysis with different segments which includes grooming, beauty care, home care and health care which showcases product revenue growth and return on assets. The Food Processing Business Profile Company Product Analysis With Revenue Growth Icons Pdf is a compilation of the most recent design trends as a series of slides. It is suitable for any subject or industry presentation, containing attractive visuals and photo spots for businesses to clearly express their messages. This template contains a variety of slides for the user to input data, such as structures to contrast two elements, bullet points, and slides for written information. Slidegeeks is prepared to create an impression. This slide highlights the Company Products Analysis with different segments which includes grooming, beauty care, home care and health care which showcases product revenue growth and return on assets.
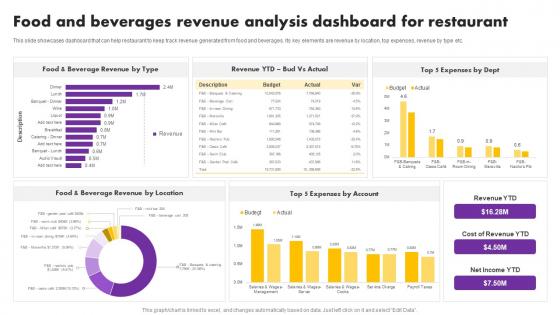
Digital And Traditional Marketing Methods Food And Beverages Revenue Analysis Themes Pdf
Find highly impressive Digital And Traditional Marketing Methods Food And Beverages Revenue Analysis Themes Pdf on Slidegeeks to deliver a meaningful presentation. You can save an ample amount of time using these presentation templates. No need to worry to prepare everything from scratch because Slidegeeks experts have already done a huge research and work for you. You need to download Digital And Traditional Marketing Methods Food And Beverages Revenue Analysis Themes Pdf for your upcoming presentation. All the presentation templates are 100 percent editable and you can change the color and personalize the content accordingly. Download now Our Digital And Traditional Marketing Methods Food And Beverages Revenue Analysis Themes Pdf are topically designed to provide an attractive backdrop to any subject. Use them to look like a presentation pro.

Elevating Sales Networks Impact 1 Increase In Annual Sales Revenue SA SS V
This slide showcases an increase in business sales revenue compared to the previous year due to effective sales networking strategy implementation. Welcome to our selection of the Elevating Sales Networks Impact 1 Increase In Annual Sales Revenue SA SS V. These are designed to help you showcase your creativity and bring your sphere to life. Planning and Innovation are essential for any business that is just starting out. This collection contains the designs that you need for your everyday presentations. All of our PowerPoints are 100Percent editable, so you can customize them to suit your needs. This multi-purpose template can be used in various situations. Grab these presentation templates today. This slide showcases an increase in business sales revenue compared to the previous year due to effective sales networking strategy implementation.
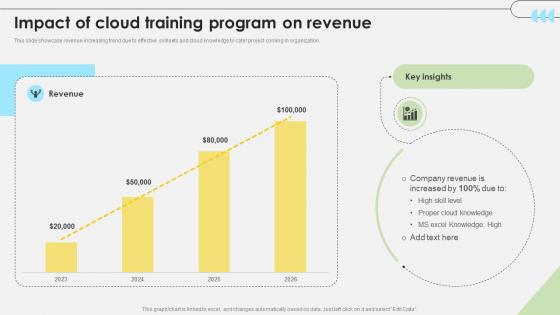
Workforce Competency Enhancement Impact Of Cloud Training Program On Revenue DTE SS V
This slide showcase revenue increasing trend due to effective skillsets and cloud knowledge to cater project coming in organization. Coming up with a presentation necessitates that the majority of the effort goes into the content and the message you intend to convey. The visuals of a PowerPoint presentation can only be effective if it supplements and supports the story that is being told. Keeping this in mind our experts created Workforce Competency Enhancement Impact Of Cloud Training Program On Revenue DTE SS V to reduce the time that goes into designing the presentation. This way, you can concentrate on the message while our designers take care of providing you with the right template for the situation. This slide showcase revenue increasing trend due to effective skillsets and cloud knowledge to cater project coming in organization.
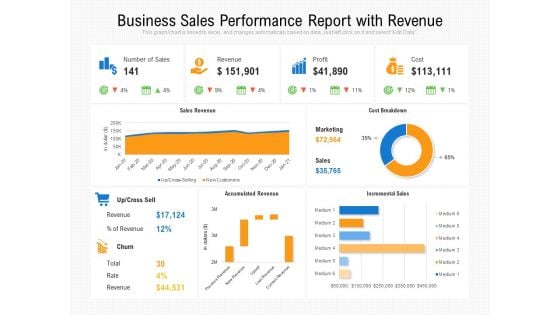
Business Sales Performance Report With Revenue Ppt PowerPoint Presentation Layouts Information PDF
Presenting this set of slides with name business sales performance report with revenue ppt powerpoint presentation layouts information pdf. The topics discussed in these slides are number of sales, revenue, profit, cost, accumulated revenue, incremental sales, sales revenue, churn. This is a completely editable PowerPoint presentation and is available for immediate download. Download now and impress your audience.
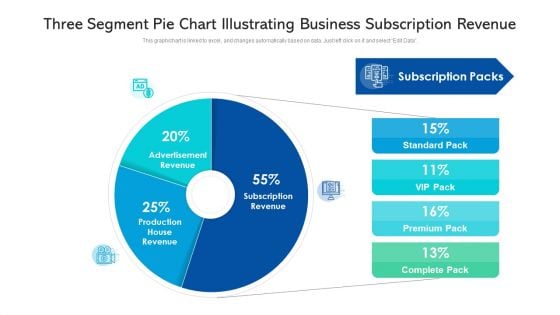
Three Segment Pie Chart Illustrating Business Subscription Revenue Ppt PowerPoint Presentation File Slideshow PDF
Showcasing this set of slides titled three segment pie chart illustrating business subscription revenue ppt powerpoint presentation file slideshow pdf. The topics addressed in these templates are advertisement revenue, production house revenue, subscription revenue. All the content presented in this PPT design is completely editable. Download it and make adjustments in color, background, font etc. as per your unique business setting.


 Continue with Email

 Home
Home


