Revenue Graph
Investment Portfolio Advantages Graph Icon Rules PDF
Presenting Investment Portfolio Advantages Graph Icon Rules PDF to dispense important information. This template comprises three stages. It also presents valuable insights into the topics including Investment Portfolio, Advantages Graph Icon. This is a completely customizable PowerPoint theme that can be put to use immediately. So, download it and address the topic impactfully.
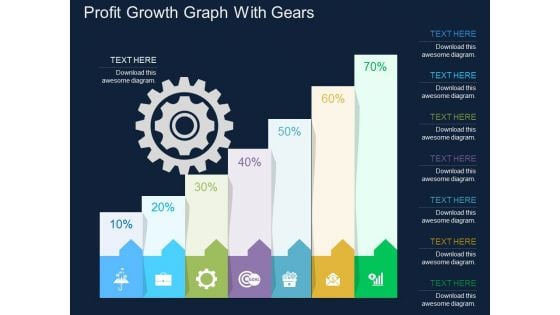
Profit Growth Graph With Gears Powerpoint Template
This business slide contains profit growth graph with gears. This PowerPoint template helps to display outline of business plan. Use this diagram to impart more clarity to data and to create more sound impact on viewers.
Business People Vector Templates Download Graph PowerPoint
We present our business people vector templates download graph PowerPoint.Download our Computer PowerPoint Templates because You have the co-ordinates for your destination of success. Let our PowerPoint Templates and Slides map out your journey. Download and present our Business PowerPoint Templates because Our PowerPoint Templates and Slides will give good value for money. They also have respect for the value of your time. Use our People PowerPoint Templates because Watching this your Audience will Grab their eyeballs, they wont even blink. Use our Technology PowerPoint Templates because You canTake a leap off the starting blocks with our PowerPoint Templates and Slides. They will put you ahead of the competition in quick time. Use our Circle Charts PowerPoint Templates because They will Put your wonderful verbal artistry on display. Our PowerPoint Templates and Slides will provide you the necessary glam and glitter.Use these PowerPoint slides for presentations relating to 3d, abstract, action, background, business, businessman, career, carpet, cartoon,challenge, color, communication, company, competition, concept, corporate,design, finance, graph, graphic,growth, high, human, idea, illustration,individual, isolated, leader, man, motion, occupation, organization, people, person,red, render, shape, stair, step, success, symbol, top, up, white, winner, work,workforce. The prominent colors used in the PowerPoint template are Pink, Green, Yellow. Our Business People Vector Templates Download Graph PowerPoint put in an earnest attempt. They put in hard hours to assist you.
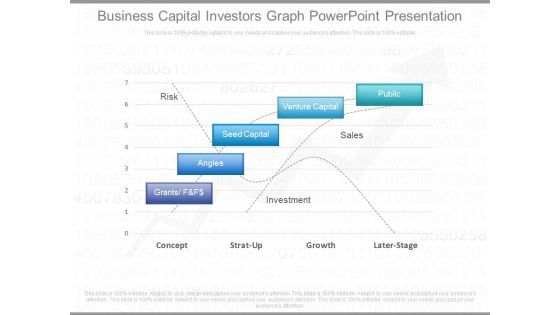
Business Capital Investors Graph Powerpoint Presentation
This is a business capital investors graph powerpoint presentation. This is a five stage process. The stages in this process are public, venture capital, seed capital, angles, grants f and f$.
Bar Graph With Five Icons Powerpoint Slides
This PowerPoint slide contains diagram bar graph with icons. This PPT slide helps to exhibit concepts of financial deal and planning. Use this business slide to make impressive presentations.
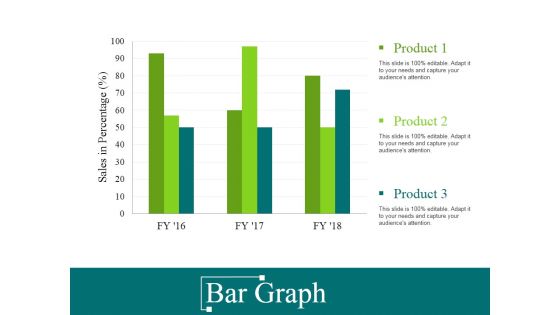
Bar Graph Ppt PowerPoint Presentation Gallery Grid
This is a bar graph ppt powerpoint presentation gallery grid. This is a three stage process. The stages in this process are sales in percentage, product, finance, business, marketing.
Statistics Graph Business PowerPoint Presentation Slides F
Microsoft Powerpoint Slides and Backgrounds with business statistics in white with a green arrow Double your growth with our Statistics Graph Business PowerPoint Presentation Slides F. Download without worries with our money back guaranteee.
Statistics Graph Business PowerPoint Presentation Slides R
Microsoft Powerpoint Slides and Backgrounds with business statistics in white with a green arrow Motivate teams with our Statistics Graph Business PowerPoint Presentation Slides R. Download without worries with our money back guaranteee.
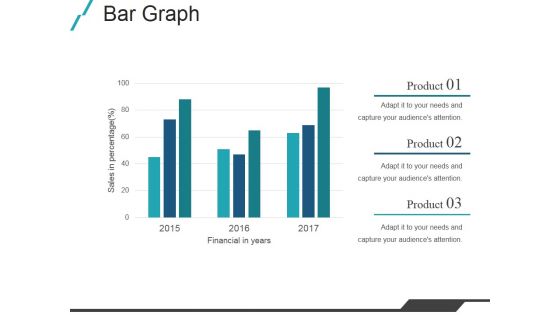
Bar Graph Ppt PowerPoint Presentation Slides Deck
This is a bar graph ppt powerpoint presentation slides deck. This is a three stage process. The stages in this process are financial in years, product, sales in percentage.
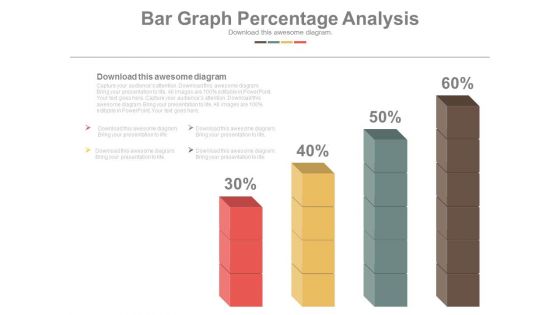
Bar Graph Displaying Profit Growth Powerpoint Slides
This PowerPoint template has been designed with six point?s bar graph with icons. This PPT slide can be used to prepare presentations for marketing reports and also for financial data analysis. You can download finance PowerPoint template to prepare awesome presentations.
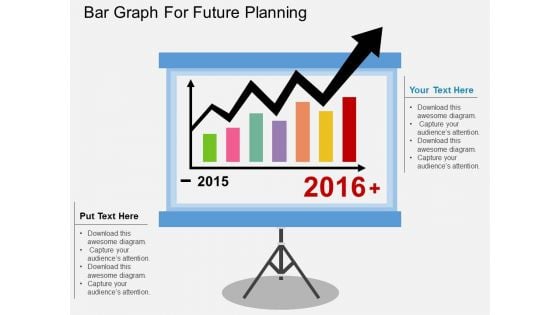
Bar Graph For Future Planning Powerpoint Template
This business diagram display bar graph for years 2015 and 2016. You may use this slide to display statistical analysis. This diagram provides an effective way of displaying information you can edit text, color, shade and style as per you need.
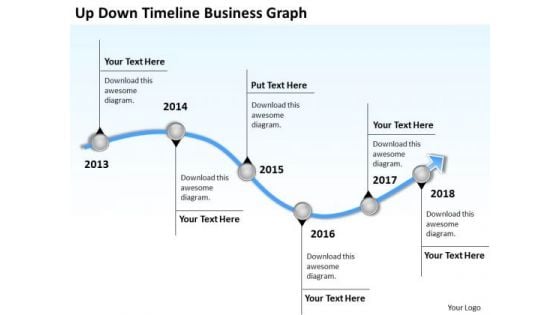
Business Analysis Diagrams PowerPoint Presentations Graph Templates
We present our business analysis diagrams powerpoint presentations graph templates.Download and present our Curves and Lines PowerPoint Templates because Your audience will believe you are the cats whiskers. Present our Business PowerPoint Templates because Our PowerPoint Templates and Slides will effectively help you save your valuable time. They are readymade to fit into any presentation structure. Present our Business PowerPoint Templates because Our PowerPoint Templates and Slides will give good value for money. They also have respect for the value of your time. Use our Arrows PowerPoint Templates because It will get your audience in sync. Present our Process and Flows PowerPoint Templates because It can Conjure up grand ideas with our magical PowerPoint Templates and Slides. Leave everyone awestruck by the end of your presentation.Use these PowerPoint slides for presentations relating to 3d, account, accounting, annual, balance, business, chart, commerce, crisis, data,earnings, economics, economy, exchange, figures, finance, financial, graph,graphic, growth, illustration, index, information, investment, list, line,management,market, marketing, money, monitoring, numbers, office, paperwork, plan, price,printout, report, research, sale, statistical, statistics, stock, success, tax, trade,work. The prominent colors used in the PowerPoint template are Blue light, Gray, White. Examine the causes with our Business Analysis Diagrams PowerPoint Presentations Graph Templates. Let everyone know what's behind it all.
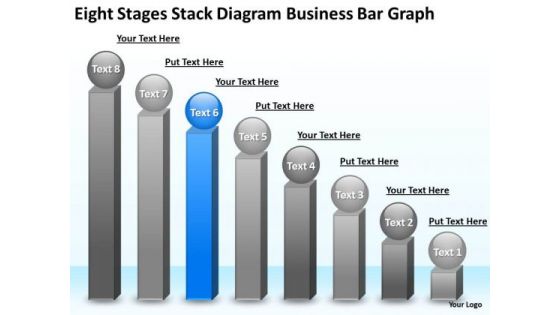
Business PowerPoint Presentations Bar Graph Plan Slides
We present our business powerpoint presentations bar graph plan Slides.Present our Business PowerPoint Templates because It will Raise the bar of your Thoughts. They are programmed to take you to the next level. Download our Spheres PowerPoint Templates because You can Channelise the thoughts of your team with our PowerPoint Templates and Slides. Urge them to focus on the goals you have set. Download our Competition PowerPoint Templates because Our PowerPoint Templates and Slides will let you Leave a lasting impression to your audiences. They possess an inherent longstanding recall factor. Present our Shapes PowerPoint Templates because It will get your audience in sync. Use our Success PowerPoint Templates because Our PowerPoint Templates and Slides will let you Leave a lasting impression to your audiences. They possess an inherent longstanding recall factor.Use these PowerPoint slides for presentations relating to bar, graph, statistics, economy, render, success, representation, diagram, graphic, achievment, obstruction, chevron, accounting, finances, energy eco, steps, figure, tall, barrier, strategy, ladder, up, planning, high, climb, stripes, growth, maintenance, profit, successful, repair, return, gradient, sustainability, financial, construction, upwards, increasing. The prominent colors used in the PowerPoint template are Blue, Gray, White. Get fab and cool with our Business PowerPoint Presentations Bar Graph Plan Slides. Be the trendsetter with your thoughts.
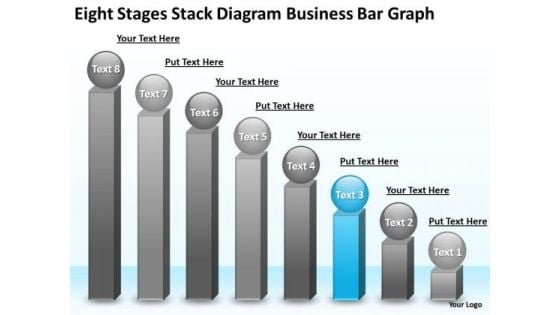
PowerPoint Presentations Bar Graph Business Plan Templates
We present our powerpoint presentations bar graph business plan templates.Use our Finance PowerPoint Templates because Our PowerPoint Templates and Slides are created by a hardworking bunch of busybees. Always flitting around with solutions gauranteed to please. Download our Leadership PowerPoint Templates because Our PowerPoint Templates and Slides are endowed to endure. Ideas conveyed through them will pass the test of time. Use our Business PowerPoint Templates because Your ideas provide food for thought. Our PowerPoint Templates and Slides will help you create a dish to tickle the most discerning palate. Use our Success PowerPoint Templates because Our PowerPoint Templates and Slides will provide you a launch platform. Give a lift off to your ideas and send them into orbit. Use our Spheres PowerPoint Templates because You can Bait your audience with our PowerPoint Templates and Slides. They will bite the hook of your ideas in large numbers.Use these PowerPoint slides for presentations relating to Concepts, Leadership, Success, Human, Achievement, Wink, Business, Ball, Three-Dimensional, Sign, Template, Diagram, Change, Character, Graphic, Stock, Development, Shape, Graph, Finances, Steps, Chart, Sphere, Examining, Up, Nice, Planning, Face, Growth, Person, Progress, Increases, Improvement, Image, Mimicry, Financial, Staircase. The prominent colors used in the PowerPoint template are Blue, Gray, Black. Clear the dust with our PowerPoint Presentations Bar Graph Business Plan Templates. Deliver your ideas in a clear environment.
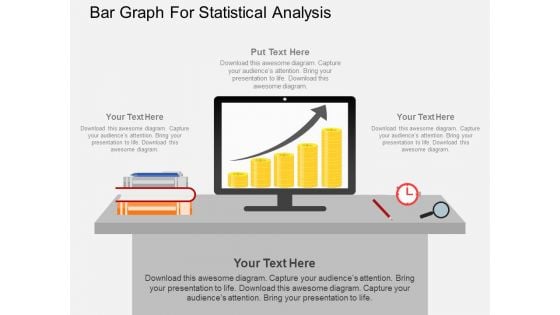
Bar Graph For Statistical Analysis Powerpoint Template
Our above PPT slide contains computer screen on a desk displaying bar graph. This PowerPoint template may be used to display statistical analysis. This template is designed to attract the attention of your audience.
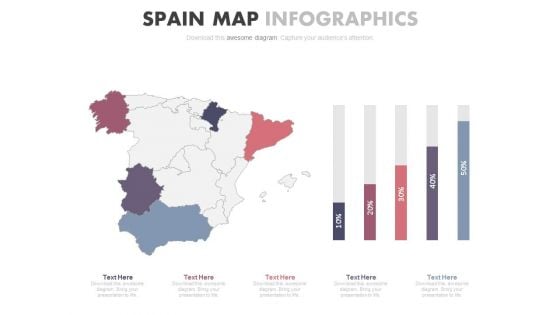
Spain Map With Growth Graph Powerpoint Slides
This PowerPoint template displays Spain map with growth graph. This PPT template can be used in business presentations to depict economic growth of country. This slide can also be used by school students for educational projects.
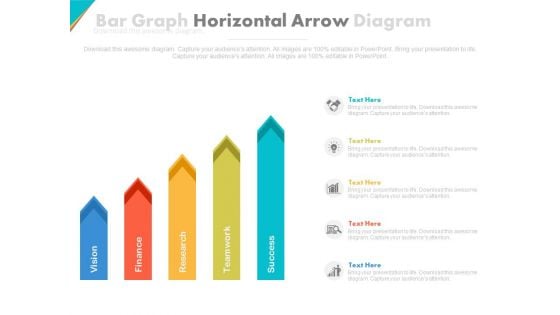
Five Horizontal Arrows Bar Graph Powerpoint Slides
This PowerPoint template contains five horizontal arrows bra graph. You may download this PPT slide design to display steps of strategic planning. You can easily customize this template to make it more unique as per your need.

Illustration Of Dollar Growth Graph PowerPoint Template
This business slide contains graphics of dollar symbols on graph. This diagram helps to portray concept of financial planning. Present your views using this innovative slide and be assured of leaving a lasting impression.
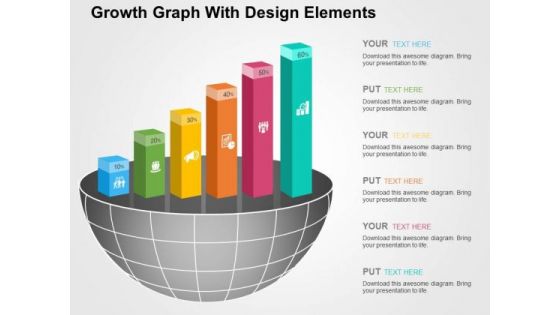
Growth Graph With Design Elements PowerPoint Templates
The above template displays growth bar graph. This PowerPoint template signifies the concept of business and financial planning. Adjust the above diagram in your business presentations to visually support your content.
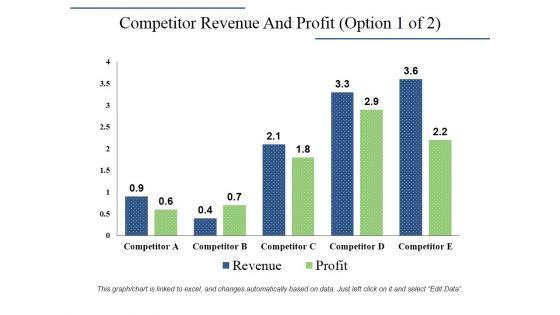
Competitor Revenue And Profit Template 1 Ppt PowerPoint Presentation Infographic Template Designs Download
This is a competitor revenue and profit template 1 ppt powerpoint presentation infographic template designs download. This is a five stage process. The stages in this process are revenue, profit, competitor, bar graph, growth.
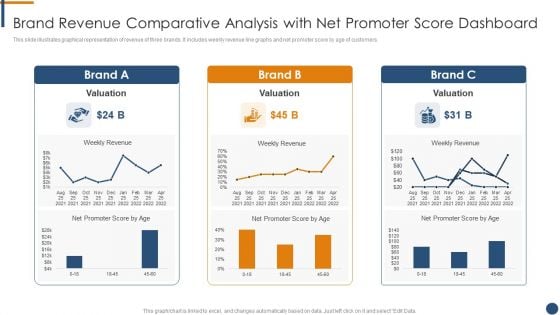
Brand Revenue Comparative Analysis With Net Promoter Score Dashboard Mockup PDF
This slide illustrates graphical representation of revenue of three brands. It includes weekly revenue line graphs and net promoter score by age of customers.Pitch your topic with ease and precision using this Brand Revenue Comparative Analysis With Net Promoter Score Dashboard Mockup PDF. This layout presents information on Brand Revenue Comparative Analysis With Net Promoter Score Dashboard. It is also available for immediate download and adjustment. So, changes can be made in the color, design, graphics or any other component to create a unique layout.
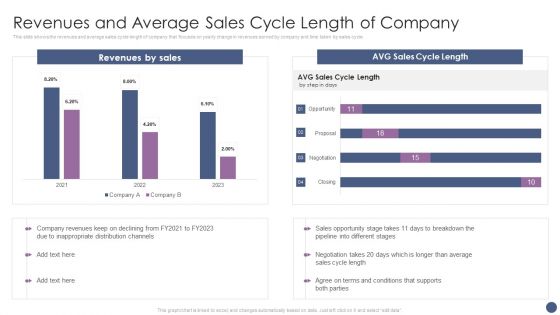
Competitive Sales Strategy Development Plan For Revenue Growth Revenues And Average Sales Ideas PDF
This slide shows the revenues and average sales cycle length of company that focuses on yearly change in revenues earned by company and time taken by sales cycle. Deliver an awe inspiring pitch with this creative Competitive Sales Strategy Development Plan For Revenue Growth Revenues And Average Sales Ideas PDF bundle. Topics like Revenues By Sales, Sales Opportunity can be discussed with this completely editable template. It is available for immediate download depending on the needs and requirements of the user.
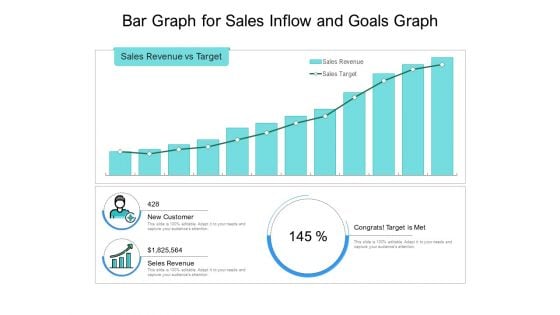
Bar Graph For Sales Inflow And Goals Graph Ppt PowerPoint Presentation Infographics Visual Aids PDF
Pitch your topic with ease and precision using this bar graph for sales inflow and goals graph ppt powerpoint presentation infographics visual aids pdf. This layout presents information on sales revenue vs target, new customer, congrats target is met. It is also available for immediate download and adjustment. So, changes can be made in the color, design, graphics or any other component to create a unique layout.
Outstanding Employee Companys Revenue Per Employee RPE Ppt Icon Example PDF
The purpose of this slide is to provide a graph wherein revenue per employee is calculated by dividing a companys revenue by its total number of employees leading to low productivity in the organization. Deliver an awe-inspiring pitch with this creative outstanding employee companys revenue per employee rpe ppt icon example pdf bundle. Topics like companys revenue per employee can be discussed with this completely editable template. It is available for immediate download depending on the needs and requirements of the user.
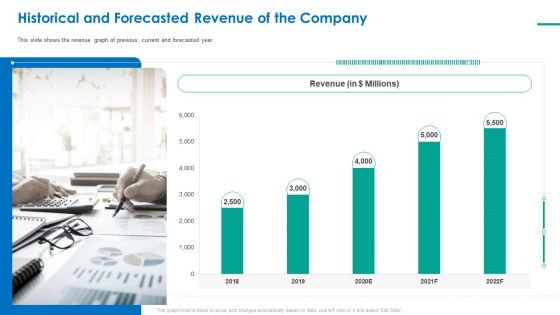
Investor Pitch Deck For Short Term Bridge Loan Historical And Forecasted Revenue Of The Company Ppt PowerPoint Slide PDF
This slide shows the revenue graph of previous, current and forecasted year.Deliver an awe-inspiring pitch with this creative investor pitch deck for short term bridge loan historical and forecasted revenue of the company ppt powerpoint slide pdf bundle. Topics like historical and forecasted revenue of the company can be discussed with this completely editable template. It is available for immediate download depending on the needs and requirements of the user.
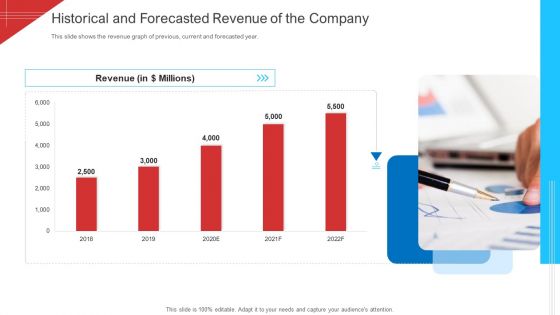
Investor Deck To Arrange Funds From Short Term Loan Historical And Forecasted Revenue Of The Company Guidelines PDF
This slide shows the revenue graph of previous, current and forecasted year. Deliver and pitch your topic in the best possible manner with this investor deck to arrange funds from short term loan historical and forecasted revenue of the company guidelines pdf. Use them to share invaluable insights on historical and forecasted revenue of the company and impress your audience. This template can be altered and modified as per your expectations. So, grab it now.
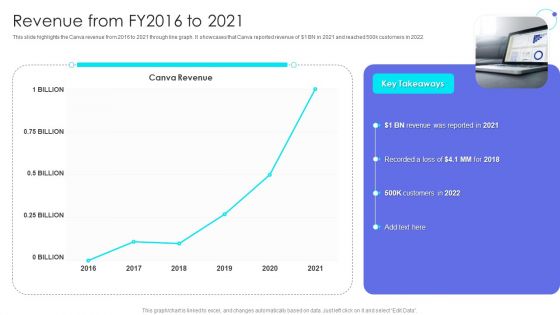
Canva Pro Business Profile Revenue From Fy2016 To 2021 Sample PDF
This slide highlights the Canva revenue from 2016 to 2021 through line graph. It showcases that Canva reported revenue of doller 1 BN in 2021 and reached 500k customers in 2022. Deliver an awe inspiring pitch with this creative Canva Pro Business Profile Revenue From Fy2016 To 2021 Sample PDF bundle. Topics like Customers, Revenue can be discussed with this completely editable template. It is available for immediate download depending on the needs and requirements of the user.
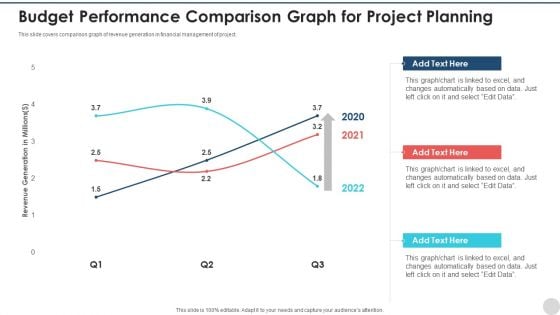
Budget Performance Comparison Graph For Project Planning Pictures PDF
This slide covers comparison graph of revenue generation in financial management of project. Showcasing this set of slides titled budget performance comparison graph for project planning pictures pdf. The topics addressed in these templates are budget performance comparison graph for project planning. All the content presented in this PPT design is completely editable. Download it and make adjustments in color, background, font etc. as per your unique business setting.
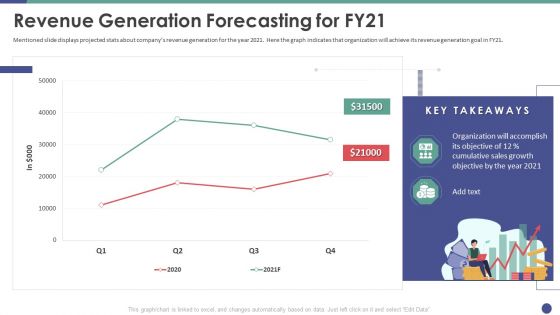
QC Engineering Revenue Generation Forecasting For FY21 Ppt Layouts Show PDF
Mentioned slide displays projected stats about companys revenue generation for the year 2021. Here the graph indicates that organization will achieve its revenue generation goal in FY21. Deliver and pitch your topic in the best possible manner with this qc engineering revenue generation forecasting for fy21 ppt layouts show pdf. Use them to share invaluable insights on organization, cumulative, sales, growth, objective and impress your audience. This template can be altered and modified as per your expectations. So, grab it now.
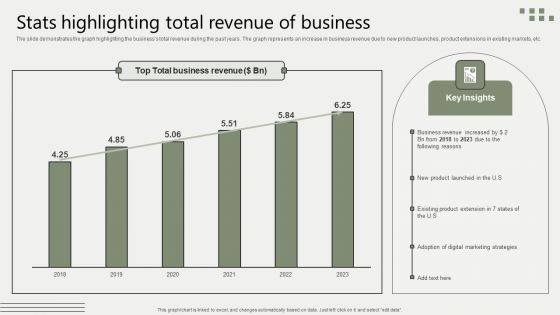
Global Business Market Development Guide Stats Highlighting Total Revenue Of Business Portrait PDF
The slide demonstrates the graph highlighting the businesss total revenue during the past years. The graph represents an increase in business revenue due to new product launches, product extensions in existing markets, etc. This modern and well arranged Global Business Market Development Guide Stats Highlighting Total Revenue Of Business Portrait PDF provides lots of creative possibilities. It is very simple to customize and edit with the Powerpoint Software. Just drag and drop your pictures into the shapes. All facets of this template can be edited with Powerpoint no extra software is necessary. Add your own material, put your images in the places assigned for them, adjust the colors, and then you can show your slides to the world, with an animated slide included.
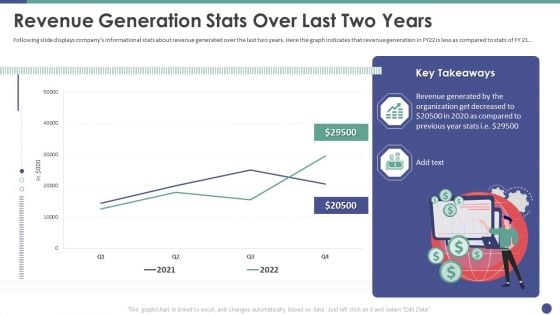
QC Engineering Revenue Generation Stats Over Last Two Years Ppt Portfolio Graphics Tutorials PDF
Following slide displays companys informational stats about revenue generated over the last two years. Here the graph indicates that revenue generation in FY22 is less as compared to stats of FY21. Deliver an awe inspiring pitch with this creative qc engineering revenue generation stats over last two years ppt portfolio graphics tutorials pdf bundle. Topics like revenue generation stats over last two years can be discussed with this completely editable template. It is available for immediate download depending on the needs and requirements of the user.
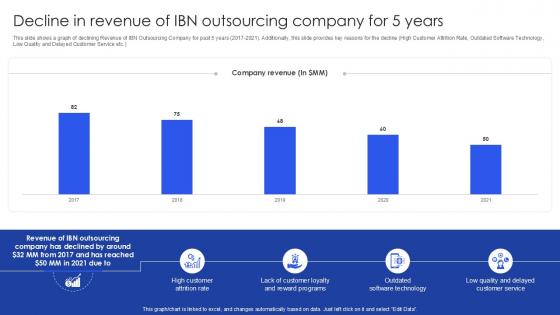
Decline In Revenue Of IBN Outsourcing Company For 5 Years PPT Example SS
This slide shows a graph of declining Revenue of IBN Outsourcing Company for past 5 years 2017-2021. Additionally, this slide provides key reasons for the decline High Customer Attrition Rate, Outdated Software Technology, Low Quality and Delayed Customer Service etc. From laying roadmaps to briefing everything in detail, our templates are perfect for you. You can set the stage with your presentation slides. All you have to do is download these easy-to-edit and customizable templates. Decline In Revenue Of IBN Outsourcing Company For 5 Years PPT Example SS will help you deliver an outstanding performance that everyone would remember and praise you for. Do download this presentation today. This slide shows a graph of declining Revenue of IBN Outsourcing Company for past 5 years 2017-2021. Additionally, this slide provides key reasons for the decline High Customer Attrition Rate, Outdated Software Technology, Low Quality and Delayed Customer Service etc.
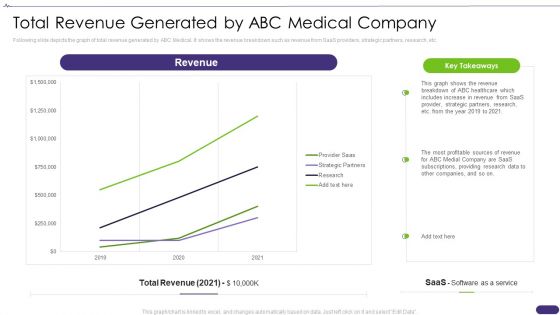
Pitch Deck For Healthcare Application Total Revenue Generated By Abc Medical Company Demonstration PDF
Following slide depicts the graph of total revenue generated by ABC Medical. It shows the revenue breakdown such as revenue from SaaS providers, strategic partners, research, etc. Deliver an awe inspiring pitch with this creative Pitch Deck For Healthcare Application Total Revenue Generated By Abc Medical Company Demonstration PDF bundle. Topics like Revenue, Generated, Medical Company can be discussed with this completely editable template. It is available for immediate download depending on the needs and requirements of the user.
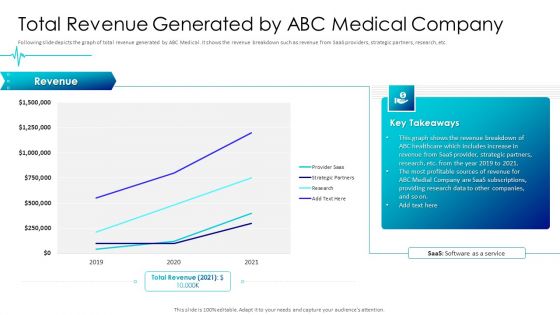
Digital Healthcare Applications Total Revenue Generated By Abc Medical Company Pictures PDF
Following slide depicts the graph of total revenue generated by ABC Medical. It shows the revenue breakdown such as revenue from SaaS providers, strategic partners, research, etc. Deliver an awe inspiring pitch with this creative Digital Healthcare Applications Total Revenue Generated By Abc Medical Company Pictures PDF bundle. Topics like Revenue, Includes Increase, Providing Research Data can be discussed with this completely editable template. It is available for immediate download depending on the needs and requirements of the user.
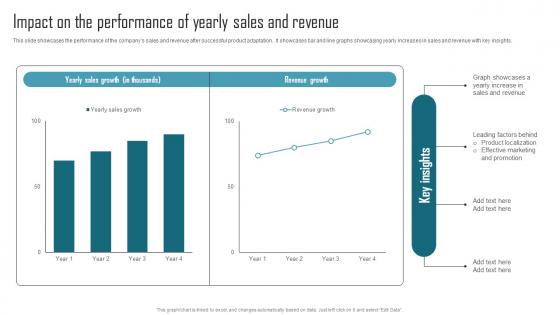
Effective Product Adaptation Impact On The Performance Of Yearly Sales And Revenue Introduction PDF
This slide showcases the performance of the companys sales and revenue after successful product adaptation.. It showcases bar and line graphs showcasing yearly increases in sales and revenue with key insights. Retrieve professionally designed Effective Product Adaptation Impact On The Performance Of Yearly Sales And Revenue Introduction PDF to effectively convey your message and captivate your listeners. Save time by selecting pre-made slideshows that are appropriate for various topics, from business to educational purposes. These themes come in many different styles, from creative to corporate, and all of them are easily adjustable and can be edited quickly. Access them as PowerPoint templates or as Google Slides themes. You do not have to go on a hunt for the perfect presentation because Slidegeeks got you covered from everywhere. This slide showcases the performance of the companys sales and revenue after successful product adaptation.. It showcases bar and line graphs showcasing yearly increases in sales and revenue with key insights.
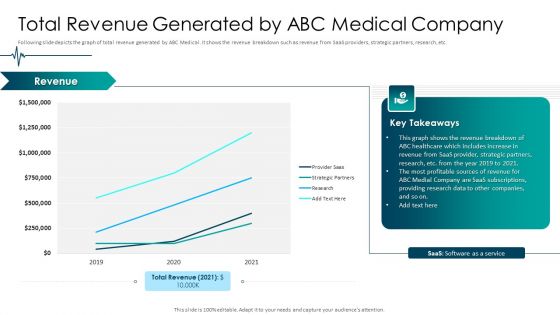
Medical Care Total Revenue Generated By ABC Medical Company Structure PDF
Following slide depicts the graph of total revenue generated by ABC Medical. It shows the revenue breakdown such as revenue from SaaS providers, strategic partners, research, etc. Deliver an awe inspiring pitch with this creative medical care total revenue generated by abc medical company structure pdf bundle. Topics like software, service can be discussed with this completely editable template. It is available for immediate download depending on the needs and requirements of the user.
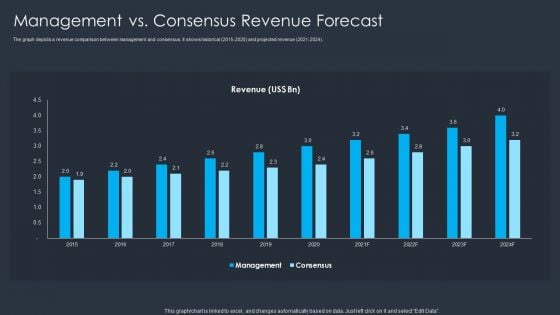
Merger And Acquisition Buying Strategy For Business Growth Management Vs Consensus Revenue Forecast Designs PDF
The graph depicts a revenue comparison between management and consensus. It shows historical 2015 to 2020 and projected revenue 2021 to 2024. Deliver and pitch your topic in the best possible manner with this Merger And Acquisition Buying Strategy For Business Growth Management Vs Consensus Revenue Forecast Designs PDF. Use them to share invaluable insights on Management, Consensus Revenue Forecast and impress your audience. This template can be altered and modified as per your expectations. So, grab it now.
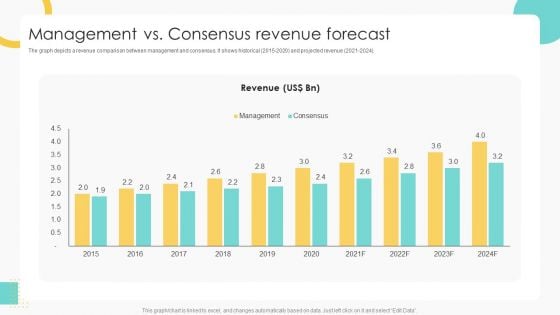
Buy Side Merger And Acquisition Pitch Book Management Vs Consensus Revenue Forecast Brochure PDF
The graph depicts a revenue comparison between management and consensus. It shows historical 2015 2020 and projected revenue 2021 2024. Deliver and pitch your topic in the best possible manner with this Buy Side Merger And Acquisition Pitch Book Management Vs Consensus Revenue Forecast Brochure PDF. Use them to share invaluable insights on Management, Consensus Revenue Forecast and impress your audience. This template can be altered and modified as per your expectations. So, grab it now.
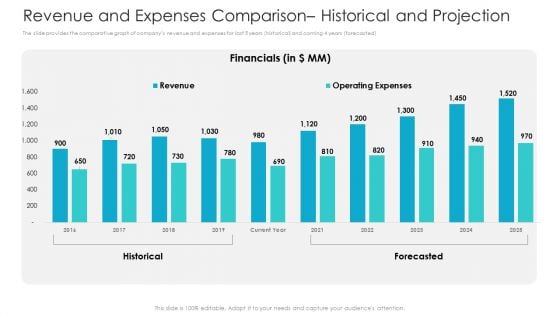
Private Equity Fundraising Pitch Deck Revenue And Expenses Comparison Historical And Projection Clipart PDF
The slide provides the comparative graph of companys revenue and expenses for last 5 years historical and coming 4 years forecasted. Deliver and pitch your topic in the best possible manner with this private equity fundraising pitch deck revenue and expenses comparison historical and projection clipart pdf. Use them to share invaluable insights on financials, revenue, operating expenses, 2016 to 2025 and impress your audience. This template can be altered and modified as per your expectations. So, grab it now.
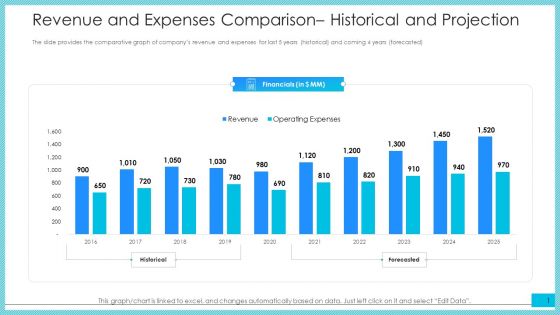
Revenue And Expenses Comparison Historical And Projection Ppt Summary Example Introduction PDF
The slide provides the comparative graph of companys revenue and expenses for last 5 years historical and coming 4 years forecasted.Deliver and pitch your topic in the best possible manner with this revenue and expenses comparison historical and projection ppt summary example introduction pdf. Use them to share invaluable insights on financials, 2016 to 2025, revenue, operating expenses and impress your audience. This template can be altered and modified as per your expectations. So, grab it now.
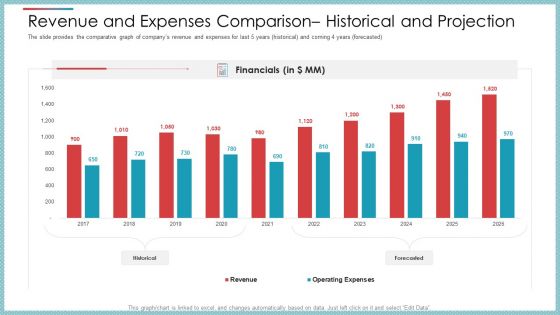
Revenue And Expenses Comparison Historical And Projection Ppt Styles Graphics Design PDF
The slide provides the comparative graph of companys revenue and expenses for last 5 years historical and coming 4 years forecasted.Deliver an awe-inspiring pitch with this creative revenue and expenses comparison historical and projection ppt styles graphics design pdf. bundle. Topics like financials, 2016 to 2025, revenue, operating expenses can be discussed with this completely editable template. It is available for immediate download depending on the needs and requirements of the user.
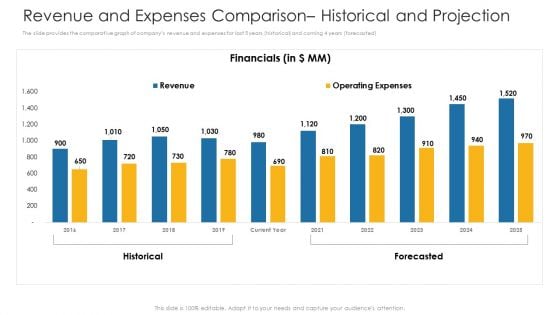
Revenue And Expenses Comparison Historical And Projection Ppt Show Slide Download PDF
The slide provides the comparative graph of companys revenue and expenses for last 5 years historical and coming 4 years forecasted.Deliver and pitch your topic in the best possible manner with this revenue and expenses comparison historical and projection ppt show slide download pdf. Use them to share invaluable insights on financials, 2016 to 2025, revenue, operating expenses and impress your audience. This template can be altered and modified as per your expectations. So, grab it now.
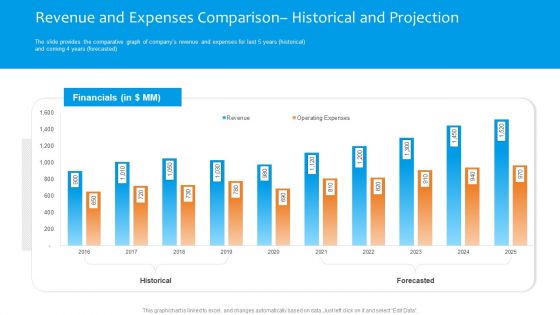
Funding Pitch To Raise Funds From PE Revenue And Expenses Comparison Historical And Projection Summary PDF
The slide provides the comparative graph of companys revenue and expenses for last 5 years historical and coming 4 years forecasted. Deliver an awe inspiring pitch with this creative funding pitch to raise funds from pe revenue and expenses comparison historical and projection summary pdf bundle. Topics like financials, historical, forecasted, revenue, expenses can be discussed with this completely editable template. It is available for immediate download depending on the needs and requirements of the user.
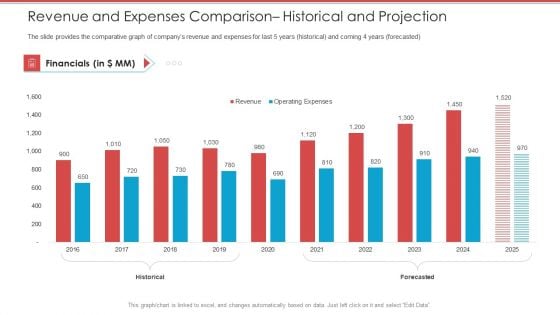
Cash Market Investor Deck Revenue And Expenses Comparison Historical And Projection Ppt Professional Information PDF
The slide provides the comparative graph of companys revenue and expenses for last 5 years historical and coming 4 years forecasted. Deliver and pitch your topic in the best possible manner with this cash market investor deck revenue and expenses comparison historical and projection ppt professional information pdf. Use them to share invaluable insights on financials, revenue, operating expenses, 2016 to 2025 and impress your audience. This template can be altered and modified as per your expectations. So, grab it now.
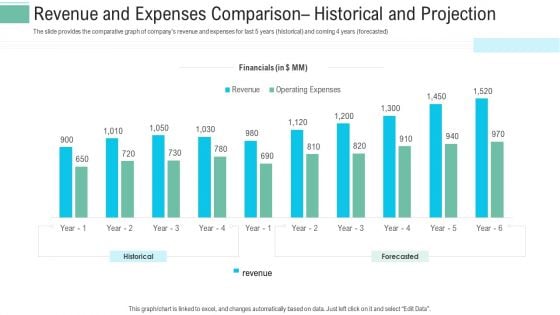
Revenue And Expenses Comparison Historical And Projection Ppt Layouts Grid PDF
The slide provides the comparative graph of companys revenue and expenses for last 5 years historical and coming 4 years forecasted. Deliver and pitch your topic in the best possible manner with this revenue and expenses comparison historical and projection ppt layouts grid pdf. Use them to share invaluable insights on financials, operating expenses, revenue and impress your audience. This template can be altered and modified as per your expectations. So, grab it now.
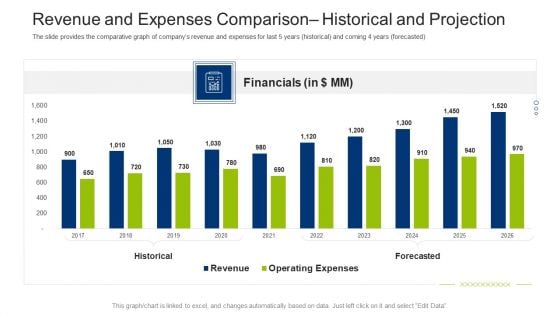
Investment Fundraising Pitch Deck From Stock Market Revenue And Expenses Comparison Historical And Projection Infographics PDF
The slide provides the comparative graph of companys revenue and expenses for last 5 years historical and coming 4 years forecasted. Deliver an awe inspiring pitch with this creative investment fundraising pitch deck from stock market revenue and expenses comparison historical and projection infographics pdf bundle. Topics like financials, historical, forecasted, revenue, expenses can be discussed with this completely editable template. It is available for immediate download depending on the needs and requirements of the user.
Revenue And Expenses Comparison Historical And Projection Ppt Icon Files PDF
The slide provides the comparative graph of companys revenue and expenses for last 5 years historical and coming 4 years forecasted.Deliver and pitch your topic in the best possible manner with this revenue and expenses comparison historical and projection ppt icon files pdf. Use them to share invaluable insights on financials, 2016 to 2025, revenue, operating expenses and impress your audience. This template can be altered and modified as per your expectations. So, grab it now.
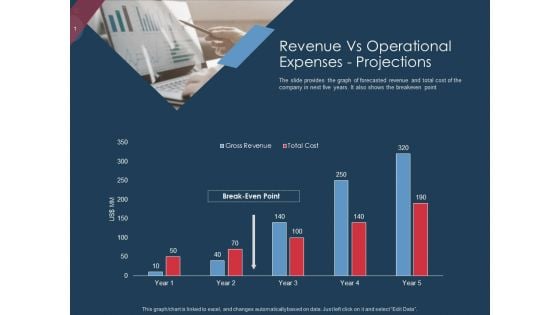
Pitch Deck To Gather Funding From Initial Capital Revenue Vs Operational Expenses Projections Introduction PDF
The slide provides the graph of forecasted revenue and total cost of the company in next five years. It also shows the breakeven point. Deliver and pitch your topic in the best possible manner with this pitch deck to gather funding from initial capital revenue vs operational expenses projections introduction pdf. Use them to share invaluable insights on revenue vs operational expenses projections and impress your audience. This template can be altered and modified as per your expectations. So, grab it now.
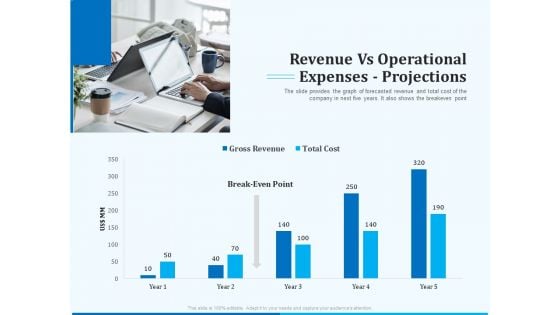
Pitch Deck For Seed Financing Revenue Vs Operational Expenses Projections Ppt Show Outline PDF
The slide provides the graph of forecasted revenue and total cost of the company in next five years. It also shows the breakeven point. Deliver and pitch your topic in the best possible manner with this pitch deck for seed financing revenue vs operational expenses projections ppt show outline pdf. Use them to share invaluable insights on revenue vs operational expenses projections and impress your audience. This template can be altered and modified as per your expectations. So, grab it now.
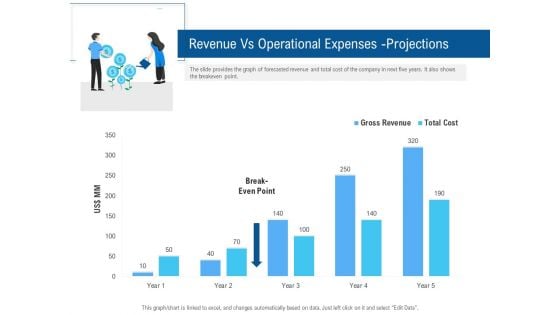
Pitch Deck To Collect Funding From Initial Financing Revenue Vs Operational Expenses Projections Formats PDF
The slide provides the graph of forecasted revenue and total cost of the company in next five years. It also shows the breakeven point. Deliver and pitch your topic in the best possible manner with this pitch deck to collect funding from initial financing revenue vs operational expenses projections formats pdf. Use them to share invaluable insights on revenue vs operational expenses projections and impress your audience. This template can be altered and modified as per your expectations. So, grab it now.
Pre Seed Funding Pitch Deck Revenue Vs Operational Expenses Projections Ppt Icon Pictures PDF
The slide provides the graph of forecasted revenue and total cost of the company in next five years. It also shows the breakeven point. Deliver and pitch your topic in the best possible manner with this pre seed funding pitch deck revenue vs operational expenses projections ppt icon pictures pdf. Use them to share invaluable insights on revenue vs operational expenses projections and impress your audience. This template can be altered and modified as per your expectations. So, grab it now.
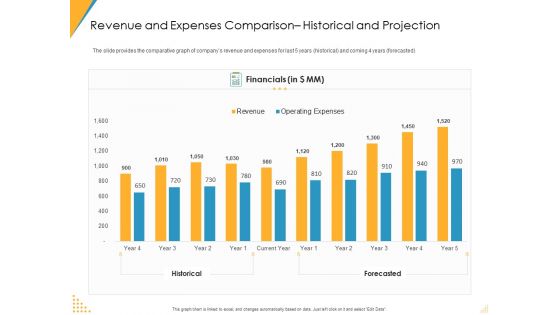
Revenue And Expenses Comparison Historical And Projection Ppt Ideas Slide Download PDF
The slide provides the comparative graph of companys revenue and expenses for last 5 years historical and coming 4 years forecasted. Deliver an awe-inspiring pitch with this creative revenue and expenses comparison historical and projection ppt ideas slide download pdf bundle. Topics like revenue, operating expenses, historical, forecasted can be discussed with this completely editable template. It is available for immediate download depending on the needs and requirements of the user.
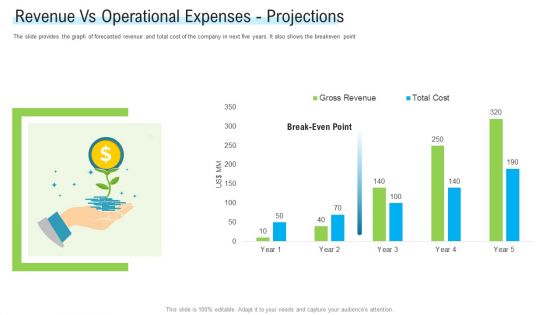
Angel Investor For Seed Pitch Deck Revenue Vs Operational Expenses Projections Microsoft PDF
The slide provides the graph of forecasted revenue and total cost of the company in next five years. It also shows the breakeven point. Deliver an awe inspiring pitch with this creative angel investor for seed pitch deck revenue vs operational expenses projections microsoft pdf bundle. Topics like revenue vs operational expenses projections can be discussed with this completely editable template. It is available for immediate download depending on the needs and requirements of the user.
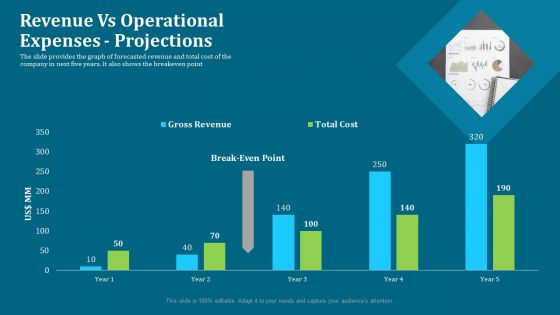
Seed Funding Pitch Deck Revenue Vs Operational Expenses Projections Designs PDF
The slide provides the graph of forecasted revenue and total cost of the company in next five years. It also shows the breakeven point. Deliver and pitch your topic in the best possible manner with this seed funding pitch deck revenue vs operational expenses projections designs pdf. Use them to share invaluable insights on gross revenue, total cost and impress your audience. This template can be altered and modified as per your expectations. So, grab it now.
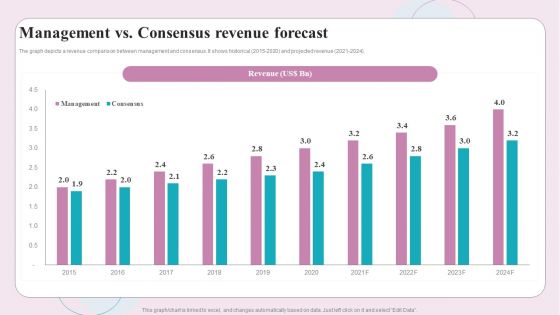
Buy Side M And A Service Management Vs Consensus Revenue Forecast Introduction PDF
The graph depicts a revenue comparison between management and consensus. It shows historical 2015 to 2020 and projected revenue 2021 to 2024. There are so many reasons you need a Buy Side M And A Service Management Vs Consensus Revenue Forecast Introduction PDF. The first reason is you can not spend time making everything from scratch, Thus, Slidegeeks has made presentation templates for you too. You can easily download these templates from our website easily.
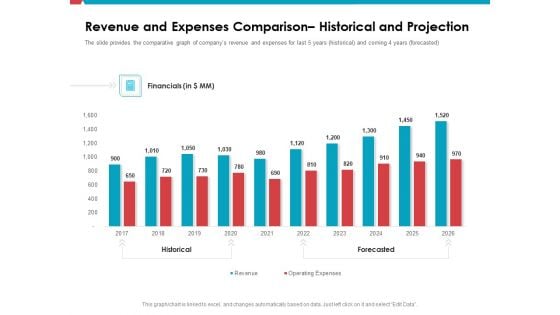
Revenue And Expenses Comparison Historical And Projection Ppt Show Format PDF
The slide provides the comparative graph of companys revenue and expenses for last 5 years historical and coming 4 years forecasted. Deliver an awe-inspiring pitch with this creative revenue and expenses comparison historical and projection ppt show format pdf bundle. Topics like historical, forecasted, financials can be discussed with this completely editable template. It is available for immediate download depending on the needs and requirements of the user.
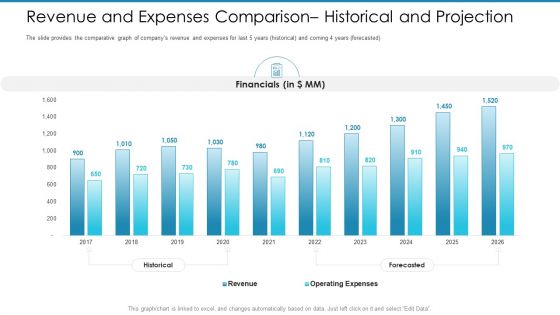
Post Initial Pubic Offering Market Pitch Deck Revenue And Expenses Comparison Historical And Projection Sample PDF
The slide provides the comparative graph of companys revenue and expenses for last 5 years historical and coming 4 years forecasted.Deliver an awe-inspiring pitch with this creative post initial pubic offering market pitch deck revenue and expenses comparison historical and projection sample pdf. bundle. Topics like financials, 2017 to 2026 can be discussed with this completely editable template. It is available for immediate download depending on the needs and requirements of the user.
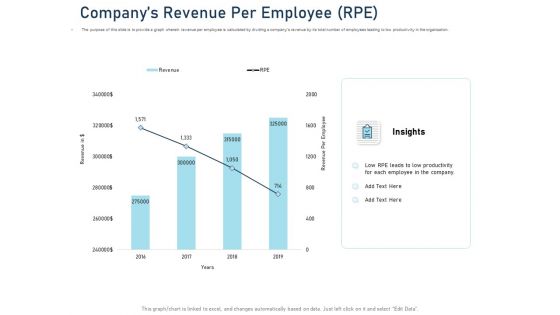
Employee Recognition Award Companys Revenue Per Employee Rpe Ppt PowerPoint Presentation Professional Influencers PDF
The purpose of this slide is to provide a graph wherein revenue per employee is calculated by dividing a companys revenue by its total number of employees leading to low productivity in the organization. Deliver and pitch your topic in the best possible manner with this employee recognition award companys revenue per employee rpe ppt powerpoint presentation professional influencers pdf. Use them to share invaluable insights on revenue per employee, employee, 2014 to 2019 and impress your audience. This template can be altered and modified as per your expectations. So, grab it now.
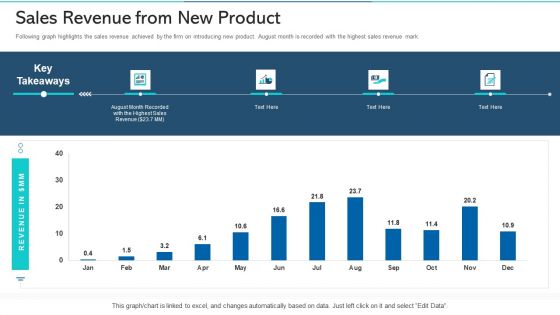
Refurbishing The Product Advertising Plan Sales Revenue From New Product Ppt Layout PDF
Following graph highlights the sales revenue achieved by the firm on introducing new product. August month is recorded with the highest sales revenue mark.Deliver and pitch your topic in the best possible manner with this refurbishing the product advertising plan sales revenue from new product ppt layout pdf. Use them to share invaluable insights on sales revenue from new product and impress your audience. This template can be altered and modified as per your expectations. So, grab it now.
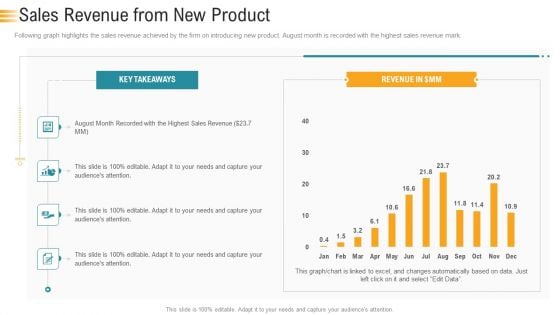
Establishing An Efficient Integrated Marketing Communication Process Sales Revenue From New Product Topics PDF
Following graph highlights the sales revenue achieved by the firm on introducing new product. August month is recorded with the highest sales revenue mark. Deliver and pitch your topic in the best possible manner with this establishing an efficient integrated marketing communication process sales revenue from new product topics pdf. Use them to share invaluable insights on sales revenue from new product and impress your audience. This template can be altered and modified as per your expectations. So, grab it now.


 Continue with Email

 Home
Home


