Sales Analytics
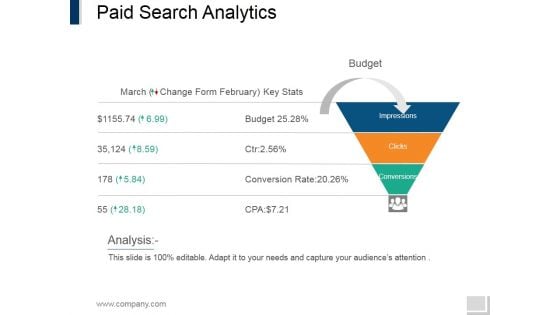
Paid Search Analytics Ppt PowerPoint Presentation Portfolio File Formats
This is a paid search analytics ppt powerpoint presentation portfolio file formats. This is a three stage process. The stages in this process are impressions, clicks, conversions, budget.
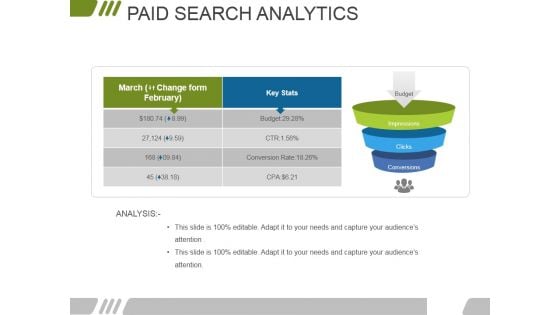
Paid Search Analytics Ppt PowerPoint Presentation Portfolio Ideas
This is a paid search analytics ppt powerpoint presentation portfolio ideas. This is a three stage process. The stages in this process are budget, impressions, clicks, conversions.
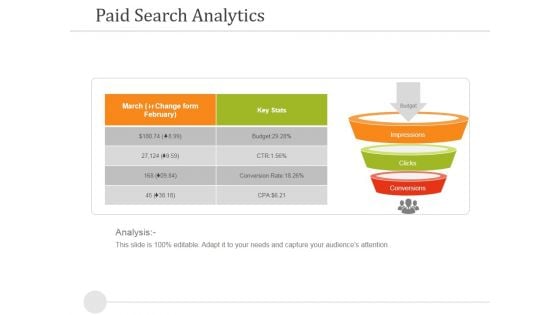
Paid Search Analytics Ppt PowerPoint Presentation Model Diagrams
This is a paid search analytics ppt powerpoint presentation model diagrams. This is a three stage process. The stages in this process are budget, impressions, clicks, conversions.
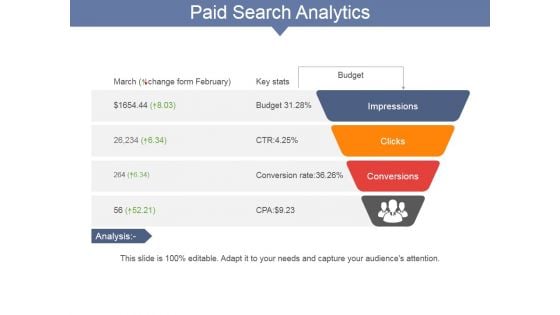
Paid Search Analytics Ppt PowerPoint Presentation Summary Infographic Template
This is a paid search analytics ppt powerpoint presentation summary infographic template. This is a four stage process. The stages in this process are impressions, clicks, conversions, budget.
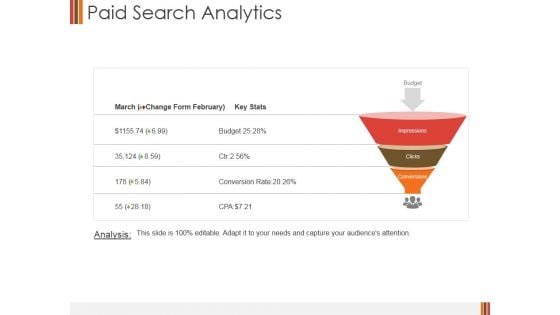
Paid Search Analytics Ppt PowerPoint Presentation Infographics Picture
This is a paid search analytics ppt powerpoint presentation infographics picture. This is a three stage process. The stages in this process are impressions, clicks, conversions, budget.

Paid Search Analytics Ppt PowerPoint Presentation Layouts Skills
This is a paid search analytics ppt powerpoint presentation layouts skills. This is a three stage process. The stages in this process are impressions, budget, clicks, conversions.
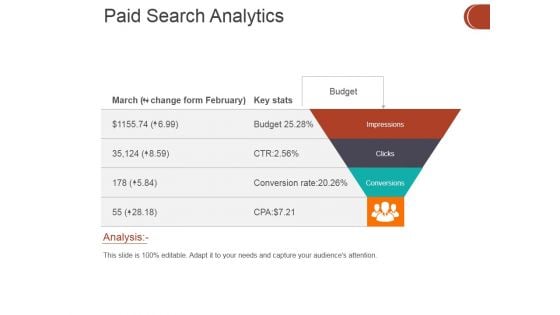
Paid Search Analytics Ppt PowerPoint Presentation Show Graphics Tutorials
This is a paid search analytics ppt powerpoint presentation show graphics tutorials. This is a four stage process. The stages in this process are impressions, clicks, conversions, budget.
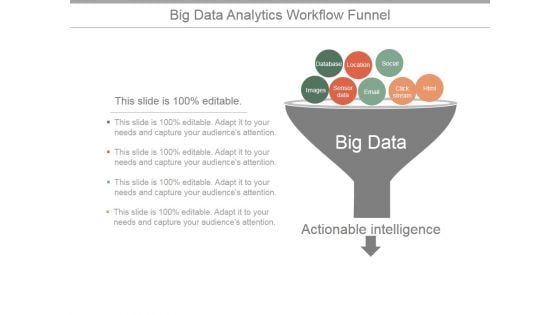
Big Data Analytics Workflow Funnel Ppt PowerPoint Presentation Rules
This is a big data analytics workflow funnel ppt powerpoint presentation rules. This is a one stage process. The stages in this process are database, location, social, images, sensor data, email, clickstream, html, actionable intelligence.
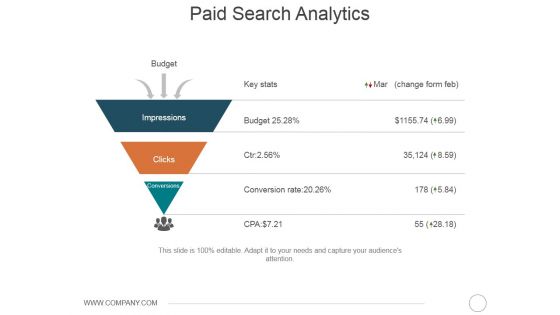
Paid Search Analytics Ppt PowerPoint Presentation Summary Design Inspiration
This is a paid search analytics ppt powerpoint presentation summary design inspiration. This is a three stage process. The stages in this process are budget, impressions, clicks, conversions, key stats, conversion rate.
Paid Search Analytics Ppt PowerPoint Presentation Slides Good
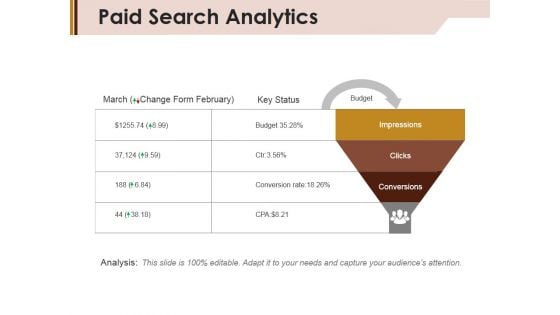
This is a paid search analytics ppt powerpoint presentation slides good. This is a four stage process. The stages in this process are impressions, clicks, conversions, budget, key status.
Paid Search Analytics Ppt PowerPoint Presentation Show Slide
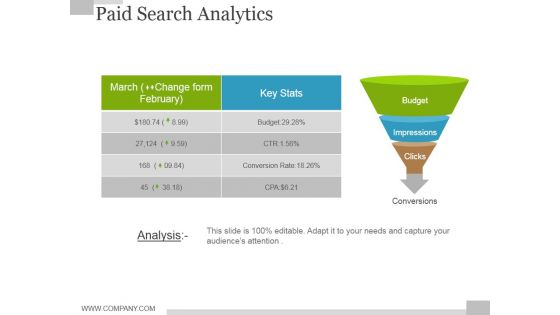
This is a paid search analytics ppt powerpoint presentation show slide. This is a two stage process. The stages in this process are budget, impressions, clicks, key stats, funnel.
Cloud Analytics Platform Ppt PowerPoint Presentation Styles Topics
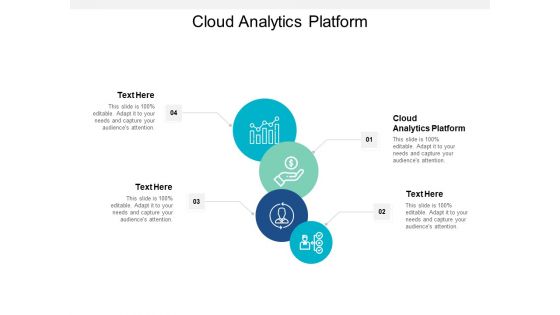
Presenting this set of slides with name cloud analytics platform ppt powerpoint presentation styles topics. This is an editable Powerpoint four stages graphic that deals with topics like cloud analytics platform to help convey your message better graphically. This product is a premium product available for immediate download, and is 100 percent editable in Powerpoint. Download this now and use it in your presentations to impress your audience.

Primary Drivers Workforce Analytics Ppt PowerPoint Presentation Inspiration Gridlines Cpb
Presenting this set of slides with name primary drivers workforce analytics ppt powerpoint presentation inspiration gridlines cpb. This is an editable Powerpoint three stages graphic that deals with topics like primary drivers workforce analytics to help convey your message better graphically. This product is a premium product available for immediate download and is 100 percent editable in Powerpoint. Download this now and use it in your presentations to impress your audience.

Conceptual Framework For Optimizing Website Analytics Sample PDF
The following slide exhibits online Google analysis structure. It helps in promoting specific products to customers who are most likely to buy them. It covers information related to business impact, strategy, etc. Presenting Conceptual Framework For Optimizing Website Analytics Sample PDF to dispense important information. This template comprises seven stages. It also presents valuable insights into the topics including Business Impact, Optimization, Analysis, Reporting, Implementation, Strategy. This is a completely customizable PowerPoint theme that can be put to use immediately. So, download it and address the topic impactfully.
What Is Data Analytics Ppt Professional Slide PDF
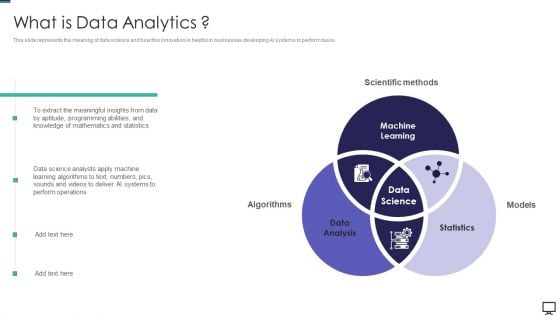
This slide represents the meaning of data science and how this innovation is helpful in businesses developing AI systems to perform tasks. Presenting what is data analytics ppt professional slide pdf to provide visual cues and insights. Share and navigate important information on three stages that need your due attention. This template can be used to pitch topics like data analysis, statistics, machine learning. In addtion, this PPT design contains high resolution images, graphics, etc, that are easily editable and available for immediate download.
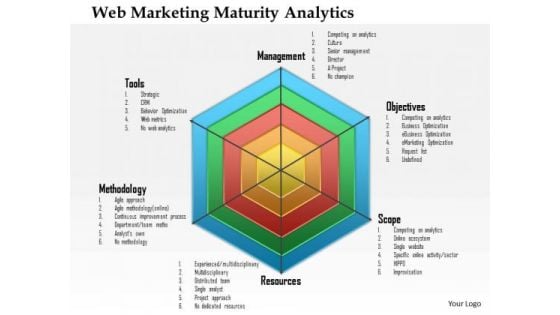
Business Framework Web Marketing Maturity Analytics PowerPoint Presentation
This business diagram displays framework for web marketing maturity analytics. This slide contains graphic of web with multiple levels. Use this editable diagram to make professional presentations.
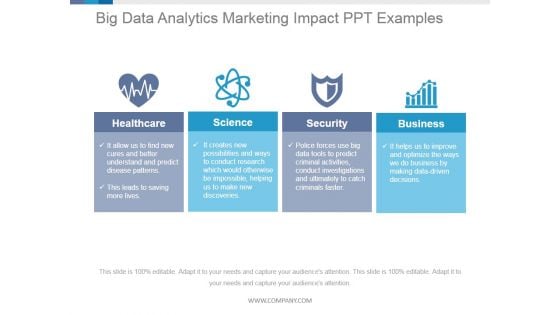
Big Data Analytics Marketing Impact Ppt PowerPoint Presentation Show
This is a big data analytics marketing impact ppt powerpoint presentation show. This is a four stage process. The stages in this process are healthcare, science, security, business.
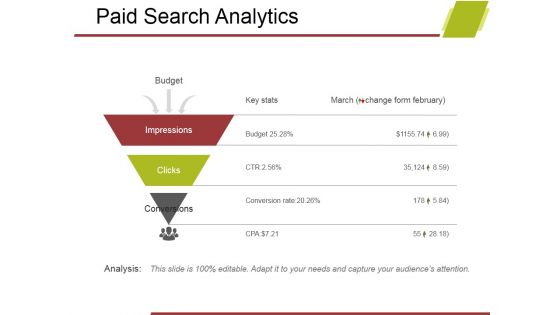
Paid Search Analytics Ppt PowerPoint Presentation Pictures Smartart
This is a paid search analytics ppt powerpoint presentation pictures smartart. This is a three stage process. The stages in this process are budget, impressions, clicks, conversions, key stats.
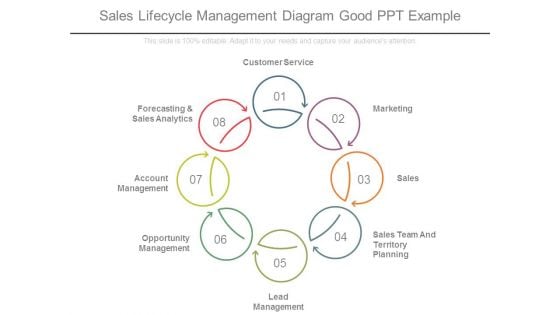
Sales Lifecycle Management Diagram Good Ppt Example
This is a sales lifecycle management diagram good ppt example. This is a eight stage process. The stages in this process are customer service, marketing, sales, sales team and territory planning, lead management, opportunity management, account management, forecasting and sales analytics.
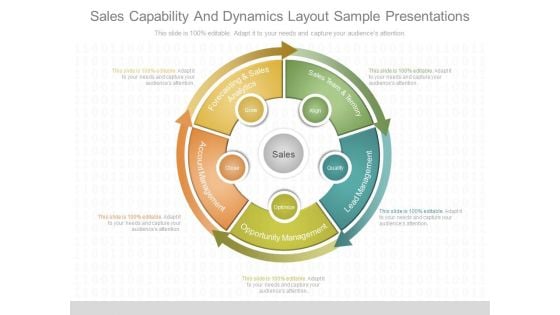
Sales Capability And Dynamics Layout Sample Presentations
This is a sales capability and dynamics layout sample presentations. This is a five stage process. The stages in this process are grow, align, qualify, optimize, close, sales team and territory, lead management, opportunity management, account management, forecasting and sales analytics.
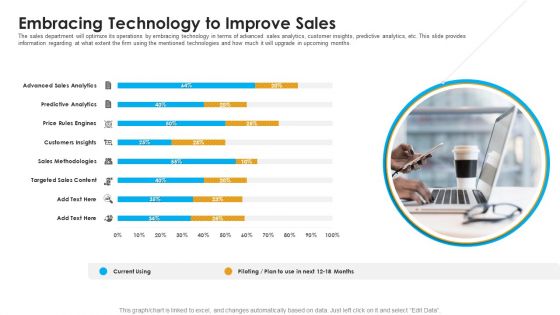
Sales Assistance Boost Overall Efficiency Embracing Technology To Improve Sales Introduction PDF
The sales department will optimize its operations by embracing technology in terms of advanced sales analytics, customer insights, predictive analytics, etc. This slide provides information regarding at what extent the firm using the mentioned technologies and how much it will upgrade in upcoming months. Deliver an awe-inspiring pitch with this creative sales assistance boost overall efficiency embracing technology to improve sales introduction pdf bundle. Topics like sales analytics, customer insights, targeted sales content can be discussed with this completely editable template. It is available for immediate download depending on the needs and requirements of the user.
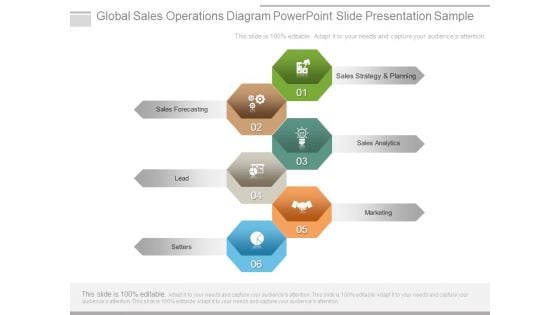
Global Sales Operations Diagram Powerpoint Slide Presentation Sample
This is a global sales operations diagram powerpoint slide presentation sample. This is a six stage process. The stages in this process are sales strategy and planning, sales forecasting, sales analytics, lead, marketing, setters.
Strategic Promotion Plan Implementation Analytics Dashboard Icons PDF
This slide illustrates graphical representation of implementation data of promotional strategy. It includes sales revenue, ad expenditure, profit etc. Showcasing this set of slides titled Strategic Promotion Plan Implementation Analytics Dashboard Icons PDF. The topics addressed in these templates are Profit, Sales Revenue, Expenditure. All the content presented in this PPT design is completely editable. Download it and make adjustments in color, background, font etc. as per your unique business setting.
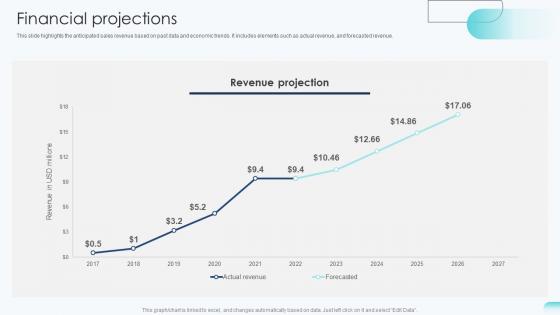
Financial Projections Big Data Analytics Investor Funding Elevator Pitch Deck
This slide highlights the anticipated sales revenue based on past data and economic trends. It includes elements such as actual revenue, and forecasted revenue. Slidegeeks is here to make your presentations a breeze with Financial Projections Big Data Analytics Investor Funding Elevator Pitch Deck With our easy-to-use and customizable templates, you can focus on delivering your ideas rather than worrying about formatting. With a variety of designs to choose from, you are sure to find one that suits your needs. And with animations and unique photos, illustrations, and fonts, you can make your presentation pop. So whether you are giving a sales pitch or presenting to the board, make sure to check out Slidegeeks first This slide highlights the anticipated sales revenue based on past data and economic trends. It includes elements such as actual revenue, and forecasted revenue.
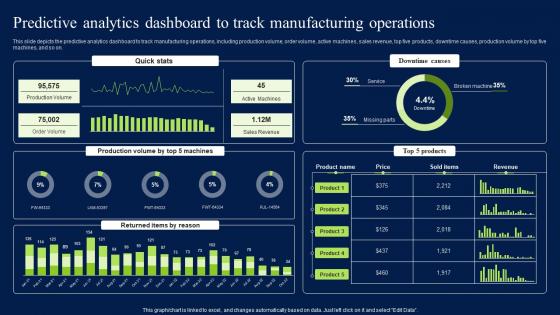
Predictive Analytics Dashboard To Track Manufacturing Operations Download PDF
This slide depicts the predictive analytics dashboard to track manufacturing operations, including production volume, order volume, active machines, sales revenue, top five products, downtime causes, production volume by top five machines, and so on. Present like a pro with Predictive Analytics Dashboard To Track Manufacturing Operations Download PDF Create beautiful presentations together with your team, using our easy-to-use presentation slides. Share your ideas in real-time and make changes on the fly by downloading our templates. So whether you are in the office, on the go, or in a remote location, you can stay in sync with your team and present your ideas with confidence. With Slidegeeks presentation got a whole lot easier. Grab these presentations today. This slide depicts the predictive analytics dashboard to track manufacturing operations, including production volume, order volume, active machines, sales revenue, top five products, downtime causes, production volume by top five machines, and so on.

Statistical Tools For Evidence Statistical Analytics In Building Material Company
This slide represents the concise overview of the problem, the proposed solution, and the achieved result for using data analytics in building material manufacturing company. The outcomes are enhanced sales productivity, identify relevant data sources, etc. Slidegeeks is one of the best resources for PowerPoint templates. You can download easily and regulate Statistical Tools For Evidence Statistical Analytics In Building Material Company for your personal presentations from our wonderful collection. A few clicks is all it takes to discover and get the most relevant and appropriate templates. Use our Templates to add a unique zing and appeal to your presentation and meetings. All the slides are easy to edit and you can use them even for advertisement purposes. This slide represents the concise overview of the problem, the proposed solution, and the achieved result for using data analytics in building material manufacturing company. The outcomes are enhanced sales productivity, identify relevant data sources, etc.
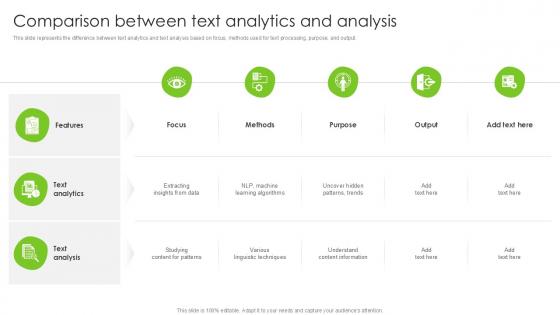
Comparison Between Text Analytics And Analysis PPT Presentation SS
This slide represents the difference between text analytics and text analysis based on focus, methods used for text processing, purpose, and output. Make sure to capture your audiences attention in your business displays with our gratis customizable Comparison Between Text Analytics And Analysis PPT Presentation SS. These are great for business strategies, office conferences, capital raising or task suggestions. If you desire to acquire more customers for your tech business and ensure they stay satisfied, create your own sales presentation with these plain slides. This slide represents the difference between text analytics and text analysis based on focus, methods used for text processing, purpose, and output.
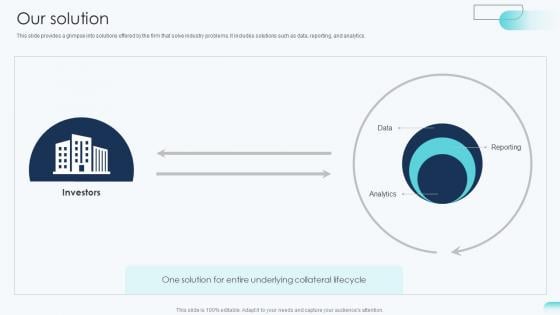
Our Solution Big Data Analytics Investor Funding Elevator Pitch Deck
This slide provides a glimpse into solutions offered by the firm that solve industry problems. It includes solutions such as data, reporting, and analytics. Make sure to capture your audiences attention in your business displays with our gratis customizable Our Solution Big Data Analytics Investor Funding Elevator Pitch Deck. These are great for business strategies, office conferences, capital raising or task suggestions. If you desire to acquire more customers for your tech business and ensure they stay satisfied, create your own sales presentation with these plain slides. This slide provides a glimpse into solutions offered by the firm that solve industry problems. It includes solutions such as data, reporting, and analytics.
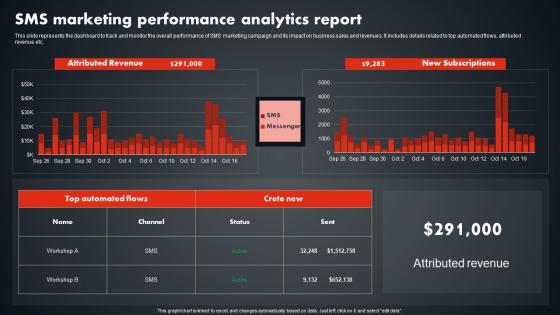
SMS Marketing Performance Analytics Report SMS Promotional Tactics Structure PDF
This slide represents the dashboard to track and monitor the overall performance of SMS marketing campaign and its impact on business sales and revenues. It includes details related to top automated flows, attributed revenue etc. From laying roadmaps to briefing everything in detail, our templates are perfect for you. You can set the stage with your presentation slides. All you have to do is download these easy-to-edit and customizable templates. SMS Marketing Performance Analytics Report SMS Promotional Tactics Structure PDF will help you deliver an outstanding performance that everyone would remember and praise you for. Do download this presentation today. This slide represents the dashboard to track and monitor the overall performance of SMS marketing campaign and its impact on business sales and revenues. It includes details related to top automated flows, attributed revenue etc.
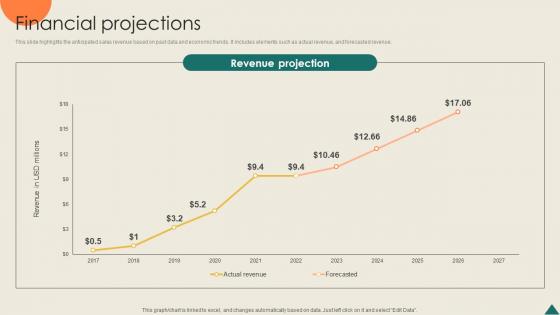
Financial Projections Financial Analytics Platform Investor Elevator Pitch Deck
This slide highlights the anticipated sales revenue based on past data and economic trends. It includes elements such as actual revenue, and forecasted revenue. Boost your pitch with our creative Financial Projections Financial Analytics Platform Investor Elevator Pitch Deck. Deliver an awe-inspiring pitch that will mesmerize everyone. Using these presentation templates you will surely catch everyones attention. You can browse the ppts collection on our website. We have researchers who are experts at creating the right content for the templates. So you do not have to invest time in any additional work. Just grab the template now and use them. This slide highlights the anticipated sales revenue based on past data and economic trends. It includes elements such as actual revenue, and forecasted revenue.
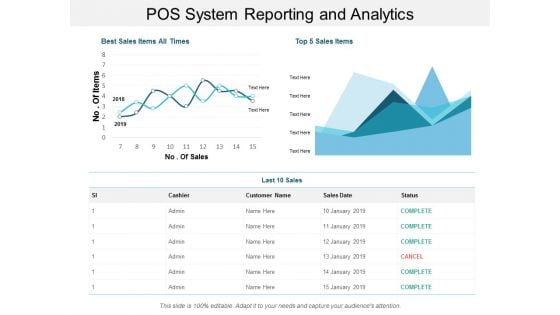
Pos System Reporting And Analytics Ppt PowerPoint Presentation Summary Gallery
This is a pos system reporting and analytics ppt powerpoint presentation summary gallery. This is a two stage process. The stages in this process are point of purchase, point of sale system, pos.
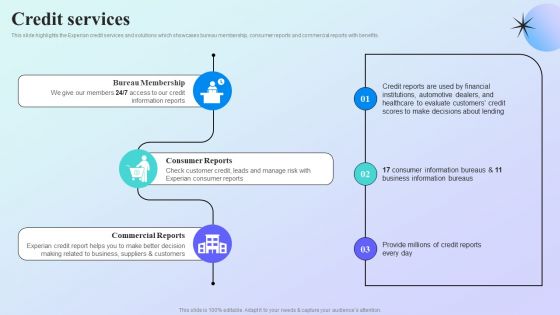
Information Analytics Company Outline Credit Services Elements PDF
This slide highlights the Experian credit services and solutions which showcases bureau membership, consumer reports and commercial reports with benefits. Make sure to capture your audiences attention in your business displays with our gratis customizable Information Analytics Company Outline Credit Services Elements PDF. These are great for business strategies, office conferences, capital raising or task suggestions. If you desire to acquire more customers for your tech business and ensure they stay satisfied, create your own sales presentation with these plain slides.
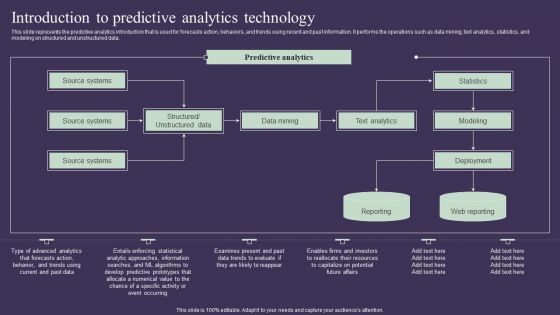
Projection Model Introduction To Predictive Analytics Technology Elements PDF
This slide represents the predictive analytics introduction that is used for forecasts action, behaviors, and trends using recent and past information. It performs the operations such as data mining, text analytics, statistics, and modeling on structured and unstructured data. Make sure to capture your audiences attention in your business displays with our gratis customizable Projection Model Introduction To Predictive Analytics Technology Elements PDF. These are great for business strategies, office conferences, capital raising or task suggestions. If you desire to acquire more customers for your tech business and ensure they stay satisfied, create your own sales presentation with these plain slides.
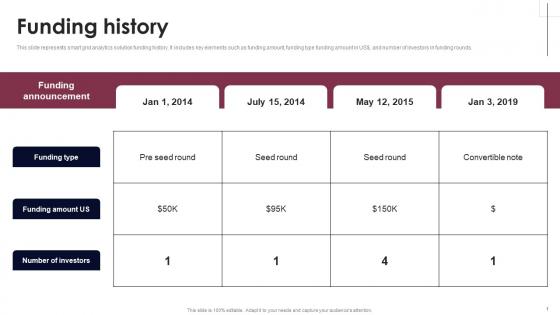
Funding History Smart Grid Analytics Investor Fund Raising Themes PDF
This slide represents smart grid analytics solution funding history. It includes key elements such as funding amount, funding type funding amount in US dollar, and number of investors in funding rounds. Slidegeeks is here to make your presentations a breeze with Funding History Smart Grid Analytics Investor Fund Raising Themes PDF With our easy-to-use and customizable templates, you can focus on delivering your ideas rather than worrying about formatting. With a variety of designs to choose from, you are sure to find one that suits your needs. And with animations and unique photos, illustrations, and fonts, you can make your presentation pop. So whether you are giving a sales pitch or presenting to the board, make sure to check out Slidegeeks first This slide represents smart grid analytics solution funding history. It includes key elements such as funding amount, funding type funding amount in US dollar, and number of investors in funding rounds.
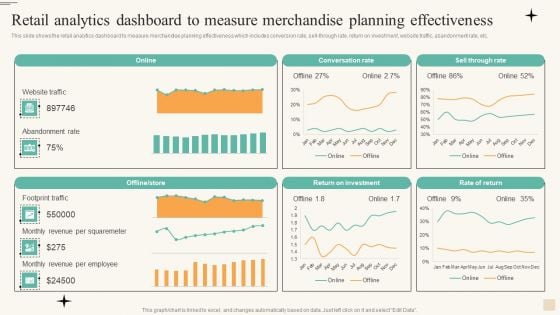
Retail Analytics Dashboard To Measure Merchandise Planning Effectiveness Microsoft PDF
This slide shows the retail analytics dashboard to measure merchandise planning effectiveness which includes conversion rate, sell through rate, return on investment, website traffic, abandonment rate, etc. Make sure to capture your audiences attention in your business displays with our gratis customizable Retail Analytics Dashboard To Measure Merchandise Planning Effectiveness Microsoft PDF. These are great for business strategies, office conferences, capital raising or task suggestions. If you desire to acquire more customers for your tech business and ensure they stay satisfied, create your own sales presentation with these plain slides.
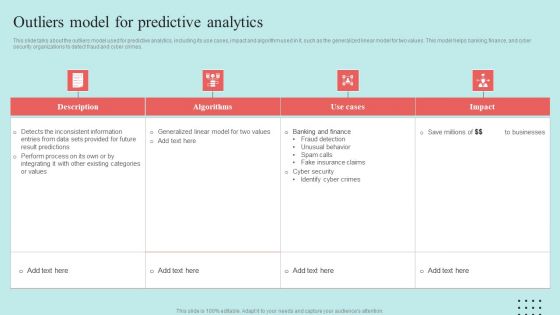
Predictive Data Model Outliers Model For Predictive Analytics Introduction PDF
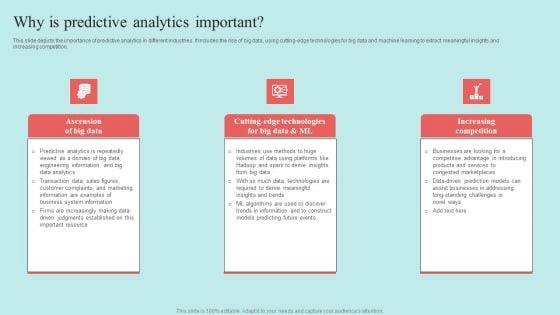
Predictive Data Model Why Is Predictive Analytics Important Mockup PDF
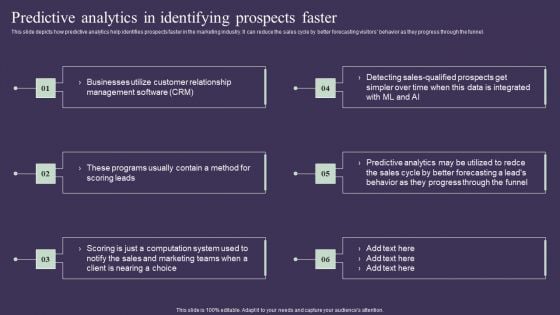
Projection Model Predictive Analytics In Identifying Prospects Faster Download PDF
This slide depicts how predictive analytics help identifies prospects faster in the marketing industry. It can reduce the sales cycle by better forecasting visitors behavior as they progress through the funnel. Boost your pitch with our creative Projection Model Predictive Analytics In Identifying Prospects Faster Download PDF. Deliver an awe-inspiring pitch that will mesmerize everyone. Using these presentation templates you will surely catch everyones attention. You can browse the ppts collection on our website. We have researchers who are experts at creating the right content for the templates. So you do not have to invest time in any additional work. Just grab the template now and use them.
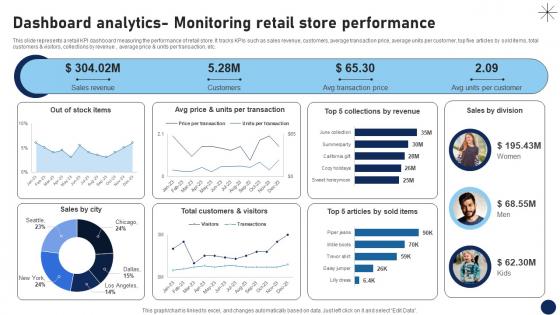
Dashboard Analytics Monitoring Retail Store Performance DT SS V
This slide represents a retail KPI dashboard measuring the performance of retail store. It tracks KPIs such as sales revenue, customers, average transaction price, average units per customer, top five articles by sold items, total customers and visitors, collections by revenue , average price and units per transaction, etc.Are you in need of a template that can accommodate all of your creative concepts This one is crafted professionally and can be altered to fit any style. Use it with Google Slides or PowerPoint. Include striking photographs, symbols, depictions, and other visuals. Fill, move around, or remove text boxes as desired. Test out color palettes and font mixtures. Edit and save your work, or work with colleagues. Download Dashboard Analytics Monitoring Retail Store Performance DT SS V and observe how to make your presentation outstanding. Give an impeccable presentation to your group and make your presentation unforgettable. This slide represents a retail KPI dashboard measuring the performance of retail store. It tracks KPIs such as sales revenue, customers, average transaction price, average units per customer, top five articles by sold items, total customers and visitors, collections by revenue , average price and units per transaction, etc.

Problem Statement Cloud Based Predictive Analytics Software Pitch Deck
This slide address the problems faced by the prospects of our company. Major problems includes high cost of drug discovery, long time to market for new drug, low success rate of drug discovery. Make sure to capture your audiences attention in your business displays with our gratis customizable Problem Statement Cloud Based Predictive Analytics Software Pitch Deck. These are great for business strategies, office conferences, capital raising or task suggestions. If you desire to acquire more customers for your tech business and ensure they stay satisfied, create your own sales presentation with these plain slides. This slide address the problems faced by the prospects of our company. Major problems includes high cost of drug discovery, long time to market for new drug, low success rate of drug discovery.
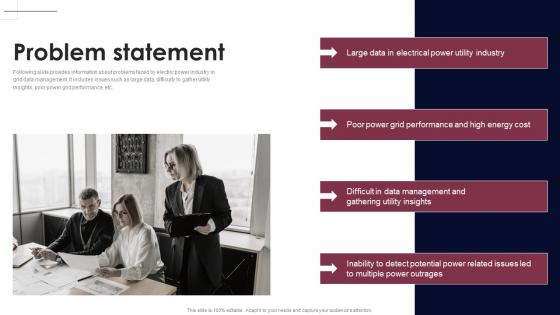
Problem Statement Smart Grid Analytics Investor Fund Raising Inspiration PDF
Following slide provides information about problems faced by electric power industry in grid data management. It includes issues such as large data, difficulty to gather utility insights, poor power grid performance, etc. Make sure to capture your audiences attention in your business displays with our gratis customizable Problem Statement Smart Grid Analytics Investor Fund Raising Inspiration PDF. These are great for business strategies, office conferences, capital raising or task suggestions. If you desire to acquire more customers for your tech business and ensure they stay satisfied, create your own sales presentation with these plain slides. Following slide provides information about problems faced by electric power industry in grid data management. It includes issues such as large data, difficulty to gather utility insights, poor power grid performance, etc.
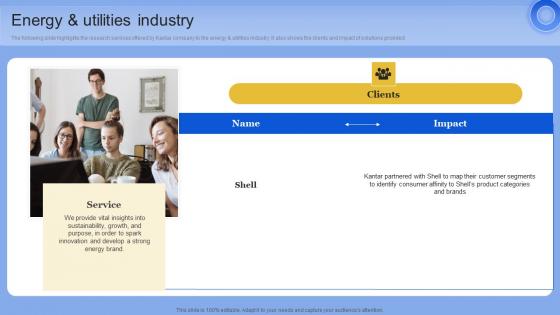
Energy And Utilities Industry Data Analytics Company Outline Slides PDF
The following slide highlights the research services offered by Kantar company to the energy and utilities industry. It also shows the clients and impact of solutions provided. Slidegeeks is here to make your presentations a breeze with Energy And Utilities Industry Data Analytics Company Outline Slides PDF With our easy-to-use and customizable templates, you can focus on delivering your ideas rather than worrying about formatting. With a variety of designs to choose from, you are sure to find one that suits your needs. And with animations and unique photos, illustrations, and fonts, you can make your presentation pop. So whether you are giving a sales pitch or presenting to the board, make sure to check out Slidegeeks first The following slide highlights the research services offered by Kantar company to the energy and utilities industry. It also shows the clients and impact of solutions provided
Funding History Cloud Based Predictive Analytics Software Pitch Deck
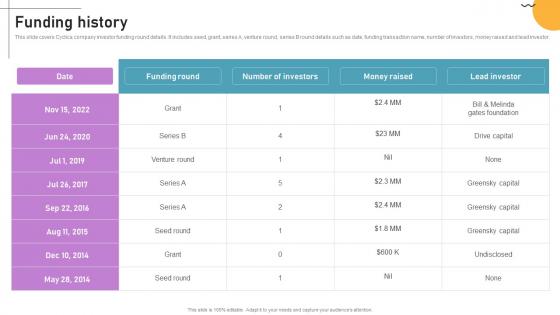
This slide covers Cyclica company investor funding round details. It includes seed, grant, series A, venture round, series B round details such as date, funding transaction name, number of investors, money raised and lead investor. Slidegeeks is here to make your presentations a breeze with Funding History Cloud Based Predictive Analytics Software Pitch Deck With our easy-to-use and customizable templates, you can focus on delivering your ideas rather than worrying about formatting. With a variety of designs to choose from, you are sure to find one that suits your needs. And with animations and unique photos, illustrations, and fonts, you can make your presentation pop. So whether you are giving a sales pitch or presenting to the board, make sure to check out Slidegeeks first This slide covers Cyclica company investor funding round details. It includes seed, grant, series A, venture round, series B round details such as date, funding transaction name, number of investors, money raised and lead investor.

Exit Strategy Cloud Based Predictive Analytics Software Pitch Deck
This slide outlines Cyclica exit strategy providing investors with a clear understanding of potential events and return on their investment opportunities. Key strategies include Acquisition, IPO, merger and sale to strategic partner. Get a simple yet stunning designed Exit Strategy Cloud Based Predictive Analytics Software Pitch Deck. It is the best one to establish the tone in your meetings. It is an excellent way to make your presentations highly effective. So, download this PPT today from Slidegeeks and see the positive impacts. Our easy-to-edit Exit Strategy Cloud Based Predictive Analytics Software Pitch Deck can be your go-to option for all upcoming conferences and meetings. So, what are you waiting for Grab this template today. This slide outlines Cyclica exit strategy providing investors with a clear understanding of potential events and return on their investment opportunities. Key strategies include Acquisition, IPO, merger and sale to strategic partner.
Computer Data Analytics Applications And Opportunities Demonstration PDF
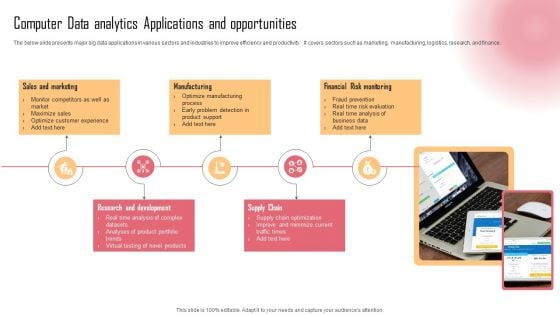
The below slide presents major big data applications in various sectors and industries to improve efficiency and productivity. It covers sectors such as marketing, manufacturing, logistics, research, and finance. Presenting Computer Data Analytics Applications And Opportunities Demonstration PDF to dispense important information. This template comprises five stages. It also presents valuable insights into the topics including Sales And Marketing, Manufacturing, Financial Risk Monitoring . This is a completely customizable PowerPoint theme that can be put to use immediately. So, download it and address the topic impactfully.
Problems Statement Financial Analytics Platform Investor Elevator Pitch Deck
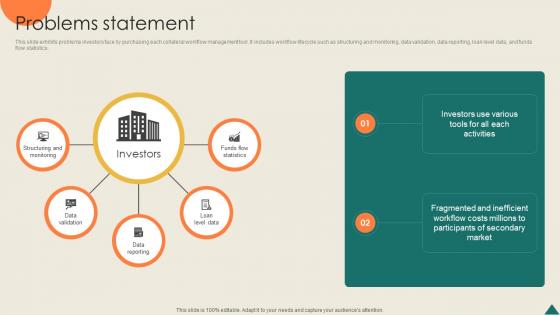
This slide exhibits problems investors face by purchasing each collateral workflow management tool. It includes workflow lifecycle such as structuring and monitoring, data validation, data reporting, loan level data, and funds flow statistics. Slidegeeks is here to make your presentations a breeze with Problems Statement Financial Analytics Platform Investor Elevator Pitch Deck With our easy-to-use and customizable templates, you can focus on delivering your ideas rather than worrying about formatting. With a variety of designs to choose from, you are sure to find one that suits your needs. And with animations and unique photos, illustrations, and fonts, you can make your presentation pop. So whether you are giving a sales pitch or presenting to the board, make sure to check out Slidegeeks first This slide exhibits problems investors face by purchasing each collateral workflow management tool. It includes workflow lifecycle such as structuring and monitoring, data validation, data reporting, loan level data, and funds flow statistics.
Key Phases Of Data Integration Process Data Analytics SS V
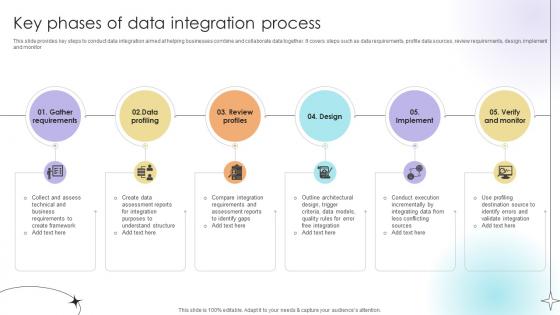
This slide provides key steps to conduct data integration aimed at helping businesses combine and collaborate data together. It covers steps such as data requirements, profile data sources, review requirements, design, implement and monitor.Slidegeeks is here to make your presentations a breeze with Key Phases Of Data Integration Process Data Analytics SS V With our easy-to-use and customizable templates, you can focus on delivering your ideas rather than worrying about formatting. With a variety of designs to choose from, you are sure to find one that suits your needs. And with animations and unique photos, illustrations, and fonts, you can make your presentation pop. So whether you are giving a sales pitch or presenting to the board, make sure to check out Slidegeeks first This slide provides key steps to conduct data integration aimed at helping businesses combine and collaborate data together. It covers steps such as data requirements, profile data sources, review requirements, design, implement and monitor.
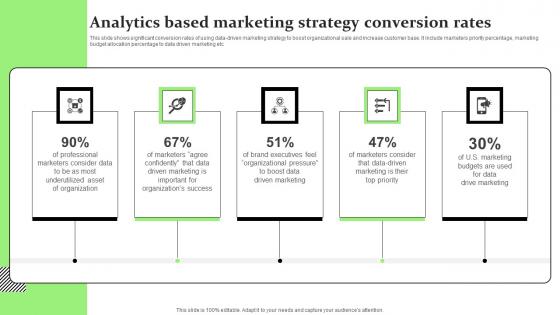
Analytics Based Marketing Strategy Conversion Rates Ideas Pdf
This slide shows significant conversion rates of using data driven marketing strategy to boost organizational sale and increase customer base. It include marketers priority percentage, marketing budget allocation percentage to data driven marketing etc.Pitch your topic with ease and precision using this Analytics Based Marketing Strategy Conversion Rates Ideas Pdf This layout presents information on Organizations Success, Driven Marketing, Organizational Pressure It is also available for immediate download and adjustment. So, changes can be made in the color, design, graphics or any other component to create a unique layout. This slide shows significant conversion rates of using data driven marketing strategy to boost organizational sale and increase customer base. It include marketers priority percentage, marketing budget allocation percentage to data driven marketing etc.

Enhancing Profitability Modelling Selecting Suitable Profitability Analytics Solutions
This slide portrays information regarding the profitability analytics solutions that are available. Firm can choose the suitable solution based on the requirement based on features and cost mentioned. Make sure to capture your audiences attention in your business displays with our gratis customizable Enhancing Profitability Modelling Selecting Suitable Profitability Analytics Solutions. These are great for business strategies, office conferences, capital raising or task suggestions. If you desire to acquire more customers for your tech business and ensure they stay satisfied, create your own sales presentation with these plain slides. This slide portrays information regarding the profitability analytics solutions that are available. Firm can choose the suitable solution based on the requirement based on features and cost mentioned.
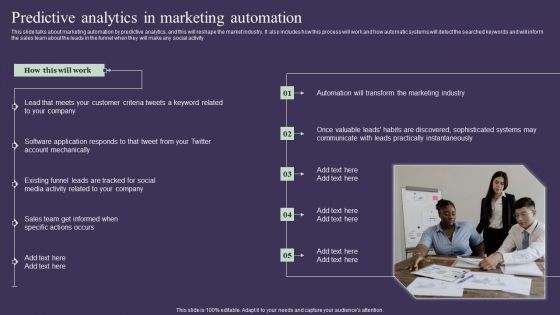
Projection Model Predictive Analytics In Marketing Automation Template PDF
This slide talks about marketing automation by predictive analytics, and this will reshape the market industry. It also includes how this process will work and how automatic systems will detect the searched keywords and will inform the sales team about the leads in the funnel when they will make any social activity. Create an editable Projection Model Predictive Analytics In Marketing Automation Template PDF that communicates your idea and engages your audience. Whether you are presenting a business or an educational presentation, pre-designed presentation templates help save time. Projection Model Predictive Analytics In Marketing Automation Template PDF is highly customizable and very easy to edit, covering many different styles from creative to business presentations. Slidegeeks has creative team members who have crafted amazing templates. So, go and get them without any delay.
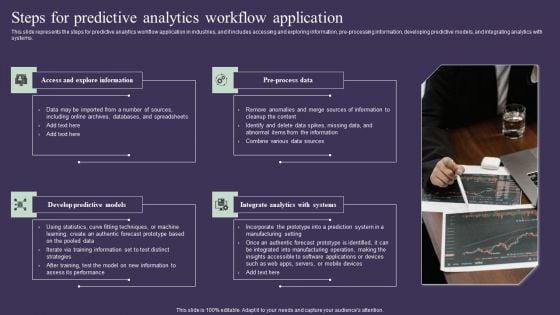
Projection Model Steps For Predictive Analytics Workflow Application Pictures PDF
This slide represents the steps for predictive analytics workflow application in industries, and it includes accessing and exploring information, pre-processing information, developing predictive models, and integrating analytics with systems. Slidegeeks is here to make your presentations a breeze with Projection Model Steps For Predictive Analytics Workflow Application Pictures PDF With our easy-to-use and customizable templates, you can focus on delivering your ideas rather than worrying about formatting. With a variety of designs to choose from, you are sure to find one that suits your needs. And with animations and unique photos, illustrations, and fonts, you can make your presentation pop. So whether you are giving a sales pitch or presenting to the board, make sure to check out Slidegeeks first
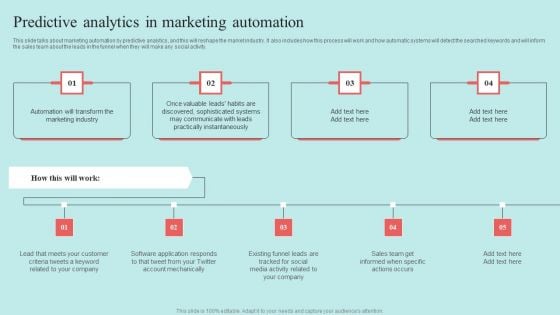
Predictive Data Model Predictive Analytics In Marketing Automation Demonstration PDF
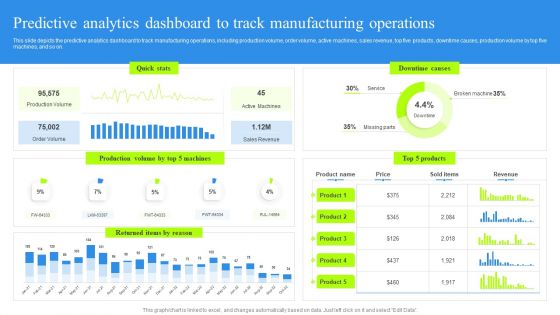
Predictive Analytics Dashboard To Track Manufacturing Operations Rules PDF
This slide depicts the predictive analytics dashboard to track manufacturing operations, including production volume, order volume, active machines, sales revenue, top five products, downtime causes, production volume by top five machines, and so on. Present like a pro with Predictive Analytics Dashboard To Track Manufacturing Operations Rules PDF Create beautiful presentations together with your team, using our easy-to-use presentation slides. Share your ideas in real-time and make changes on the fly by downloading our templates. So whether you are in the office, on the go, or in a remote location, you can stay in sync with your team and present your ideas with confidence. With Slidegeeks presentation got a whole lot easier. Grab these presentations today.
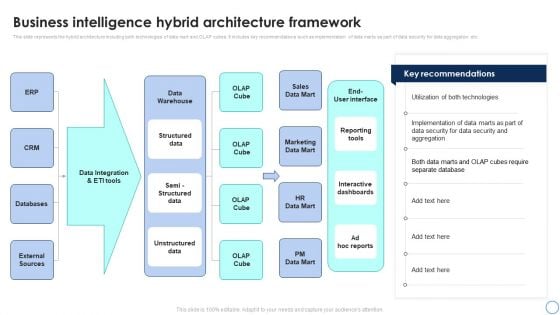
Business Analytics Application Business Intelligence Hybrid Architecture Framework Download PDF
This slide represents the hybrid architecture including both technologies of data mart and OLAP cubes. It includes key recommendations such as implementation of data marts as part of data security for data aggregation etc. Slidegeeks is here to make your presentations a breeze with Business Analytics Application Business Intelligence Hybrid Architecture Framework Download PDF With our easy-to-use and customizable templates, you can focus on delivering your ideas rather than worrying about formatting. With a variety of designs to choose from, youre sure to find one that suits your needs. And with animations and unique photos, illustrations, and fonts, you can make your presentation pop. So whether youre giving a sales pitch or presenting to the board, make sure to check out Slidegeeks first.
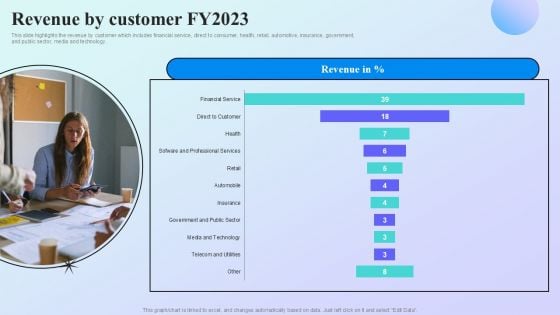
Information Analytics Company Outline Revenue By Customer Fy2023 Topics PDF
Product Data Analytics Icon Showcasing Business Revenue Growth Structure Pdf
Showcasing this set of slides titled Product Data Analytics Icon Showcasing Business Revenue Growth Structure Pdf. The topics addressed in these templates are Product Data Analytics, Icon Showcasing Business, Revenue Growth. All the content presented in this PPT design is completely editable. Download it and make adjustments in color, background, font etc. as per your unique business setting. Our Product Data Analytics Icon Showcasing Business Revenue Growth Structure Pdf are topically designed to provide an attractive backdrop to any subject. Use them to look like a presentation pro.

Core Team Big Data Analytics Investor Funding Elevator Pitch Deck
This slide provides information regarding key leaders involved in investment decisions. Some of the designations include founder and chief executive officer, chief operating officer, vice president of sales, and vice president of operations. Do you have to make sure that everyone on your team knows about any specific topic I yes, then you should give Core Team Big Data Analytics Investor Funding Elevator Pitch Deck a try. Our experts have put a lot of knowledge and effort into creating this impeccable Core Team Big Data Analytics Investor Funding Elevator Pitch Deck. You can use this template for your upcoming presentations, as the slides are perfect to represent even the tiniest detail. You can download these templates from the Slidegeeks website and these are easy to edit. So grab these today This slide provides information regarding key leaders involved in investment decisions. Some of the designations include founder and chief executive officer, chief operating officer, vice president of sales, and vice president of operations.
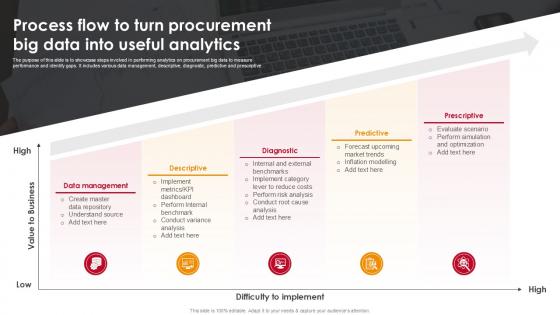
Process Flow To Turn Procurement Big Data Into Useful Analytics
Do you have an important presentation coming up Are you looking for something that will make your presentation stand out from the rest Look no further than Process Flow To Turn Procurement Big Data Into Useful Analytics. With our professional designs, you can trust that your presentation will pop and make delivering it a smooth process. And with Slidegeeks, you can trust that your presentation will be unique and memorable. So why wait Grab Process Flow To Turn Procurement Big Data Into Useful Analytics today and make your presentation stand out from the rest This slide showcases steps for analyzing procurement big data to assess performance and identify gaps. It represents data management and various analytics types, including descriptive, diagnostic, predictive, and prescriptive, to drive informed decision-making and improvements.
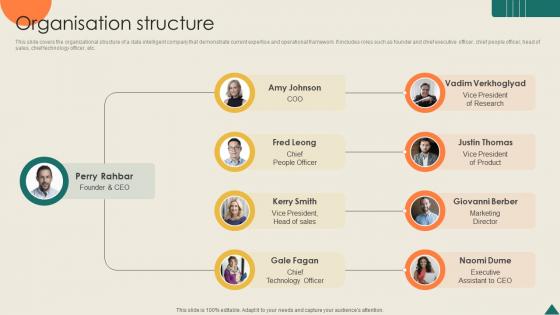
Organisation Structure Financial Analytics Platform Investor Elevator Pitch Deck
This slide covers the organizational structure of a data intelligent company that demonstrate current expertise and operational framework. It includes roles such as founder and chief executive officer, chief people officer, head of sales, chief technology officer, etc. From laying roadmaps to briefing everything in detail, our templates are perfect for you. You can set the stage with your presentation slides. All you have to do is download these easy-to-edit and customizable templates. Organisation Structure Financial Analytics Platform Investor Elevator Pitch Deck will help you deliver an outstanding performance that everyone would remember and praise you for. Do download this presentation today. This slide covers the organizational structure of a data intelligent company that demonstrate current expertise and operational framework. It includes roles such as founder and chief executive officer, chief people officer, head of sales, chief technology officer, etc.
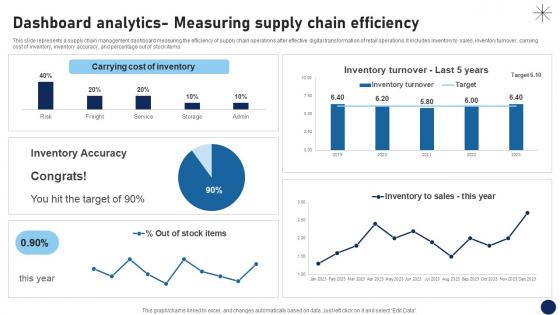
Dashboard Analytics Measuring Supply Chain Efficiency DT SS V
This slide represents a supply chain management dashboard measuring the efficiency of supply chain operations after effective digital transformation of retail operations. It includes inventory to sales, inventory turnover, carrying cost of inventory, inventory accuracy, and percentage out of stock items.If you are looking for a format to display your unique thoughts, then the professionally designed Dashboard Analytics Measuring Supply Chain Efficiency DT SS V is the one for you. You can use it as a Google Slides template or a PowerPoint template. Incorporate impressive visuals, symbols, images, and other charts. Modify or reorganize the text boxes as you desire. Experiment with shade schemes and font pairings. Alter, share or cooperate with other people on your work. Download Dashboard Analytics Measuring Supply Chain Efficiency DT SS V and find out how to give a successful presentation. Present a perfect display to your team and make your presentation unforgettable. This slide represents a supply chain management dashboard measuring the efficiency of supply chain operations after effective digital transformation of retail operations. It includes inventory to sales, inventory turnover, carrying cost of inventory, inventory accuracy, and percentage out of stock items.


 Continue with Email

 Home
Home


