Sales Analytics
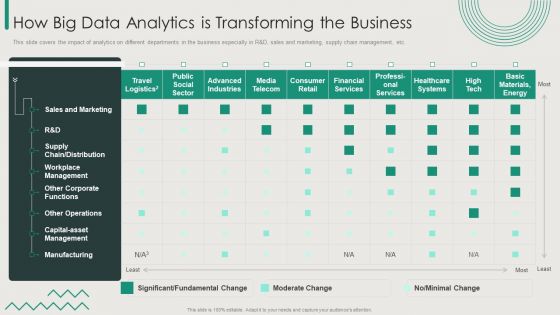
Organization Transition How Big Data Analytics Is Transforming The Business Ppt File Example PDF
This slide covers the impact of analytics on different departments in the business especially in R And D, sales and marketing, supply chain management, etc. Deliver an awe inspiring pitch with this creative Organization Transition How Big Data Analytics Is Transforming The Business Ppt File Example PDF bundle. Topics like Financial Services, Consumer Retail, Healthcare Systems can be discussed with this completely editable template. It is available for immediate download depending on the needs and requirements of the user.
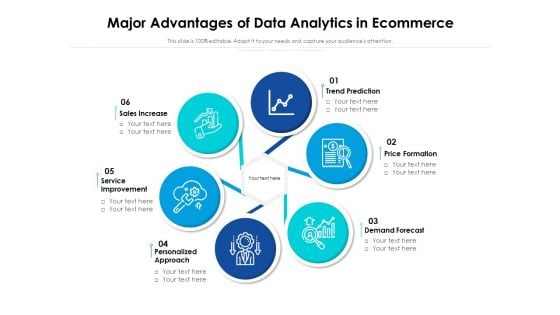
Major Advantages Of Data Analytics In Ecommerce Ppt PowerPoint Presentation Outline Graphics Example PDF
Presenting major advantages of data analytics in ecommerce ppt powerpoint presentation outline graphics example pdf to dispense important information. This template comprises six stages. It also presents valuable insights into the topics including sales increase, service improvement, personalized approach, trend prediction, price formation, demand forecast. This is a completely customizable PowerPoint theme that can be put to use immediately. So, download it and address the topic impactfully.
Financial Analytics Solution Investor Funding Elevator Pitch Deck Contact Us Diagrams PDF
Make sure to capture your audiences attention in your business displays with our gratis customizable Financial Analytics Solution Investor Funding Elevator Pitch Deck Contact Us Diagrams PDF. These are great for business strategies, office conferences, capital raising or task suggestions. If you desire to acquire more customers for your tech business and ensure they stay satisfied, create your own sales presentation with these plain slides.
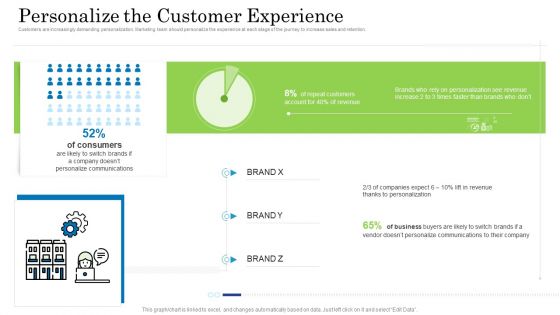
Customer Behavioral Data And Analytics Personalize The Customer Experience Guidelines PDF
Customers are increasingly demanding personalization. Marketing team should personalize the experience at each stage of the journey to increase sales and retention. Deliver an awe inspiring pitch with this creative customer behavioral data and analytics personalize the customer experience guidelines pdf bundle. Topics like very satisfied, satisfied, neutral, dissatisfied, very dissatisfied can be discussed with this completely editable template. It is available for immediate download depending on the needs and requirements of the user.
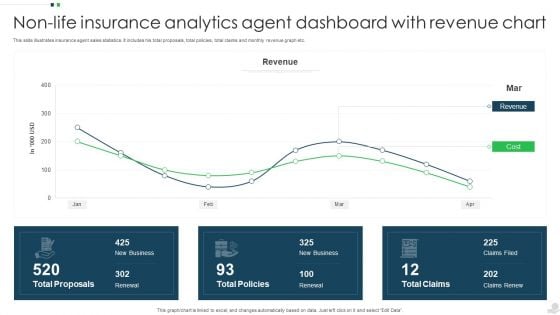
Non Life Insurance Analytics Agent Dashboard With Revenue Chart Infographics PDF
This slide illustrates insurance agent sales statistics. It includes his total proposals, total policies, total claims and monthly revenue graph etc. Showcasing this set of slides titled Non Life Insurance Analytics Agent Dashboard With Revenue Chart Infographics PDF. The topics addressed in these templates are Revenue, Cost, Total Proposals. All the content presented in this PPT design is completely editable. Download it and make adjustments in color, background, font etc. as per your unique business setting.

Transforming Recruitment Process Effective Recruitment Analytics Best Practices CRP DK SS
This slide showcases best practices adopted to improve hiring process such as selecting relevant metric, advanced analysis and effective reporting. Make sure to capture your audiences attention in your business displays with our gratis customizable Transforming Recruitment Process Effective Recruitment Analytics Best Practices CRP DK SS. These are great for business strategies, office conferences, capital raising or task suggestions. If you desire to acquire more customers for your tech business and ensure they stay satisfied, create your own sales presentation with these plain slides. This slide showcases best practices adopted to improve hiring process such as selecting relevant metric, advanced analysis and effective reporting.
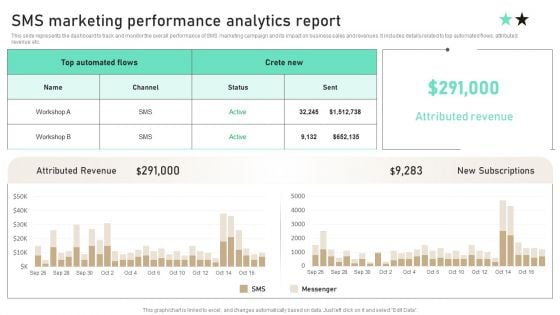
SMS Marketing Performance Analytics Report Ppt PowerPoint Presentation Diagram Templates PDF
This slide represents the dashboard to track and monitor the overall performance of SMS marketing campaign and its impact on business sales and revenues. It includes details related to top automated flows, attributed revenue etc. Slidegeeks is here to make your presentations a breeze with SMS Marketing Performance Analytics Report Ppt PowerPoint Presentation Diagram Templates PDF With our easy to use and customizable templates, you can focus on delivering your ideas rather than worrying about formatting. With a variety of designs to choose from, you are sure to find one that suits your needs. And with animations and unique photos, illustrations, and fonts, you can make your presentation pop. So whether you are giving a sales pitch or presenting to the board, make sure to check out Slidegeeks first.
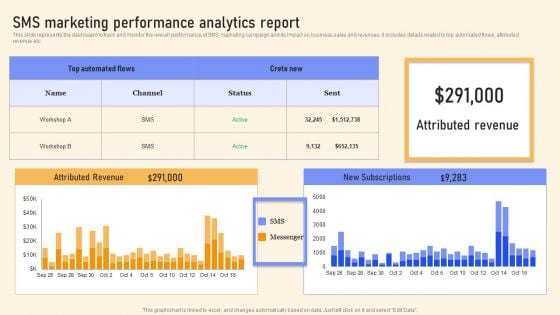
SMS Marketing Performance Analytics Report Ppt PowerPoint Presentation File Infographics PDF
This slide represents the dashboard to track and monitor the overall performance of SMS marketing campaign and its impact on business sales and revenues. It includes details related to top automated flows, attributed revenue etc. Slidegeeks is here to make your presentations a breeze with SMS Marketing Performance Analytics Report Ppt PowerPoint Presentation File Infographics PDF With our easy to use and customizable templates, you can focus on delivering your ideas rather than worrying about formatting. With a variety of designs to choose from, you are sure to find one that suits your needs. And with animations and unique photos, illustrations, and fonts, you can make your presentation pop. So whether you are giving a sales pitch or presenting to the board, make sure to check out Slidegeeks first.
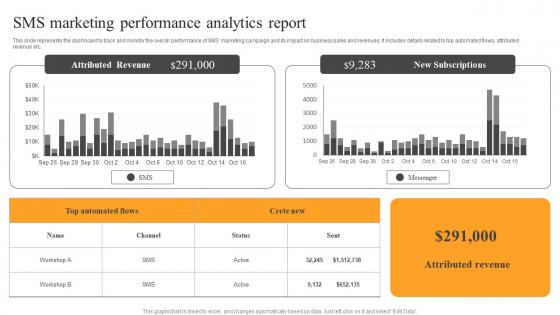
SMS Marketing Performance Analytics Text Message Advertising Solutions Enhancing Microsoft Pdf
This slide represents the dashboard to track and monitor the overall performance of SMS marketing campaign and its impact on business sales and revenues. It includes details related to top automated flows, attributed revenue etc. Do you have an important presentation coming up Are you looking for something that will make your presentation stand out from the rest Look no further than SMS Marketing Performance Analytics Text Message Advertising Solutions Enhancing Microsoft Pdf With our professional designs, you can trust that your presentation will pop and make delivering it a smooth process. And with Slidegeeks, you can trust that your presentation will be unique and memorable. So why wait Grab SMS Marketing Performance Analytics Text Message Advertising Solutions Enhancing Microsoft Pdf today and make your presentation stand out from the rest This slide represents the dashboard to track and monitor the overall performance of SMS marketing campaign and its impact on business sales and revenues. It includes details related to top automated flows, attributed revenue etc.
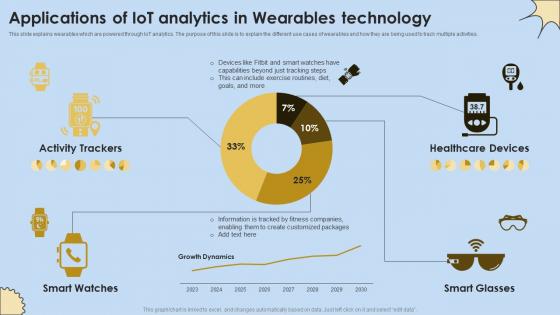
Applications Of IoT Analytics In Wearables Technology Internet Of Things Analysis Graphics Pdf
This slide explains wearables which are powered through IoT analytics. The purpose of this slide is to explain the different use cases of wearables and how they are being used to track multiple activities. Slidegeeks is here to make your presentations a breeze with Applications Of IoT Analytics In Wearables Technology Internet Of Things Analysis Graphics Pdf With our easy-to-use and customizable templates, you can focus on delivering your ideas rather than worrying about formatting. With a variety of designs to choose from, you are sure to find one that suits your needs. And with animations and unique photos, illustrations, and fonts, you can make your presentation pop. So whether you are giving a sales pitch or presenting to the board, make sure to check out Slidegeeks first. This slide explains wearables which are powered through IoT analytics. The purpose of this slide is to explain the different use cases of wearables and how they are being used to track multiple activities.
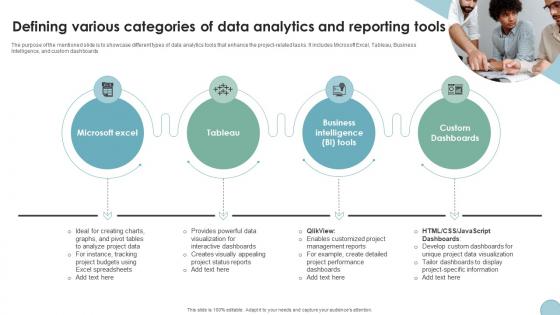
Defining Various Categories Of Data Analytics Digital Transformation In Project Management
The purpose of the mentioned slide is to showcase different types of data analytics tools that enhance the project-related tasks. It includes Microsoft Excel, Tableau, Business Intelligence, and custom dashboards. Slidegeeks is here to make your presentations a breeze with Defining Various Categories Of Data Analytics Digital Transformation In Project Management With our easy-to-use and customizable templates, you can focus on delivering your ideas rather than worrying about formatting. With a variety of designs to choose from, you are sure to find one that suits your needs. And with animations and unique photos, illustrations, and fonts, you can make your presentation pop. So whether you are giving a sales pitch or presenting to the board, make sure to check out Slidegeeks first The purpose of the mentioned slide is to showcase different types of data analytics tools that enhance the project-related tasks. It includes Microsoft Excel, Tableau, Business Intelligence, and custom dashboards.

Data And Information Visualization Visual Analytics Branch Of Visualization Research Designs PDF
This slide shows visual analytics, the last branch of visualization research, which emerged from the advancements in the other two branches and mainly focused on analytical reasoning. Make sure to capture your audiences attention in your business displays with our gratis customizable Data And Information Visualization Visual Analytics Branch Of Visualization Research Designs PDF. These are great for business strategies, office conferences, capital raising or task suggestions. If you desire to acquire more customers for your tech business and ensure they stay satisfied, create your own sales presentation with these plain slides.
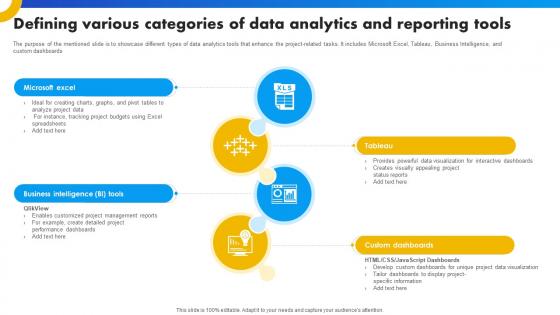
Defining Various Categories Of Data Analytics And Reporting Tools Strategies For Success In Digital
The purpose of the mentioned slide is to showcase different types of data analytics tools that enhance the project-related tasks. It includes Microsoft Excel, Tableau, Business Intelligence, and custom dashboards. Slidegeeks is here to make your presentations a breeze with Defining Various Categories Of Data Analytics And Reporting Tools Strategies For Success In Digital With our easy-to-use and customizable templates, you can focus on delivering your ideas rather than worrying about formatting. With a variety of designs to choose from, you are sure to find one that suits your needs. And with animations and unique photos, illustrations, and fonts, you can make your presentation pop. So whether you are giving a sales pitch or presenting to the board, make sure to check out Slidegeeks first The purpose of the mentioned slide is to showcase different types of data analytics tools that enhance the project-related tasks. It includes Microsoft Excel, Tableau, Business Intelligence, and custom dashboards.
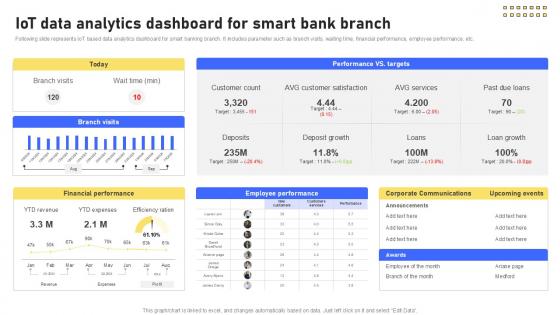
IoT Data Analytics Dashboard For Banking Future With IoT Ppt Powerpoint IoT SS V
Following slide represents IoT based data analytics dashboard for smart banking branch. It includes parameter such as branch visits, waiting time, financial performance, employee performance, etc. Slidegeeks is here to make your presentations a breeze with IoT Data Analytics Dashboard For Banking Future With IoT Ppt Powerpoint IoT SS V With our easy-to-use and customizable templates, you can focus on delivering your ideas rather than worrying about formatting. With a variety of designs to choose from, you are sure to find one that suits your needs. And with animations and unique photos, illustrations, and fonts, you can make your presentation pop. So whether you are giving a sales pitch or presenting to the board, make sure to check out Slidegeeks first Following slide represents IoT based data analytics dashboard for smart banking branch. It includes parameter such as branch visits, waiting time, financial performance, employee performance, etc.
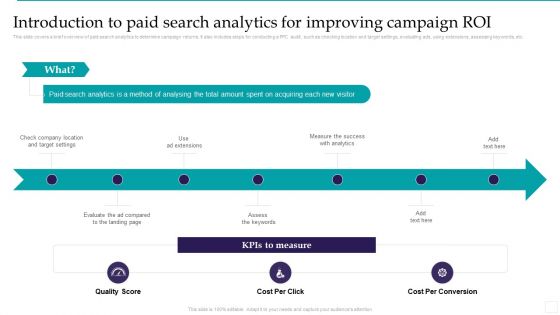
Introduction To Paid Search Analytics For Improving Campaign ROI Introduction PDF
This slide covers a brief overview of paid search analytics to determine campaign returns. It also includes steps for conducting a PPC audit, such as checking location and target settings, evaluating ads, using extensions, assessing keywords, etc. Make sure to capture your audiences attention in your business displays with our gratis customizable Introduction To Paid Search Analytics For Improving Campaign ROI Introduction PDF. These are great for business strategies, office conferences, capital raising or task suggestions. If you desire to acquire more customers for your tech business and ensure they stay satisfied, create your own sales presentation with these plain slides.

Deploying AML Transaction Monitoring Using Behavioral Analytics For Multiple Ideas PDF
The following slide illustrates usage of behavioral analytics for multiple transactions and profiles. It provides information about transaction, collaborative, behavior sorted, user defined, global intelligent, merchant, risk sensitivity, false positives, financial crimes, etc. Make sure to capture your audiences attention in your business displays with our gratis customizable Deploying AML Transaction Monitoring Using Behavioral Analytics For Multiple Ideas PDF. These are great for business strategies, office conferences, capital raising or task suggestions. If you desire to acquire more customers for your tech business and ensure they stay satisfied, create your own sales presentation with these plain slides.
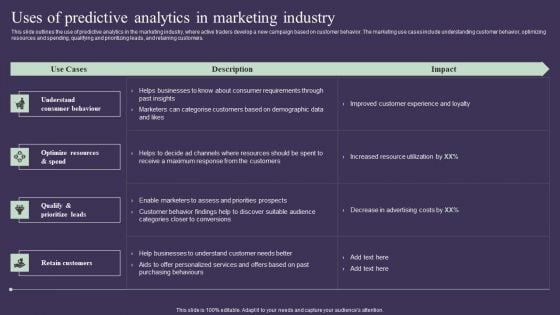
Projection Model Uses Of Predictive Analytics In Marketing Industry Infographics PDF
This slide outlines the use of predictive analytics in the marketing industry, where active traders develop a new campaign based on customer behavior. The marketing use cases include understanding customer behavior, optimizing resources and spending, qualifying and prioritizing leads, and retaining customers. Make sure to capture your audiences attention in your business displays with our gratis customizable Projection Model Uses Of Predictive Analytics In Marketing Industry Infographics PDF. These are great for business strategies, office conferences, capital raising or task suggestions. If you desire to acquire more customers for your tech business and ensure they stay satisfied, create your own sales presentation with these plain slides.
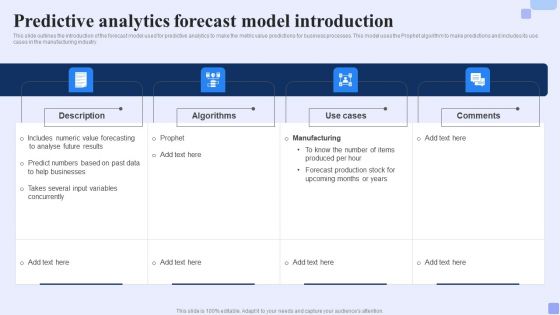
Predictive Analytics Forecast Model Introduction Forward Looking Analysis IT Information PDF
This slide outlines the introduction of the forecast model used for predictive analytics to make the metric value predictions for business processes. This model uses the Prophet algorithm to make predictions and includes its use cases in the manufacturing industry.Make sure to capture your audiences attention in your business displays with our gratis customizable Predictive Analytics Forecast Model Introduction Forward Looking Analysis IT Information PDF. These are great for business strategies, office conferences, capital raising or task suggestions. If you desire to acquire more customers for your tech business and ensure they stay satisfied, create your own sales presentation with these plain slides.
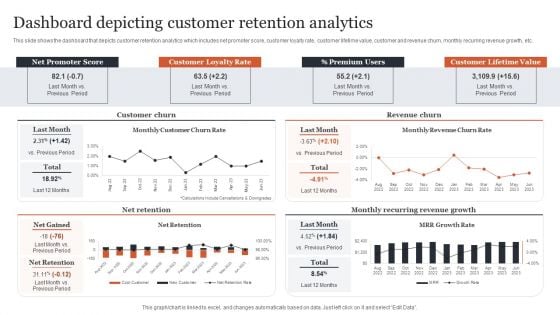
CRM Administration To Reduce Churn Rate Dashboard Depicting Customer Retention Analytics Themes PDF
This slide shows the dashboard that depicts customer retention analytics which includes net promoter score, customer loyalty rate, customer lifetime value, customer and revenue churn, monthly recurring revenue growth, etc. Make sure to capture your audiences attention in your business displays with our gratis customizable CRM Administration To Reduce Churn Rate Dashboard Depicting Customer Retention Analytics Themes PDF. These are great for business strategies, office conferences, capital raising or task suggestions. If you desire to acquire more customers for your tech business and ensure they stay satisfied, create your own sales presentation with these plain slides.
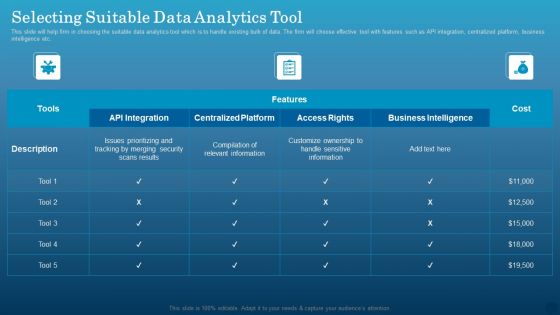
Data Monetization Approach To Drive Business Growth Selecting Suitable Data Analytics Tool Ideas PDF
This slide will help firm in choosing the suitable data analytics tool which is to handle existing bulk of data. The firm will choose effective tool with features such as API integration, centralized platform, business intelligence etc. Make sure to capture your audiences attention in your business displays with our gratis customizable Data Monetization Approach To Drive Business Growth Selecting Suitable Data Analytics Tool Ideas PDF. These are great for business strategies, office conferences, capital raising or task suggestions. If you desire to acquire more customers for your tech business and ensure they stay satisfied, create your own sales presentation with these plain slides.
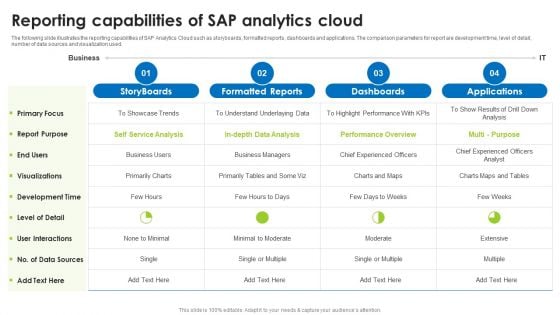
BI Technique For Data Informed Decisions Reporting Capabilities Of Sap Analytics Cloud Demonstration PDF
The following slide illustrates the reporting capabilities of SAP Analytics Cloud such as storyboards, formatted reports, dashboards and applications. The comparison parameters for report are development time, level of detail, number of data sources and visualization used. Make sure to capture your audiences attention in your business displays with our gratis customizable BI Technique For Data Informed Decisions Reporting Capabilities Of Sap Analytics Cloud Demonstration PDF. These are great for business strategies, office conferences, capital raising or task suggestions. If you desire to acquire more customers for your tech business and ensure they stay satisfied, create your own sales presentation with these plain slides.
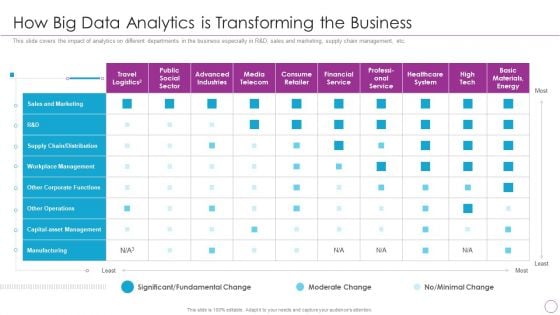
Integration Of Digital Technology In Organization How Big Data Analytics Is Transforming The Business Infographics PDF
This slide covers the impact of analytics on different departments in the business especially in R and D, sales and marketing, supply chain management, etc.Deliver and pitch your topic in the best possible manner with this Integration Of Digital Technology In Organization How Big Data Analytics Is Transforming The Business Infographics PDF Use them to share invaluable insights on Advanced Industries, Consume Retailer, Healthcare System and impress your audience. This template can be altered and modified as per your expectations. So, grab it now.
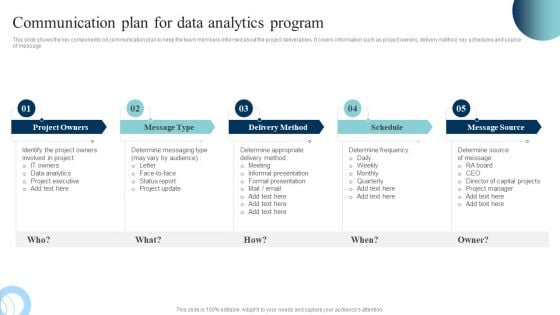
Data Evaluation And Processing Toolkit Communication Plan For Data Analytics Program Inspiration PDF
This slide elaborates the communication plan for translating the data analytics deliverables to the management. Slidegeeks is here to make your presentations a breeze with Data Evaluation And Processing Toolkit Communication Plan For Data Analytics Program Inspiration PDF With our easy-to-use and customizable templates, you can focus on delivering your ideas rather than worrying about formatting. With a variety of designs to choose from, youre sure to find one that suits your needs. And with animations and unique photos, illustrations, and fonts, you can make your presentation pop. So whether youre giving a sales pitch or presenting to the board, make sure to check out Slidegeeks first.
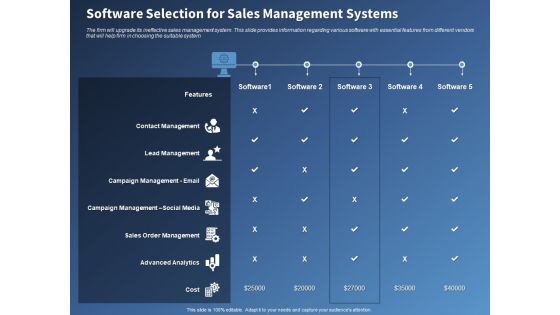
Performance Assessment Sales Initiative Report Software Selection For Sales Management Systems Download
Presenting this set of slides with name performance assessment sales initiative report software selection for sales management systems download. The topics discussed in these slides are management, campaign, analytics, social media, sales. This is a completely editable PowerPoint presentation and is available for immediate download. Download now and impress your audience.
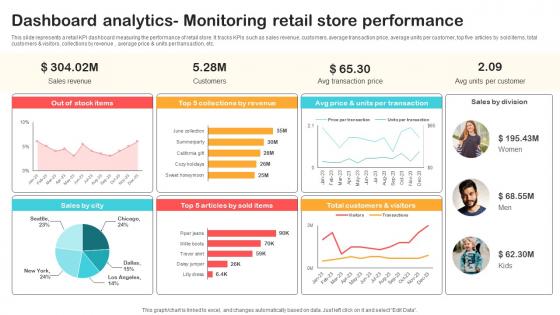
Dashboard Analytics Monitoring Retail Store Performance Optimizing Retail Operations With Digital DT SS V
This slide represents a retail KPI dashboard measuring the performance of retail store. It tracks KPIs such as sales revenue, customers, average transaction price, average units per customer, top five articles by sold items, total customers and visitors, collections by revenue , average price and units per transaction, etc.Are you in need of a template that can accommodate all of your creative concepts This one is crafted professionally and can be altered to fit any style. Use it with Google Slides or PowerPoint. Include striking photographs, symbols, depictions, and other visuals. Fill, move around, or remove text boxes as desired. Test out color palettes and font mixtures. Edit and save your work, or work with colleagues. Download Dashboard Analytics Monitoring Retail Store Performance Optimizing Retail Operations With Digital DT SS V and observe how to make your presentation outstanding. Give an impeccable presentation to your group and make your presentation unforgettable. This slide represents a retail KPI dashboard measuring the performance of retail store. It tracks KPIs such as sales revenue, customers, average transaction price, average units per customer, top five articles by sold items, total customers and visitors, collections by revenue , average price and units per transaction, etc.
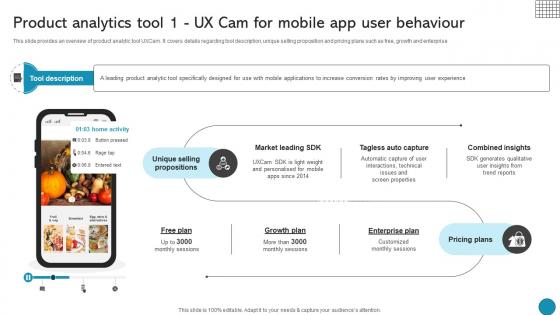
Product Analytics Tool 1 Ux Cam For Mobile App User Driving Business Success Integrating Product
This slide provides an overview of product analytic tool UXCam. It covers details regarding tool description, unique selling proposition and pricing plans such as free, growth and enterprise Slidegeeks is here to make your presentations a breeze with Product Analytics Tool 1 Ux Cam For Mobile App User Driving Business Success Integrating Product With our easy-to-use and customizable templates, you can focus on delivering your ideas rather than worrying about formatting. With a variety of designs to choose from, you are sure to find one that suits your needs. And with animations and unique photos, illustrations, and fonts, you can make your presentation pop. So whether you are giving a sales pitch or presenting to the board, make sure to check out Slidegeeks first This slide provides an overview of product analytic tool UXCam. It covers details regarding tool description, unique selling proposition and pricing plans such as free, growth and enterprise

Government And Public Sector Industry Data Analytics Company Outline Clipart PDF
The following slide highlights the research services offered by Kantar company to the government and public sector industry. It also shows the clients and impact of solutions provided. Make sure to capture your audiences attention in your business displays with our gratis customizable Government And Public Sector Industry Data Analytics Company Outline Clipart PDF These are great for business strategies, office conferences, capital raising or task suggestions. If you desire to acquire more customers for your tech business and ensure they stay satisfied, create your own sales presentation with these plain slides. The following slide highlights the research services offered by Kantar company to the government and public sector industry. It also shows the clients and impact of solutions provided

Current Scenario Analysis Of Big Data Management And Analytics Streamlining Production Ppt Slide
The following slide showcases current scenario analysis of big data management to assess scope of improvement. It includes KPIs such as data accuracy, downtime reduction, etc. Make sure to capture your audiences attention in your business displays with our gratis customizable Current Scenario Analysis Of Big Data Management And Analytics Streamlining Production Ppt Slide These are great for business strategies, office conferences, capital raising or task suggestions. If you desire to acquire more customers for your tech business and ensure they stay satisfied, create your own sales presentation with these plain slides. The following slide showcases current scenario analysis of big data management to assess scope of improvement. It includes KPIs such as data accuracy, downtime reduction, etc.

Timeline To Conduct Statistical Data Analytics For Informed Decision Ppt Presentation
This slide shows the timeline for performing statistical data analysis. The key steps include writing hypothesis and plan research design, collect data from a sample, summarize data with descriptive statistics, test hypotheses, result interpretation, etc. Slidegeeks is here to make your presentations a breeze with Timeline To Conduct Statistical Data Analytics For Informed Decision Ppt Presentation With our easy-to-use and customizable templates, you can focus on delivering your ideas rather than worrying about formatting. With a variety of designs to choose from, you are sure to find one that suits your needs. And with animations and unique photos, illustrations, and fonts, you can make your presentation pop. So whether you are giving a sales pitch or presenting to the board, make sure to check out Slidegeeks first This slide shows the timeline for performing statistical data analysis. The key steps include writing hypothesis and plan research design, collect data from a sample, summarize data with descriptive statistics, test hypotheses, result interpretation, etc.

Best Practices For Implementing Prescriptive Developing Strategic Insights Using Big Data Analytics SS V
This slide showcases tips which can be adopted for leveraging prescriptive analytics techniques for driving business outcomes. It provides information regarding cost analysis, data quality and advanced analytics tools. Slidegeeks is here to make your presentations a breeze with Best Practices For Implementing Prescriptive Developing Strategic Insights Using Big Data Analytics SS V With our easy-to-use and customizable templates, you can focus on delivering your ideas rather than worrying about formatting. With a variety of designs to choose from, you are sure to find one that suits your needs. And with animations and unique photos, illustrations, and fonts, you can make your presentation pop. So whether you are giving a sales pitch or presenting to the board, make sure to check out Slidegeeks first This slide showcases tips which can be adopted for leveraging prescriptive analytics techniques for driving business outcomes. It provides information regarding cost analysis, data quality and advanced analytics tools.
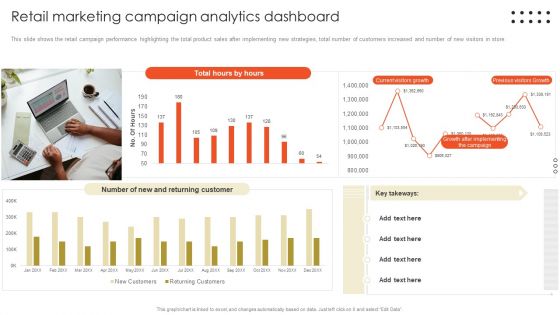
Retail Marketing Campaign Effective Techniques Retail Marketing Campaign Analytics Dashboard Topics PDF
This slide shows the retail campaign performance highlighting the total product sales after implementing new strategies, total number of customers increased and number of new visitors in store. The best PPT templates are a great way to save time, energy, and resources. Slidegeeks have 100 percent editable powerpoint slides making them incredibly versatile. With these quality presentation templates, you can create a captivating and memorable presentation by combining visually appealing slides and effectively communicating your message. Download Retail Marketing Campaign Effective Techniques Retail Marketing Campaign Analytics Dashboard Topics PDF from Slidegeeks and deliver a wonderful presentation.
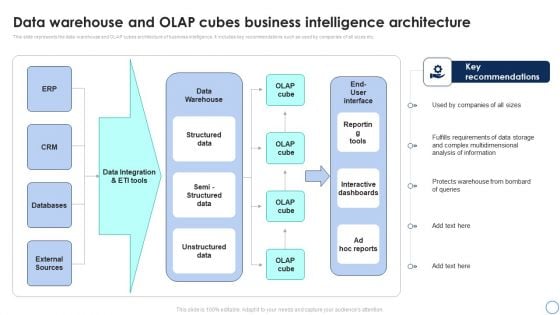
Business Analytics Application Data Warehouse And Olap Cubes Business Intelligence Introduction PDF
This slide represents the data warehouse and OLAP cubes architecture of business intelligence. It includes key recommendations such as used by companies of all sizes etc. Make sure to capture your audiences attention in your business displays with our gratis customizable Business Analytics Application Data Warehouse And Olap Cubes Business Intelligence Introduction PDF. These are great for business strategies, office conferences, capital raising or task suggestions. If you desire to acquire more customers for your tech business and ensure they stay satisfied, create your own sales presentation with these plain slides.
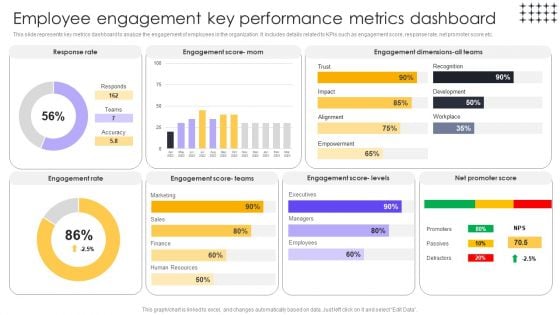
Tools For HR Business Analytics Employee Engagement Key Performance Metrics Brochure PDF
This slide represents key metrics dashboard to analyze the engagement of employees in the organization. It includes details related to KPIs such as engagement score, response rate, net promoter score etc. Make sure to capture your audiences attention in your business displays with our gratis customizable Tools For HR Business Analytics Employee Engagement Key Performance Metrics Brochure PDF. These are great for business strategies, office conferences, capital raising or task suggestions. If you desire to acquire more customers for your tech business and ensure they stay satisfied, create your own sales presentation with these plain slides.
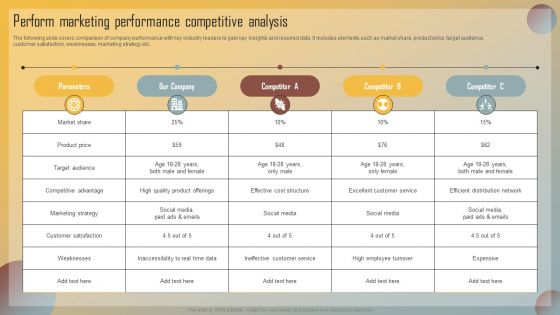
Guide For Marketing Analytics To Improve Decisions Perform Marketing Performance Competitive Analysis Sample PDF
The following slide covers comparison of company performance with key industry leaders to gain key insights and required data. It includes elements such as market share, product price, target audience, customer satisfaction, weaknesses, marketing strategy etc. Make sure to capture your audiences attention in your business displays with our gratis customizable Guide For Marketing Analytics To Improve Decisions Perform Marketing Performance Competitive Analysis Sample PDF. These are great for business strategies, office conferences, capital raising or task suggestions. If you desire to acquire more customers for your tech business and ensure they stay satisfied, create your own sales presentation with these plain slides.
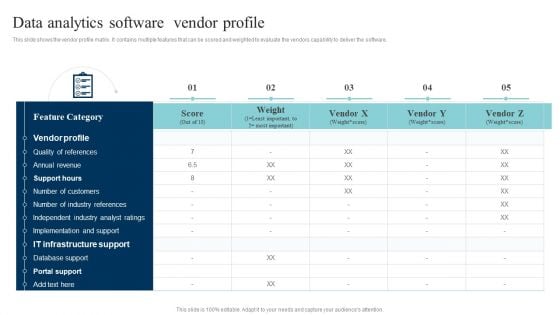
Data Evaluation And Processing Toolkit Data Analytics Software Vendor Profile Background PDF
This slide shows the vendor profile matrix. It contains multiple features that can be scored and weighted to evaluate the vendors capability to deliver the software. Make sure to capture your audiences attention in your business displays with our gratis customizable Data Evaluation And Processing Toolkit Data Analytics Software Vendor Profile Background PDF. These are great for business strategies, office conferences, capital raising or task suggestions. If you desire to acquire more customers for your tech business and ensure they stay satisfied, create your own sales presentation with these plain slides.
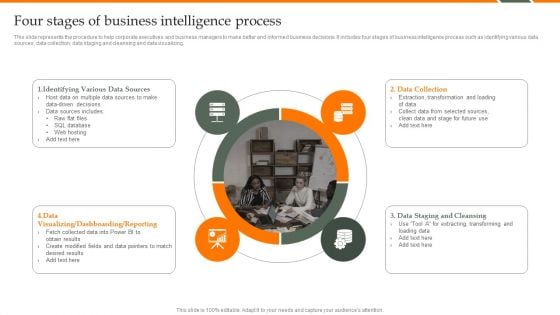
Human Resource Analytics Four Stages Of Business Intelligence Process Clipart PDF
This slide represents the procedure to help corporate executives and business managers to make better and informed business decisions. It includes four stages of business intelligence process such as identifying various data sources, data collection, data staging and cleansing and data visualizing. Make sure to capture your audiences attention in your business displays with our gratis customizable Human Resource Analytics Four Stages Of Business Intelligence Process Clipart PDF. These are great for business strategies, office conferences, capital raising or task suggestions. If you desire to acquire more customers for your tech business and ensure they stay satisfied, create your own sales presentation with these plain slides.
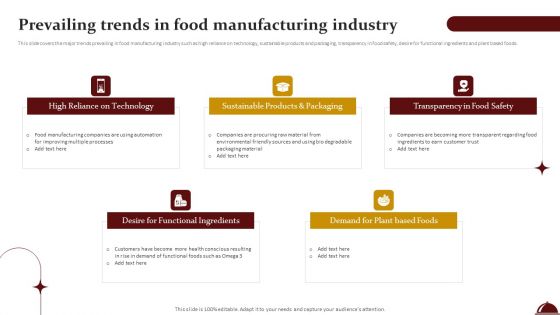
Food Processing Industry Latest Insights Trends And Analytics Prevailing Trends In Food Manufacturing Industry Structure PDF
This slide covers the major trends prevailing in food manufacturing industry such as high reliance on technology, sustainable products and packaging, transparency in food safety, desire for functional ingredients and plant based foods. Make sure to capture your audiences attention in your business displays with our gratis customizable Food Processing Industry Latest Insights Trends And Analytics Prevailing Trends In Food Manufacturing Industry Structure PDF. These are great for business strategies, office conferences, capital raising or task suggestions. If you desire to acquire more customers for your tech business and ensure they stay satisfied, create your own sales presentation with these plain slides.
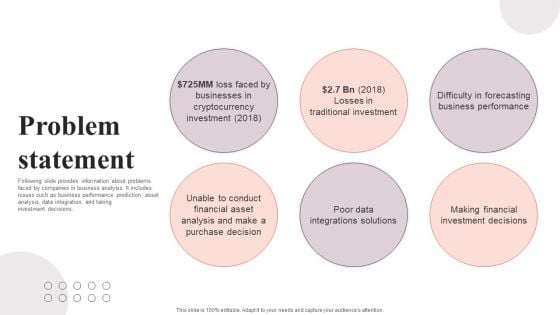
Financial Analytics Solution Investor Funding Elevator Pitch Deck Problem Statement Formats PDF
Following slide provides information about problems faced by companies in business analysis. It includes issues such as business performance prediction, asset analysis, data integration, and taking investment decisions. Make sure to capture your audiences attention in your business displays with our gratis customizable Financial Analytics Solution Investor Funding Elevator Pitch Deck Problem Statement Formats PDF. These are great for business strategies, office conferences, capital raising or task suggestions. If you desire to acquire more customers for your tech business and ensure they stay satisfied, create your own sales presentation with these plain slides.
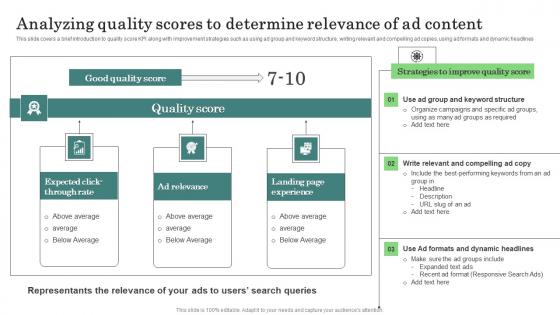
Analyzing Quality Scores Determine Major Promotional Analytics Future Trends Mockup Pdf
This slide covers a brief introduction to quality score KPI along with improvement strategies such as using ad group and keyword structure, writing relevant and compelling ad copies, using ad formats and dynamic headlines Slidegeeks is here to make your presentations a breeze with Analyzing Quality Scores Determine Major Promotional Analytics Future Trends Mockup Pdf With our easy to use and customizable templates, you can focus on delivering your ideas rather than worrying about formatting. With a variety of designs to choose from, you are sure to find one that suits your needs. And with animations and unique photos, illustrations, and fonts, you can make your presentation pop. So whether you are giving a sales pitch or presenting to the board, make sure to check out Slidegeeks first This slide covers a brief introduction to quality score KPI along with improvement strategies such as using ad group and keyword structure, writing relevant and compelling ad copies, using ad formats and dynamic headlines
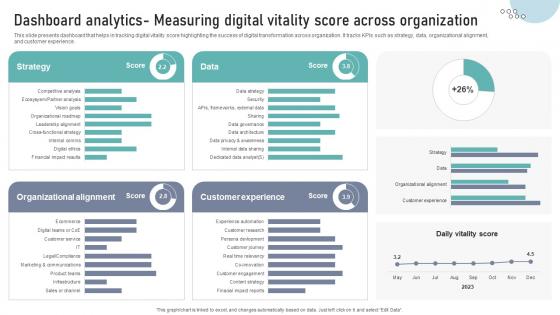
Dashboard Analytics Measuring Digital Vitality Score Across Organization DT SS V
This slide presents dashboard that helps in tracking digital vitality score highlighting the success of digital transformation across organization. It tracks KPIs such as strategy, data, organizational alignment,and customer experience.Make sure to capture your audiences attention in your business displays with our gratis customizable Dashboard Analytics Measuring Digital Vitality Score Across Organization DT SS V. These are great for business strategies, office conferences, capital raising or task suggestions. If you desire to acquire more customers for your tech business and ensure they stay satisfied, create your own sales presentation with these plain slides. This slide presents dashboard that helps in tracking digital vitality score highlighting the success of digital transformation across organization. It tracks KPIs such as strategy, data, organizational alignment,and customer experience.
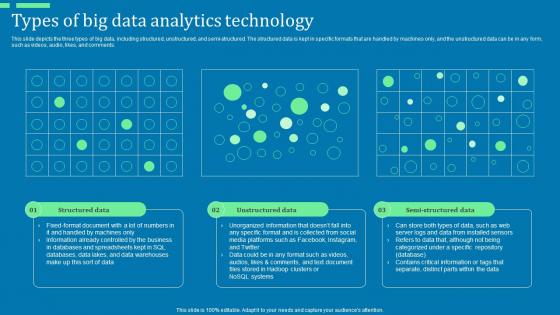
Types Of Big Data Analytics Technology Advanced Tools For Hyperautomation Ppt File Graphics Pictures Pdf
This slide depicts the three types of big data, including structured, unstructured, and semi-structured. The structured data is kept in specific formats that are handled by machines only, and the unstructured data can be in any form, such as videos, audio, likes, and comments. Make sure to capture your audiences attention in your business displays with our gratis customizable Types Of Big Data Analytics Technology Advanced Tools For Hyperautomation Ppt File Graphics Pictures Pdf. These are great for business strategies, office conferences, capital raising or task suggestions. If you desire to acquire more customers for your tech business and ensure they stay satisfied, create your own sales presentation with these plain slides. This slide depicts the three types of big data, including structured, unstructured, and semi-structured. The structured data is kept in specific formats that are handled by machines only, and the unstructured data can be in any form, such as videos, audio, likes, and comments.
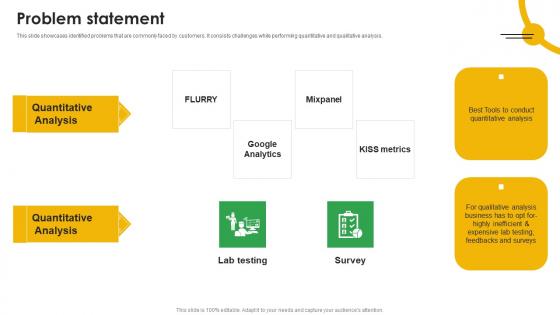
Problem Statement Mobile App Analytics Company Fund Raising Pitch Deck Professional Pdf
This slide showcases identified problems that are commonly faced by customers. It consists challenges while performing quantitative and qualitative analysis. Slidegeeks is here to make your presentations a breeze with Problem Statement Mobile App Analytics Company Fund Raising Pitch Deck Professional Pdf With our easy to use and customizable templates, you can focus on delivering your ideas rather than worrying about formatting. With a variety of designs to choose from, you are sure to find one that suits your needs. And with animations and unique photos, illustrations, and fonts, you can make your presentation pop. So whether you are giving a sales pitch or presenting to the board, make sure to check out Slidegeeks first This slide showcases identified problems that are commonly faced by customers. It consists challenges while performing quantitative and qualitative analysis.
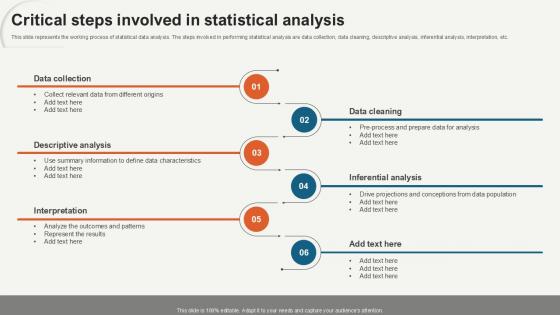
Critical Steps Involved In Statistical Data Analytics For Informed Decision Ppt Presentation
This slide represents the working process of statistical data analysis. The steps involved in performing statistical analysis are data collection, data cleaning, descriptive analysis, inferential analysis, interpretation, etc. Slidegeeks is here to make your presentations a breeze with Critical Steps Involved In Statistical Data Analytics For Informed Decision Ppt Presentation With our easy-to-use and customizable templates, you can focus on delivering your ideas rather than worrying about formatting. With a variety of designs to choose from, you are sure to find one that suits your needs. And with animations and unique photos, illustrations, and fonts, you can make your presentation pop. So whether you are giving a sales pitch or presenting to the board, make sure to check out Slidegeeks first This slide represents the working process of statistical data analysis. The steps involved in performing statistical analysis are data collection, data cleaning, descriptive analysis, inferential analysis, interpretation, etc.
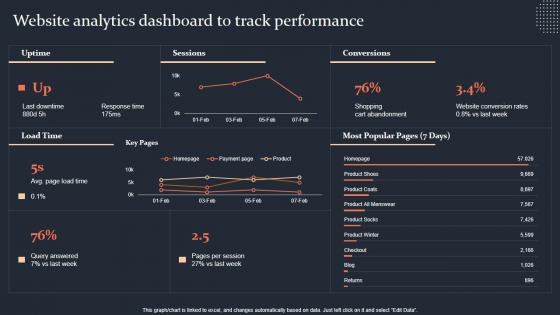
Website Analytics Dashboard To Track Performance Step By Step Guide Inspiration PDF
This graph chart is linked to excel, and changes automatically based on data. Just left click on it and select Edit Data. Slidegeeks is here to make your presentations a breeze with Website Analytics Dashboard To Track Performance Step By Step Guide Inspiration PDF With our easy-to-use and customizable templates, you can focus on delivering your ideas rather than worrying about formatting. With a variety of designs to choose from, you are sure to find one that suits your needs. And with animations and unique photos, illustrations, and fonts, you can make your presentation pop. So whether you are giving a sales pitch or presenting to the board, make sure to check out Slidegeeks first This graph chart is linked to excel, and changes automatically based on data. Just left click on it and select Edit Data.
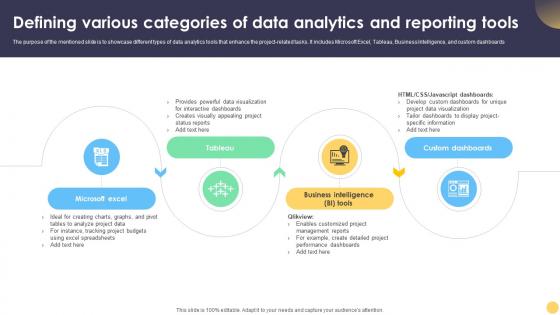
Digital Project Management Strategies Defining Various Categories Of Data Analytics And Reporting
The purpose of the mentioned slide is to showcase different types of data analytics tools that enhance the project-related tasks. It includes Microsoft Excel, Tableau, Business Intelligence, and custom dashboards. Slidegeeks is here to make your presentations a breeze with Digital Project Management Strategies Defining Various Categories Of Data Analytics And Reporting With our easy-to-use and customizable templates, you can focus on delivering your ideas rather than worrying about formatting. With a variety of designs to choose from, you are sure to find one that suits your needs. And with animations and unique photos, illustrations, and fonts, you can make your presentation pop. So whether you are giving a sales pitch or presenting to the board, make sure to check out Slidegeeks first The purpose of the mentioned slide is to showcase different types of data analytics tools that enhance the project-related tasks. It includes Microsoft Excel, Tableau, Business Intelligence, and custom dashboards.
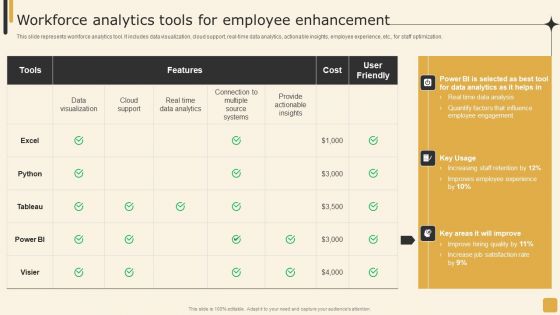
Workforce Analytics Tools For Employee Enhancement Employee Performance Management Tactics Graphics PDF
This slide represents workforce analytics tool. It includes data visualization, cloud support, real-time data analytics, actionable insights, employee experience, etc., for staff optimization.Slidegeeks is here to make your presentations a breeze with Workforce Analytics Tools For Employee Enhancement Employee Performance Management Tactics Graphics PDF With our easy-to-use and customizable templates, you can focus on delivering your ideas rather than worrying about formatting. With a variety of designs to choose from, you are sure to find one that suits your needs. And with animations and unique photos, illustrations, and fonts, you can make your presentation pop. So whether you are giving a sales pitch or presenting to the board, make sure to check out Slidegeeks first.

Information Analysis And BI Playbook The Escalating Value Of Data And Analytics Download PDF
This template covers the facts about bigdata, business intelligence and data analytics. It also depicts that enterprise data and analytics solutions will drive growth and revenue, when optimized for different businesses. Slidegeeks is here to make your presentations a breeze with Information Analysis And BI Playbook The Escalating Value Of Data And Analytics Download PDF With our easy to use and customizable templates, you can focus on delivering your ideas rather than worrying about formatting. With a variety of designs to choose from, you are sure to find one that suits your needs. And with animations and unique photos, illustrations, and fonts, you can make your presentation pop. So whether you are giving a sales pitch or presenting to the board, make sure to check out Slidegeeks first.
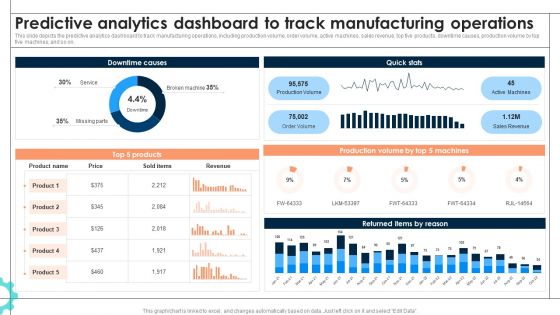
Intelligent Manufacturing Predictive Analytics Dashboard To Track Manufacturing Operations Information PDF
This slide depicts the predictive analytics dashboard to track manufacturing operations, including production volume, order volume, active machines, sales revenue, top five products, downtime causes, production volume by top five machines, and so on. If you are looking for a format to display your unique thoughts, then the professionally designed Intelligent Manufacturing Predictive Analytics Dashboard To Track Manufacturing Operations Information PDF is the one for you. You can use it as a Google Slides template or a PowerPoint template. Incorporate impressive visuals, symbols, images, and other charts. Modify or reorganize the text boxes as you desire. Experiment with shade schemes and font pairings. Alter, share or cooperate with other people on your work. Download Intelligent Manufacturing Predictive Analytics Dashboard To Track Manufacturing Operations Information PDF and find out how to give a successful presentation. Present a perfect display to your team and make your presentation unforgettable.
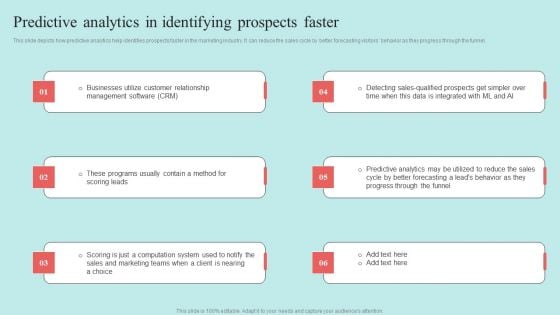
Predictive Data Model Predictive Analytics In Identifying Prospects Faster Pictures PDF
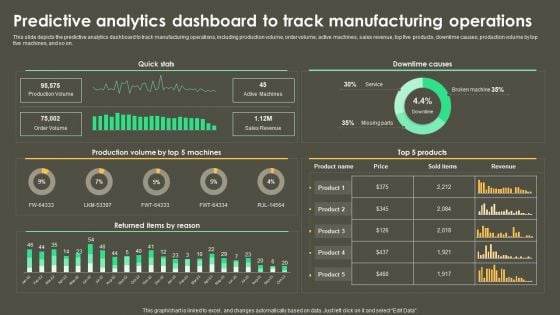
Iot Integration In Manufacturing Predictive Analytics Dashboard To Track Manufacturing Operations Background PDF
This slide depicts the predictive analytics dashboard to track manufacturing operations, including production volume, order volume, active machines, sales revenue, top five products, downtime causes, production volume by top five machines, and so on. If you are looking for a format to display your unique thoughts, then the professionally designed Iot Integration In Manufacturing Predictive Analytics Dashboard To Track Manufacturing Operations Background PDF is the one for you. You can use it as a Google Slides template or a PowerPoint template. Incorporate impressive visuals, symbols, images, and other charts. Modify or reorganize the text boxes as you desire. Experiment with shade schemes and font pairings. Alter, share or cooperate with other people on your work. Download Iot Integration In Manufacturing Predictive Analytics Dashboard To Track Manufacturing Operations Background PDF and find out how to give a successful presentation. Present a perfect display to your team and make your presentation unforgettable.
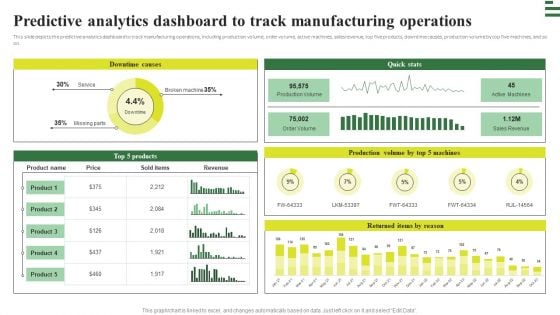
Transforming Manufacturing With Automation Predictive Analytics Dashboard To Track Diagrams PDF
This slide depicts the predictive analytics dashboard to track manufacturing operations, including production volume, order volume, active machines, sales revenue, top five products, downtime causes, production volume by top five machines, and so on. Get a simple yet stunning designed Transforming Manufacturing With Automation Predictive Analytics Dashboard To Track Diagrams PDF. It is the best one to establish the tone in your meetings. It is an excellent way to make your presentations highly effective. So, download this PPT today from Slidegeeks and see the positive impacts. Our easy to edit Transforming Manufacturing With Automation Predictive Analytics Dashboard To Track Diagrams PDF can be your go to option for all upcoming conferences and meetings. So, what are you waiting for Grab this template today.
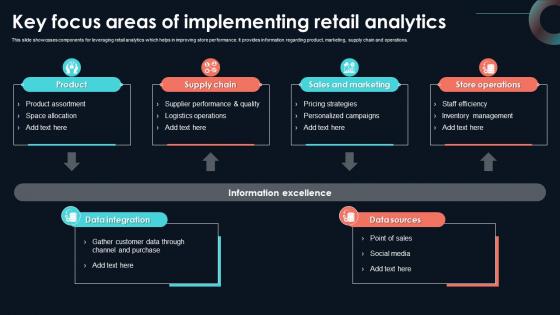
Key Focus Areas Of Implementing Retail Developing Strategic Insights Using Big Data Analytics SS V
This slide showcases components for leveraging retail analytics which helps in improving store performance. It provides information regarding product, marketing, supply chain and operations. Slidegeeks is here to make your presentations a breeze with Key Focus Areas Of Implementing Retail Developing Strategic Insights Using Big Data Analytics SS V With our easy-to-use and customizable templates, you can focus on delivering your ideas rather than worrying about formatting. With a variety of designs to choose from, you are sure to find one that suits your needs. And with animations and unique photos, illustrations, and fonts, you can make your presentation pop. So whether you are giving a sales pitch or presenting to the board, make sure to check out Slidegeeks first This slide showcases components for leveraging retail analytics which helps in improving store performance. It provides information regarding product, marketing, supply chain and operations.
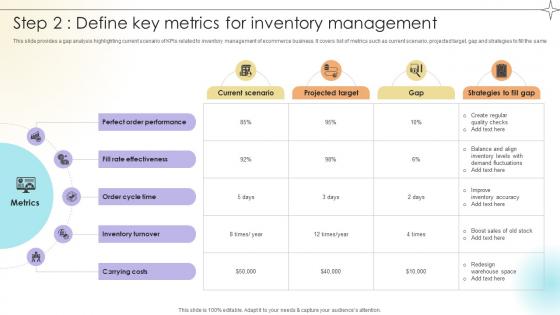
Step 2 Define Key Metrics For Inventory Management Data Analytics SS V
This slide provides a gap analysis highlighting current scenario of KPIs related to inventory management of ecommerce business. It covers list of metrics such as current scenario, projected target, gap and strategies to fill the same.Make sure to capture your audiences attention in your business displays with our gratis customizable Step 2 Define Key Metrics For Inventory Management Data Analytics SS V. These are great for business strategies, office conferences, capital raising or task suggestions. If you desire to acquire more customers for your tech business and ensure they stay satisfied, create your own sales presentation with these plain slides. This slide provides a gap analysis highlighting current scenario of KPIs related to inventory management of ecommerce business. It covers list of metrics such as current scenario, projected target, gap and strategies to fill the same.
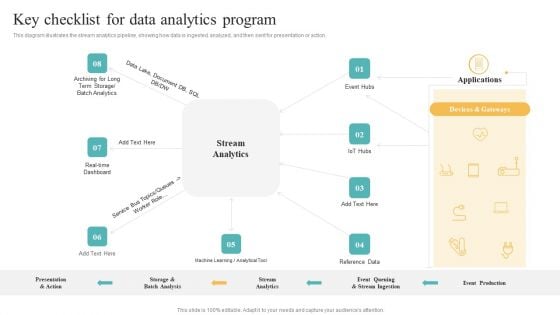
Transformation Toolkit Competitive Intelligence Information Analysis Key Checklist For Data Analytics Program Action Guidelines PDF
This diagram illustrates the stream analytics pipeline, showing how data is ingested, analyzed, and then sent for presentation or action. Slidegeeks is here to make your presentations a breeze with Transformation Toolkit Competitive Intelligence Information Analysis Key Checklist For Data Analytics Program Action Guidelines PDF With our easy to use and customizable templates, you can focus on delivering your ideas rather than worrying about formatting. With a variety of designs to choose from, you are sure to find one that suits your needs. And with animations and unique photos, illustrations, and fonts, you can make your presentation pop. So whether you are giving a sales pitch or presenting to the board, make sure to check out Slidegeeks first.
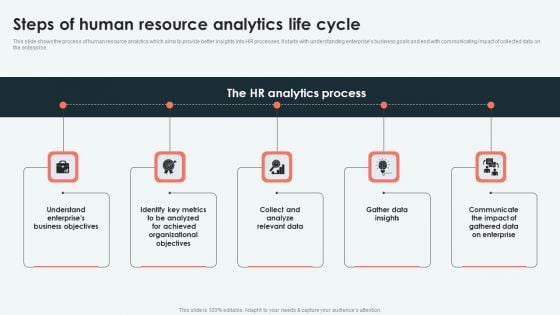
Analyzing And Deploying Steps Of Human Resource Analytics Life Cycle Clipart PDF
This slide shows the process of human resource analytics which aims to provide better insights into HR processes. It starts with understanding enterprises business goals and end with communicating impact of collected data on the enterprise. Slidegeeks is here to make your presentations a breeze with Analyzing And Deploying Steps Of Human Resource Analytics Life Cycle Clipart PDF With our easy-to-use and customizable templates, you can focus on delivering your ideas rather than worrying about formatting. With a variety of designs to choose from, youre sure to find one that suits your needs. And with animations and unique photos, illustrations, and fonts, you can make your presentation pop. So whether youre giving a sales pitch or presenting to the board, make sure to check out Slidegeeks first.

Techniques To Decrease Customer Dashboard Depicting Customer Retention Analytics Microsoft PDF
This slide shows the dashboard that depicts customer retention analytics which includes net promoter score, customer loyalty rate, customer lifetime value, customer and revenue churn, monthly recurring revenue growth, etc. Slidegeeks is here to make your presentations a breeze with Techniques To Decrease Customer Dashboard Depicting Customer Retention Analytics Microsoft PDF With our easy-to-use and customizable templates, you can focus on delivering your ideas rather than worrying about formatting. With a variety of designs to choose from, youre sure to find one that suits your needs. And with animations and unique photos, illustrations, and fonts, you can make your presentation pop. So whether youre giving a sales pitch or presenting to the board, make sure to check out Slidegeeks first.

BI Technique For Data Informed Decisions Sap Analytics Cloud Impact On Business Performance Brochure PDF
The purpose of the following slide is to illustrate the impact the SAP Analytics Cloud on business performance in terms of fact based decision making, simplified financial planning, accurate forecasting and collaborative planning. Slidegeeks is here to make your presentations a breeze with BI Technique For Data Informed Decisions Sap Analytics Cloud Impact On Business Performance Brochure PDF With our easy to use and customizable templates, you can focus on delivering your ideas rather than worrying about formatting. With a variety of designs to choose from, you are sure to find one that suits your needs. And with animations and unique photos, illustrations, and fonts, you can make your presentation pop. So whether you are giving a sales pitch or presenting to the board, make sure to check out Slidegeeks first.
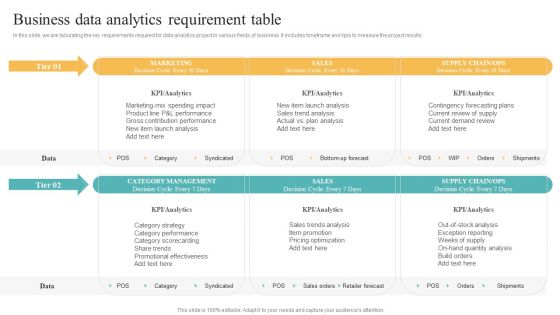
Transformation Toolkit Competitive Intelligence Information Analysis Business Data Analytics Requirement Table Elements PDF
In this slide, we are tabulating the key requirements required for data analytics project in various fields of business. It includes timeframe and kpis to measure the project results. Slidegeeks is here to make your presentations a breeze with Transformation Toolkit Competitive Intelligence Information Analysis Business Data Analytics Requirement Table Elements PDF With our easy to use and customizable templates, you can focus on delivering your ideas rather than worrying about formatting. With a variety of designs to choose from, you are sure to find one that suits your needs. And with animations and unique photos, illustrations, and fonts, you can make your presentation pop. So whether you are giving a sales pitch or presenting to the board, make sure to check out Slidegeeks first.
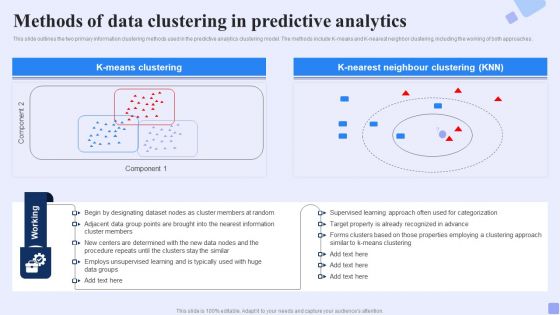
Methods Of Data Clustering In Predictive Analytics Forward Looking Analysis IT Professional PDF
This slide outlines the two primary information clustering methods used in the predictive analytics clustering model. The methods include K-means and K-nearest neighbor clustering, including the working of both approaches.Slidegeeks is here to make your presentations a breeze with Methods Of Data Clustering In Predictive Analytics Forward Looking Analysis IT Professional PDF With our easy-to-use and customizable templates, you can focus on delivering your ideas rather than worrying about formatting. With a variety of designs to choose from, you are sure to find one that suits your needs. And with animations and unique photos, illustrations, and fonts, you can make your presentation pop. So whether you are giving a sales pitch or presenting to the board, make sure to check out Slidegeeks first.
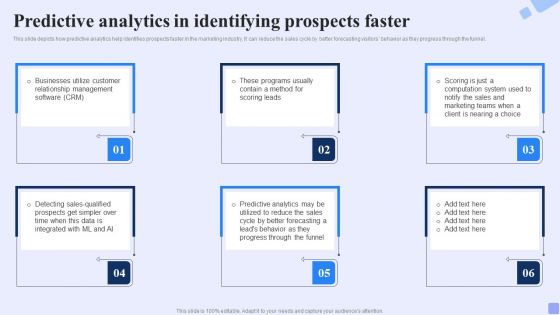
Predictive Analytics In Identifying Prospects Faster Forward Looking Analysis IT Ideas PDF
This slide depicts how predictive analytics help identifies prospects faster in the marketing industry. It can reduce the sales cycle by better forecasting visitors behavior as they progress through the funnel.Welcome to our selection of the Predictive Analytics In Identifying Prospects Faster Forward Looking Analysis IT Ideas PDF. These are designed to help you showcase your creativity and bring your sphere to life. Planning and Innovation are essential for any business that is just starting out. This collection contains the designs that you need for your everyday presentations. All of our PowerPoints are 100precent editable, so you can customize them to suit your needs. This multi-purpose template can be used in various situations. Grab these presentation templates today.


 Continue with Email

 Home
Home


