Sales Analytics
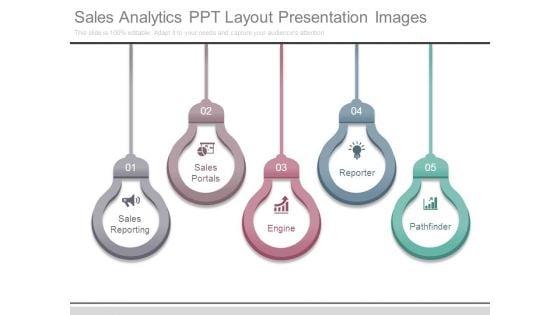
Sales Analytics Ppt Layout Presentation Images
This is a sales analytics ppt layout presentation images. This is a five stage process. The stages in this process are sales reporting, sales portals, engine, reporter, pathfinder.
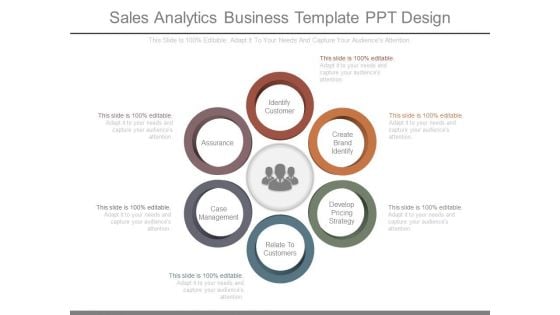
Sales Analytics Business Template Ppt Design
This is a sales analytics business template ppt design. This is a six stage process. The stages in this process are identify customer, create brand identify, develop pricing strategy, relate to customers, case management, assurance.
Product Wise Sales Analytics Sample Of Ppt Presentation
This is a product wise sales analytics sample of ppt presentation. This is a five stage process. The stages in this process are sales, presentation, management, business, marketing.
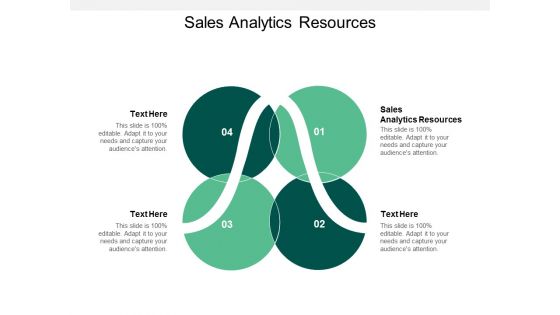
Sales Analytics Resources Ppt PowerPoint Presentation Gallery Visuals Cpb
Presenting this set of slides with name sales analytics resources ppt powerpoint presentation gallery visuals cpb. This is an editable Powerpoint four stages graphic that deals with topics like sales analytics resources to help convey your message better graphically. This product is a premium product available for immediate download and is 100 percent editable in Powerpoint. Download this now and use it in your presentations to impress your audience.
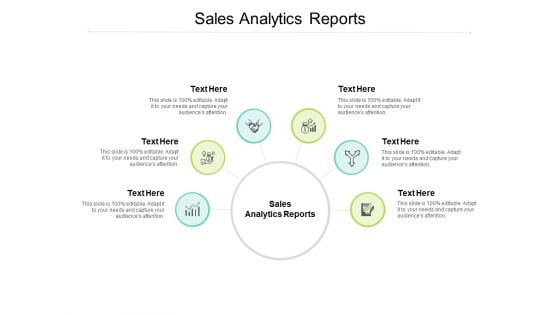
Sales Analytics Reports Ppt PowerPoint Presentation Gallery Cpb
Presenting this set of slides with name sales analytics reports ppt powerpoint presentation gallery cpb. This is an editable Powerpoint six stages graphic that deals with topics like sales analytics reports to help convey your message better graphically. This product is a premium product available for immediate download and is 100 percent editable in Powerpoint. Download this now and use it in your presentations to impress your audience.
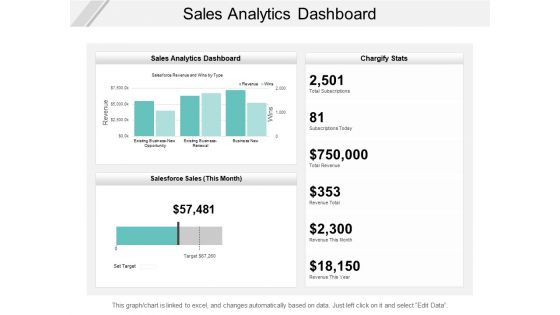
Sales Analytics Dashboard Ppt PowerPoint Presentation Outline Diagrams
Presenting this set of slides with name sales analytics dashboard ppt powerpoint presentation outline diagrams. The topics discussed in these slides are buzz marketing, process, strategy. This is a completely editable PowerPoint presentation and is available for immediate download. Download now and impress your audience.
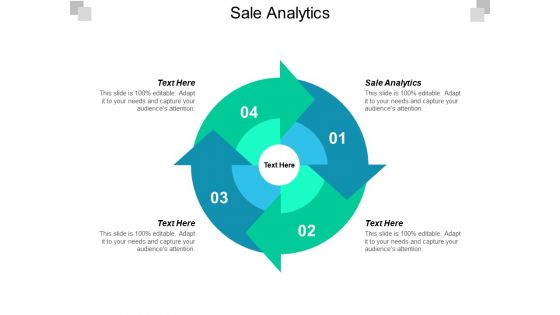
Sale Analytics Ppt PowerPoint Presentation Ideas Portrait Cpb
This is a sale analytics ppt powerpoint presentation ideas portrait cpb. This is a four stage process. The stages in this process are sale analytics.
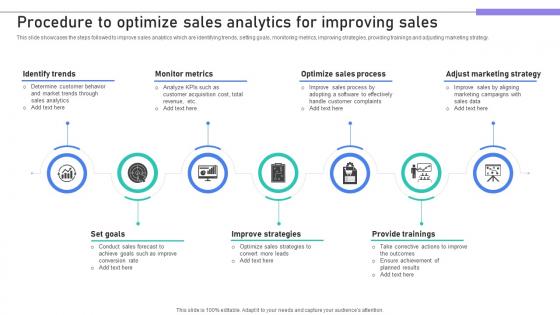
Building Stronger Customer Procedure To Optimize Sales Analytics For Improving Sales SA SS V
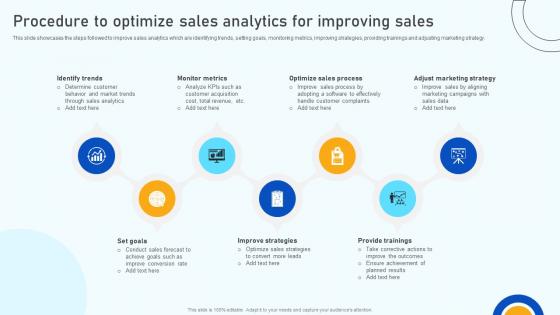
This slide showcases the steps followed to improve sales analytics which are identifying trends, setting goals, monitoring metrics, improving strategies, providing trainings and adjusting marketing strategy. This Building Stronger Customer Procedure To Optimize Sales Analytics For Improving Sales SA SS V from Slidegeeks makes it easy to present information on your topic with precision. It provides customization options, so you can make changes to the colors, design, graphics, or any other component to create a unique layout. It is also available for immediate download, so you can begin using it right away. Slidegeeks has done good research to ensure that you have everything you need to make your presentation stand out. Make a name out there for a brilliant performance. This slide showcases the steps followed to improve sales analytics which are identifying trends, setting goals, monitoring metrics, improving strategies, providing trainings and adjusting marketing strategy.
Digital Marketing Strategies Procedure To Optimize Sales Analytics For Improving Sales SA SS V
This slide showcases the steps followed to improve sales analytics which are identifying trends, setting goals, monitoring metrics, improving strategies, providing trainings and adjusting marketing strategy. This Digital Marketing Strategies Procedure To Optimize Sales Analytics For Improving Sales SA SS V from Slidegeeks makes it easy to present information on your topic with precision. It provides customization options, so you can make changes to the colors, design, graphics, or any other component to create a unique layout. It is also available for immediate download, so you can begin using it right away. Slidegeeks has done good research to ensure that you have everything you need to make your presentation stand out. Make a name out there for a brilliant performance. This slide showcases the steps followed to improve sales analytics which are identifying trends, setting goals, monitoring metrics, improving strategies, providing trainings and adjusting marketing strategy.

Sales Analytics Leaderboard Dashboard Ppt PowerPoint Presentation Infographic Template Templates PDF
Presenting this set of slides with name sales analytics leaderboard dashboard ppt powerpoint presentation infographic template templates pdf. The topics discussed in these slides are top performers, deal size, sales analytics, leaderboard dashboard. This is a completely editable PowerPoint presentation and is available for immediate download. Download now and impress your audience.
Sales Analytics For Forecasting And Planning Icon Ppt Powerpoint Presentation Show Pdf
Presenting sales analytics for forecasting and planning icon ppt powerpoint presentation show pdf to dispense important information. This template comprises three stages. It also presents valuable insights into the topics including sales analytics for forecasting and planning icon. This is a completely customizable PowerPoint theme that can be put to use immediately. So, download it and address the topic impactfully.
Step 4 Apply Predictive Analytics To Forecast Sales Data Analytics SS V
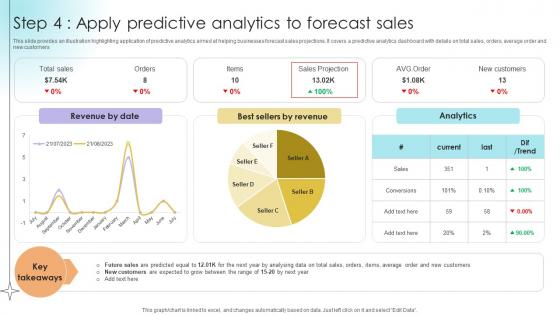
This slide provides an illustration highlighting application of predictive analytics aimed at helping businesses forecast sales projections. It covers a predictive analytics dashboard with details on total sales, orders, average order and new customers.Coming up with a presentation necessitates that the majority of the effort goes into the content and the message you intend to convey. The visuals of a PowerPoint presentation can only be effective if it supplements and supports the story that is being told. Keeping this in mind our experts created Step 4 Apply Predictive Analytics To Forecast Sales Data Analytics SS V to reduce the time that goes into designing the presentation. This way, you can concentrate on the message while our designers take care of providing you with the right template for the situation. This slide provides an illustration highlighting application of predictive analytics aimed at helping businesses forecast sales projections. It covers a predictive analytics dashboard with details on total sales, orders, average order and new customers.
Prescriptive Analytics Dashboard To Track Website Sales Data Analytics SS V
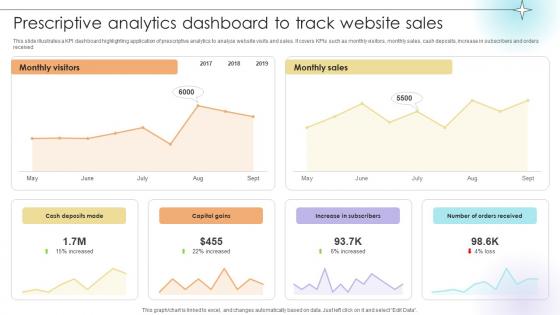
This slide illustrates a KPI dashboard highlighting application of prescriptive analytics to analyze website visits and sales. It covers KPIs such as monthly visitors, monthly sales, cash deposits, increase in subscribers and orders received.This modern and well-arranged Prescriptive Analytics Dashboard To Track Website Sales Data Analytics SS V provides lots of creative possibilities. It is very simple to customize and edit with the Powerpoint Software. Just drag and drop your pictures into the shapes. All facets of this template can be edited with Powerpoint, no extra software is necessary. Add your own material, put your images in the places assigned for them, adjust the colors, and then you can show your slides to the world, with an animated slide included. This slide illustrates a KPI dashboard highlighting application of prescriptive analytics to analyze website visits and sales. It covers KPIs such as monthly visitors, monthly sales, cash deposits, increase in subscribers and orders received.
Manpower Sales And Productivity Analytics Dashboard Icon Download PDF
Presenting Manpower Sales And Productivity Analytics Dashboard Icon Download PDF to dispense important information. This template comprises four stages. It also presents valuable insights into the topics including Manpower, Sales And Productivity, Analytics Dashboard, Icon. This is a completely customizable PowerPoint theme that can be put to use immediately. So, download it and address the topic impactfully.
Sales And Marketing Analytics Diagram Powerpoint Slide Deck Samples
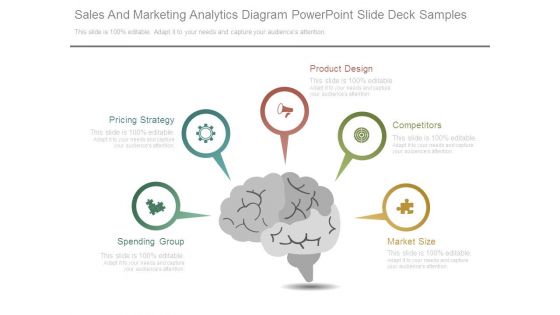
This is a sales and marketing analytics diagram powerpoint slide deck samples. This is a five stage process. The stages in this process are spending group, pricing strategy, product design, competitors, market size.
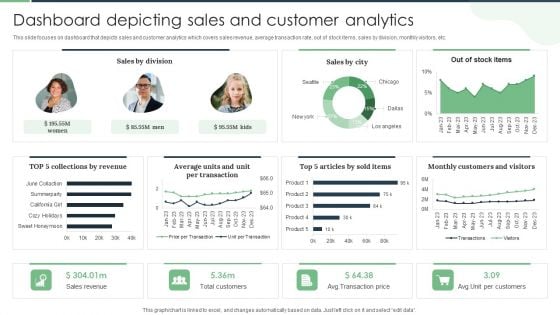
Dashboard Depicting Sales And Customer Analytics Professional PDF
This slide focuses on dashboard that depicts sales and customer analytics which covers sales revenue, average transaction rate, out of stock items, sales by division, monthly visitors, etc. Make sure to capture your audiences attention in your business displays with our gratis customizable Dashboard Depicting Sales And Customer Analytics Professional PDF. These are great for business strategies, office conferences, capital raising or task suggestions. If you desire to acquire more customers for your tech business and ensure they stay satisfied, create your own sales presentation with these plain slides.
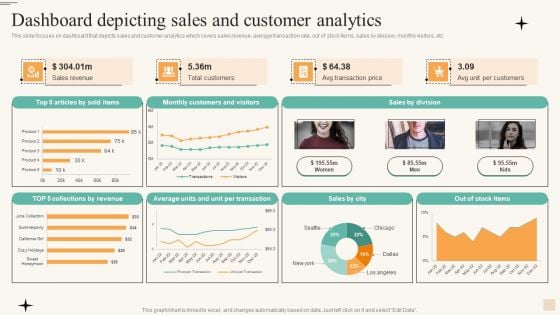
Dashboard Depicting Sales And Customer Analytics Infographics PDF
This slide focuses on dashboard that depicts sales and customer analytics which covers sales revenue, average transaction rate, out of stock items, sales by division, monthly visitors, etc. If you are looking for a format to display your unique thoughts, then the professionally designed Dashboard Depicting Sales And Customer Analytics Infographics PDF is the one for you. You can use it as a Google Slides template or a PowerPoint template. Incorporate impressive visuals, symbols, images, and other charts. Modify or reorganize the text boxes as you desire. Experiment with shade schemes and font pairings. Alter, share or cooperate with other people on your work. Download Dashboard Depicting Sales And Customer Analytics Infographics PDF and find out how to give a successful presentation. Present a perfect display to your team and make your presentation unforgettable.
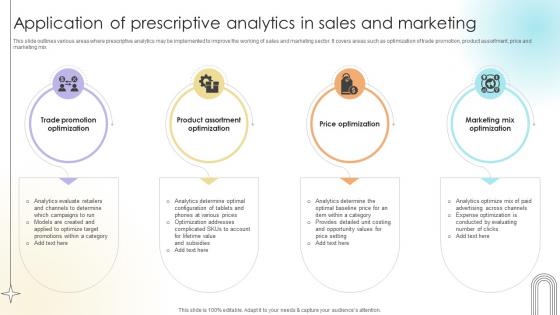
Application Of Prescriptive Analytics In Sales And Marketing Data Analytics SS V
This slide outlines various areas where prescriptive analytics may be implemented to improve the working of sales and marketing sector. It covers areas such as optimization of trade promotion, product assortment, price and marketing mix.Want to ace your presentation in front of a live audience Our Application Of Prescriptive Analytics In Sales And Marketing Data Analytics SS V can help you do that by engaging all the users towards you. Slidegeeks experts have put their efforts and expertise into creating these impeccable powerpoint presentations so that you can communicate your ideas clearly. Moreover, all the templates are customizable, and easy-to-edit and downloadable. Use these for both personal and commercial use. This slide outlines various areas where prescriptive analytics may be implemented to improve the working of sales and marketing sector. It covers areas such as optimization of trade promotion, product assortment, price and marketing mix.
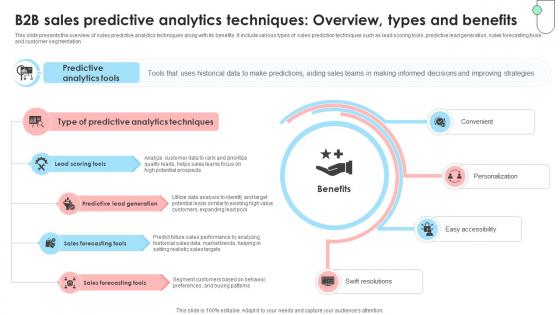
Navigating B2B Sales B2B Sales Predictive Analytics Techniques Overview SA SS V
This slide presents the overview of sales predictive analytics techniques along with its benefits. It include various types of sales prediction techniques such as lead scoring tools, predictive lead generation, sales forecasting tools and customer segmentation. Whether you have daily or monthly meetings, a brilliant presentation is necessary. Navigating B2B Sales B2B Sales Predictive Analytics Techniques Overview SA SS V can be your best option for delivering a presentation. Represent everything in detail using Navigating B2B Sales B2B Sales Predictive Analytics Techniques Overview SA SS V and make yourself stand out in meetings. The template is versatile and follows a structure that will cater to your requirements. All the templates prepared by Slidegeeks are easy to download and edit. Our research experts have taken care of the corporate themes as well. So, give it a try and see the results. This slide presents the overview of sales predictive analytics techniques along with its benefits. It include various types of sales prediction techniques such as lead scoring tools, predictive lead generation, sales forecasting tools and customer segmentation.
Online Business Sales Growth Analytics Vector Ppt Powerpoint Presentation Outline Aids
This is a online business sales growth analytics vector ppt powerpoint presentation outline aids. This is a four stage process. The stages in this process are ecommerce, mercantilism, commercialism.
Predictive Analytics In Align Sales And Marketing Better Predictive Analytics For Improved Topics Pdf
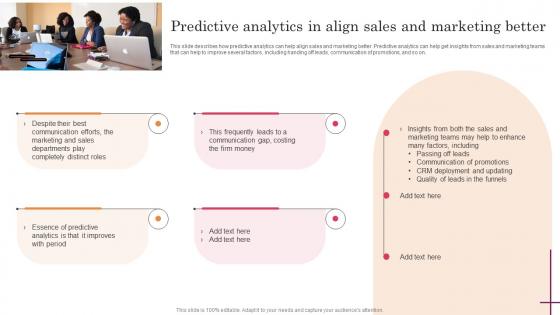
This slide describes how predictive analytics can help align sales and marketing better. Predictive analytics can help get insights from sales and marketing teams that can help to improve several factors, including handing off leads, communication of promotions, and so on. Welcome to our selection of the Predictive Analytics In Align Sales And Marketing Better Predictive Analytics For Improved Topics Pdf These are designed to help you showcase your creativity and bring your sphere to life. Planning and Innovation are essential for any business that is just starting out. This collection contains the designs that you need for your everyday presentations. All of our PowerPoints are 100 percent editable, so you can customize them to suit your needs. This multi-purpose template can be used in various situations. Grab these presentation templates today. This slide describes how predictive analytics can help align sales and marketing better. Predictive analytics can help get insights from sales and marketing teams that can help to improve several factors, including handing off leads, communication of promotions, and so on.
Insurance Analytics Corporation Sales Insights Dashboard Structure PDF
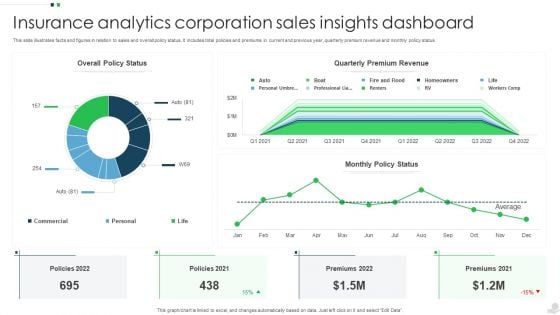
This slide illustrates facts and figures in relation to sales and overall policy status. It includes total policies and premiums in current and previous year, quarterly premium revenue and monthly policy status. Pitch your topic with ease and precision using this Insurance Analytics Corporation Sales Insights Dashboard Structure PDF. This layout presents information on Quarterly Premium Revenue, Sales Insights Dashboard, Insurance Analytics Corporation. It is also available for immediate download and adjustment. So, changes can be made in the color, design, graphics or any other component to create a unique layout.
Marketing And Sales Pyramid Showing Digital Analytics Optimization Graphics PDF
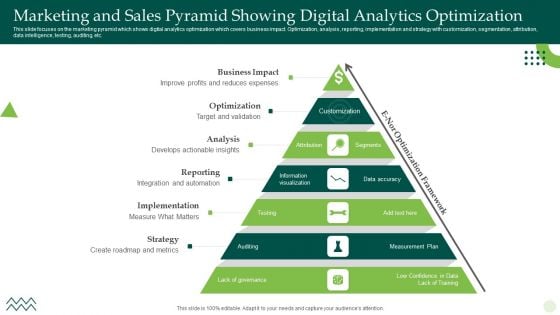
Persuade your audience using this Marketing And Sales Pyramid Showing Digital Analytics Optimization Graphics PDF. This PPT design covers seven stages, thus making it a great tool to use. It also caters to a variety of topics including Business Impact, Optimization, Analysis. Download this PPT design now to present a convincing pitch that not only emphasizes the topic but also showcases your presentation skills.
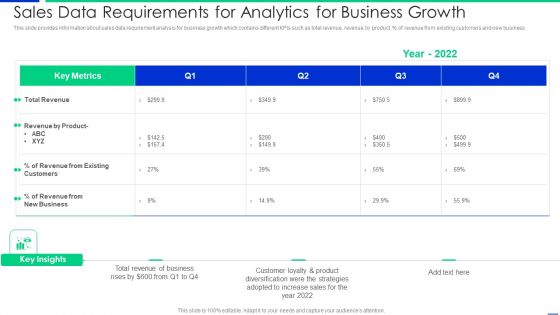
Sales Data Requirements For Analytics For Business Growth Information PDF
This slide provides information about sales data requirement analysis for business growth which contains different KPIs such as total revenue, revenue by product, percentage of revenue from existing customers and new business. Pitch your topic with ease and precision using this sales data requirements for analytics for business growth information pdf. This layout presents information on customers, revenue, business. It is also available for immediate download and adjustment. So, changes can be made in the color, design, graphics or any other component to create a unique layout.
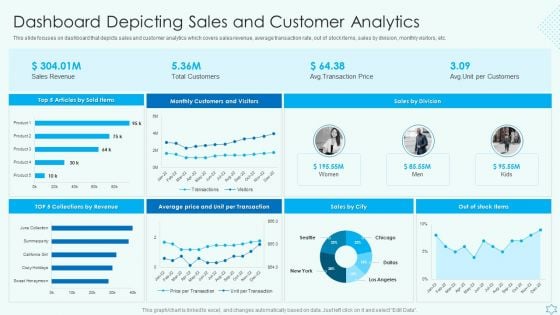
Deploy Merchandise Program To Enhance Sales Dashboard Depicting Sales And Customer Analytics Sample PDF
This slide focuses on dashboard that depicts sales and customer analytics which covers sales revenue, average transaction rate, out of stock items, sales by division, monthly visitors, etc. Make sure to capture your audiences attention in your business displays with our gratis customizable Deploy Merchandise Program To Enhance Sales Dashboard Depicting Sales And Customer Analytics Sample PDF. These are great for business strategies, office conferences, capital raising or task suggestions. If you desire to acquire more customers for your tech business and ensure they stay satisfied, create your own sales presentation with these plain slides.
Predictive Analytics Sales Operational Planning Ppt PowerPoint Presentation Icon Grid Cpb
This is a predictive analytics sales operational planning ppt powerpoint presentation icon grid cpb. This is a three stage process. The stages in this process are predictive analytics sales operational planning.
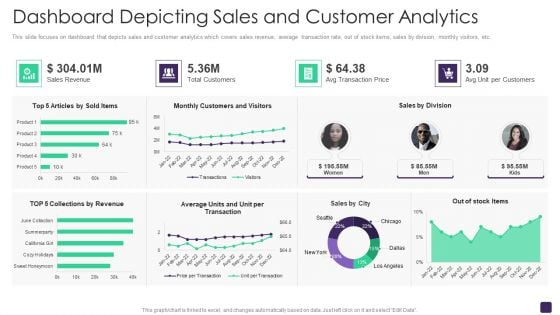
Retail Merchandising Program Dashboard Depicting Sales And Customer Analytics Topics PDF
This slide focuses on dashboard that depicts sales and customer analytics which covers sales revenue, average transaction rate, out of stock items, sales by division, monthly visitors, etc. Deliver an awe inspiring pitch with this creative Retail Merchandising Program Dashboard Depicting Sales And Customer Analytics Topics PDF bundle. Topics like Sales Revenue, Total Customers, Avg Transaction Price, Sales Division can be discussed with this completely editable template. It is available for immediate download depending on the needs and requirements of the user.
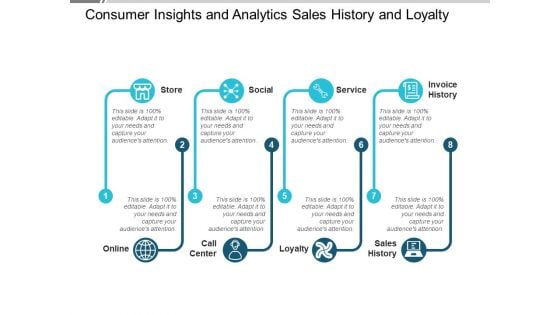
Consumer Insights And Analytics Sales History And Loyalty Ppt PowerPoint Presentation Visual Aids Ideas
This is a consumer insights and analytics sales history and loyalty ppt powerpoint presentation visual aids ideas. This is a eight stage process. The stages in this process are customer experience, customer insight, consumer insight.
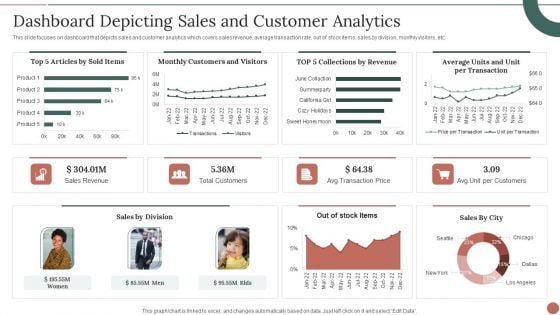
Retail Business Product Planning Procedure Dashboard Depicting Sales And Customer Analytics Themes PDF
This slide focuses on dashboard that depicts sales and customer analytics which covers sales revenue, average transaction rate, out of stock items, sales by division, monthly visitors, etc. Deliver and pitch your topic in the best possible manner with this Retail Business Product Planning Procedure Dashboard Depicting Sales And Customer Analytics Themes PDF. Use them to share invaluable insights on Sales Revenue, Total Customers, Sales By Division and impress your audience. This template can be altered and modified as per your expectations. So, grab it now.
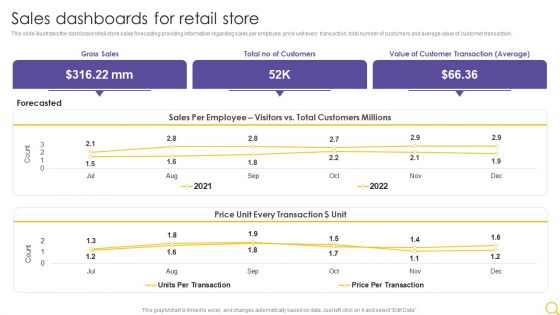
Retail Outlet Operational Efficiency Analytics Sales Dashboards For Retail Store Inspiration PDF
This slide illustrates the dashboard retail store sales forecasting providing information regarding sales per employee, price unit every transaction, total number of customers and average value of customer transaction. Deliver and pitch your topic in the best possible manner with this Retail Outlet Operational Efficiency Analytics Sales Dashboards For Retail Store Inspiration PDF. Use them to share invaluable insights on Gross Sales, Total No Customers, Value Customer and impress your audience. This template can be altered and modified as per your expectations. So, grab it now.
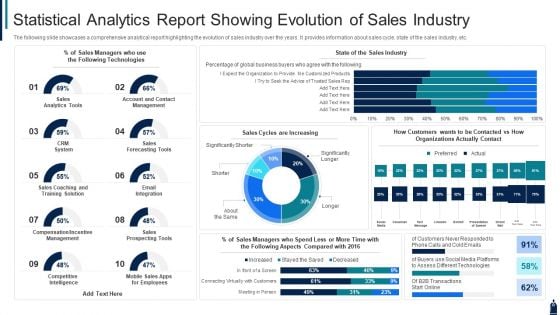
Statistical Analytics Report Showing Evolution Of Sales Industry Diagrams PDF
The following slide showcases a comprehensive analytical report highlighting the evolution of sales industry over the years. It provides information about sales cycle, state of the sales industry, etc. Showcasing this set of slides titled statistical analytics report showing evolution of sales industry diagrams pdf. The topics addressed in these templates are sales, technologies, system. All the content presented in this PPT design is completely editable. Download it and make adjustments in color, background, font etc. as per your unique business setting.

Leverage Technology To Track Team Analytics Efficient Sales Territory Management To Build SA SS V
This slide showcases key technologies to track sales team analytics such as CRM, sales routing tools, and sales enablement tools along with their purpose and key features. Explore a selection of the finest Leverage Technology To Track Team Analytics Efficient Sales Territory Management To Build SA SS V here. With a plethora of professionally designed and pre-made slide templates, you can quickly and easily find the right one for your upcoming presentation. You can use our Leverage Technology To Track Team Analytics Efficient Sales Territory Management To Build SA SS V to effectively convey your message to a wider audience. Slidegeeks has done a lot of research before preparing these presentation templates. The content can be personalized and the slides are highly editable. Grab templates today from Slidegeeks. This slide showcases key technologies to track sales team analytics such as CRM, sales routing tools, and sales enablement tools along with their purpose and key features.
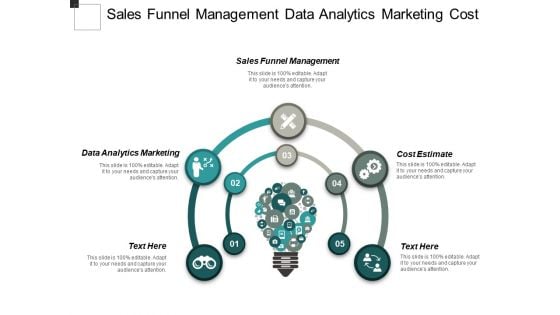
Sales Funnel Management Data Analytics Marketing Cost Estimate Ppt PowerPoint Presentation Inspiration Templates Cpb
This is a sales funnel management data analytics marketing cost estimate ppt powerpoint presentation inspiration templates cpb. This is a five stage process. The stages in this process are sales funnel management, data analytics marketing, cost estimate.
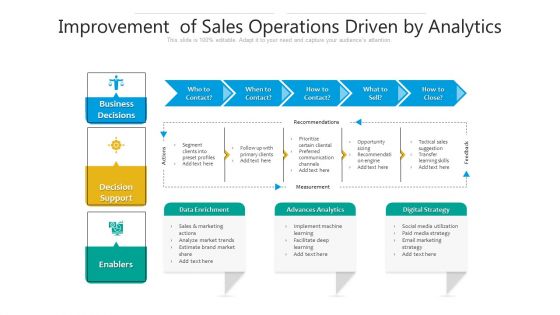
Improvement Of Sales Operations Driven By Analytics Ppt PowerPoint Presentation File Slides PDF
Presenting improvement of sales operations driven by analytics ppt powerpoint presentation file slides pdf to dispense important information. This template comprises five stages. It also presents valuable insights into the topics including measurement, analytics, strategy . This is a completely customizable PowerPoint theme that can be put to use immediately. So, download it and address the topic impactfully.
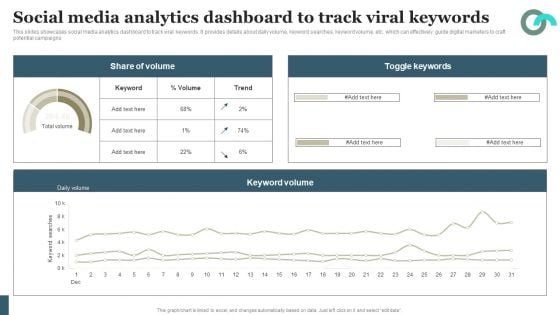
Viral Marketing Techniques To Increase Annual Business Sales Social Media Analytics Dashboard To Track Viral Demonstration PDF
This slides showcases social media analytics dashboard to track viral keywords. It provides details about daily volume, keyword searches, keyword volume, etc. which can effectively guide digital marketers to craft potential campaigns Slidegeeks is one of the best resources for PowerPoint templates. You can download easily and regulate Viral Marketing Techniques To Increase Annual Business Sales Social Media Analytics Dashboard To Track Viral Demonstration PDF for your personal presentations from our wonderful collection. A few clicks is all it takes to discover and get the most relevant and appropriate templates. Use our Templates to add a unique zing and appeal to your presentation and meetings. All the slides are easy to edit and you can use them even for advertisement purposes.
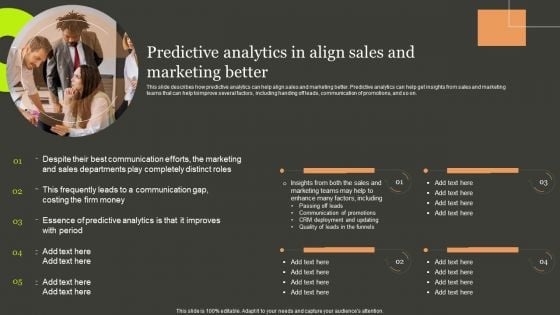
Predictive Analytics Methods Predictive Analytics In Align Sales And Marketing Better Microsoft PDF
This slide describes how predictive analytics can help align sales and marketing better. Predictive analytics can help get insights from sales and marketing teams that can help toimprove several factors, including handing off leads, communication of promotions, and so on. Formulating a presentation can take up a lot of effort and time, so the content and message should always be the primary focus. The visuals of the PowerPoint can enhance the presenters message, so our Predictive Analytics Methods Predictive Analytics In Align Sales And Marketing Better Microsoft PDF was created to help save time. Instead of worrying about the design, the presenter can concentrate on the message while our designers work on creating the ideal templates for whatever situation is needed. Slidegeeks has experts for everything from amazing designs to valuable content, we have put everything into Predictive Analytics Methods Predictive Analytics In Align Sales And Marketing Better Microsoft PDF.
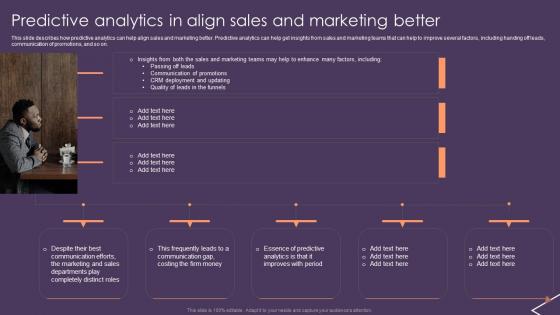
Predictive Analytics For Empowering Predictive Analytics In Align Sales And Marketing Download Pdf
This slide describes how predictive analytics can help align sales and marketing better. Predictive analytics can help get insights from sales and marketing teams that can help to improve several factors, including handing off leads, communication of promotions, and so on. Coming up with a presentation necessitates that the majority of the effort goes into the content and the message you intend to convey. The visuals of a PowerPoint presentation can only be effective if it supplements and supports the story that is being told. Keeping this in mind our experts created Predictive Analytics For Empowering Predictive Analytics In Align Sales And Marketing Download Pdf to reduce the time that goes into designing the presentation. This way, you can concentrate on the message while our designers take care of providing you with the right template for the situation. This slide describes how predictive analytics can help align sales and marketing better. Predictive analytics can help get insights from sales and marketing teams that can help to improve several factors, including handing off leads, communication of promotions, and so on.
B2b Sales Plan Image For Predictive Analytics Promotions Ppt PowerPoint Presentation Infographic Template Images PDF
Presenting b2b sales plan image for predictive analytics promotions ppt powerpoint presentation infographic template images pdf to dispense important information. This template comprises one stage. It also presents valuable insights into the topics including b2b sales plan image for predictive analytics promotions. This is a completely customizable PowerPoint theme that can be put to use immediately. So, download it and address the topic impactfully.
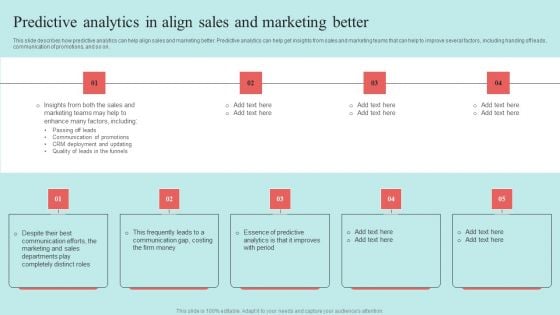
Predictive Data Model Predictive Analytics In Align Sales And Marketing Better Information PDF
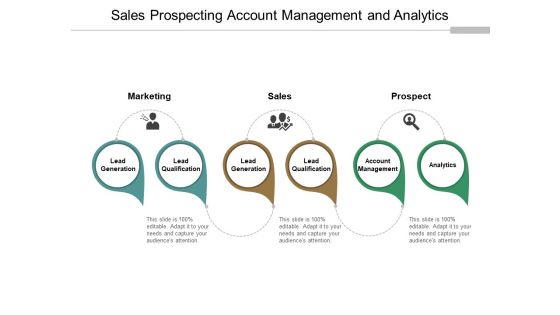
Sales Prospecting Account Management And Analytics Ppt PowerPoint Presentation Summary Backgrounds
This is a sales prospecting account management and analytics ppt powerpoint presentation summary backgrounds. This is a six stage process. The stages in this process are lead generation, lead management, lead creation.

Customer Relationship Management Lifecycle Analytics Dashboard With Sales Record Brochure PDF
This slide signifies the customer relationship management analytics dashboard. It covers information about sales record by different representative, total products sold, sales by different month, etc.Pitch your topic with ease and precision using this Customer Relationship Management Lifecycle Analytics Dashboard With Sales Record Brochure PDF. This layout presents information on Sales Record, Representative, Total Items. It is also available for immediate download and adjustment. So, changes can be made in the color, design, graphics or any other component to create a unique layout.
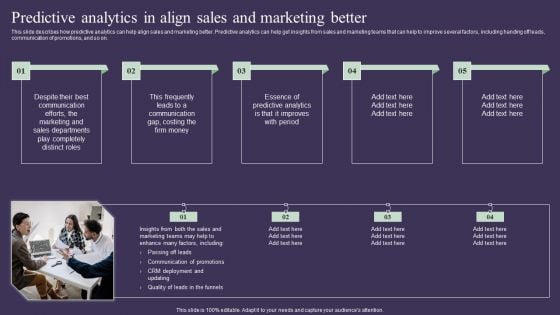
Projection Model Predictive Analytics In Align Sales And Marketing Better Ideas PDF
This slide describes how predictive analytics can help align sales and marketing better. Predictive analytics can help get insights from sales and marketing teams that can help to improve several factors, including handing off leads, communication of promotions, and so on. This Projection Model Predictive Analytics In Align Sales And Marketing Better Ideas PDF from Slidegeeks makes it easy to present information on your topic with precision. It provides customization options, so you can make changes to the colors, design, graphics, or any other component to create a unique layout. It is also available for immediate download, so you can begin using it right away. Slidegeeks has done good research to ensure that you have everything you need to make your presentation stand out. Make a name out there for a brilliant performance.
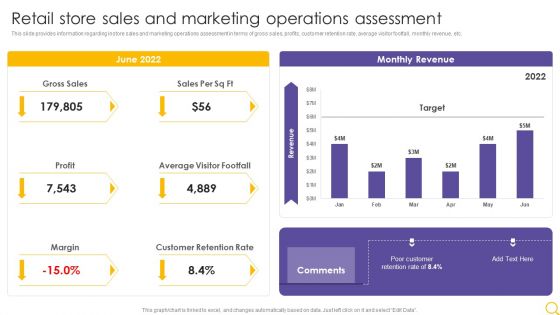
Retail Outlet Operational Efficiency Analytics Retail Store Sales And Marketing Operations Assessment Designs PDF
This slide provides information regarding instore sales and marketing operations assessment in terms of gross sales, profits, customer retention rate, average visitor footfall, monthly revenue, etc. Deliver and pitch your topic in the best possible manner with this Retail Outlet Operational Efficiency Analytics Retail Store Sales And Marketing Operations Assessment Designs PDF. Use them to share invaluable insights on Gross Sales, Profit, Average Visitor Footfall and impress your audience. This template can be altered and modified as per your expectations. So, grab it now.
Analytics Icon Depicting Marketer Sales Elevator Pitch To Advertise Product Portrait PDF
Presenting analytics icon depicting marketer sales elevator pitch to advertise product portrait pdf to dispense important information. This template comprises four stages. It also presents valuable insights into the topics including analytics icon depicting marketer sales elevator pitch to advertise product. This is a completely customizable PowerPoint theme that can be put to use immediately. So, download it and address the topic impactfully.
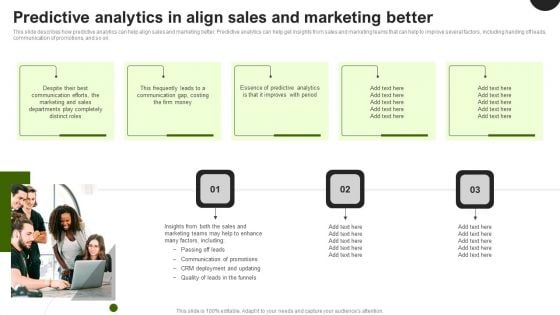
Predictive Analytics In The Age Of Big Data Predictive Analytics In Align Sales And Marketing Better Topics PDF
This slide describes how predictive analytics can help align sales and marketing better. Predictive analytics can help get insights from sales and marketing teams that can help to improve several factors, including handing off leads, communication of promotions, and so on. This modern and well arranged Predictive Analytics In The Age Of Big Data Predictive Analytics In Align Sales And Marketing Better Topics PDF provides lots of creative possibilities. It is very simple to customize and edit with the Powerpoint Software. Just drag and drop your pictures into the shapes. All facets of this template can be edited with Powerpoint no extra software is necessary. Add your own material, put your images in the places assigned for them, adjust the colors, and then you can show your slides to the world, with an animated slide included.
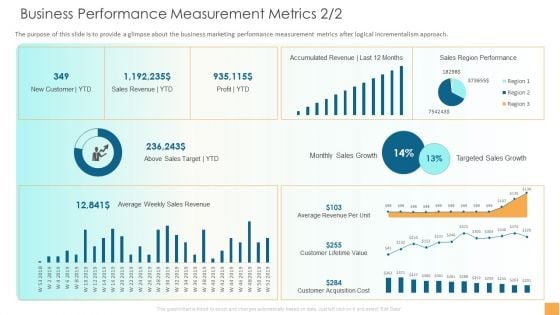
Analytical Incrementalism Business Performance Measurement Metrics Sales Infographics PDF
The purpose of this slide is to provide a glimpse about the business marketing performance measurement metrics after logical incrementalism approach. Deliver an awe-inspiring pitch with this creative analytical incrementalism business performance measurement metrics sales infographics pdf bundle. Topics like gross profit margin, revenue, quick ratio can be discussed with this completely editable template. It is available for immediate download depending on the needs and requirements of the user.

Closing Techniques To Seal Analytical Closing Strategic Sales Approach SA SS V
Following slide exhibits analytical sales closing technique that empower sales professional to navigate process with precision for better results. It includes elements such as overview, example, steps involved and benefits. Boost your pitch with our creative Closing Techniques To Seal Analytical Closing Strategic Sales Approach SA SS V. Deliver an awe-inspiring pitch that will mesmerize everyone. Using these presentation templates you will surely catch everyones attention. You can browse the ppts collection on our website. We have researchers who are experts at creating the right content for the templates. So you do not have to invest time in any additional work. Just grab the template now and use them. Following slide exhibits analytical sales closing technique that empower sales professional to navigate process with precision for better results. It includes elements such as overview, example, steps involved and benefits.
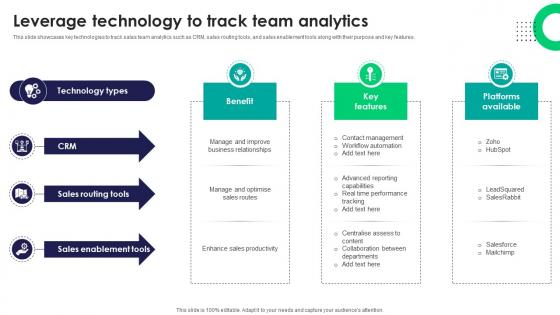
Leverage Technology To Track Team Analytics Tactics For Improving Field Sales Team SA SS V
This slide showcases key technologies to track sales team analytics such as CRM, sales routing tools, and sales enablement tools along with their purpose and key features.Explore a selection of the finest Leverage Technology To Track Team Analytics Tactics For Improving Field Sales Team SA SS V here. With a plethora of professionally designed and pre-made slide templates, you can quickly and easily find the right one for your upcoming presentation. You can use our Leverage Technology To Track Team Analytics Tactics For Improving Field Sales Team SA SS V to effectively convey your message to a wider audience. Slidegeeks has done a lot of research before preparing these presentation templates. The content can be personalized and the slides are highly editable. Grab templates today from Slidegeeks. This slide showcases key technologies to track sales team analytics such as CRM, sales routing tools, and sales enablement tools along with their purpose and key features.
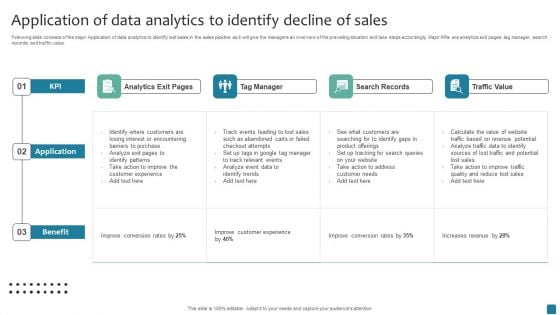
Application Of Data Analytics To Identify Decline Of Sales Slides PDF
Following slide consists of the major Application of data analytics to identify lost sales in the sales pipeline as it will give the managers an overview of the prevailing situation and take steps accordingly. Major KPIs are analytics exit pages, tag manager, search records, and traffic value. Pitch your topic with ease and precision using this Application Of Data Analytics To Identify Decline Of Sales Slides PDF. This layout presents information on Analytics Exit Pages, Tag Manager, Search Records. It is also available for immediate download and adjustment. So, changes can be made in the color, design, graphics or any other component to create a unique layout.
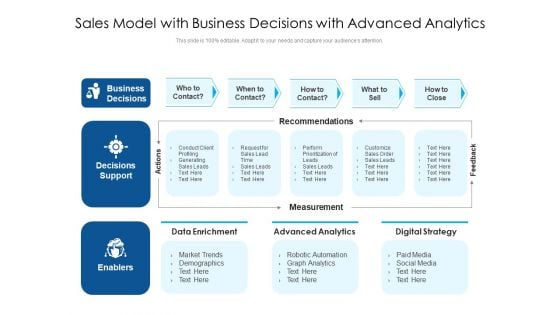
Sales Model With Business Decisions With Advanced Analytics Ppt PowerPoint Presentation Professional Slide PDF
Pitch your topic with ease and precision using this sales model with business decisions with advanced analytics ppt powerpoint presentation professional slide pdf. This layout presents information on data enrichment, advanced analytics, digital strategy. It is also available for immediate download and adjustment. So, changes can be made in the color, design, graphics or any other component to create a unique layout.
SAC Planning And Implementation SAP Analytics Cloud Dashboard For Product Sales Analysis Icons PDF
This slide illustrates the SAP Analytics Cloud dashboard to monitor product sales performance. It provides information regarding the gross margin and net revenue earned, product performance state wise and year wise. Deliver and pitch your topic in the best possible manner with this SAC Planning And Implementation SAP Analytics Cloud Dashboard For Product Sales Analysis Icons PDF. Use them to share invaluable insights on Gross Margin, Earned Quarter Wise, Gross Margin, Net Revenue and impress your audience. This template can be altered and modified as per your expectations. So, grab it now.
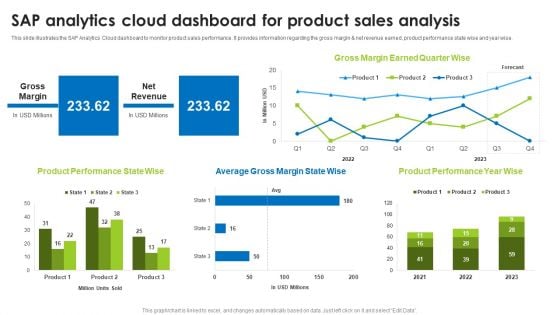
BI Technique For Data Informed Decisions Sap Analytics Cloud Dashboard For Product Sales Analysis Sample PDF
This slide illustrates the SAP Analytics Cloud dashboard to monitor product sales performance. It provides information regarding the gross margin and net revenue earned, product performance state wise and year wise. Welcome to our selection of the Budget Plan For BI Technique For Data Informed Decisions Clipart PDF. These are designed to help you showcase your creativity and bring your sphere to life. Planning and Innovation are essential for any business that is just starting out. This collection contains the designs that you need for your everyday presentations. All of our PowerPoints are 100 percent editable, so you can customize them to suit your needs. This multi purpose template can be used in various situations. Grab these presentation templates today.
Tracking And Analyzing Results With Facebook Analytics Regional Marketing Plan To Boost Sales MKT SS
vDo you have to make sure that everyone on your team knows about any specific topic I yes, then you should give Tracking And Analyzing Results With Facebook Analytics Regional Marketing Plan To Boost Sales MKT SS a try. Our experts have put a lot of knowledge and effort into creating this impeccable Tracking And Analyzing Results With Facebook Analytics Regional Marketing Plan To Boost Sales MKT SS. You can use this template for your upcoming presentations, as the slides are perfect to represent even the tiniest detail. You can download these templates from the Slidegeeks website and these are easy to edit. So grab these today This slide showcases the key tabs to track and analyze Facebook post results. It includes key tabs to analyze such as likes, reach, page views, engagement and Facebook reactions.
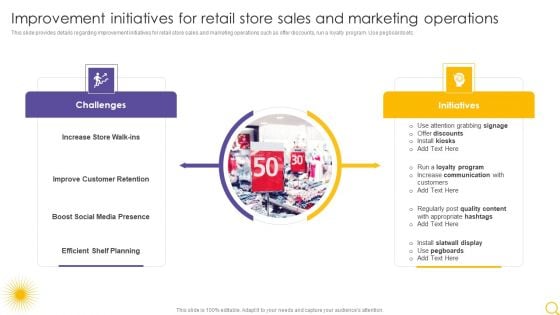
Retail Outlet Operational Efficiency Analytics Improvement Initiatives For Retail Store Sales Download PDF
This slide provides details regarding improvement initiatives for retail store sales and marketing operations such as offer discounts, run a loyalty program. Use pegboards etc. Deliver and pitch your topic in the best possible manner with this Retail Outlet Operational Efficiency Analytics Improvement Initiatives For Retail Store Sales Download PDF. Use them to share invaluable insights on Challenges, Initiatives, Improve Customer Retention and impress your audience. This template can be altered and modified as per your expectations. So, grab it now.
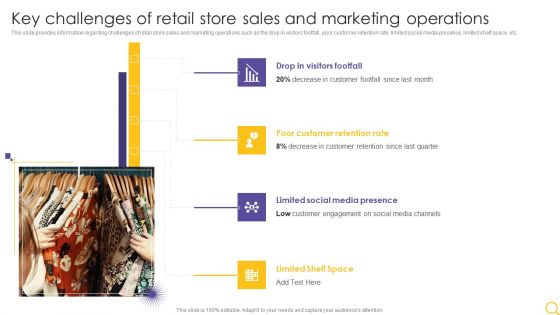
Retail Outlet Operational Efficiency Analytics Key Challenges Of Retail Store Sales And Marketing Mockup PDF
This slide provides information regarding challenges of retail store sales and marketing operations such as the drop in visitors footfall, poor customer retention rate, limited social media presence, limited shelf space, etc. This is a Retail Outlet Operational Efficiency Analytics Key Challenges Of Retail Store Sales And Marketing Mockup PDF template with various stages. Focus and dispense information on four stages using this creative set, that comes with editable features. It contains large content boxes to add your information on topics like Drop Visitors Footfall, Poor Customer, Retention Rate. You can also showcase facts, figures, and other relevant content using this PPT layout. Grab it now.
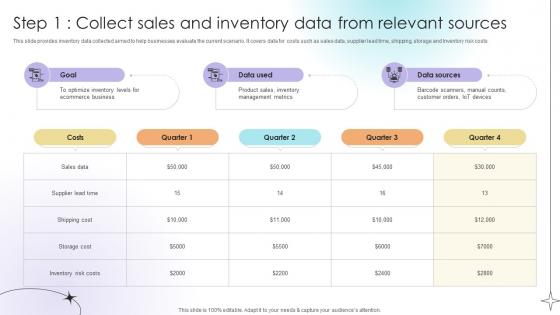
Step 1 Collect Sales And Inventory Data From Relevant Sources Data Analytics SS V
This slide provides inventory data collected aimed to help businesses evaluate the current scenario. It covers data for costs such as sales data, supplier lead time, shipping, storage and Inventory risk costs.Are you in need of a template that can accommodate all of your creative concepts This one is crafted professionally and can be altered to fit any style. Use it with Google Slides or PowerPoint. Include striking photographs, symbols, depictions, and other visuals. Fill, move around, or remove text boxes as desired. Test out color palettes and font mixtures. Edit and save your work, or work with colleagues. Download Step 1 Collect Sales And Inventory Data From Relevant Sources Data Analytics SS V and observe how to make your presentation outstanding. Give an impeccable presentation to your group and make your presentation unforgettable. This slide provides inventory data collected aimed to help businesses evaluate the current scenario. It covers data for costs such as sales data, supplier lead time, shipping, storage and Inventory risk costs.
Sales Attrition Tracking Report With Revenue And Customer Churn Analytics Formats PDF
This slide covers dashboard depicting total annual sales in company. It includes key components such as revenue, profit margins, cost incurred, cost breakdown, up sell and churn trends. Showcasing this set of slides titled Sales Attrition Tracking Report With Revenue And Customer Churn Analytics Formats PDF. The topics addressed in these templates are Revenue, Number Of Sales, Profit, Cost. All the content presented in this PPT design is completely editable. Download it and make adjustments in color, background, font etc. as per your unique business setting.

Product Analytics Tool 2 Adobe Analytics To Generate Data Product Analytics Implementation Data Analytics V
This slide provides an overview of product analytic tool Adobe Analytics. It covers details regarding tool description, benefits and pricing plans such as select, prime and ultimate.Slidegeeks is here to make your presentations a breeze with Product Analytics Tool 2 Adobe Analytics To Generate Data Product Analytics Implementation Data Analytics V With our easy-to-use and customizable templates, you can focus on delivering your ideas rather than worrying about formatting. With a variety of designs to choose from, you are sure to find one that suits your needs. And with animations and unique photos, illustrations, and fonts, you can make your presentation pop. So whether you are giving a sales pitch or presenting to the board, make sure to check out Slidegeeks first This slide provides an overview of product analytic tool Adobe Analytics. It covers details regarding tool description, benefits and pricing plans such as select, prime and ultimate.

Growth Restraints Of Product Analytics Market Product Analytics Implementation Data Analytics V
This slide outlines major growth restraints that may hinder increased use of product analytics to boost sales. It covers arguments such as privacy and security issues, data integration from silos and lack of skilled professionals This Growth Restraints Of Product Analytics Market Product Analytics Implementation Data Analytics V is perfect for any presentation, be it in front of clients or colleagues. It is a versatile and stylish solution for organizing your meetings. The Growth Restraints Of Product Analytics Market Product Analytics Implementation Data Analytics V features a modern design for your presentation meetings. The adjustable and customizable slides provide unlimited possibilities for acing up your presentation. Slidegeeks has done all the homework before launching the product for you. So, do not wait, grab the presentation templates today This slide outlines major growth restraints that may hinder increased use of product analytics to boost sales. It covers arguments such as privacy and security issues, data integration from silos and lack of skilled professionals
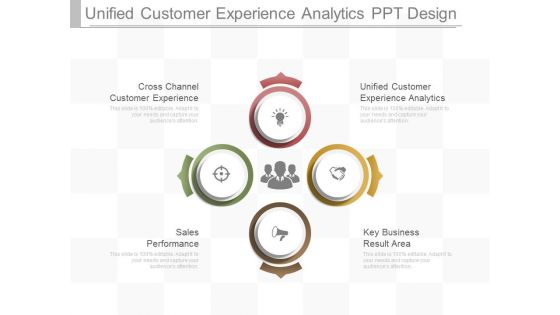
Unified Customer Experience Analytics Ppt Design
This is a unified customer experience analytics ppt design. This is a four stage process. The stages in this process are cross channel customer experience, unified customer experience analytics, sales, performance, key business result area.


 Continue with Email

 Home
Home


