Score Meter
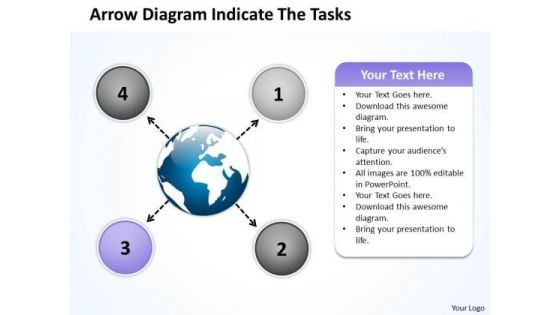
Arrow Diagram Indicate The Tasks Circular Flow Layout Process PowerPoint Slides
We present our arrow diagram indicate the tasks Circular Flow Layout Process PowerPoint Slides.Download and present our Business PowerPoint Templates because your thoughts are pointed and sharp as arrows. Present our Ring Charts PowerPoint Templates because it Draws the universal impact to highlight the similarities with your organizational structure and plans. Download our Marketing PowerPoint Templates because networking is an imperative in todays world. You need to access the views of others. Similarly you need to give access to them of your abilities. Use our Shapes PowerPoint Templates because different people with differing ideas and priorities perform together to score. Download our Process and Flows PowerPoint Templates because you have a great plan to put the pieces together, getting all the various contributors to gel for a successful completion.Use these PowerPoint slides for presentations relating to Arrows, choice, connect, design, direction, flows, four, info graph, instruction, layout, manual, marketing, modern, one, option, order, page, paper, pointing, process, product, promotion, sequence, simple, special, step, symbol. The prominent colors used in the PowerPoint template are Purple, Blue, Black. Presenters tell us our arrow diagram indicate the tasks Circular Flow Layout Process PowerPoint Slides are Majestic. Professionals tell us our info PowerPoint templates and PPT Slides are Breathtaking. PowerPoint presentation experts tell us our arrow diagram indicate the tasks Circular Flow Layout Process PowerPoint Slides are Clever. The feedback we get is that our info PowerPoint templates and PPT Slides are Nifty. Use our arrow diagram indicate the tasks Circular Flow Layout Process PowerPoint Slides are One-of-a-kind. Use our four PowerPoint templates and PPT Slides are readymade to fit into any presentation structure. Watch your plans fall into place. Our Arrow Diagram Indicate The Tasks Circular Flow Layout Process PowerPoint Slides aid in completion.

ITIL Authorization Management Key Performance Indicators Infographics Pdf
This slide showcase KPI indicators which helps in identifying areas of improvement and align all parties involved in access management. It include KPIs such as unauthorized access setting, request access number, revoked instances and deviation in defined security policies. Showcasing this set of slides titled ITIL Authorization Management Key Performance Indicators Infographics Pdf The topics addressed in these templates are Unit Of Measures, Defined Security, Access Management All the content presented in this PPT design is completely editable. Download it and make adjustments in color, background, font etc. as per your unique business setting. This slide showcase KPI indicators which helps in identifying areas of improvement and align all parties involved in access management. It include KPIs such as unauthorized access setting, request access number, revoked instances and deviation in defined security policies.
Barometer And Bar Chart Benchmarking Vector Icon Ppt PowerPoint Presentation File Background PDF
Showcasing this set of slides titled barometer and bar chart benchmarking vector icon ppt powerpoint presentation file background pdf. The topics addressed in these templates are barometer and bar chart benchmarking vector icon. All the content presented in this PPT design is completely editable. Download it and make ajustments in color, background, font etc. as per your unique business setting.
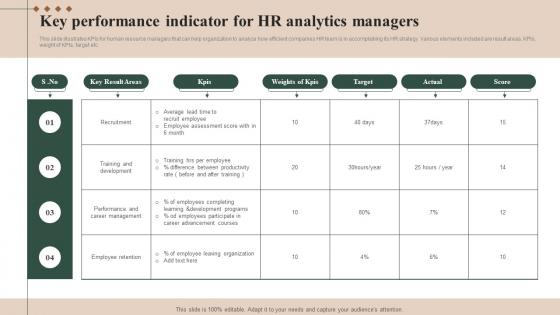
Key Performance Indicator For HR Analytics Managers Brochure Pdf
This slide illustrates KPIs for human resource managers that can help organization to analyze how efficient companies HR team is in accomplishing its HR strategy. Various elements included are result areas, KPIs, weight of KPIs, target etc.Pitch your topic with ease and precision using this Key Performance Indicator For HR Analytics Managers Brochure Pdf This layout presents information on Training Development, Career Management, Employee Retention It is also available for immediate download and adjustment. So, changes can be made in the color, design, graphics or any other component to create a unique layout. This slide illustrates KPIs for human resource managers that can help organization to analyze how efficient companies HR team is in accomplishing its HR strategy. Various elements included are result areas, KPIs, weight of KPIs, target etc.
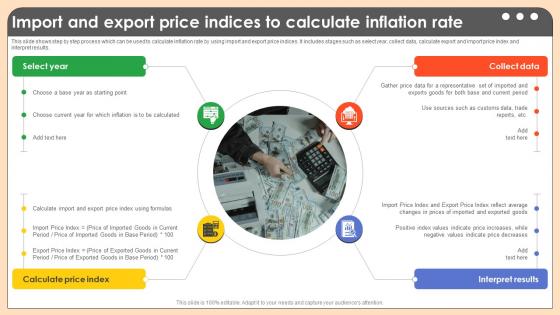
Import And Export Price Indices To Calculate Comprehensive Guide On Inflation Control CM SS V
This slide shows step by step process which can be used to calculate inflation rate by using import and export price indices. It includes stages such as select year, collect data, calculate export and import price index and interpret results. This Import And Export Price Indices To Calculate Comprehensive Guide On Inflation Control CM SS V is perfect for any presentation, be it in front of clients or colleagues. It is a versatile and stylish solution for organizing your meetings. The Import And Export Price Indices To Calculate Comprehensive Guide On Inflation Control CM SS V features a modern design for your presentation meetings. The adjustable and customizable slides provide unlimited possibilities for acing up your presentation. Slidegeeks has done all the homework before launching the product for you. So, do not wait, grab the presentation templates today This slide shows step by step process which can be used to calculate inflation rate by using import and export price indices. It includes stages such as select year, collect data, calculate export and import price index and interpret results.

Potential Indicators Managers Use For Appraisals Structure Pdf
This slide showcases the potential indicators used by managers for appraisals which help an organization to learn about training requirements of employees. It include details such as reality sense, analytical power, vision breadth, persuasiveness. Showcasing this set of slides titled Potential Indicators Managers Use For Appraisals Structure Pdf. The topics addressed in these templates are Reality Sense, Analytical Power, Vision Breadth. All the content presented in this PPT design is completely editable. Download it and make adjustments in color, background, font etc. as per your unique business setting. This slide showcases the potential indicators used by managers for appraisals which help an organization to learn about training requirements of employees. It include details such as reality sense, analytical power, vision breadth, persuasiveness.
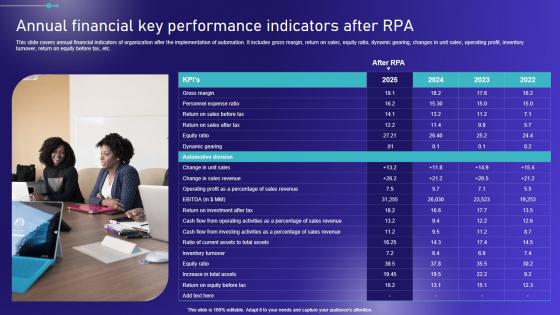
Annual Financial Key Performance Indicators After Embracing Robotic Process Elements PDF
This slide covers annual financial indicators of organization after the implementation of automation. It includes gross margin, return on sales, equity ratio, dynamic gearing, changes in unit sales, operating profit, inventory turnover, return on equity before tax, etc. Slidegeeks is one of the best resources for PowerPoint templates. You can download easily and regulate Annual Financial Key Performance Indicators After Embracing Robotic Process Elements PDF for your personal presentations from our wonderful collection. A few clicks is all it takes to discover and get the most relevant and appropriate templates. Use our Templates to add a unique zing and appeal to your presentation and meetings. All the slides are easy to edit and you can use them even for advertisement purposes. This slide covers annual financial indicators of organization after the implementation of automation. It includes gross margin, return on sales, equity ratio, dynamic gearing, changes in unit sales, operating profit, inventory turnover, return on equity before tax, etc.
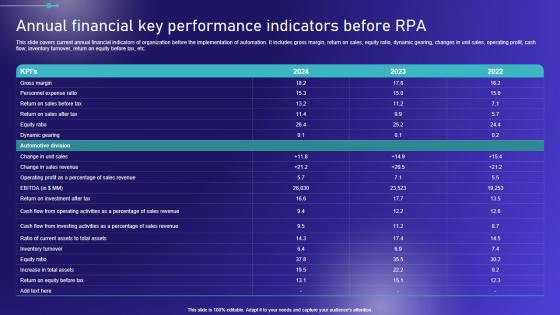
Annual Financial Key Performance Indicators Before Embracing Robotic Process Graphics PDF
This slide covers current annual financial indicators of organization before the implementation of automation. It includes gross margin, return on sales, equity ratio, dynamic gearing, changes in unit sales, operating profit, cash flow, inventory turnover, return on equity before tax, etc. Want to ace your presentation in front of a live audience Our Annual Financial Key Performance Indicators Before Embracing Robotic Process Graphics PDF can help you do that by engaging all the users towards you. Slidegeeks experts have put their efforts and expertise into creating these impeccable powerpoint presentations so that you can communicate your ideas clearly. Moreover, all the templates are customizable, and easy-to-edit and downloadable. Use these for both personal and commercial use. This slide covers current annual financial indicators of organization before the implementation of automation. It includes gross margin, return on sales, equity ratio, dynamic gearing, changes in unit sales, operating profit, cash flow, inventory turnover, return on equity before tax, etc.
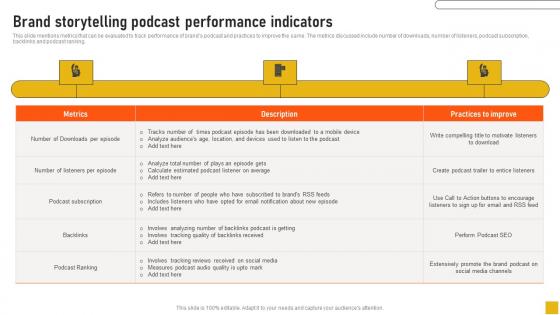
Brand Storytelling Podcast Performance Indicators Comprehensive Guide Structure Pdf
This slide mentions metrics that can be evaluated to track performance of brands podcast and practices to improve the same. The metrics discussed include number of downloads, number of listeners, podcast subscription, backlinks and podcast ranking. This Brand Storytelling Podcast Performance Indicators Comprehensive Guide Structure Pdf from Slidegeeks makes it easy to present information on your topic with precision. It provides customization options, so you can make changes to the colors, design, graphics, or any other component to create a unique layout. It is also available for immediate download, so you can begin using it right away. Slidegeeks has done good research to ensure that you have everything you need to make your presentation stand out. Make a name out there for a brilliant performance. This slide mentions metrics that can be evaluated to track performance of brands podcast and practices to improve the same. The metrics discussed include number of downloads, number of listeners, podcast subscription, backlinks and podcast ranking.
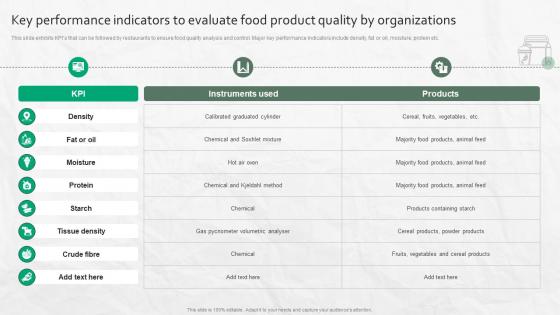
Key Performance Indicators To Evaluate Food Product Quality By Organizations
This slide exhibits KPIs that can be followed by restaurants to ensure food quality analysis and control. Major key performance indicators include density, fat or oil, moisture, protein etc.This modern and well-arranged Key Performance Indicators To Evaluate Food Product Quality By Organizations provides lots of creative possibilities. It is very simple to customize and edit with the Powerpoint Software. Just drag and drop your pictures into the shapes. All facets of this template can be edited with Powerpoint, no extra software is necessary. Add your own material, put your images in the places assigned for them, adjust the colors, and then you can show your slides to the world, with an animated slide included. This slide exhibits KPIs that can be followed by restaurants to ensure food quality analysis and control. Major key performance indicators include density, fat or oil, moisture, protein etc.
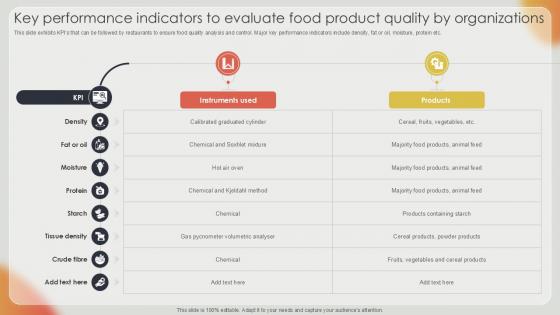
Key Performance Indicators To Effective Strategies For Strengthening Food Ppt Template
This slide exhibits KPIs that can be followed by restaurants to ensure food quality analysis and control. Major key performance indicators include density, fat or oil, moisture, protein etc. Coming up with a presentation necessitates that the majority of the effort goes into the content and the message you intend to convey. The visuals of a PowerPoint presentation can only be effective if it supplements and supports the story that is being told. Keeping this in mind our experts created Key Performance Indicators To Effective Strategies For Strengthening Food Ppt Template to reduce the time that goes into designing the presentation. This way, you can concentrate on the message while our designers take care of providing you with the right template for the situation. This slide exhibits KPIs that can be followed by restaurants to ensure food quality analysis and control. Major key performance indicators include density, fat or oil, moisture, protein etc.

Flowchart Indicating Activities Of Blockchain Logistics Blockchain Transportation Summary Pdf
This slide represents blockchain oriented logistics flowchart which can help manufacturers increase efficiency and profitability of managing supply chain. It provides details about financial flow, insurance company, smart contract service, cyber physical system, etc. Find highly impressive Flowchart Indicating Activities Of Blockchain Logistics Blockchain Transportation Summary Pdf on Slidegeeks to deliver a meaningful presentation. You can save an ample amount of time using these presentation templates. No need to worry to prepare everything from scratch because Slidegeeks experts have already done a huge research and work for you. You need to download Flowchart Indicating Activities Of Blockchain Logistics Blockchain Transportation Summary Pdf for your upcoming presentation. All the presentation templates are 100 percent editable and you can change the color and personalize the content accordingly. Download now This slide represents blockchain oriented logistics flowchart which can help manufacturers increase efficiency and profitability of managing supply chain. It provides details about financial flow, insurance company, smart contract service, cyber physical system, etc.
Pericardiocentesis Indications In Powerpoint And Google Slides Cpb
Presenting our innovatively designed set of slides titled Pericardiocentesis Indications In Powerpoint And Google Slides Cpb This completely editable PowerPoint graphic exhibits Pericardiocentesis Indications that will help you convey the message impactfully. It can be accessed with Google Slides and is available in both standard screen and widescreen aspect ratios. Apart from this, you can download this well structured PowerPoint template design in different formats like PDF, JPG, and PNG. So, click the download button now to gain full access to this PPT design. Our Pericardiocentesis Indications In Powerpoint And Google Slides Cpb are topically designed to provide an attractive backdrop to any subject. Use them to look like a presentation pro.
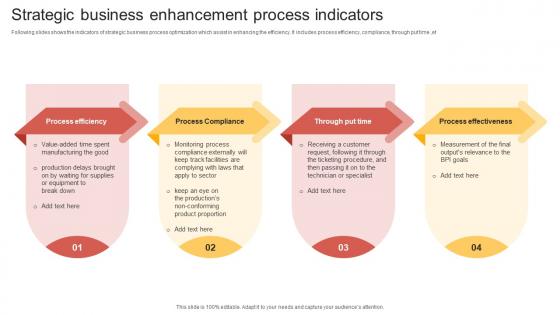
Strategic Business Enhancement Process Indicators Inspiration Pdf
Following slides shows the indicators of strategic business process optimization which assist in enhancing the efficiency. It includes process efficiency, compliance, through put time ,et Pitch your topic with ease and precision using this Strategic Business Enhancement Process Indicators Inspiration Pdf. This layout presents information on Process Efficiency, Process Compliance, Process Effectiveness. It is also available for immediate download and adjustment. So, changes can be made in the color, design, graphics or any other component to create a unique layout. Following slides shows the indicators of strategic business process optimization which assist in enhancing the efficiency. It includes process efficiency, compliance, through put time ,et
Subjective Indicator Disease In Powerpoint And Google Slides Cpb
Presenting our innovatively designed set of slides titled Subjective Indicator Disease In Powerpoint And Google Slides Cpb. This completely editable PowerPoint graphic exhibits Subjective Indicator Disease that will help you convey the message impactfully. It can be accessed with Google Slides and is available in both standard screen and widescreen aspect ratios. Apart from this, you can download this well structured PowerPoint template design in different formats like PDF, JPG, and PNG. So, click the download button now to gain full access to this PPT design. Our Subjective Indicator Disease In Powerpoint And Google Slides Cpb are topically designed to provide an attractive backdrop to any subject. Use them to look like a presentation pro.
Correlation Coefficient Indicates In Powerpoint And Google Slides Cpb
Introducing our well designed Correlation Coefficient Indicates In Powerpoint And Google Slides Cpb. This PowerPoint design presents information on topics like Correlation Coefficient Indicates. As it is predesigned it helps boost your confidence level. It also makes you a better presenter because of its high quality content and graphics. This PPT layout can be downloaded and used in different formats like PDF, PNG, and JPG. Not only this, it is available in both Standard Screen and Widescreen aspect ratios for your convenience. Therefore, click on the download button now to persuade and impress your audience. Our Correlation Coefficient Indicates In Powerpoint And Google Slides Cpb are topically designed to provide an attractive backdrop to any subject. Use them to look like a presentation pro.
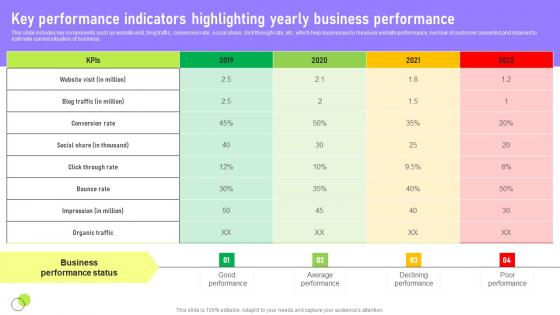
Key Performance Indicators Deployment Of Marketing Communication Clipart Pdf
This slide includes key components such as website visit, blog traffic, conversion rate, social share, click through rate, etc. which help businesses to measure website performance, number of customer converted and retained to estimate current situation of business. Are you in need of a template that can accommodate all of your creative concepts This one is crafted professionally and can be altered to fit any style. Use it with Google Slides or PowerPoint. Include striking photographs, symbols, depictions, and other visuals. Fill, move around, or remove text boxes as desired. Test out color palettes and font mixtures. Edit and save your work, or work with colleagues. Download Key Performance Indicators Deployment Of Marketing Communication Clipart Pdf and observe how to make your presentation outstanding. Give an impeccable presentation to your group and make your presentation unforgettable. This slide includes key components such as website visit, blog traffic, conversion rate, social share, click through rate, etc. which help businesses to measure website performance, number of customer converted and retained to estimate current situation of business.
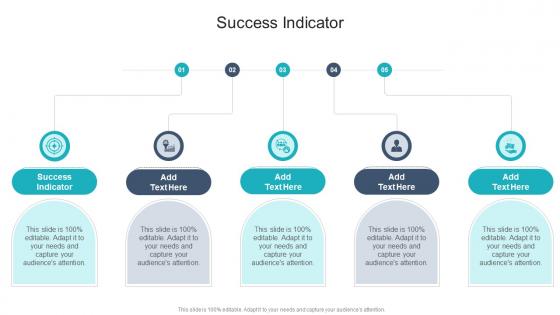
Success Indicator In Powerpoint And Google Slides Cpb
Presenting our innovatively designed set of slides titled Success Indicator In Powerpoint And Google Slides Cpb. This completely editable PowerPoint graphic exhibits Success Indicator that will help you convey the message impactfully. It can be accessed with Google Slides and is available in both standard screen and widescreen aspect ratios. Apart from this, you can download this well structured PowerPoint template design in different formats like PDF, JPG, and PNG. So, click the download button now to gain full access to this PPT design. Our Success Indicator In Powerpoint And Google Slides Cpb are topically designed to provide an attractive backdrop to any subject. Use them to look like a presentation pro.
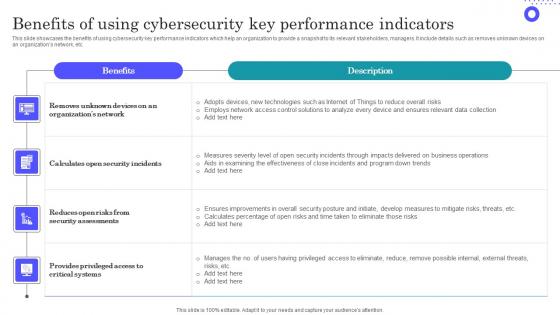
Benefits Of Using Cybersecurity Key Performance Indicators Slides Pdf
Showcasing this set of slides titled Benefits Of Using Cybersecurity Key Performance Indicators Slides Pdf The topics addressed in these templates are Organizations Network, Security Assessments, Provides Privileged All the content presented in this PPT design is completely editable. Download it and make adjustments in color, background, font etc. as per your unique business setting. This slide showcases the benefits of using cybersecurity key performance indicators which help an organization to provide a snapshot to its relevant stakeholders, managers. It include details such as removes unknown devices on an organizations network, etc.
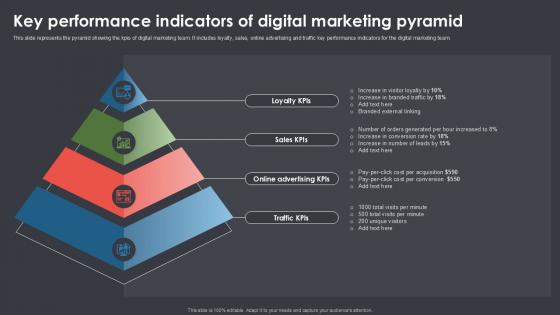
Key Performance Indicators Of Digital Marketing Pyramid Ppt Presentation SS
The following slide showcases green business management with triple bottom line method. It provides information about people, planet, profits, ambitions, commitments, enablers, etc Welcome to our selection of the Key Performance Indicators Of Digital Marketing Pyramid Ppt Presentation SS These are designed to help you showcase your creativity and bring your sphere to life. Planning and Innovation are essential for any business that is just starting out. This collection contains the designs that you need for your everyday presentations. All of our PowerPoints are 100Percent editable, so you can customize them to suit your needs. This multi-purpose template can be used in various situations. Grab these presentation templates today. The following slide showcases green business management with triple bottom line method. It provides information about people, planet, profits, ambitions, commitments, enablers, etc

Research Effectivenes Psychotherapy Indicates In Powerpoint And Google Slides Cpb
Presenting our innovatively-designed set of slides titled Research Effectivenes Psychotherapy Indicates In Powerpoint And Google Slides Cpb. This completely editable PowerPoint graphic exhibits Research Effectivenes Psychotherapy Indicates that will help you convey the message impactfully. It can be accessed with Google Slides and is available in both standard screen and widescreen aspect ratios. Apart from this, you can download this well-structured PowerPoint template design in different formats like PDF, JPG, and PNG. So, click the download button now to gain full access to this PPT design. Our Research Effectivenes Psychotherapy Indicates In Powerpoint And Google Slides Cpb are topically designed to provide an attractive backdrop to any subject. Use them to look like a presentation pro.
True Price Action Indicator In Powerpoint And Google Slides Cpb
Introducing our well-designed True Price Action Indicator In Powerpoint And Google Slides Cpb. This PowerPoint design presents information on topics like True Price Action Indicator. As it is predesigned it helps boost your confidence level. It also makes you a better presenter because of its high-quality content and graphics. This PPT layout can be downloaded and used in different formats like PDF, PNG, and JPG. Not only this, it is available in both Standard Screen and Widescreen aspect ratios for your convenience. Therefore, click on the download button now to persuade and impress your audience. Our True Price Action Indicator In Powerpoint And Google Slides Cpb are topically designed to provide an attractive backdrop to any subject. Use them to look like a presentation pro.
Vitamin K Indication In Powerpoint And Google Slides Cpb
Introducing our well designed Vitamin K Indication In Powerpoint And Google Slides Cpb This PowerPoint design presents information on topics like Vitamin K Indication As it is predesigned it helps boost your confidence level. It also makes you a better presenter because of its high quality content and graphics. This PPT layout can be downloaded and used in different formats like PDF, PNG, and JPG. Not only this, it is available in both Standard Screen and Widescreen aspect ratios for your convenience. Therefore, click on the download button now to persuade and impress your audience. Our Vitamin K Indication In Powerpoint And Google Slides Cpb are topically designed to provide an attractive backdrop to any subject. Use them to look like a presentation pro.

Leakage Indicator In Powerpoint And Google Slides Cpb
Introducing our well designed Leakage Indicator In Powerpoint And Google Slides Cpb. This PowerPoint design presents information on topics like Leakage Indicator. As it is predesigned it helps boost your confidence level. It also makes you a better presenter because of its high quality content and graphics. This PPT layout can be downloaded and used in different formats like PDF, PNG, and JPG. Not only this, it is available in both Standard Screen and Widescreen aspect ratios for your convenience. Therefore, click on the download button now to persuade and impress your audience. Our Leakage Indicator In Powerpoint And Google Slides Cpb are topically designed to provide an attractive backdrop to any subject. Use them to look like a presentation pro.
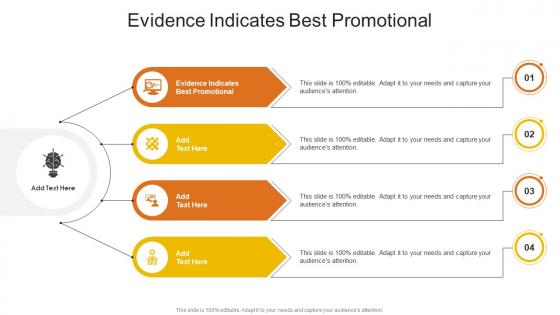
Evidence Indicates Best Promotional In Powerpoint And Google Slides Cpb
Introducing our well designed Evidence Indicates Best Promotional In Powerpoint And Google Slides Cpb. This PowerPoint design presents information on topics like Evidence Indicates Best Promotional. As it is predesigned it helps boost your confidence level. It also makes you a better presenter because of its high quality content and graphics. This PPT layout can be downloaded and used in different formats like PDF, PNG, and JPG. Not only this, it is available in both Standard Screen and Widescreen aspect ratios for your convenience. Therefore, click on the download button now to persuade and impress your audience. Our Evidence Indicates Best Promotional In Powerpoint And Google Slides Cpb are topically designed to provide an attractive backdrop to any subject. Use them to look like a presentation pro.
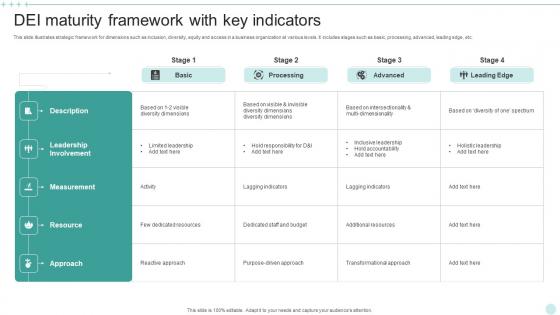
DEI Maturity Framework With Key Indicators Ideas Pdf
This slide illustrates strategic framework for dimensions such as inclusion, diversity, equity and access in a business organization at various levels. It includes stages such as basic, processing, advanced, leading edge, etc. Showcasing this set of slides titled DEI Maturity Framework With Key Indicators Ideas Pdf. The topics addressed in these templates are Leadership Involvement, Measurement, Holistic Leadership, Maturity Framework. All the content presented in this PPT design is completely editable. Download it and make adjustments in color, background, font etc. as per your unique business setting. This slide illustrates strategic framework for dimensions such as inclusion, diversity, equity and access in a business organization at various levels. It includes stages such as basic, processing, advanced, leading edge, etc.
Critical Business Indicators Success Elementary In Powerpoint And Google Slides Cpb
Introducing our well-designed Critical Business Indicators Success Elementary In Powerpoint And Google Slides Cpb. This PowerPoint design presents information on topics like Critical Business Indicators Success Elementary. As it is predesigned it helps boost your confidence level. It also makes you a better presenter because of its high-quality content and graphics. This PPT layout can be downloaded and used in different formats like PDF, PNG, and JPG. Not only this, it is available in both Standard Screen and Widescreen aspect ratios for your convenience. Therefore, click on the download button now to persuade and impress your audience. Our Critical Business Indicators Success Elementary In Powerpoint And Google Slides Cpb are topically designed to provide an attractive backdrop to any subject. Use them to look like a presentation pro.
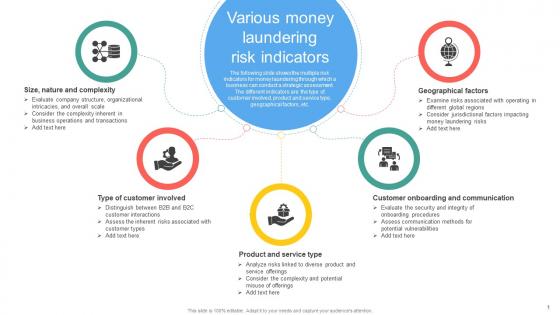
Various Money Laundering Risk Indicators Mapping Out The Anti Money Fin SS V
The following slide shows the multiple risk indicators for money laundering through which a business can conduct a strategic assessment. The different indicators are the type of customer involved, product and service type, geographical factors, etc. Find highly impressive Various Money Laundering Risk Indicators Mapping Out The Anti Money Fin SS V on Slidegeeks to deliver a meaningful presentation. You can save an ample amount of time using these presentation templates. No need to worry to prepare everything from scratch because Slidegeeks experts have already done a huge research and work for you. You need to download Various Money Laundering Risk Indicators Mapping Out The Anti Money Fin SS V for your upcoming presentation. All the presentation templates are 100 percent editable and you can change the color and personalize the content accordingly. Download now The following slide shows the multiple risk indicators for money laundering through which a business can conduct a strategic assessment. The different indicators are the type of customer involved, product and service type, geographical factors, etc.
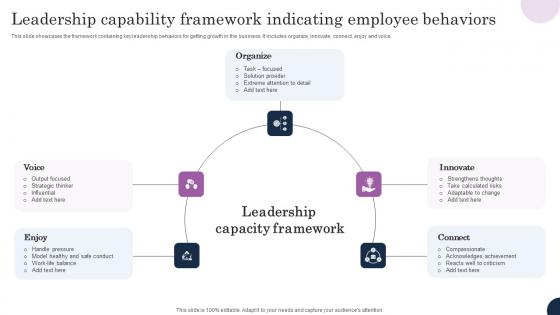
Leadership Capability Framework Indicating Employee Behaviors Mockup Pdf
This slide showcases the framework containing key leadership behaviors for getting growth in the business. It includes organize, innovate, connect, enjoy and voice. Showcasing this set of slides titled Leadership Capability Framework Indicating Employee Behaviors Mockup Pdf The topics addressed in these templates are Handle Pressure, Output Focused, Extreme Attention All the content presented in this PPT design is completely editable. Download it and make adjustments in color, background, font etc. as per your unique business setting. This slide showcases the framework containing key leadership behaviors for getting growth in the business. It includes organize, innovate, connect, enjoy and voice.
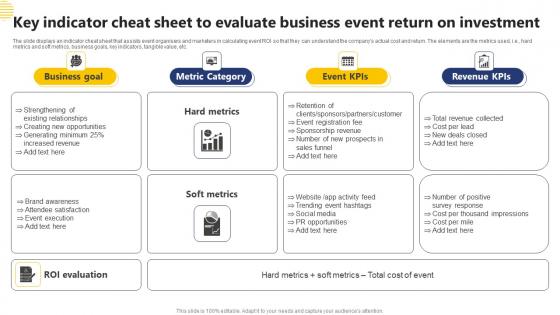
Key Indicator Cheat Sheet To Evaluate Business Event Return On Investment Template Pdf
The slide displays an indicator cheat sheet that assists event organisers and marketers in calculating event ROI so that they can understand the companys actual cost and return. The elements are the metrics used, i.e., hard metrics and soft metrics, business goals, key indicators, tangible value, etc. Showcasing this set of slides titled Key Indicator Cheat Sheet To Evaluate Business Event Return On Investment Template Pdf The topics addressed in these templates are Business Goal, Metric Category, Revenue KPIS All the content presented in this PPT design is completely editable. Download it and make adjustments in color, background, font etc. as per your unique business setting. The slide displays an indicator cheat sheet that assists event organisers and marketers in calculating event ROI so that they can understand the companys actual cost and return. The elements are the metrics used, i.e., hard metrics and soft metrics, business goals, key indicators, tangible value, etc.
Synchronized Cardioversion Indications In Powerpoint And Google Slides Cpb
Introducing our well designed Synchronized Cardioversion Indications In Powerpoint And Google Slides Cpb. This PowerPoint design presents information on topics like Synchronized Cardioversion Indications. As it is predesigned it helps boost your confidence level. It also makes you a better presenter because of its high-quality content and graphics. This PPT layout can be downloaded and used in different formats like PDF, PNG, and JPG. Not only this, it is available in both Standard Screen and Widescreen aspect ratios for your convenience. Therefore, click on the download button now to persuade and impress your audience. Our Synchronized Cardioversion Indications In Powerpoint And Google Slides Cpb are topically designed to provide an attractive backdrop to any subject. Use them to look like a presentation pro.
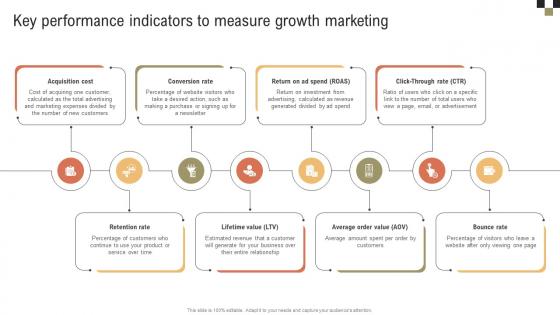
A Comprehensive Guide On Growth Key Performance Indicators To Measure Growth MKT SS V
Get a simple yet stunning designed A Comprehensive Guide On Growth Key Performance Indicators To Measure Growth MKT SS V. It is the best one to establish the tone in your meetings. It is an excellent way to make your presentations highly effective. So, download this PPT today from Slidegeeks and see the positive impacts. Our easy-to-edit A Comprehensive Guide On Growth Key Performance Indicators To Measure Growth MKT SS V can be your go-to option for all upcoming conferences and meetings. So, what are you waiting for Grab this template today. Our A Comprehensive Guide On Growth Key Performance Indicators To Measure Growth MKT SS V are topically designed to provide an attractive backdrop to any subject. Use them to look like a presentation pro.
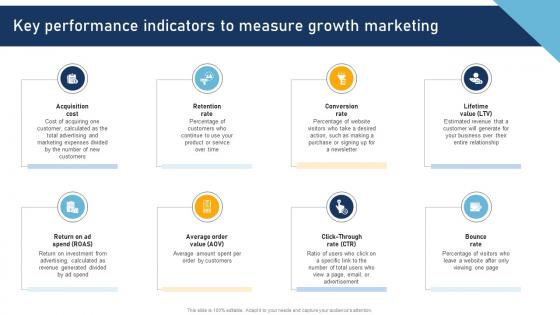
A Comprehensive Approach To Key Performance Indicators To Measure Growth MKT SS V
Whether you have daily or monthly meetings, a brilliant presentation is necessary. A Comprehensive Approach To Key Performance Indicators To Measure Growth MKT SS V can be your best option for delivering a presentation. Represent everything in detail using A Comprehensive Approach To Key Performance Indicators To Measure Growth MKT SS V and make yourself stand out in meetings. The template is versatile and follows a structure that will cater to your requirements. All the templates prepared by Slidegeeks are easy to download and edit. Our research experts have taken care of the corporate themes as well. So, give it a try and see the results. Our A Comprehensive Approach To Key Performance Indicators To Measure Growth MKT SS V are topically designed to provide an attractive backdrop to any subject. Use them to look like a presentation pro.

Steps To Calculate Inflation Using Asset Price Indices Strategies For Inflation A Tactical Guide Fin SS V
This slide shows step by step process which can be used to calculate inflation rate by using asset price indices. It includes stages such as select year, identify assets,, collect price data and interpret results. From laying roadmaps to briefing everything in detail, our templates are perfect for you. You can set the stage with your presentation slides. All you have to do is download these easy-to-edit and customizable templates. Steps To Calculate Inflation Using Asset Price Indices Strategies For Inflation A Tactical Guide Fin SS V will help you deliver an outstanding performance that everyone would remember and praise you for. Do download this presentation today. This slide shows step by step process which can be used to calculate inflation rate by using asset price indices. It includes stages such as select year, identify assets,, collect price data and interpret results.
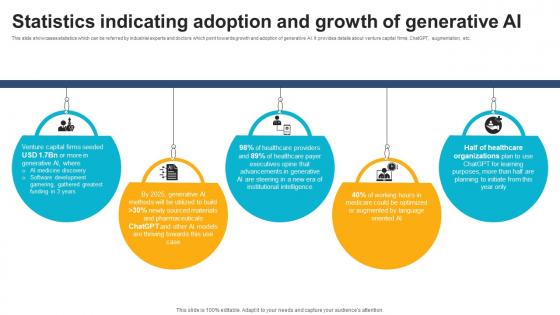
Statistics Indicating Adoption And Growth Of Generative ChatGPT And Healthcare Innovation Enhancing AI SS V
This slide showcases statistics which can be referred by industrial experts and doctors which point towards growth and adoption of generative AI. It provides details about venture capital firms, ChatGPT, augmentation, etc. Here you can discover an assortment of the finest PowerPoint and Google Slides templates. With these templates, you can create presentations for a variety of purposes while simultaneously providing your audience with an eye-catching visual experience. Download Statistics Indicating Adoption And Growth Of Generative ChatGPT And Healthcare Innovation Enhancing AI SS V to deliver an impeccable presentation. These templates will make your job of preparing presentations much quicker, yet still, maintain a high level of quality. Slidegeeks has experienced researchers who prepare these templates and write high-quality content for you. Later on, you can personalize the content by editing the Statistics Indicating Adoption And Growth Of Generative ChatGPT And Healthcare Innovation Enhancing AI SS V. This slide showcases statistics which can be referred by industrial experts and doctors which point towards growth and adoption of generative AI. It provides details about venture capital firms, ChatGPT, augmentation, etc.
Key Indicator Dashboard Of Vertical Channel Marketing Software Ppt Icon Templates Pdf
This slide showcases the key indicators for vertical channel marketing software. This further includes reach, engagement and conversion data along with geography and industry. Showcasing this set of slides titled Key Indicator Dashboard Of Vertical Channel Marketing Software Ppt Icon Templates Pdf. The topics addressed in these templates are Reach, Engagement, Conversion. All the content presented in this PPT design is completely editable. Download it and make adjustments in color, background, font etc. as per your unique business setting. This slide showcases the key indicators for vertical channel marketing software. This further includes reach, engagement and conversion data along with geography and industry.
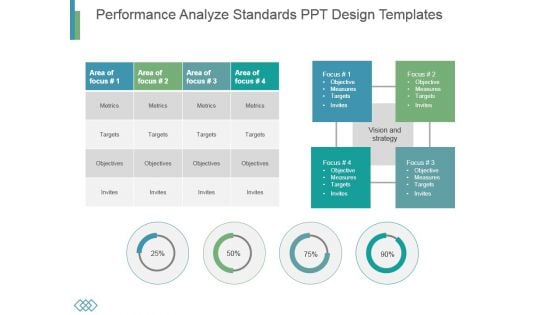
Performance Analyze Standards Ppt Design Templates
This is a performance analyze standards ppt design templates. This is a four stage process. The stages in this process are metrics, targets, objectives, invites.
Measurement Gauge Vector Icon Ppt PowerPoint Presentation File Infographics PDF
Presenting this set of slides with name measurement gauge vector icon ppt powerpoint presentation file infographics pdf. This is a three stage process. The stages in this process are measurement gauge vector icon. This is a completely editable PowerPoint presentation and is available for immediate download. Download now and impress your audience.
Amnioinfusion Indications Function In Powerpoint And Google Slides Cpb
Presenting our innovatively-designed set of slides titled Amnioinfusion Indications Function In Powerpoint And Google Slides Cpb. This completely editable PowerPoint graphic exhibits Amnioinfusion Indications Function that will help you convey the message impactfully. It can be accessed with Google Slides and is available in both standard screen and widescreen aspect ratios. Apart from this, you can download this well-structured PowerPoint template design in different formats like PDF, JPG, and PNG. So, click the download button now to gain full access to this PPT design. Our Amnioinfusion Indications Function In Powerpoint And Google Slides Cpb are topically designed to provide an attractive backdrop to any subject. Use them to look like a presentation pro.
Spironolactone Indications In Powerpoint And Google Slides Cpb
Presenting our innovatively designed set of slides titled Spironolactone Indications In Powerpoint And Google Slides Cpb. This completely editable PowerPoint graphic exhibits Spironolactone Indications that will help you convey the message impactfully. It can be accessed with Google Slides and is available in both standard screen and widescreen aspect ratios. Apart from this, you can download this well structured PowerPoint template design in different formats like PDF, JPG, and PNG. So, click the download button now to gain full access to this PPT design. Our Spironolactone Indications In Powerpoint And Google Slides Cpb are topically designed to provide an attractive backdrop to any subject. Use them to look like a presentation pro.
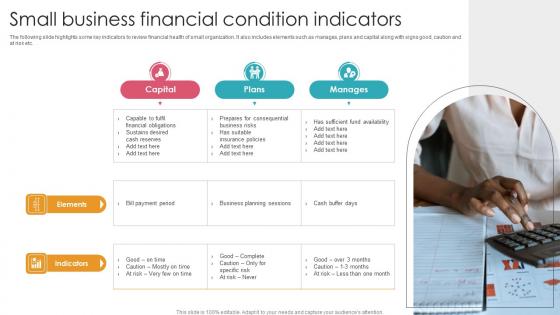
Small Business Financial Condition Indicators Themes Pdf
The following slide highlights some key indicators to review financial health of small organization. It also includes elements such as manages, plans and capital along with signs good, caution and at risk etc. Showcasing this set of slides titled Small Business Financial Condition Indicators Themes Pdf. The topics addressed in these templates are Elements, Indicators, Sustains Desired Cash Reserves. All the content presented in this PPT design is completely editable. Download it and make adjustments in color, background, font etc. as per your unique business setting. The following slide highlights some key indicators to review financial health of small organization. It also includes elements such as manages, plans and capital along with signs good, caution and at risk etc.

Haloperidol Indications In Powerpoint And Google Slides Cpb
Introducing our well-designed Haloperidol Indications In Powerpoint And Google Slides Cpb. This PowerPoint design presents information on topics like Haloperidol Indications. As it is predesigned it helps boost your confidence level. It also makes you a better presenter because of its high-quality content and graphics. This PPT layout can be downloaded and used in different formats like PDF, PNG, and JPG. Not only this, it is available in both Standard Screen and Widescreen aspect ratios for your convenience. Therefore, click on the download button now to persuade and impress your audience. Our Haloperidol Indications In Powerpoint And Google Slides Cpb are topically designed to provide an attractive backdrop to any subject. Use them to look like a presentation pro.

Key Performance Indicators Of IBN Outsourcing Company PPT Presentation SS
The slide shows the key Performance Indicator KPIs which will help the company to track the success rate of implemented strategies. Some of the KPIs are Customer Attrition Rate, Product, Service Adoption Rate, Average Customer Queue Time , Customer Satisfaction Rate etc. Are you in need of a template that can accommodate all of your creative concepts This one is crafted professionally and can be altered to fit any style. Use it with Google Slides or PowerPoint. Include striking photographs, symbols, depictions, and other visuals. Fill, move around, or remove text boxes as desired. Test out color palettes and font mixtures. Edit and save your work, or work with colleagues. Download Key Performance Indicators Of IBN Outsourcing Company PPT Presentation SS and observe how to make your presentation outstanding. Give an impeccable presentation to your group and make your presentation unforgettable. The slide shows the key Performance Indicator KPIs which will help the company to track the success rate of implemented strategies. Some of the KPIs are Customer Attrition Rate, Product, Service Adoption Rate, Average Customer Queue Time , Customer Satisfaction Rate etc.
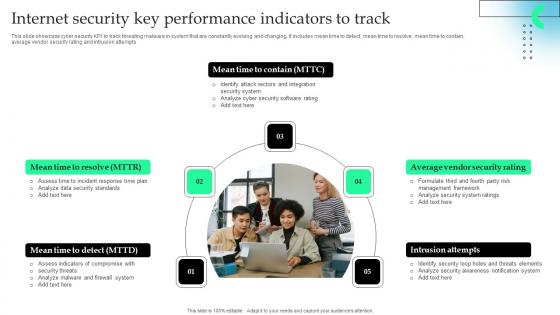
Internet Security Key Performance Indicators To Track Microsoft Pdf
This slide showcase cyber security KPI to track threating malware in system that are constantly evolving and changing. It includes mean time to detect, mean time to resolve, mean time to contain, average vendor security rating and intrusion attempts.Showcasing this set of slides titled Internet Security Key Performance Indicators To Track Microsoft Pdf The topics addressed in these templates are Firewall System, Security Standards, Identify Attack All the content presented in this PPT design is completely editable. Download it and make adjustments in color, background, font etc. as per your unique business setting. This slide showcase cyber security KPI to track threating malware in system that are constantly evolving and changing. It includes mean time to detect, mean time to resolve, mean time to contain, average vendor security rating and intrusion attempts.
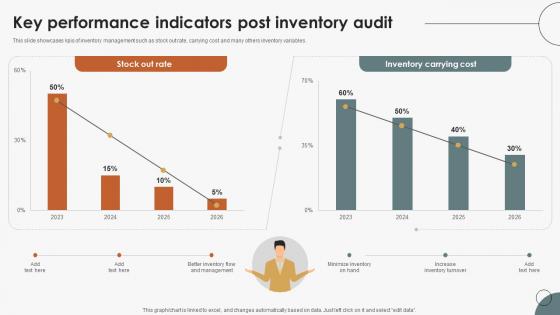
Boosting Efficiency In Inventory Key Performance Indicators Post Inventory Audit
This slide showcases kpis of inventory management such as stock out rate, carrying cost and many others inventory variables. Make sure to capture your audiences attention in your business displays with our gratis customizable Boosting Efficiency In Inventory Key Performance Indicators Post Inventory Audit. These are great for business strategies, office conferences, capital raising or task suggestions. If you desire to acquire more customers for your tech business and ensure they stay satisfied, create your own sales presentation with these plain slides. This slide showcases kpis of inventory management such as stock out rate, carrying cost and many others inventory variables.
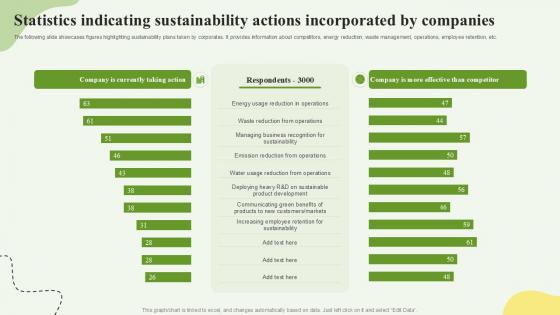
Statistics Indicating Sustainability Actions Incorporated By Companies Ppt Example SS
This slide represents the pyramid showing the performance of the human resource department of an organization. It includes details related to recruitment and selection, talent management, leadership capability, performance culture and strategic advantage. There are so many reasons you need a Statistics Indicating Sustainability Actions Incorporated By Companies Ppt Example SS The first reason is you can not spend time making everything from scratch, Thus, Slidegeeks has made presentation templates for you too. You can easily download these templates from our website easily. This slide represents the pyramid showing the performance of the human resource department of an organization. It includes details related to recruitment and selection, talent management, leadership capability, performance culture and strategic advantage.
Time Gauge For Work In Progress Vector Icon Ppt Professional Graphic Tips PDF
Persuade your audience using this time gauge for work in progress vector icon ppt professional graphic tips pdf. This PPT design covers three stages, thus making it a great tool to use. It also caters to a variety of topics including time gauge for work in progress vector icon. Download this PPT design now to present a convincing pitch that not only emphasizes the topic but also showcases your presentation skills.

Import And Export Price Indices To Calculate Strategies For Inflation A Tactical Guide Fin SS V
This slide shows step by step process which can be used to calculate inflation rate by using import and export price indices. It includes stages such as select year, collect data, calculate export and import price index and interpret results. This Import And Export Price Indices To Calculate Strategies For Inflation A Tactical Guide Fin SS V is perfect for any presentation, be it in front of clients or colleagues. It is a versatile and stylish solution for organizing your meetings. The Import And Export Price Indices To Calculate Strategies For Inflation A Tactical Guide Fin SS V features a modern design for your presentation meetings. The adjustable and customizable slides provide unlimited possibilities for acing up your presentation. Slidegeeks has done all the homework before launching the product for you. So, do not wait, grab the presentation templates today This slide shows step by step process which can be used to calculate inflation rate by using import and export price indices. It includes stages such as select year, collect data, calculate export and import price index and interpret results.
Fuel Indicator Vector Icons Ppt PowerPoint Presentation File Example File
This is a fuel indicator vector icons ppt powerpoint presentation file example file. This is a three stage process. The stages in this process are fuel gauge, gas gauge, fuel containers.
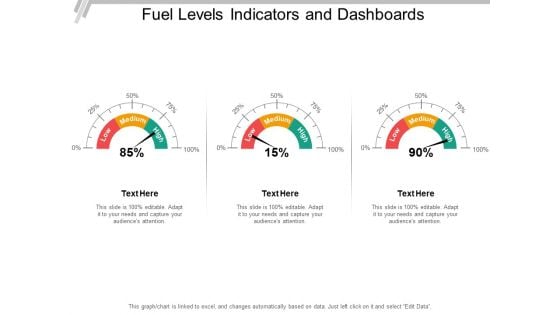
Fuel Levels Indicators And Dashboards Ppt PowerPoint Presentation Outline Skills
This is a fuel levels indicators and dashboards ppt powerpoint presentation outline skills. This is a three stage process. The stages in this process are fuel gauge, gas gauge, fuel containers.
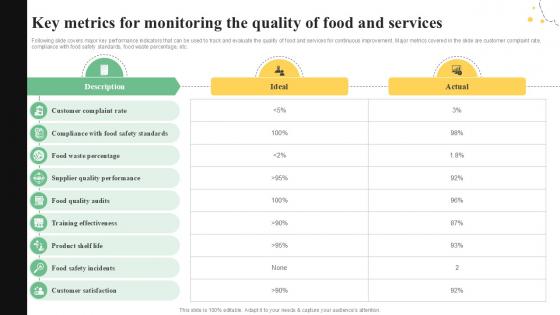
Key Metrics For Monitoring The Quality Control Guide For Food PPT Slide
Following slide covers major key performance indicators that can be used to track and evaluate the quality of food and services for continuous improvement. Major metrics covered in the slide are customer complaint rate, compliance with food safety standards, food waste percentage, etc. Explore a selection of the finest Key Metrics For Monitoring The Quality Control Guide For Food PPT Slide here. With a plethora of professionally designed and pre-made slide templates, you can quickly and easily find the right one for your upcoming presentation. You can use our Key Metrics For Monitoring The Quality Control Guide For Food PPT Slide to effectively convey your message to a wider audience. Slidegeeks has done a lot of research before preparing these presentation templates. The content can be personalized and the slides are highly editable. Grab templates today from Slidegeeks. Following slide covers major key performance indicators that can be used to track and evaluate the quality of food and services for continuous improvement. Major metrics covered in the slide are customer complaint rate, compliance with food safety standards, food waste percentage, etc.
Indications Liver Transplant In Powerpoint And Google Slides Cpb
Introducing our well designed Indications Liver Transplant In Powerpoint And Google Slides Cpb. This PowerPoint design presents information on topics like Indications Liver Transplant. As it is predesigned it helps boost your confidence level. It also makes you a better presenter because of its high quality content and graphics. This PPT layout can be downloaded and used in different formats like PDF, PNG, and JPG. Not only this, it is available in both Standard Screen and Widescreen aspect ratios for your convenience. Therefore, click on the download button now to persuade and impress your audience. Our Indications Liver Transplant In Powerpoint And Google Slides Cpb are topically designed to provide an attractive backdrop to any subject. Use them to look like a presentation pro.
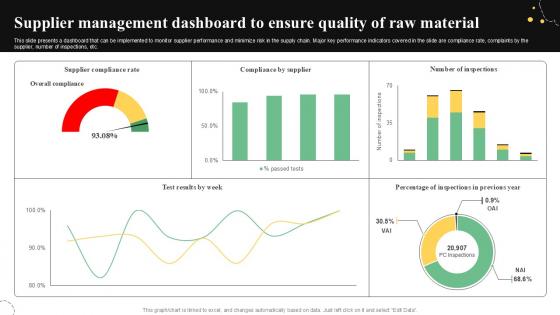
Supplier Management Dashboard Quality Control Guide For Food PPT Sample
This slide presents a dashboard that can be implemented to monitor supplier performance and minimize risk in the supply chain. Major key performance indicators covered in the slide are compliance rate, complaints by the supplier, number of inspections, etc. Present like a pro with Supplier Management Dashboard Quality Control Guide For Food PPT Sample. Create beautiful presentations together with your team, using our easy-to-use presentation slides. Share your ideas in real-time and make changes on the fly by downloading our templates. So whether you are in the office, on the go, or in a remote location, you can stay in sync with your team and present your ideas with confidence. With Slidegeeks presentation got a whole lot easier. Grab these presentations today. This slide presents a dashboard that can be implemented to monitor supplier performance and minimize risk in the supply chain. Major key performance indicators covered in the slide are compliance rate, complaints by the supplier, number of inspections, etc.
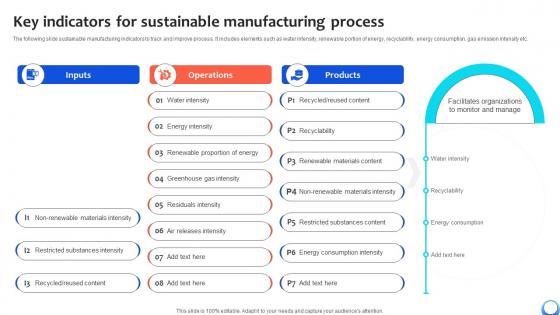
Key Indicators For Sustainable Manufacturing Automating Production Process Strategy SS V
The following slide sustainable manufacturing indicators to track and improve process. It includes elements such as water intensity, renewable portion of energy, recyclability, energy consumption, gas emission intensity etc. Presenting this PowerPoint presentation, titled Key Indicators For Sustainable Manufacturing Automating Production Process Strategy SS V, with topics curated by our researchers after extensive research. This editable presentation is available for immediate download and provides attractive features when used. Download now and captivate your audience. Presenting this Key Indicators For Sustainable Manufacturing Automating Production Process Strategy SS V. Our researchers have carefully researched and created these slides with all aspects taken into consideration. This is a completely customizable Key Indicators For Sustainable Manufacturing Automating Production Process Strategy SS V that is available for immediate downloading. Download now and make an impact on your audience. Highlight the attractive features available with our PPTs. The following slide sustainable manufacturing indicators to track and improve process. It includes elements such as water intensity, renewable portion of energy, recyclability, energy consumption, gas emission intensity etc.
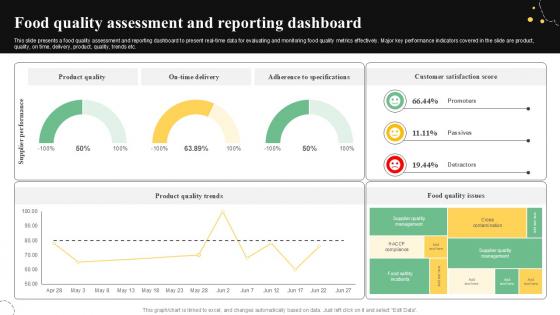
Food Quality Assessment And Reporting Quality Control Guide For Food PPT Sample
This slide presents a food quality assessment and reporting dashboard to present real-time data for evaluating and monitoring food quality metrics effectively. Major key performance indicators covered in the slide are product, quality, on time, delivery, product, quality, trends etc. Crafting an eye-catching presentation has never been more straightforward. Let your presentation shine with this tasteful yet straightforward Food Quality Assessment And Reporting Quality Control Guide For Food PPT Sample template. It offers a minimalistic and classy look that is great for making a statement. The colors have been employed intelligently to add a bit of playfulness while still remaining professional. Construct the ideal Food Quality Assessment And Reporting Quality Control Guide For Food PPT Sample that effortlessly grabs the attention of your audience Begin now and be certain to wow your customers This slide presents a food quality assessment and reporting dashboard to present real-time data for evaluating and monitoring food quality metrics effectively. Major key performance indicators covered in the slide are product, quality, on time, delivery, product, quality, trends etc.
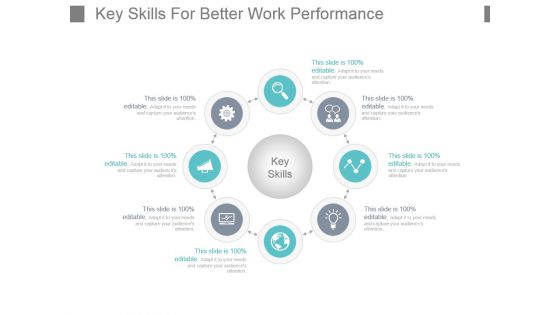
Key Skills For Better Work Performance Powerpoint Shapes
This is a key skills for better work performance powerpoint shapes. This is a four stage process. The stages in this process are key skills, flow, process, circle, icons.
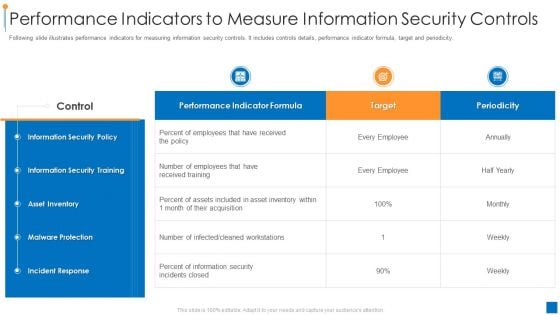
International Organization Standardization 270001 Performance Indicators To Measure Information Security Controls Clipart PDF
Following slide illustrates performance indicators for measuring information security controls. It includes controls details, performance indicator formula, target and periodicity. Deliver and pitch your topic in the best possible manner with this international organization standardization 270001 performance indicators to measure information security controls clipart pdf. Use them to share invaluable insights on information security policy, information security training, incident response and impress your audience. This template can be altered and modified as per your expectations. So, grab it now.
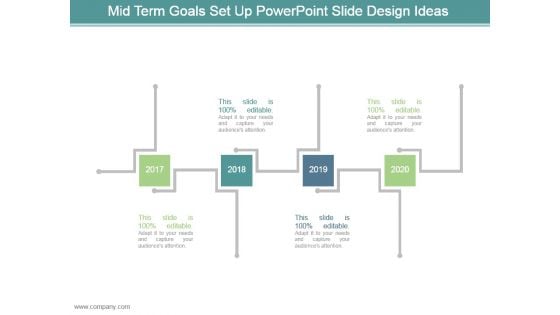
Mid Term Goals Set Up Powerpoint Slide Design Ideas
This is a mid term goals set up powerpoint slide design ideas. This is a four stage process. The stages in this process are arrows, business, marketing, planning, years.
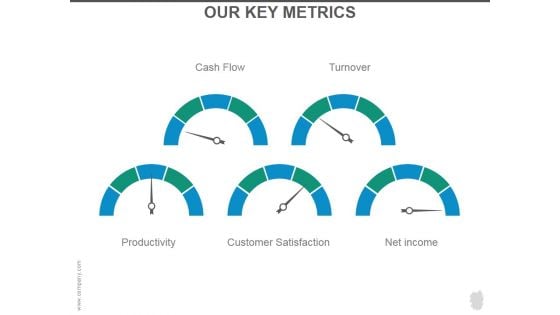
Our Key Metrics Ppt PowerPoint Presentation Portfolio
This is a our key metrics ppt powerpoint presentation portfolio. This is a five stage process. The stages in this process are cash flow, turnover, productivity, customer satisfaction, net income.
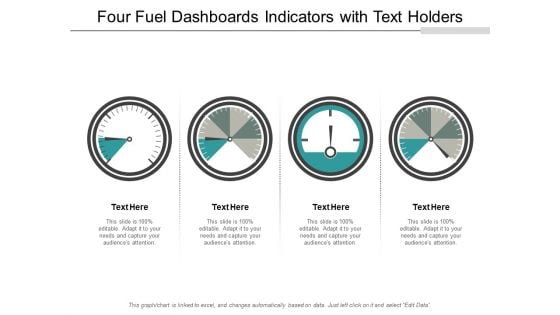
Four Fuel Dashboards Indicators With Text Holders Ppt PowerPoint Presentation File Graphics Design
This is a four fuel dashboards indicators with text holders ppt powerpoint presentation file graphics design. This is a four stage process. The stages in this process are fuel gauge, gas gauge, fuel containers.


 Continue with Email

 Home
Home


